Article

Precious and Base Metal Minerals in Black Sands of the Egyptian Mediterranean Coast: Mineralogical and Geochemical Attributes

by
Abdel-Aal M. Abdel-Karim
1 and
Ahmed Gad
2,*
1
Geology Department, Faculty of Science, Zagazig University, Zagazig 44519, Egypt
2
Geology Department, Faculty of Science, Ain Shams University, Cairo 11566, Egypt
*
Author to whom correspondence should be addressed.
Resources 2024, 13(8), 109; https://doi.org/10.3390/resources13080109 (registering DOI)
Submission received: 2 July 2024 / Revised: 29 July 2024 / Accepted: 6 August 2024 / Published: 9 August 2024
(This article belongs to the Special Issue Mineral Resource Management 2023: Assessment, Mining and Processing)

Abstract

:
This paper investigates the mineralogical and geochemical characteristics, as well as the possible sources, of gold, silver, platinum group elements (PGE), copper, and lead found in the beach sands along Egypt’s Mediterranean coast. Using scanning electron microscopy and electron probe micro-analysis, this study determines the morphology and micro-chemistry of separated grains to assess their economic potential and how various minerals respond to different transport distances. The analysis reveals that gold grains are of high purity (94.11 to 98.55 wt.%; average 96 wt.% Au) and are alloyed with Ag (1.28–2.32 wt.%) and Cu (0.16–3.15 wt.%). Two types of gold grains were identified, indicating differences in transport distances. Variations in morphology, surface features, inclusion types, rims, and chemistry of the native metals, including gold grains, suggest differences in composition, weathering degree, transport distance, deposit types, and host rocks. The average Ag concentration in gold grains (1.86 wt.%) suggests a link to mesothermal or supergene deposits. Most silver, copper, and lead grains are spherical, with some variations in shape. Silver grains have 71.66–95.34 wt.% Ag (avg. 82.67 wt.%). Copper grains have 92.54–98.42 wt.% Cu (avg. 94.22 wt.%). Lead grains contain 74.22–84.45 wt.% Pb (avg. 79.26 wt.%). The identified platinum group minerals (PGM) belong to the Pt–Fe alloys and sperrylite, both of which are PPGE-bearing minerals. These metals likely originate from the weathering of upstream Nile tributaries surrounded by igneous and metamorphic rocks from Ethiopian and Central African regions, with a minor contribution from the Egyptian Eastern Desert Mountains.

1. Introduction

Coastal regions are significant for black sand deposit exploration worldwide because of their high concentration of strategic minerals [1]. Black sand deposits, also known as heavy-mineral placer sands, are a type of placer deposit that contain a high concentration of heavy minerals such as magnetite, ilmenite, zircon, garnet, rutile, cassiterite, and monazite [1,2,3,4]. These deposits are typically found in beach environments, where they are formed through the sorting and concentration of heavy minerals by wave and current activity [3,4]. These deposits are often found in Pliocene to Holocene unconsolidated, siliciclastic sands of marine–aeolian origin [1]. The provenance of these minerals is often from igneous–metamorphic rocks [2,3,4]. The mineralogical composition of black sands is crucial as it directly influences the geochemical characteristics and overall economic viability of the deposits [4]. Several studies have reported the presence of precious, base metal, and rare earth element minerals in worldwide beach placer deposits, including India [5], Bangladesh [6], Sri Lanka [7], the United States [8], Mexico [9], Ecuador [2], Greece [4,10], and Brazil [11]. These studies have shown that the mineralogical and geochemical characteristics vary significantly, based on the depositional environment, material source, and post-depositional processes [3,6,9,10,12].
Precious metals, such as gold (Au), silver (Ag), and platinum group elements (PGE), such as platinum (Pt), palladium (Pd), and rhodium (Rh), have long been valued commercially. Their use in electronics, catalysis, jewelry, and medical applications has expanded in application in recent years [13,14]. Base metals like copper (Cu) and lead (Pb) are also economically important since they are used in a range of industries, including construction, transportation, and energy. Au, Ag, PGE, Cu, and Pb can be found in a variety of mineral deposits and host rocks [15,16,17]. They are found in beach placer deposits as grains mixed with heavy minerals [18,19,20,21,22].
The morphology of placer mineral grains can indicate the source rock’s location [18,19,21,22,23,24,25]. Knight et al. [26] found that placer gold in Otego, New Zealand, came from various sources. Studying the size and shape of placer gold, silver, and PGE grains provides valuable information [8,23,24,25,27]. Nikiforova [23] used morphogenetic criteria to identify placer gold sources in Siberia. Mineralogical attributes and alloy chemistry can suggest mineralization sources [8,14,27,28,29,30]. Placer mineralogy concerns ore material sources, changes during migration, economic value, and properties of ore sands [30]. Allochthonous placers may have multiple sources, while autochthonous placers often have a single source [21,30,31].
In Egypt, the Mediterranean coast has been a focus of recent interest due to the existence of black sand deposits, which are present either as beach sediments or in the form of coastal sand dunes. These deposits are known for their substantial reserves of heavy minerals such as ilmenite, hematite, rutile, magnetite, zircon, garnet, and monazite [12,32]. The mineralogical and geochemical characteristics of these minerals in the black sands of Egypt’s Mediterranean coast have been the spotlight of many investigations over the years [33,34,35,36,37,38,39]. These studies have focused on insight into the origin, distribution, and concentration of these minerals and their economic potential. Some studies have also investigated the environmental impact of mining these minerals [12]. The black sands of Egypt’s Mediterranean coast are not simply a source of economic heavy minerals but also a promising source of precious and base metals. The presence of gold, silver, PGE, and rare earth elements (REEs) in the black sands has been reported in several studies [12,34,35,37]. The concentration of these metals in the black sands varies depending on the location and mineralogy of the sands. Abdel-Karim and El-Shafey [37] concluded that minor gold grains with traces of newly recorded minerals ferrotapiolite, cinnabar, native lead, chromite, and chevkinite are readily detectable in the separated cassiterite concentrate. Previous research found that precious and base metals’ (Au, Ag, Cu, Pb, and PGE) mineral grains are primarily associated with cassiterite mineral [12,32], but comprehensive mineralogical and micro-chemical characterization of this mineral fraction is still missing.
Because they are so variable and so dispersed in distribution, generalizing their potential source is remarkably problematic. The significant diversity of minerals recorded in recent Nile sediments is because the Nile River drains vast areas of varying lithology [40,41,42]. Most Egyptian beach deposits are derived from basement rocks of the higher reaches of the Nile River and its major tributaries. Predominantly, these black sand deposits have two types of parent rocks, the metamorphic rock of the Ethiopian plateau drained by Atbara and the Blue Nile in addition to the igneous rocks of the Equatorial plateau drained by the White Nile and its tributaries [40,41,42,43]. El-Kammar et al. [35] proposed that the cassiterite minerals originated from a muscovite–granitic source of White Nile provenance. Moustafa et al. [44] attributed the origin of gold, silver, and Pb minerals of Nile sediments to the drainage basin of the Nile at the Abyssinian plateau, where the gold occurs in typical hydrothermal deposits associated with felsic igneous intrusions. Some volcanogenic massive sulfide (VMS) deposits are known as gold deposits with different associations such as Au-Zn-Pb-Ag-Sb and Au-Cu-Bi-Co [45]. The VMS deposits are found throughout the Nubian Shield, including northern Ethiopia [46].
However, research on the mineralogical and geochemical attributes of the precious and base metal minerals found in the black sands of the Egyptian Mediterranean coast is ongoing. Understanding these characteristics is essential for environmentally responsible mining methods. Therefore, this article aims to fill the knowledge gap about the mineralogy and micro-chemical characterization of the precious and base metal minerals found in these black sand deposits. Our study aimed to address the following research questions: (i) What are the major mineral phases and their abundance in the black sands of the study area? (ii) What is the chemical composition of the precious and base metal minerals’ grains? (iii) What are the implications of the mineralogical and geochemical attributes of these minerals’ grains for their economic potential? (iv) How do different minerals respond to large- or small-scale transport? The results are expected to provide new insights into the mineral resource potential of the black sands along the Mediterranean coast of Egypt and contribute to the bigger understanding of the distribution and genesis of heavy-mineral deposits in the region.

2. Materials and Methods

2.1. Study Area

The majority of beach placer mining operations in northern Egypt have been on a small scale, except in a few locations, such as Rosetta, Abu Khashaba, El Burrullus Lake, Damietta, and El Arish (Figure 1a). Abu Khashaba (Figure 1b) is one of the most important localities in terms of strategic and economic heavy minerals, which are required for industrial exploitation in the nuclear industry as well as other metallurgical and engineering industries. The beach deposits in the Abu Khashaba area are primarily composed of fine-grained quartz sands with a high heavy minerals’ concentration. The Egyptian black sand in this area contains vast reserves of economic metals-rich heavy minerals such as ilmenite, magnetite, garnet, zircon, rutile, and monazite with subordinate cassiterite. Minor Au, Ag, Cu, Pb, and PGMs are frequently detected in the latter metal concentrate [12,32]. Recently, the Nuclear Materials Authority launched an industrial plan to exploit the black sands at Rosetta town and Abu Khashaba village. The investigated area is located on the Mediterranean Sea coast east of the Rosetta distributary mouth, northwest of El-Burullus Lake, between longitudes 30°25′48″ and 30°33′00″ E and latitudes 31°26′42″ and 31°27′18″ N (Figure 1). This area is virtually rectangular in shape, parallel to the shoreline, measuring 10 km long and 1 km wide. It is divided into northern and southern sectors by the El-Sahel drain (Figure 1b). The northern sector, particularly the nearshore area, has a high concentration of black sand. The current work focused on the southern sector, which is bounded to the north by the El-Sahel drain and to the south by an international highway. It is distinguished by its diluted homogeneous sediments that are rich in clay and organic matter.

2.2. Sampling and Mineral Separation

A total of 306 samples were collected in the coastal plain sector. The samples were taken at a depth of 1 m at the intersections of a grid pattern 200 m × 200 m (Figure 1c). The collected samples were distributed along six profiles parallel to the shoreline (A, B, C, D, E, and F). Every profile is made up of 51 samples.
The mineral separation was performed according to Abdel-Karim and El-Shafey [37] and is depicted in Figure S1. A simple flow sheet was used to concentrate heavy minerals from field samples weighing approximately 6.5 kg. The non-magnetic fraction obtained from the bulk sample treatment using the Reading cross-belt magnetic separator (Reading, Lismore, Australia) represents 6.77 wt.% of the cross-belt feed and approximately 0.26 wt.% of raw sands. It contained monazite, zircon, leucoxene, and rutile, as well as trace economic minerals (such as cassiterite, xenotime, and uranothorite) and metals (such as gold, silver, PGE, copper, and lead). The non-magnetic fraction was divided into two subfractions using a Wilfley shaking table (Wilfley, Wellingborough, UK) under the condition illustrated by Abdel-Karim and Barakat [38]. The concentrate subfraction contained zircon, rutile, and leucoxene, while the top strip subfraction contained monazite, cassiterite, trace economic minerals, and a few zircon grains. Under the same conditions, the concentrate subfractions were re-treated twice.
The two subfractions were magnetically separated using a high-intensity induced roll magnetic separator (Carpco MIH (13) 231–100, Carpco Inc., Ceres, CA, USA) to separate the top strip subfraction into a monazite concentrate (magnetic) and cassiterite and also trace minerals and zircon concentrates (non-magnetic), which were then re-treated under the same conditions to ensure the complete separation of monazite in the magnetic concentrate. On the other hand, the zircon, rutile, and leucoxene subfraction was magnetically separated into a leucoxene concentrate (magnetic) and zircon and a rutile concentrate (non-magnetic). Cassiterite, trace metals, and a zircon concentrate were electrostatically separated to separate cassiterite and trace metals as conductor fractions and zircon as non-conductor fractions. The bulk zircon and rutile concentrate was electrostatically separated to separate rutile in the conductor fraction and zircon in the non-conductor fraction. Complete separation cannot be obtained by a single stage of treatment; thus, repeated treatments of the products are usually necessary. So, four runs were carried out for conductor and non-conductor fractions to complete the separation of zircon and rutile from each other. The recovery of the total economic minerals of ore dressing techniques was 95.10 wt.%, which is considered a good recovery.

2.3. Microscopic Study and Mineral Chemistry

The different minerals of gold, silver, PGE, copper, and lead in the cassiterite subfraction were counted and estimated under a binocular stereomicroscope and transmitted polarizing light microscope. Morphological characteristics (size, shape, outline, surface, color, rim, and inclusions) of the studied grains were described, following the criteria adopted by Townley et al. [19].
The quantitative mineral chemistry was determined using an Electron Probe Micro-Analyzer (EMPA) (JXA-8900R Superprobe electron micro-analyzer, JEOL, Freising, Germany). This analysis was conducted on 25 polished mineral grains (4 each of gold, silver, PGE, copper, and lead, 2 of ochrolite, and 3 of sperrylite) at the Nevada University, Las Vegas, NV, USA. The EMPA, equipped with a lanthanum boride cathode, operated at 20 kV and 38 nA with a beam diameter of 3 µm and PC version software Probe for EMPA (https://www.probesoftware.com/, Probe Software Inc., Eugene, OR, USA). The analyzed mineral grains were assessed for major constituents such as Au, Ag, PGE, Cu, and Pb, as well as minor elements. Standards for calibration included well-characterized oxide (Fe2O3), metal (Au, Ag, Au–Ag alloys products), and chalcogenide (FeS2, ZnS, CuFeS2, PbSe). The minimum detection limits were 0.05 wt.%, except for Te (0.09), Se (0.2), Pb (0.08), Zn (0.06), S (0.08), and Sb (0.2). The ZAF correction approach for the matrix effect was used to rectify the data. More details of the EMPA analysis and ZAF correction were described by Ul-Hamid et al. [47].
The semi-quantitative mineral chemistry of these grains (4 gold, 3 silver, 6 copper, 10 lead, and 4 PGE) was also determined using an environmental scanning electron microscope (SEM) and energy dispersive spectrometer (EDS) techniques (SEM model XL 30, 3.5 nm resolution) (SEM/EDX, XL 30 ESEM, Philips Co., Amsterdam, The Netherlands). SEM/EDX analyses were conducted to examine the morphological characteristics and elemental composition of these minerals. EDX measurements were performed on carbon-coated grains at the laboratories of the Nuclear Materials Authority of Egypt. Operating conditions included low vacuum, 25 kV accelerating voltage, 25 s counting time, and imaging with a BSE detector. The EPMA primarily analyzed the central parts of the grains to compare the bulk chemical composition with the SEM-EDX data.

3. Results

3.1. Minerals of the Precious Metals
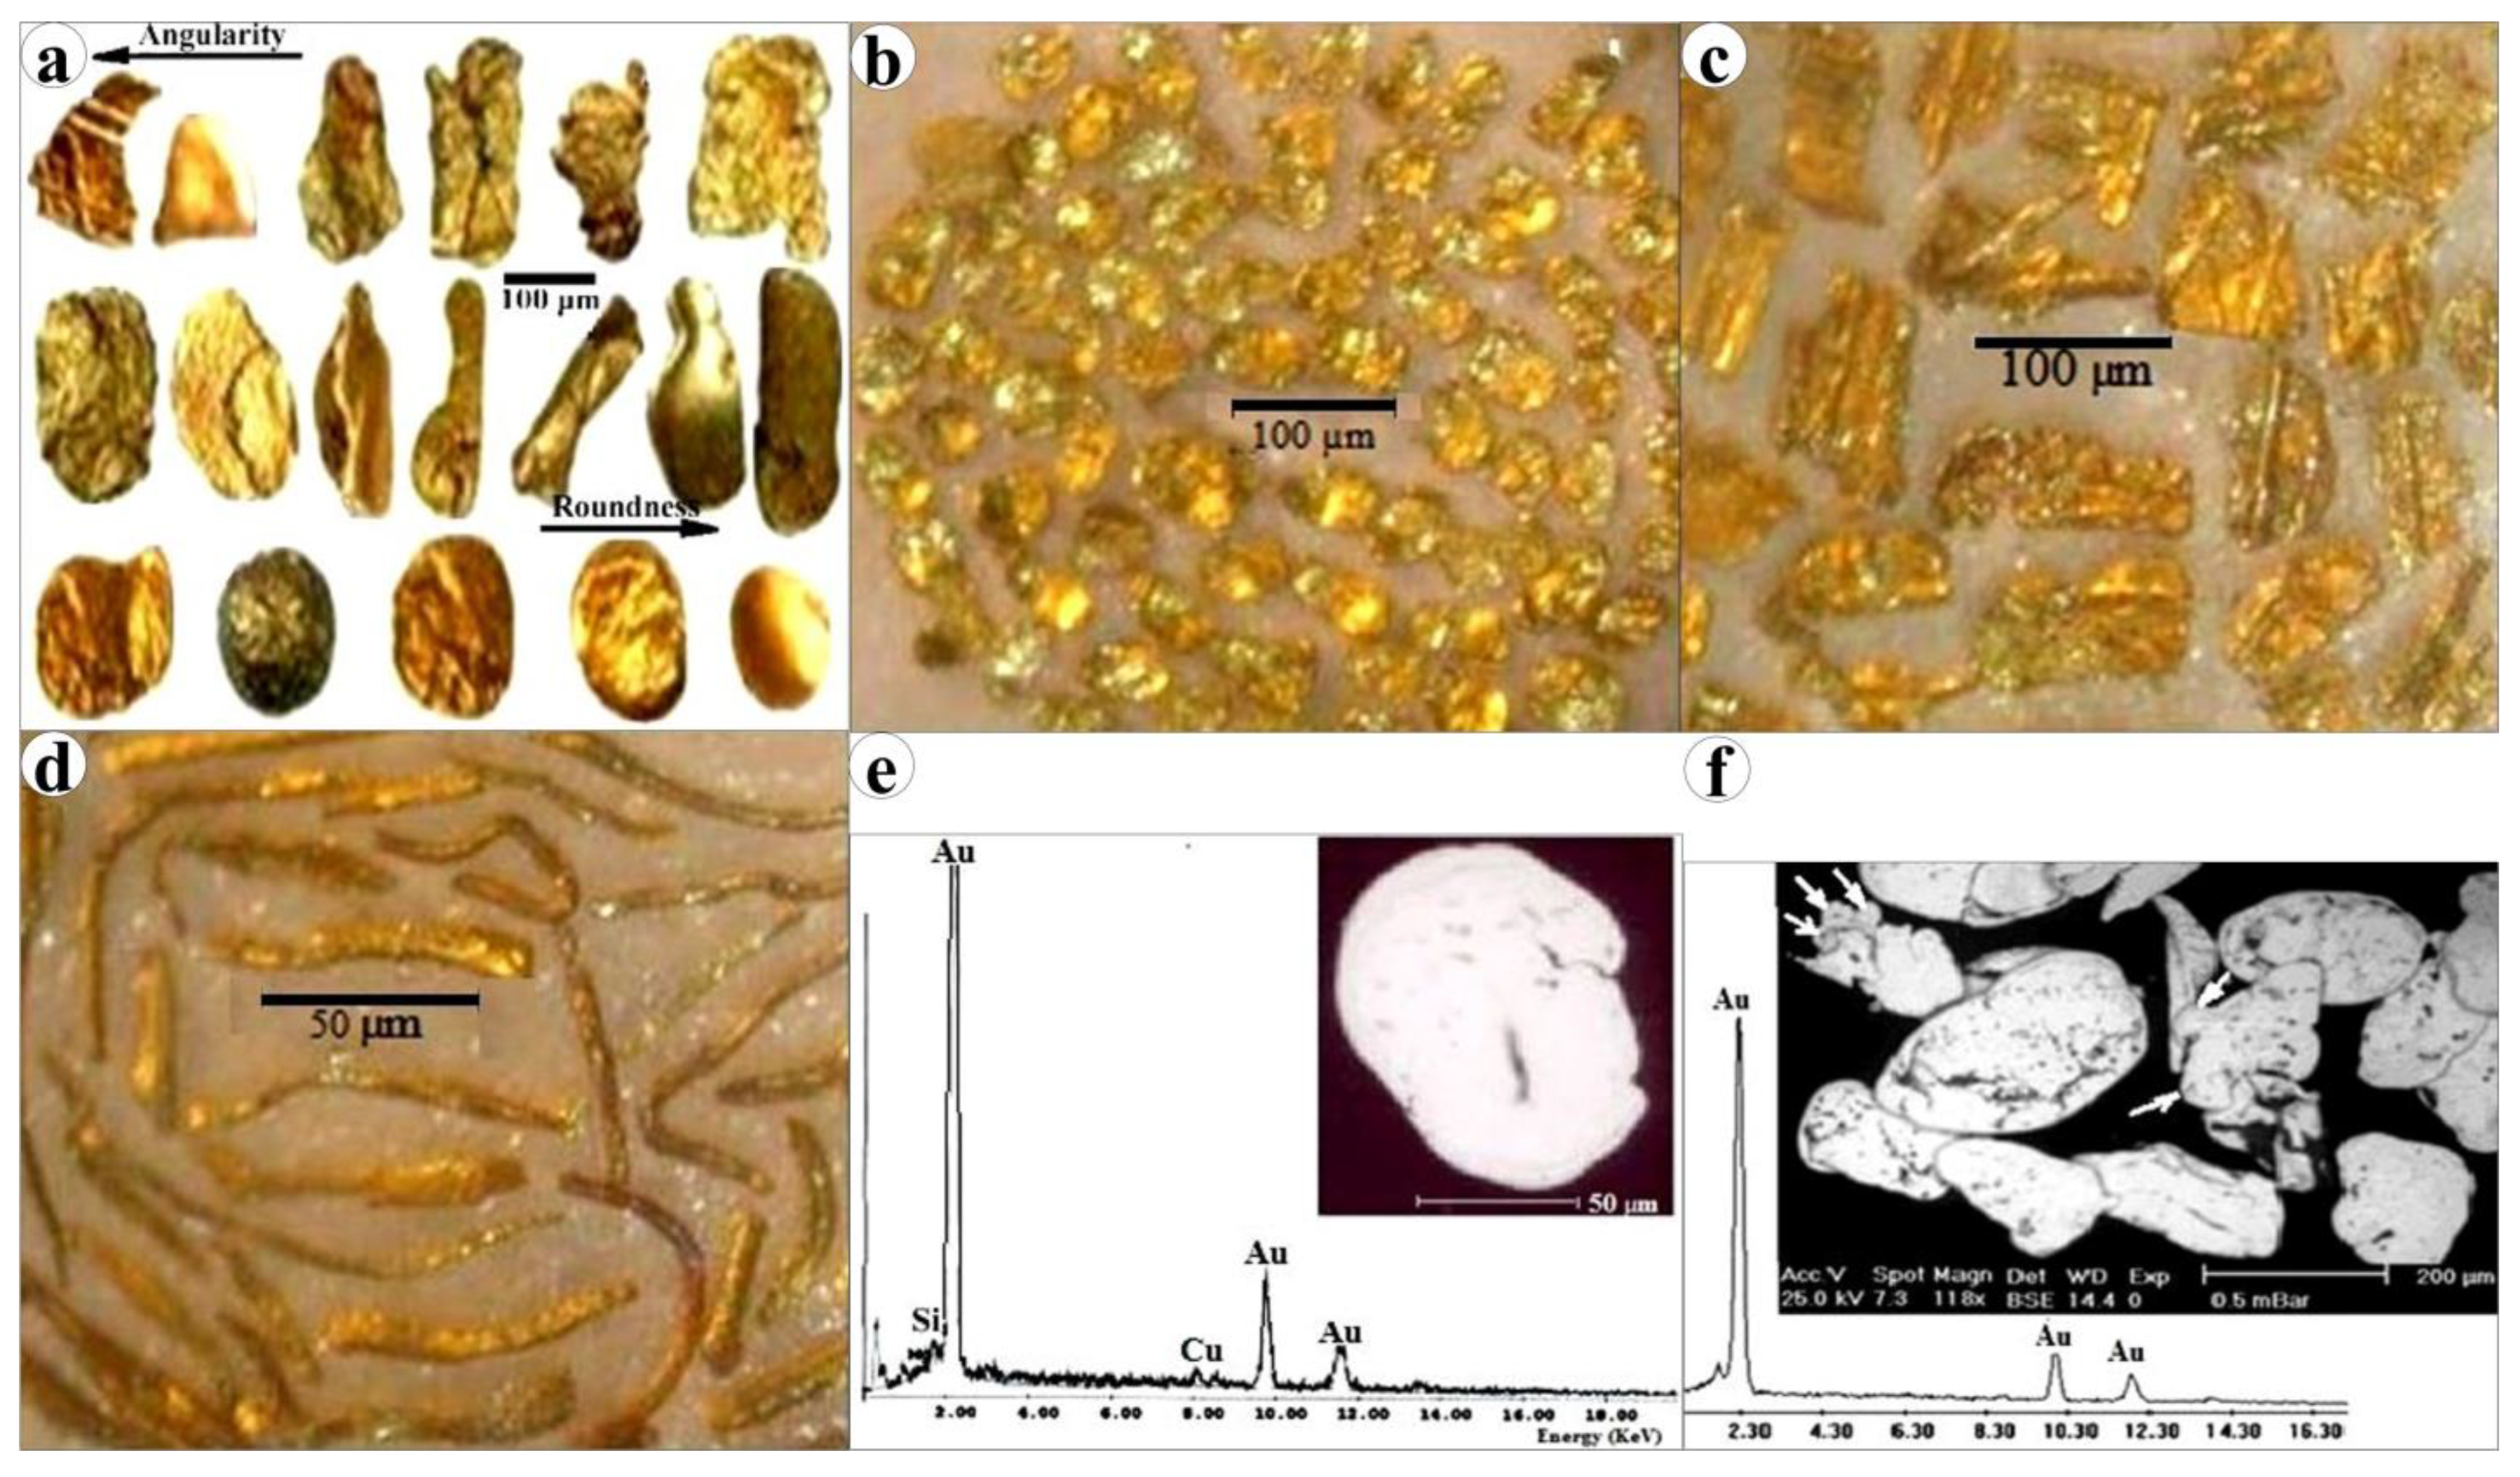
The mineralogical contents of Egyptian black sands are divided into two groups: the gangue group (quartz, feldspars, amphiboles, pyroxenes, epidote, and micas) and the economic minerals group (ilmenite and its alteration product leucoxene, magnetite, garnet, zircon, rutile, and monazite, as well as cassiterite, thorite, uranothorite, xenotime, and many other precious and base metal mineral grains such as gold, silver, PGE, native copper, and lead). A detailed description of the mineralogical analysis program used for each collected sample via combined operations was reported by Abdel-Karim et al. [12]. Table S1 shows the average concentrations of the cassiterite concentrate (wt.%) in the top meter of the collected sample profiles (A–F) (Figure 1c). The determined morphological characteristics (size, shape, outline, surface, color, rim, and inclusions) of the studied Au, Ag, PGMs, Cu, and Pb mineral grains are summarized in Table 1.

3.1.1. Gold

The gold grains were malleable and ductile, and the majority had a plate-like shape (Table 1; Figure 2a). Gold grains were represented by discoid (0.06–0.10 mm in diameter), elongated and ornamented (0.07–0.13 mm length, and 0.05–0.09 mm width), spherical (0.05–0.14 mm in diameter), flaky (0.05 × 0.15 mm), and even wire-like (0.10–0.30 mm length, 0.008–0.010 mm width) particles (Figure 2b–d) (Table 1). Ductile and malleable grains were drawn into thin wires and thin sheets (Figure 2d) (Table 1).
Figure 2e,f show the presence of gold as verified by BSE images. The nuggets contained faceted areas with small crystal shapes as well as fine inclusions and holes (Figure 2f). The chemical compositions (EMPA) of the studied gold mineral grains range from 94.11 to 98.55 wt.% Au (av. 96 wt.%) with detectable Ag (1.28–2.32 wt.%) and Cu (0.16–5.15 wt.%) elements (Table 2). SEM/EDX data showed trace impurities of Si (0.28–2.58 wt.%), Cu (0.20–2.08 wt.%), and Mg, detected in only one analysis (0.67 wt.%).

3.1.2. Silver

Silver was represented by sheaf-like (0.03 × 0.15 to 0.70 × 0.20 mm) and spherical grains (0.04 × 0.04 to 0.13 × 0.13 mm) (Figure 3a,b, Table 1). The spherical grains were mostly tarnished with black silver sulfide (Acanthite, Ag2S). The silver grain rims were commonly absent. Sometimes, silver grains enclosed fine inclusions of PGM (Figure 3a,b). The chemical compositions of the studied silver mineral grains were typically highly variable in Ag (71.66–95.34 wt.%), Pb (1.50–6.72 wt.%), and Ir (0.11–8.86 wt.%) (Table 3). Small values of Ni (1.06–3.50 wt.%) and FeT (1.04–3.67 wt.%) were detected in the silver composition. Selenium was detected in two analyses (3.16 and 4.67 wt.%). SEM/EDX data (Figure 3c, Table 3) showed that silver grains’ composition contained many impurities, notably, Pb, Ir, Si, and Ca. The apparent variability in the silver grain analysis in both EMPA and SEM/EDX data could point to different sources.

3.1.3. Platinum Group Minerals (PGM)

Platinum alloy and sperrylite mineral were found as silvery white grains separated from the cassiterite concentrate. Platinum alloy formed angular plates to elongated grains (0.13 × 0.4 to 0.2 × 0.5 mm, Table 1, Figure 4a). Sperrylite mineral is a platinum arsenide mineral (PtAs2) containing more than the half wt.% Pt. It is an opaque metallic tin-white mineral with a brilliant metallic luster. Sperrylite was found as white, elongated grains and euhedral crystals of varying size and shape (0.22 × 0.06 mm) (Table 1, Figure 4b). Regarding the EMPA data, the studied PPGE grains commonly ranged in Pt (42.89–45.76 wt.%). These grains also included fewer amounts of Os (24.67–28.44 wt.%), Ru (13.32–16.11 wt.%), and Ir (8.13–11.07 wt.%). Traces of Pb (av. 4.71 wt.%) and Fe (0.12 wt.%) were also detected in the composition of PPGE alloy grains (Table 4). Only Pt and As were present in highly detectable amounts in most grains of the sperrylite mineral (55.17 and 42.14 wt.% on average) (Table 5).

3.2. Base Metals

3.2.1. Minerals of Copper

Copper minerals’ grains picked from the cassiterite concentrate included native copper and cuprite. Native copper formed minor amounts of non-magnetic particles that had commonly abnormal spherical-shape grains (0.05 × 0.05 to 0.20 × 0.10 mm). However, ovoid, drop, cocoon, and bone-like grains were observed (Figure 5a–d, Table 1). The copper grains were black and brown to red in color. Most of these grains were massive, whereas some of them contained voids. They sometimes contained minor inclusions of quartz, sphene, and Mn-Ni minerals (Mn-, Ni-bearing goethite?). Polished sections of spherical native copper grains are shown in Figure 5e–h. Copper grains were commonly varied in size, shape, rims, and color. They included red non-magnetic homogeneous black and red grains (Figure 5e), black grains with relics of red copper cores (Figure 5f), or, vice versa, red grains with black cores (Figure 5g). Some grains had voids within them. Grain rims were black in color and ranged from continuous to discontinuous or even absent. The thickness of the grain rims varied (20–40 m, Figure 5g,h). Cuprite grains (Cu2O) were subrounded grains (0.10 × 0.02 mm) with a brownish black color. Grain aggregates formed and were observed (Figure 5h). The current native copper grains were relatively pure, according to EMPA (90.8–98.42 wt.%). Minor impurities of Si (av. 0.73 wt.%), Zn (av. 0.56 wt.%), FeT (0.92 wt.%), Ni (Av. 1.15 wt.%), and S (1.10 wt.%) and traces of Ag (av. 0.35 wt.%) were also detected (Table 6). The copper composition contained small amounts of Ca (av. 1.01 wt.%) and Cl (av. 0.79 wt.%), according to SEM/EDX data (Figure 5). The trace element concentrations in the analyzed grains may indicate that these elements were hosted by copper grains. Cuprite grains contained less Cu, Si, and FeT than native copper grains (Table 6).

3.2.2. Minerals of Lead

Lead minerals included four varieties: native lead, galena, ochrolite, and minium. Native lead grains were represented by spherical, ovoid (0.4 × 0.4 to 0.15 × 0.10 mm), drop-like (0.03 × 0.01 to 0.10 × 0.04 mm), and cocoon-like (0.05 × 0.02 mm) grains (Table 1). Their color varied between straw yellow and light brown (Figure 6a,b). The lead grains, like gold, were soft, ductile, and malleable; therefore, the grains were capable of being drawn into thin wires and hammered into thin sheets. Polished sections had a shiny surface when first cut, but it tarnished (rusted) and became dull after a month when exposed to atmospheric air. Lead grains that were polished had spherical and drop-like shapes. They occasionally contained fine spherical grains of reddish copper and whitish silver (Figure 6c,d), as well as traces of Si, Fe, Ca, Ti, Mg, P, Cr, and Cu, detected through chemical analysis (Table 7). The lead grain rims were black in color and usually continuous to discontinuous or absent. The thickness of the grain rims varied (5–20 μm, Figure 6c,d). Galena formed dull grey to greenish prismatic (0.08 × 0.40 mm) and cubic (0.10 × 0.10 mm) grains (Figure 6e). Ochrolite (PbSbO2Cl) is considered an oxidation product of other lead minerals [48]. Ochrolite is a light to vivid red and may have brown-to-yellow tints (Figure 6f). It varied in grain shapes from elongated (0.01 × 0.03 mm) particles to subrounded or rounded grains (0.07 × 0.07 mm). Minium mineral grains had varied shapes, but exhibited a brownish tint (Figure 6g,h). Regarding the chemical analysis data, the studied native lead grains were relatively variable in composition (65.15–93.23 wt.%). Minor impurities of Si (Av. 4.52 wt.%), Mg (av. 3.12 wt.%), P (av. 1.95 wt.%), Ca (av. 1.86 wt.%), Al (av. 1.75 wt.%), Cr (av. 1.67 wt.%), and Cu (av. 1.54 wt.%) were hosted by lead grains (Table 7, Figure 6i). According to EMPA, Sb was the only element (17.16 wt.% on the average), other than Pb (av. 75.12 wt.%), present in high concentrations of the ochrolite mineral grains. Other impurities were normally represented by Cu (av. 0.54 wt.%), Si (av. 1.06 wt.%), Cl (av. 1.93 wt.%), FeT (av. 1.49 wt.%), and Al (av. 0.71 wt.%), indicating their hosting by ochrolite grains (Figure 6f). Strong similarities of both EMPA and SEM analyses of the ochrolite mineral were observed (Table 8 and Figure 6f).

4. Discussion

4.1. Mineral Transport and Reworking

In this study, we investigated how mineral grains are modified in the beach environment through wave and current reworking. Stewart et al. [22] demonstrated that gold grains derived directly from crystalline rock sources can maintain their original composition over long distances in a river system, with only minor development of replacement rims. This suggests that recrystallization can occur during residence, likely due to rapid tectonic uplift, resulting in successive recycling into new sedimentary environments. However, the environment in North Africa is different, and gold particles in this region are compositionally stable in the absence of mechanical modification. We examined the degree of rounding, polishing, and bending of metal particles in concentrates to estimate the relative distance that the grains were transported from their source. Most of these observations were made with a binocular microscope, which limited the resolution of grain and surface features.
Morphological characteristics were applied to the placer gold grains [19,23,25], which gave good significance to some of these features. Some particles exhibited classic features of significant transport (Figure 2a,b). These grains were rounded to oval and, in many cases, elongated. The outline was regular, and the surface topography was smooth, suggesting long-distance transport [19]. However, Figure 2c depicts gold crystals with well-defined ridges and straight edges, having very irregular outlines and topographic surfaces. Additionally, they had elongated and ornamented microfolded thin flakes. These particles had morphological characteristics that are usually associated with no transport or short distances to the sources [19]. Figure 2d shows gold hammered rod-like or wires with angular edges, which appeared to be formed by primary morphology rather than physical processes (e.g., milling formed the flakes). All these features suggest multiple sources and different distances to the source/sources of the investigated placer gold. Corrosion pits and ornamented microfolds appeared on gold grain surfaces (Figure 2c), possibly due to weathering in the surficial environment [49,50].
Silver grains were typically spherical in shape, with minor elongated and sheaf-like grains (Table 1, Figure 3). Copper and lead grains varied in shape and size, including spherical, ovoid, drop, cocoon, and bone-like grains (Table 1, Figure 5 and Figure 6). The variability in grain morphology and size of these metals may indicate different sources, transport distances, general climate history, and/or landscape evolution. These features are consistent with those described by Knight et al. [26] and Townley et al. [19]. The investigated metals were mostly found as flattened plate or rod-shaped grains in the Nile beach placer, likely due to the low hydraulic equivalence of these grains [12] or poor sorting with high contrast between light and heavy minerals. This distinguishing feature is likely due to the strong hydraulic state of the water producing equidimensional grains, whereas the low hydraulic state produces flattened plate or rod-shaped grains. Most current mineral grains become polished and free of contamination after a long transport (apart from a few that can be located through chemical analysis), while others are completely lost before reaching the influx or undergo changes to their chemical composition during transport [35].
A critical question arises here regarding the presence of native lead (do the spherical particles sound like smelted lead?) and copper, both of which are unstable in the surface environment and rare in nature as native metals. It is highly probable that the native Pb and Cu grains found in the samples originated from anthropogenic sources. Industrial activity in the Nile Delta has been well documented to cause heavy metal contamination, including Pb and Cu [51,52,53].
Parallel laminations are visible in the catchment area’s coastal plain; they are most visible on medium- and fine-sand beaches, where they are enhanced by the sorting of light minerals and dark, heavy minerals into alternating layers. As a result, a series of laminations produces alternating light and dark bands. The laminations are caused by variations in the wave’s transporting power. The dark heavy-mineral concentration results from these grains being more difficult to transport than those of lower density, causing them to settle out first and form the bottom of an individual lamination.

4.2. Sources of the Precious and Base Metal Minerals

4.2.1. Grain Rims and Grain Inclusions

Submicroscopic grain rims and inclusions can be identified by analyzing increased levels of certain elements in existing metals, which can help distinguish various sources [40]. However, due to gold’s inert nature, the grain rims of the analyzed gold particles were often nonexistent (Figure 2). Nonetheless, some grains did exhibit rim-like enrichments that were found along fractures inside the grains (Figure 2a,f). These gold-enriched rims are a common characteristic of placer gold grains [18], and their formation process is allogenic in nature [54]. Rims on authigenic gold were not expected to be seen, since this type of gold forms in equilibrium with surface conditions, much like rims. Therefore, we needed to determine whether the particles that suggested an authigenic origin exhibited rims or whether they were just flakes. The large transport distances that these particles typically undergo, combined with the effects described by Stewart et al. [22], can ultimately obliterate the original Ag-rich core of the particle, which may be what we were observing in the present gold grains. Similar conclusions were reported by Marquez-Zavalia et al. [28] on placer gold deposits in the San Luis Range of Argentina. Although gold is commonly crystalline, after traveling in a fluvial system, no crystal faces were preserved in the grains we analyzed, likely due to their long traveling distances.
To move from gold to other metals, some restructuring was required. Additionally, it was helpful to differentiate among the various types of rims. For instance, Au-rich rims result from Ag removal, while Pb and Cu rims form due to chemical alteration. In general, any interaction between gold and magnetite can result in the shedding of gold particles that contain magnetite. However, the current observed magnetite inclusions did not appear to represent impacted particles from sedimentary processes. These inclusions lacked certain textural features such as voids around them and they were not digested by impaction.
Distinct rims could be observed in the investigated copper and lead grains. These rims were usually black or brown in color and were either continuous or discontinuous. The thickness of the rims varied from 20–40 µm in copper (Figure 5h) to 5–20 µm in lead (Figure 6c,d). The differences in rim color and thickness can be explained by variations in the composition and weathering surfaces of the grains, as well as the transport distance from the source.
Previous studies provided valuable insights into element impurities and mineral inclusions in gold, which have been used to link placer sources [21,55] or to identify inclusion signatures associated with gold from specific types of deposits, such as calc-alkalic or alkalic porphyry Cu–Au deposits [56,57,58]. The submicroscopic inclusions or impurities present in our studied grains varied according to the type of minerals and source rocks. Some gold grains contained impurities of Si, Cu, and Fe. These impurities were similar to those found in the San Luis Range, Argentina [28]. Impurities of Zn, Pb, and Ni were evident in the copper grains we studied, while Ti, Ca, and Si impurities were present in the lead grains. Additionally, impurities of Ti, Fe, and PGE were detected in the silver grains, whereas PGM and sperrylite grains contained small amounts of Au (1.89 wt.%) and minor amounts of Si, Fe, and Cu.
The presence of Si, Fe, and Ti impurities indicated a wide range of igneous (mafic–ultramafic complexes) and metamorphic rocks (schists, gneisses, and amphibolites). Fe (Ilmenite) and PGM were found in alluvial minerals of the Freetown Layered Complex in Sierra Leone [29]. In Cameroon, Fe (magnetite) with traces of Cr and V was detected as impurities in placer gold grains, which was attributed to a strong interaction between hot reducing ore fluids and local mafic lithologies [59]. Apachite, galena, PGM, and ilmenite were also detected in sulfide of mafic–ultramafic cumulates. Arrojadite and quartz are primary minerals in granite pegmatites in the Mount Wills region of Northeastern Victoria, Australia [60]. Therefore, the variation in grain impurities may indicate the variability of source rocks. These submicroscopic impurities were identified based on elevated Si, Fe, Ti, Cu, Ag, etc. contents in gold, silver, copper, and lead ± PPGMs (Table 1, Table 2, Table 3, Table 4, Table 5, Table 6, Table 7 and Table 8), which also distinguished different sources of these metals. Similar impurities were found in detrital heavy-mineral assemblages from rivers and tributaries in the Nile River drainage basin [40].

4.2.2. Micro-Chemical Signature

Native gold can form a solid solution with Ag and a partial solution with elements such as Cu, Fe, As, and Bi, among others. The composition of gold grains in active stream sediments or placer deposits can provide insights into the type of deposit from which they eroded. The core of gold grains recovered from active sediments retains the original composition of their source hydrothermal system [19]. The gold chemistry presented in Table 2 demonstrates that notable contents of Ag (av. 1.86 wt.%) and Cu (av. 1.87 wt.%) were present as the most useful discrimination elements. The observed content of Ag in the gold was likely due to the presence of electrum (a naturally occurring Au–Ag alloy) (Table 2), which is commonly associated with magmatic sulfides that are widely distributed in the mafic–ultramafic rocks of upstream Nile drainages [61]. Silver is generally a constant companion element of native gold in all types of deposits; its concentration varies from 0.2 to 30 wt.% [62]. It is considered the principal impurity in gold [63]. The Abu Khashaba placer deposits contained 1.3–2.3 wt.% with an average of 1.9 wt.% Ag. The high Ag contents are characteristic of gold–silver deposits, where low fineness gold is combined with high Ag phases up to native silver. Most gold grains worldwide contain appreciable amounts of Ag [22,28,49]. Gold formed by secondary, near-surface processes has a very low Ag content (<1%). Our gold grains had an average of 1.86 wt.% Ag (Table 2), indicating an affinity with epithermal or secondary, near-surface deposits. Copper is the second most often occurring element among impurities in native gold, following silver. The Cu content in gold alloys is primarily influenced by the Cu content in fluids and the nature of the Au–Cu–Ag alloy [64]. The examined gold grains had an average of 1.87 wt.% Cu (Table 2). Cu concentrations in gold alloys can range from trace amounts to over 1% [65]. While previously associated mainly with porphyry-epithermal systems, Cu-bearing gold (up to 0.8%) has now been linked to orogenic mineralization as well [65].
Native copper is commonly associated with sphalerite, millerite, galena, and Ni–Cu deposits (Table 1 and Table 6). All these mineral deposits are dominant in ultramafic–mafic intrusions [66]. The alteration of primary Cu-bearing sulfide minerals has been linked to native copper [67]. Some minerals common in the secondary oxidized zone include oxides of copper (cuprite), sulfates of lead (anglesite, PbSO4), copper (chrysocolla), lead (cerussite, PbCO3), and native metals (Au, Ag, Cu, and Pb). Cuprite is an oxide mineral composed of copper oxide (Cu2O) and is a minor ore of copper. Cuprite is typically formed in veins as an oxidation product of copper sulfides [68].
Native lead is extremely rare due to the unstable nature of metallic lead in the surface environment. It commonly contains minor amounts of apachite (average 1.54 wt.% Cu, average 4.52 wt.% Si), ilmenite (average 1.65 wt.% Fe, average 0.77 wt.% Ti), and titanite (average 1.86 wt.% Ca, 0.77 wt.% Ti, average 4.52 wt.% Si), as shown in Table 1 and Table 7. Cerussite is a lead carbonate mineral (PbCO3) that is usually found in the oxidized zone of lead ore deposits. It is a very common weathering product of galena and other lead ore minerals. Anglesite occurs as an oxidation product of primary lead sulfide ore (such as galena) in the upper parts of mineral lodes, where they have been affected by weathering processes [69].
PGE are divided into two subgroups based on their chemical composition: the iridium-rich group (IPGE), consisting of Ir, Os, and Ru, and the palladium-rich group (PPGM), consisting of Rh, Pt, and Pd [14,70]. The studied PGE grains were Pt–Fe alloys connected to the PPGE subgroup, with an average composition of 45.05 wt.% Pt (Table 4). The analyzed sperrylite grains were the Au-bearing As–Pt type (Table 5). Holwell et al. [66] reported that PGE-dominant deposits are often found in layered ultramafic–mafic complexes that are situated in the Nubian shield areas. The existence of PGM in the Alaskan-type mafic–ultramafic intrusions of the Yubdo area of Western Ethiopia and its surrounding alluvium deposits has been highlighted in several publications [71,72,73], emphasizing the intrusions’ potential for hosting PGE mineralization.

4.2.3. Fineness Data for Au–Ag and Au–Ag–Cu Alloys

Natural gold grains display a wide range of compositions, particularly in their silver content, reflecting the various solid–solution substitutions in gold–silver alloys [50]. The composition of gold is usually expressed as fineness, calculated as 1000 × Au/(Au + Ag). According to Morrison et al. [74], gold–silver alloys with a fineness greater than 800 are considered gold, whereas those with a fineness between 200 and 800 are electrum and those with a fineness less than 200 are silver. Based on the range of gold fineness values, Morrison et al. [74] classified major deposits into six categories, namely, Archaean, Slate Belt, Plutonic, Porphyry, Volcanogenic, and Epithermal deposits, with gold-fineness values of 940 (780–1000), 920 (800–1000), 825 (650–970), 700–1000 (650–1000), 650–850 (520–870), and 440–1000 (0–1000), respectively.
Low silver content in ores and higher gold-fineness values in these environments can be attributed to sulfidation as the primary mechanism of ore deposition. The sulfidation of wall rocks destabilizes only the bisulfide complexes of gold and silver, as stated by Morrison et al. [74]. The fineness and trace-element contents of gold grains have been used to categorize hypogene gold deposits and identify their placer sources. The analyzed gold grains showed a narrow range of composition (96.4–99.9 wt.%), particularly with respect to silver content (Au/Ag ratio: 40.6–77), and most had a narrow and high range of fineness values (976–987), with an average of 981. These values are comparable to those found in the environments of Archaean (quartz veins and replacement mafic, komatiitic, and metamorphic rocks), Plutonic (auriferous quartz veins in granitoid hosts and metamorphic wall rocks), and Slate Belt (meta-sedimentary rocks) [74]. These placer deposits are characterized by a high range and average fineness and are commonly associated with Cu–PGE deposits (Table 2 and Table 5), which are widely exposed in the weathered basement terrains of the Central African Province, Ethiopian Highlands, and Red Sea Hills.
Given that alloying metals can produce a variety of colors, gold is distinctive among the precious metals in that way. While it already has a rich, natural yellow color, alloying it with copper changes the hue to pink, rose, and red, while alloying it with any other white or grey metal tends to bleach the yellow color to white [75]. Alloying with silver (and cadmium) gives the gold a greenish color; such alloys are sometimes referred to as green gold. The analyzed gold–silver–copper samples fell into the red-yellow color field of relatively more than 18 ct. (Figure 7) [75].
The analyzed samples had a high Au content, ranging from 87–100 wt.%, with a low Cu and Ag content. This composition suggests that the leaching of Ag and Cu may have occurred from particles of gold alloy in the surficial environment, as was reported at the Zolotaya Gora deposit in the Urals [76] and the Wheaton Creek of the Dease Lake District, southern British Columbia, Coquihalla District [26].

4.3. Implications for Ore Sources and Their Exploration Approaches for Nubian Shield Covered Areas

The sediments of the Nile River are rich in a variety of minerals due to the diverse lithology of the extensive river catchment area [41,42]. Most primary gold deposits in the world are either lode deposits from quartz or intrusion-related deposits [77]. Lodes are typically found in basalt or felsic intrusive rocks such as granite and are sourced by the dehydration of basalt or metasomatic ultramafic during metamorphism (such as serpentinites). Intrusive-related gold is generally found in granites, porphyry, or quartz dikes [78]. Moustafa et al. [44] attributed the origin of Au, Ag, and Pb minerals in Nile sediments to the drainage basin of the Nile at the Abyssinian plateau, where gold occurs in typical hydrothermal deposits associated with felsic igneous intrusions. This type of gold is usually associated with quartz and sulfides. Some VMS deposits are known as gold-bearing deposits while others are referred to as Cu–Zn–Pb deposits. Johnson et al. [46] reported that VMS deposits are present in many locations in the Nubian shield, including northern Ethiopia.
Silver is more chemically active than gold and infrequently found as a native element mineral. It is usually associated with quartz, gold, copper, and sulfide minerals. Placer deposits rarely contain considerable amounts of Ag [25,59]. Most native silver is found in hydrothermal veins, but it can also be derived through the decomposition of sulfides in lead or zinc deposits [79]. In the studied samples, silver contained impurities of Pb, Se, Ir, Fe, and Ni (Table 3). Under exogenous conditions, in the oxidizing zone of sulfide deposits, native silver results from the decomposition of sulfide minerals [44]. Under surface conditions, native silver is less stable than gold. Ni and Ir may be related to the magmatic Ni-Cu-PGE sulfides, which are usually sited within nearby mafic–ultramafic complexes [80]. The mafic–ultramafic complexes are almost exclusively distributed in the Nubian Shield in Ethiopia, Eritrea, and Sudan [81,82].
Placer PGE deposits worldwide are typically dominated by Pt–Fe or Os–Ir–Ru alloys [83]. The PGE grains investigated in this study (Table 4) were of the Pt–Fe alloy type and had lower values of Pt × 100/(Pt + Ir + Os) (ranging from 50.5 to 55.3), which were relatively similar to those associated with less-fractionated source rocks emplaced as cold large sheets of the Alpine type, such as those found in New Guinea, Atlin, and Tasmania (ophiolite) [84]. However, we cannot exclude the probability that the present PGE deposits derived from the weathering of the wide-spreading chromitites–ophiolite complexes of the Nubian shield [85]. The angular shape and protuberances of the Pt nuggets are presented as evidence of the nuggets’ growth in the lateritic soil or around unaltered or altered chromite grains in the disintegration environment of the ultramafic or serpentinite rocks [84]. Sperrylite (PtAs2) (Table 5) is challenging to understand how a grain can be considered to have formed during transportation. It was reported to be the only abundant PGM in dunite [86]. Augustithis [86] commented on the endurance of sperrylite to chemical leaching in the birbirite, which resulted from the hydration and silicification of ophiolitic serpentinite. Ottemann and Augustithis [87] suggested that Pt nuggets grow in the lateritic soil by sperrylite agglomeration. PGM can enter solution at low temperatures under acid conditions with a high electrical conductivity, potentially forming easily accessible concentrations with economic significance [88]. PGE oxides in laterites may result from the alteration of magmatic PGM alloys and the primary crystallization of oxides in lateritic conditions, contributing to the redistribution and enrichment of PGE in laterite [89]. In situ growth of Pt–Ir–Fe–Ni alloy nuggets is possible within Ni laterites from the Dominican Republic, with multistage PGE grains forming during serpentinization and lateritization [90].
The occurrence of copper and lead was similar to those found in metamorphic terrains of the southern Nile River drainages, as reported by Moustafa et al. [44]. Furthermore, Cu-rich sulfides have also been associated with the hydrothermal leaching of mafic rocks, while native copper may be linked to the alteration of primary Cu-bearing sulfide minerals [67,91].
Regarding the Nubian shield areas, Schneiderman [40] concluded that the heavy-mineral assemblages (including studied metals) from the Nile River drainage basin reflected their origins in three petrologically and tectonically distinct source terrains that supply sediment to the Nile River and Delta (Abu Khashaba area). These sources comprise the (i) White Nile, which carries assemblages derived from amphibolites and granulites of the Central African Province, (ii) Blue Nile and Atbara rivers, which carry assemblages derived from basalts of the Ethiopian Highlands, and (iii) wadis (dry riverbeds), which drain the Red Sea Hills (e.g., basement rocks) and carry assemblages eroded from ophiolitic complexes, calc-alkaline volcanics, granitoids, and minor metapelites.
The origin of Abu Khashaba placer precious and base metal minerals’ grains is determined by their mineralogy and geochemistry. Gold that originated from basalts and metasomatized ophiolitic ultramafic rocks is similar to gold that eroded from alkali and tholeiitic basalts in the Ethiopian Highlands and were carried by the Blue Nile and Atbara rivers or from ophiolitic complexes that belong to the basement rocks of the Red Sea Hills in Ethiopia, Eritrea, Sudan, and Egypt. Copper and lead associated with sedimentary rocks deposited in ocean basins and/or granitic porphyry, as well as the PGEs that originated from ultramafic–mafic complexes and Alaskan-type mafic–ultramafic intrusions, are analogous to the placers eroded from wadis draining the basement rocks of the Red Sea Hills dominated by the aforementioned assemblages. These results may reflect the lithologic heterogeneity of the source terrains, similar to the Abu Khasbaba area in Northern Egypt. These findings partially align with those of Siegel et al. [43] and Moustafa et al. [44], who suggested two primary source rocks for the heavy minerals in northern Egypt: the metamorphic rocks of the Ethiopian plateau drained by Atbara and Blue Nile and the igneous rocks of the Equatorial plateau drained by the White Nile and its tributaries. Therefore, the detected platinum and, to a lesser extent, gold were probably derived partly from the upper drainage basins of the Nile at the main Central Equatorial lakes, particularly from Uganda and Ethiopia. Moreover, the volcanic provenance of the Blue Nile and Atbara is likely another source for the recorded copper and platinum deposits. The basement of the Egyptian Eastern Desert should not be excluded as a likely source for some of these placers. Similar results were recorded for the Au and Ag minerals of northern Egypt [44].

5. Conclusions

This study presents the first comprehensive measurement of the mineralogy and micro-chemical characterization of precious and base metal minerals in black sand deposits along Egypt’s Mediterranean coast. Based on our findings, we draw the following key conclusions:
(1)
The high Au content (94–99 wt.%) and gold fineness value are consistent with Au–Ag sulfidation deposits that originate from the weathered basement terrains of Central Africa, Ethiopian Highlands, and Red Sea Hills. The narrow range of gold composition, high fineness, and association with Cu–PGE deposits suggest that the minerals are similar to those found in Neoproterozoic plutonic and meta-sedimentary rocks, which are commonly found in the Nubian shield covered areas.
(2)
The investigated gold grains are allogenic in nature; rims on authigenic gold are not recorded because that gold forms in equilibrium with surface conditions, exactly like rims. This feature is owed to the enormous transport distances that are frequently associated with the effect that eventually obliterates the original particle’s Ag-rich core. Pb and Cu rims form as a result of chemical alteration.
(3)
The studied PGE grains are Pt–Fe alloys connected to the PPGE subgroup and dominated by Pt (45.05 wt.%). The analyzed sperrylite grains are Au-bearing As–Pt type. Their source can be related to ultramafic–mafic complexes and Alaskan-type mafic–ultramafic intrusions.
(4)
The variations in the morphology, surfaces, inclusion types, rims, and micro-chemistry of the grains investigated could reflect differences in their lithologies, weathering surfaces, transport distances, and multiple source provenances.
(5)
Minerals that are unstable in the surface environment are one of this study’s highlights. Native copper may be of an anthropogenic origin. The same is true for lead because, even if a native lead (spherical particles sound like smelted lead) source existed considerably further upstream, the chances of a malleable and reactive metal surviving should be zero. Furthermore, the accompanying galena is a common mineral that is neither chemically nor physically resilient.

Supplementary Materials

The following supporting information can be downloaded at https://www.mdpi.com/article/10.3390/resources13080109/s1: Table S1: Average contents of the cassiterite (wt.%) in top meter zone of each profile in the studied area. Figure S1: Simplified flow chart used for concentration and separation of cassiterite and studied metals.

Author Contributions

Conceptualization, A.-A.M.A.-K. and A.G.; methodology, A.-A.M.A.-K.; validation, A.-A.M.A.-K. and A.G.; formal analysis, A.-A.M.A.-K.; investigation, A.-A.M.A.-K.; resources, A.-A.M.A.-K. and A.G.; data curation, A.-A.M.A.-K. and A.G.; visualization, A.-A.M.A.-K. and A.G.; writing—original draft preparation, A.-A.M.A.-K. and A.G.; writing—review and editing A.-A.M.A.-K. and A.G. All authors have read and agreed to the published version of the manuscript.

Funding

This research received no external funding.

Institutional Review Board Statement

Not applicable.

Informed Consent Statement

Not applicable.

Data Availability Statement

Data are contained within the article or Supplementary Materials.

Acknowledgments

The authors thank Mohamed Barakat (Nuclear Materials Authority, Cairo, Egypt) for his assistance in field and laboratories investigations. The authors thank Tarek Ibrahim (Nuclear Materials Authority, Cairo, Egypt) for his assistance in conducting the microprobe analyses.

Conflicts of Interest

The authors declare no conflicts of interest.

References

  1. Rozendaal, A.; Philander, C.; Heyn, R. The coastal heavy mineral sand deposits of Africa. S. Afr. J. Geol. 2017, 120, 133–152. [Google Scholar] [CrossRef]
  2. Trujillo, W.; Cobo, J.; Vera-Cedeño, D.; Palma-Cando, A.; Toro-Álava, J.; Viloria, A.; Ricaurte, M. Magnetic Separation and Enrichment of Fe–Ti Oxides from Iron Titaniferous Beach Sands: Process Design Applied to Coastal Ecuador. Resources 2022, 11, 121. [Google Scholar] [CrossRef]
  3. Hou, B.; Keeling, J.; Van Gosen, B.S. Geological and Exploration Models of Beach Placer Deposits, Integrated from Case-Studies of Southern Australia. Ore Geol. Rev. 2017, 80, 437–459. [Google Scholar] [CrossRef]
  4. Peristeridou, E.; Melfos, V.; Papadopoulou, L.; Kantiranis, N.; Voudouris, P. Mineralogy and Mineral Chemistry of the REE-Rich Black Sands in Beaches of the Kavala District, Northern Greece. Geosciences 2022, 12, 277. [Google Scholar] [CrossRef]
  5. Nayak, B. Gold in the beach placer sands of Chavakkad-Ponnani, Kerala Coast, India. J. Geol. Soc. India 2011, 78, 345–348. [Google Scholar] [CrossRef]
  6. Uddin, M.R.; Khandaker, M.U.; Akter, N.; Ahmed, M.F.; Hossain, S.M.M.; Gafur, A.; Abedin, M.J.; Rahman, M.A.; Idris, A.M. Identification and Economic Potentiality of Mineral Sands Resources of Hatiya Island, Bangladesh. Minerals 2022, 12, 1436. [Google Scholar] [CrossRef]
  7. Batapola, N.; Dushyantha, N.; Ratnayake, N.; Premasiri, R.; Abeysinghe, B.; Dissanayake, O.; Rohitha, S.; Ilankoon, S.; Dharmaratne, P. Rare earth element potential in the beach placers along the southwest coast of Sri Lanka. In Proceedings of the Moratuwa Engineering Research Conference (MERCon), Moratuwa, Sri Lanka, 27–29 July 2021; pp. 415–420. [Google Scholar] [CrossRef]
  8. Belkin, H.E.; Grosz, A.E. Platinum and gold placer from Tugidak Island, Alaska: Platinum-group minerals and their inclusions, gold, and chromite mineralogy. Can. Mineral. 2021, 59, 667–712. [Google Scholar] [CrossRef]
  9. Kasper-Zubillaga, J.J.; Carranza-Edwards, A.; Morton-Bermea, O. Heavy Minerals and Rare Earth Elements in Coastal and Inland Dune Sands of El Vizcaino Desert, Baja California Peninsula, Mexico. Mar. Georesources Geotechnol. 2008, 26, 172–188. [Google Scholar] [CrossRef]
  10. Tzifas, I.T.; Misaelides, P.; Godelitsas, A.; Gamaletsos, P.N.; Nomikou, P.; Karydas, A.G.; Kantarelou, V.; Papadopoulos, A. Geochemistry of coastal sands of Eastern Mediterranean: The case of Nisyros volcanic materials. Geochemistry 2017, 77, 487–501. [Google Scholar] [CrossRef]
  11. Gonçalves, C.C.; Braga, P.F.A. Heavy Mineral Sands in Brazil: Deposits, Characteristics, and Extraction Potential of Selected Areas. Minerals 2019, 9, 176. [Google Scholar] [CrossRef]
  12. Abdel-Karim, A.M.; Zaid, S.; Moustafa, M.I.; Barakat, M.G. Mineralogy, chemistry and radioactivity of the heavy minerals in the black sands, along the Northern coast of Egypt. J. Afr. Earth Sci. 2016, 123, 10–20. [Google Scholar] [CrossRef]
  13. Mooiman, M.B.; Sole, K.C.; Dinham, N. The Precious Metals Industry. In Metal Sustainability: Global Challenges, Consequences, and Prospects; Izatt, M.R., Ed.; Wiley: Hoboken, NJ, USA, 2016. [Google Scholar] [CrossRef]
  14. Zaccarini, F.; Economou-Eliopoulos, M.; Kiseleva, O.; Garuti, G.; Tsikouras, B.; Pushkarev, E.; Idrus, A. Platinum Group Elements (PGE) Geochemistry and Mineralogy of Low Economic Potential (Rh-Pt-Pd)-Rich Chromitites from Ophiolite Complexes. Minerals 2022, 12, 1565. [Google Scholar] [CrossRef]
  15. Tolstykh, N.; Shapovalova, M.; Podlipsky, M. Au-Ag-Se-Te-S Mineralization in the Maletoyvayam High-Sulfidation Epithermal Deposit, Kamchatka Peninsula. Minerals 2023, 13, 420. [Google Scholar] [CrossRef]
  16. Sinyakova, E.F.; Vasilyeva, I.G.; Oreshonkov, A.S.; Goryainov, S.V.; Karmanov, N.S. Formation of Noble Metal Phases (Pt, Pd, Rh, Ru, Ir, Au, Ag) in the Process of Fractional Crystallization of the CuFeS2 Melt. Minerals 2022, 12, 1136. [Google Scholar] [CrossRef]
  17. Syaeful, H.; Ciputra, R.C.; Adimedha, T.B.; Sumaryanto, A.; Sukadana, I.G.; Indrastomo, F.D.; Pratiwi, F.; Sucipta, S.; Pratama, H.A.; Mustika, D.; et al. Radiometric Signatures of Gold Mineralization Zone in Pongkor, West Java, Indonesia: A Baseline for Radiometric Mapping Application on Low-Sulfidation Epithermal Deposit. Resources 2024, 13, 2. [Google Scholar] [CrossRef]
  18. Knight, J.B.; Morison, S.; Mortensen, J. The relationship between Placer Gold Particle Shape, Rimming and Distance of Fluvial Transport as Exemplified by Gold from the Klondike District, Yukon Territory, Canada. Econ. Geol. 1999, 94, 635–648. [Google Scholar] [CrossRef]
  19. Townley, B.K.; Herail, G.; Maksaev, V.; Palacios, C.; de Parseval, P.; Sepulveda, F.; Orellana, R.; Rivas, P.; Ulloa, C. Gold grain morphology and composition as an exploration tool: Application to gold exploration in covered areas. Geochem. -Explor. Environ. Anal. 2003, 3, 29–38. [Google Scholar] [CrossRef]
  20. Chapman, R.J.; Mortensen, J.K.; Lafarge, W.P. Styles of lode gold mineralization contributing to the placers of the Indian River and Black Hills Creek, Yukon Territory, Canada, as deduced from micro chemical characterization of placer gold grains. Miner. Depos. 2011, 57, 881–903. [Google Scholar] [CrossRef]
  21. Chapman, R.J.; Mortensen, J.K. Characterization of gold mineralization in the Northern Cariboo Gold District, British Columbia, Canada, through integration of compositional studies of lode and detrital Gold with historical placer production: A template for evaluation of orogenic gold districts. Econ. Geol. 2016, 111, 1321–1345. [Google Scholar] [CrossRef]
  22. Stewart, J.; Kerr, G.; Prior, D.; Halfpenny, A.; Pearce, M.; Hough, R.; Craw, D. Low temperature recrystallization of alluvial gold in paleoplacer deposits. Ore Geol. Rev. 2017, 88, 43–56. [Google Scholar] [CrossRef]
  23. Nikiforova, Z. Criteria for Determining the Genesis of Placers and Their Different Sources Based on the Morphological Features of Placer Gold. Minerals 2021, 11, 381. [Google Scholar] [CrossRef]
  24. Lalomov, A.V.; Chefranov, R.M.; Naumov, V.A.; Naumova, O.B.; LeBarge, W.; Dilly, R.A. Typomorphic features of placer gold of Vagran cluster (the Northern Urals) and search indicators for primary bedrock gold deposits. Ore Geol. Rev. 2017, 85, 321–335. [Google Scholar] [CrossRef]
  25. dos Santos Alves, K.; Barrios Sánchez, S.; Gómez Barreiro, J.; Merinero Palomares, R.; Compaña Prieto, J.M. Morphological and Compositional Analysis of Alluvial Gold: The Fresnedoso Gold Placer (Spain). Ore Geol. Rev. 2020, 121, 103489. [Google Scholar] [CrossRef]
  26. Knight, J.; Mortensen, J.; Morison, S. Lode and Placer Gold Composition in the Klondike District, Yukon Territory, Canada: Implications for the Nature and Genesis of Klondike Placer and Lode Gold Deposits. Econ. Geol. 1999, 94, 649–664. [Google Scholar] [CrossRef]
  27. Ketchaya, Y.B.; Dong, G.; Santosh, M.; Lemdjou, Y.B. Microchemical signatures of placer gold grains from the Gamba district, northern Cameroon: Implications for possible bedrock sources. Ore Geol. Rev. 2022, 141, 104640. [Google Scholar] [CrossRef]
  28. Marquez-Zavalia, M.F.; Southam, G.; Carig, J.R.; Galliski, M.A. Morphological and chemical study of placer gold from the San Luis Range, Argentina. Can. Mineral. 2004, 42, 69–82. [Google Scholar] [CrossRef]
  29. Bowles, J.F.W.; Suárez, S.; Prichard, H.M.; Fisher, P.C. The mineralogy, geochemistry and genesis of the alluvial platinum-group minerals of the Freetown Layered Complex, Sierra Leone. Mineral. Mag. 2018, 82 (Suppl. S1), S223–S246. [Google Scholar] [CrossRef]
  30. Mateen, A.; Wahid, A.; Janjuhah, H.T.; Mughal, M.S.; Ali, S.H.; Siddiqui, N.A.; Shafique, M.A.; Koumoutsakou, O.; Kontakiotis, G. Petrographic and Geochemical Analysis of Indus Sediments: Implications for Placer Gold Deposits, Peshawar Basin, NW Himalaya, Pakistan. Minerals 2022, 12, 1059. [Google Scholar] [CrossRef]
  31. Chapman, R.J.; Mortensen, J.K.; Crawford, E.C.; Lebarge, W.P. Micro-chemical studies of placer and lode gold in the Klondike District, Yukon, Canada: 1. Evidence for a small, gold rich, orogenic hydrothermal system in the bonanza and Eldorado Creek area. Econ. Geol. 2010, 105, 1369–1392. [Google Scholar] [CrossRef]
  32. Abdel-Karim, A.M.; Moustafa, M.I.; El-Afandy, A.H.; Barakat, M.G. Mineralogy, Chemical Characteristics and Upgrading of Beach Ilmenite of the Top Meter of Black Sand Deposits of the Kafr Al-Sheikh Governorate, Northern Egypt. Acta Geol. Sin. 2017, 91, 1326–1338. [Google Scholar] [CrossRef]
  33. Wassef, S.N. Distribution and properties of placer ilmenite in East Rosetta beach sands, Egypt. Miner. Depos. 1981, 16, 259–267. [Google Scholar] [CrossRef]
  34. El Gemmizi, M.A. Note on the occurrence of gold and cassiterite in the Egyptian beach placer deposits. Econ. Geol. 1985, 80, 769–772. [Google Scholar] [CrossRef]
  35. El-Kammar, A.A.; Ragab, A.A.; Moustafa, M.I. Geochemistry of economic heavy minerals from Rosetta black sand of Egypt. JKAU Earth Sci. 2010, 22, 33–39. [Google Scholar] [CrossRef]
  36. Moustafa, M.I. Mineralogical characteristics of the separated magnetic rutile of the Egyptian black sands. Resour. Geol. 2010, 60, 300–312. [Google Scholar] [CrossRef]
  37. Abdel-Karim, A.M.; El-Shafey, A. Mineralogy and chemical distribution study of placer cassiterite and some associated new recorded minerals, east Rosetta, Egypt. Arab. J. Geosci. 2012, 5, 807–816. [Google Scholar] [CrossRef]
  38. Abdel-Karim, A.M.; Barakat, M.G. Separation, upgrading and mineralogy of placer magnetite in the black sands, Northern coast of Egypt. Arab. J. Geosci. 2017, 10, 298. [Google Scholar] [CrossRef]
  39. Moustafa, M.I. Some Mineralogical Characteristics of the Egyptian Black Sand Beach Ilmenite Part I: Homogeneous Ilmenite and Titanhematite-Ferriilmenite Grains. Eng. Technol. Appl. Sci. Res. 2022, 12, 9614–9631. [Google Scholar] [CrossRef]
  40. Schneiderman, J.S. Detrital opaque oxides as provenance indicators in River Nile sediments. J. Sediment. Res. 1995, A65, 668–674. [Google Scholar] [CrossRef]
  41. Garzanti, E.; Ando, S.; Padoan, M.; Vezzoli, G.; El Kammar, A. The modern Nile sediment system: Processes and products. Quat. Sci. Rev. 2015, 130, 9–56. [Google Scholar] [CrossRef]
  42. Garzanti, E.; Vermeesch, P.; Rittner, M.; Simmons, M. The zircon story of the Nile: Time-structure maps of source rocks and discontinuous propagation of detrital signals. Basin Res. 2018, 30, 1098–1117. [Google Scholar] [CrossRef]
  43. Siegel, F.R.; Gupta, N.; Shergill, B.; Stanley, D.J.; Gerber, C. Geochemistry of Holocene sediments from the Nile Delta. J. Coast. Res. 1995, 11, 415–431. [Google Scholar]
  44. Moustafa, M.I.; Hegab, O.A.; El-Agami, N.L. Remarks on the physical, mineralogical features and amenability of the northern coast of Egypt. Egypt. Mineral. 2000, 12, 29–49. [Google Scholar]
  45. Marshall, D.; Nicol, C.-A.; Greene, R.; Sawyer, R.; Stansell, A.; Easterbrook, R. Precious Metal Enrichment at the Myra Falls VMS Deposit, British Columbia, Canada. Geosciences 2018, 8, 422. [Google Scholar] [CrossRef]
  46. Johnson, P.R.; Zoheir, B.A.; Ghebreab, W.; Stern, R.J.; Barrie, C.T.; Hamer, R.D. Gold-bearing volcanogenic massive sulfides and orogenic-gold deposits in the Nubian Shield. S. Afr. J. Geol. 2017, 120, 63–76. [Google Scholar] [CrossRef]
  47. Ul-Hamid, A.; Tawancy, H.M.; Mohammed, A.R.I.; Al-Jaroudi, S.S.; Abbas, N.M. Quantitative WDS analysis using electron probe microanalyzer. Mater. Charact. 2006, 56, 192–199. [Google Scholar] [CrossRef]
  48. Sillén, L.G.; Melander, L. X-ray Studies on 875 the Oxyhalide Minerals Nadorite (Ochrolite) PbSbO2Cl and Ekdemite. Z. Krist.-Cryst. Mater. 2015, 103, 420–430. [Google Scholar] [CrossRef]
  49. Larizzatti, J.H.; Oliveira, S.B.; Butt, C.M. Morphology and composition of gold in a lateritic profile, Fazenda Pison ‘‘Garimpo’’, Amazon, Brazil. J. S. Am. Earth Sci. 2008, 25, 359–376. [Google Scholar] [CrossRef]
  50. Hough, R.M.; Butt, C.R.M.; Fischer-Bühner, J. The Crystallography, Metallography and Composition of Gold. Elements 2009, 5, 297–302. [Google Scholar] [CrossRef]
  51. Khalifa, M.; Gad, A. Assessment of heavy metals contamination in agricultural soil of southwestern Nile Delta, Egypt. Soil Sediment Contam. 2018, 27, 619–642. [Google Scholar] [CrossRef]
  52. Osman, R.; Melegy, A.; Dawood, Y.; Gad, A. Distribution of some potentially toxic heavy metals in the soil of Shoubra El Kheima, Egypt. Egypt. J. Chem. 2021, 64, 1965–1980. [Google Scholar] [CrossRef]
  53. Saleh, A.; Dawood, Y.H.; Gad, A. Assessment of Potentially Toxic Elements’ Contamination in the Soil of Greater Cairo, Egypt Using Geochemical and Magnetic Attributes. Land 2022, 11, 319. [Google Scholar] [CrossRef]
  54. Groen, J.C.; Craig, J.R.; Rimstidt, R.D. Gold-rich rim formation on electrum grains in placers. Can. Mineral. 1990, 28, 207–228. [Google Scholar]
  55. Chapman, R.J.; Banks, D.A.; Styles, M.T.; Walshaw, R.D.; Piazolo, S.; Morgan, D.J.; Grimshaw, M.R.; Spence-Jones, C.P.; Matthews, T.J.; Borovinskaya, O. Chemical and physical heterogeneity within native gold: Implications for the design of gold particle studies. Miner. Depos. 2021, 56, 1563–1588. [Google Scholar] [CrossRef]
  56. Knight, J.B.; Leitch, C.H. Phase relations in the system Au-Cu-Ag at low temperatures, based on natural assemblages. Can. Mineral. 2001, 39, 889–905. [Google Scholar] [CrossRef]
  57. Chapman, R.J.; Mileham, T.J.; Allan, M.M.; Mortensen, J.K. A distinctive Pd-Hg signature in detrital gold derived from alkalic Cu-Au porphyry systems. Ore Geol. Rev. 2017, 83, 84–102. [Google Scholar] [CrossRef]
  58. Chapman, R.J.; Allan, M.M.; Mortensen, J.K.; Wrighton, T.M.; Grimshaw, M.R. A new indicator mineral methodology based on a generic Bi-Pb-Te-S mineral inclusion signature in detrital gold from porphyry and low/intermediate sulfidation epithermal environments in Yukon Territory, Canada. Miner. Depos. 2018, 53, 815–834. [Google Scholar] [CrossRef]
  59. Dongmo, F.W.N.; Chapman, R.J.; Bolarinwa, A.T.; Yongue, R.F.; Banks, D.A.; Olajide-Kayode, J.O. Microchemical characterization of placer gold grains from the Meyos-Essabikoula area, Ntem complex, southern Cameroon. J. Afr. Earth Sci. 2018, 151, 189–201. [Google Scholar] [CrossRef]
  60. Birch, W.D. Minerals in the arrojadite, alluaudite and jahnsite–whiteite groups from the Mount Wills pegmatite field, Victoria, Australia. Eur. J. Mineral. 2018, 30, 635–645. [Google Scholar] [CrossRef]
  61. Mustafa, Y.S. Trace Elements Mineralization—Gala-En Nahal Area Gadarif State—Sudan. J. Pet. Min. Eng. 2018, 20, 73–79. [Google Scholar] [CrossRef]
  62. Nikolaeva, L.A.; Nekrasova, A.N.; Milyaev, S.A.; Yablokova, S.V.; Gavrilov, A.M. Geochemistry of Native Gold from Deposits of Various Types. Geol. Ore Depos. 2013, 55, 176–184. [Google Scholar] [CrossRef]
  63. Craw, D.; McLachlan, C.; Negrini, M.; Becker, N. Quantification and Prediction of Bulk Gold Fineness at Placer Gold Mines: A New Zealand Example. Minerals 2017, 7, 226. [Google Scholar] [CrossRef]
  64. Liu, H.; Beaudoin, G. Geochemical signatures in native gold derived from Au-bearing ore deposits. Ore Geol. Rev. 2021, 132, 104066. [Google Scholar] [CrossRef]
  65. Moles, N.R.; Chapman, R.J.; Warner, R.B. The significance of copper concentrations in natural gold alloy for reconnaissance exploration and understanding gold-depositing hydrothermal systems. Geochem.-Explor. Environ. Anal. 2013, 13, 115–130. [Google Scholar] [CrossRef]
  66. Holwell, D.A.; Adeyemi, A.; Warda, L.A.; Smith, D.J.; Graham, S.D.; McDonald, I.; Smith, J.W. Low temperature alteration of magmatic Ni-Cu-PGE sulfides as a source for hydrothermal Ni and PGE ores: A quantitative approach using automated mineralogy. Ore Geol. Rev. 2017, 91, 718–740. [Google Scholar] [CrossRef]
  67. Tsushima, N.; Matsueda, H.; Ishihara, S. Polymetallic mineralization at the Nakakoshi copper deposits, central Hokkaido, Japan. Resour. Geol. 1999, 49, 89–97. [Google Scholar] [CrossRef]
  68. Ciurej, A.; Struska, M.; Wolska, A.; Szczerba, M.; Olszak, J. Copper-Bearing Mineralisation in the Upper Devonian Limestones: A Case Study from the Historical Teresa Adit in the Świętokrzyskie Mountains, Poland. Minerals 2023, 13, 54. [Google Scholar] [CrossRef]
  69. Redwan, M.; Rammlmair, D.; Berkh, K. Secondary minerals in a calcareous environment: An example from Um Gheig Pb/Zn mine site, Eastern Desert, Egypt. Environ. Earth Sci. 2021, 80, 274. [Google Scholar] [CrossRef]
  70. Barnes, S.-J.; Naldrett, A.J.; Gorton, M.P. The origin of the fractionation of Platinum-group Elements in Terrestrial Magmas. Chem. Geol. 1985, 5, 303–323. [Google Scholar] [CrossRef]
  71. Belete, K.H.; Mogessie, A.; Bowles, J.F.W. Platinum-group minerals in the Alaskan Type mafic-ultramafic intrusions of the Yubdo area, Western Ethiopia. Abstract 9. In Extended Abstracts, Proceedings of the 9th International Platinum Symposium, Billings, MT, USA, 21–25 July 2002; Boudreau, A.E., Ed.; Duke University: Durham, North Carolina, 2002. [Google Scholar]
  72. Jackson, M.T.; Prichard, H.M.; Fisher, P.C.; Bowles, J.F.W.; Belete, K.H. Chrome spinel compositions complexes of the East African Orogen: Indicators of PGE-bearing Alaskan-type intrusions. In Platinum-Group Elements—From Genesis to Benefaction and Environmental Impact, Proceedings of the Extended Abstracts Volume, 10th International Platinum Symposium, Oulu, Finland, 8–11 August 2005; Törmänen, T.O., Alapieti, T.T., Eds.; Geological Survey of Finland: Espoo, Finland, 2005; pp. 381–384. [Google Scholar]
  73. Bowles, J.F.W.; Suárez, S. The formation of alluvial platinum-group minerals: Present knowledge and the way ahead. Mineral. Mag. 2021, 85, 12–21. [Google Scholar] [CrossRef]
  74. Morrison, G.W.; Rose, W.J.; Jaireth, S. Geological and geochemical controls on the silver content (fineness) of gold in gold-silver deposits. Ore Geol. Rev. 1991, 6, 333–364. [Google Scholar] [CrossRef]
  75. McDonald, A.S.; Sistare, G.H. The metallurgy of some carat gold jewellery alloys. Gold Bull. 1978, 11, 66–73. [Google Scholar] [CrossRef]
  76. Murzin, V.V.; Malyugin, A.A. New data on the instability of natural solid solutions of the gold–silver–copper system at temperatures below 350 °C. Dokl. Acad. Sci. USSR Earth Sci. Sect. 1983, 269, 723–724. [Google Scholar]
  77. Lang, J.R.; Baker, T. Intrusion-related gold systems: The present level of understanding. Miner. Depos. 2001, 36, 477–489. [Google Scholar] [CrossRef]
  78. Mathieu, L. Intrusion-Associated Gold Systems and Multistage Metallogenic Processes in the Neoarchean Abitibi Greenstone Belt. Minerals 2021, 11, 261. [Google Scholar] [CrossRef]
  79. Cabri, L.J. The distribution of trace precious metals in minerals and mineral products. Mineral. Mag. 1992, 56, 289–308. [Google Scholar] [CrossRef]
  80. Barnes, S.J.; Cruden, A.R.; Arndt, N.; Saumur, B.M. The mineral system approach applied to magmatic Ni–Cu–PGE sulphide deposits. Ore Geol. Rev. 2016, 76, 296–316. [Google Scholar] [CrossRef]
  81. Berhe, S.M. Ophiolites in northeast and east Africa: Implications for Proterozoic crustal growth. J. Geol. Soc. Lond. 1990, 147, 41–57. [Google Scholar] [CrossRef]
  82. Stern, R.J.; Johnson, P.; Kröner, A.; Yibas, B. Neoproterozoic Ophiolites of the ArabianNubian Shield. In Precambrian Ophiolites and Related Rocks; Kusky, T.M., Ed.; Elsevier: Amsterdam, The Netherlands, 2004. [Google Scholar]
  83. Cabri, L.-J.; Oberthür, T.; Keays, R.R. Origin and depositional history of platinum-group minerals in placers–A critical review of facts and fiction. Ore Geol. Rev. 2022, 144, 104733. [Google Scholar] [CrossRef]
  84. Cabri, L.J.; Harris, D.C. Zoning in Os-Ir alloys and the relation of the geological and tectonic environment of the source rocks to the bulk Pt: (Pt + Ir + Os) ratio for placers. Can. Mineral. 1975, 13, 266–274. [Google Scholar]
  85. Abdel-Karim, A.M.; Ahmed, Z. Possible origin of the ophiolites of Eastern Desert of Egypt from geochemical prospectives. Arab. J. Sci. Eng. 2010, 35, 115–143. [Google Scholar]
  86. Augustithis, S.S. Mineralogical and geochemical studies of the platiniferous dunite-birbirite-pyroxenite complex of Yubdo, Birbir, W. Ethiopia. Chem. Der Erde 1965, 24, 159–196. [Google Scholar]
  87. Ottemann, J.; Augustithis, S.S. Geochemistry and origin of “platinum-nuggets” in lateritic covers from ultrabasic rocks and birbirites of W. Ethiopia. Miner. Depos. 1967, 1, 269–277. [Google Scholar] [CrossRef]
  88. Bowles, J. The development of platinum-group minerals in laterites. Econ. Geol. 1986, 81, 1278–1285. [Google Scholar] [CrossRef]
  89. Augé, T.; Legendre, O. Platinum-group element oxides from the Pirogues ophiolitic mineralization, New Caledonia; origin and significance. Econ. Geol. 1994, 89, 1454–1468. [Google Scholar] [CrossRef]
  90. Aiglsperger, T.; Proenza, J.; Font-Bardia, M.; Baurier-Aymat, S.; Galí, S.; Lewis, J.; Longo, F. Supergene neoformation of Pt-Ir-Fe-Ni alloys: Multistage grains explain nugget formation in Ni-laterites. Miner. Depos. 2017, 52, 1069–1083. [Google Scholar] [CrossRef]
  91. Abrajano, T.A.; Pasteris, J.D. Zambales ophiolite, Philippines. II. Sulfide petrology of the critical zone of the Acoje Massif. Contrib. Mineral. Petrol. 1989, 103, 64–77. [Google Scholar] [CrossRef]
Figure 1. Satellite map showing: (a) the location of black sand deposits on Egypt’s Mediterranean coast; (b) the locations of Abu Khashaba beach area; (c) sampling profiles.
Resources 13 00109 g001
Figure 2. Stereomicrographs showing the shape of gold grains: (a) gold grains of different colors (maybe due to the variable inclusions), sizes, and shapes; they enclose straight or folded bands of various inclusions; (b) regular and irregular outline, and regular and irregular topography discoid; (c) elongated and ornamented micro folded flakes; (d) hammered rod-like or wires; (e) SEM/EDX and BSE image of subrounded discoid grain contains minor inclusion of Si and Cu; (f) SEM/EDX and BSE image of nuggets with small crystal shapes of some faceted areas and holes (arrowed).
Resources 13 00109 g002
Figure 3. (a,b) Stereomicrographs showing spherical and platy silver grains; (c) SEM/EDX and BSE images of the analyzed silver grains.
Resources 13 00109 g003
Figure 4. (a,b) Stereomicrographs showing silvery white grains of IPGMs’ alloy grains and sperrylite; (c,d) SEM/EDX and BSE images of the analyzed PGMs’ grain and sperrylite euhedral crystal.
Resources 13 00109 g004
Figure 5. (ad) Stereomicrographs showing black and red copper grains with different habits; (eh) stereomicrographs of polished sections of spherical copper grains of variable sizes, shapes, and rims; (i,j) EDX and BSE images of copper and cuprite grains.
Resources 13 00109 g005
Figure 6. Stereomicrographs of native lead grains showing: (a) spherical, elongated, and drop-like; (b) straw yellow and blackish spherical; (c,d) polished sections of lead grains; (e) galena grains; (f) ochrolite grains; (g,h) minium mineral grains; (i) SEM/EDX and BSE images of the analyzed native lead (grains 1–8 Table 7).
Resources 13 00109 g006
Figure 7. Plot of composition of the studied Au–Ag–Cu alloy particles on a phase schematic color diagram.
Resources 13 00109 g007
Table 1. Morphological characteristics of gold, silver, copper, lead, and PGMs’ mineral grains in Abu Khashaba placer deposits using the criteria adopted by Townley et al. [19].
Mineral GrainsSize (µm)ShapeOutlineSurfaceColorRimInclusions
Gold0.12 × 0.13 to 0.2 × 0.32Angular,
subangular (abraded)
Irregular, regularRegular,
irregular
Pale to dark yellowDiscontinuous to absentApachite
0.08 × 0.25 to 0.15 × 0.30Subround,
elongate
IrregularRegular,
irregular
Pale to very dark yellowAbsent to discontinuousQuartz
0.12 × 0.15 to 0.18 × 0.21Round to
well round
Regular, irregularRegularPale to very dark yellowAbsent to discontinuousMagnetite,
Cu
0.06 × 0.10DiscoidRegularRegularPale yellow to yellowAbsentApachite
0.05 × 0.15FlakeRegular, irregularVery regular
(folded)
Pale yellow to yellowAbsent-
0.008 × 0.10 to 0.010 × 0.30Rod-likeRegular, irregularRegular
(hammered)
Pale yellow to yellowAbsent-
Silver0.03 × 0.15 to 0.70 × 0.20Elongate,
sheaf-like
Regular,
irregular
Regular,
irregular
Shiny blackSometimes presentQuartz, acanthite (argentite)
0.04 × 0.04 to 0.13 × 0.13SphereRegularRegularSilvery whiteAbsentQuartz, platinum,
ilmenite, titanite
PGMs0.13 × 0.4 to 0.2 × 0.5Angular to
elongate
Regular,
irregular
Regular,
irregular
Silvery white-Arrojadite,
ilmenite
0.12 × 0.05 to 0.22 × 0.06Elongate particles, euhedral crystalsRegular,
irregular
Regular,
irregular
White-Apachite,
galena
Copper0.05 × 0.05 to 0.12 × 0.12,
0.10 × 0.05 to 0.20 × 0.10
Sphere to
ovoid
RegularRegularReddish brown to blackContinuous to
discontinuous
Quartz,
titanite,
sphalerite
0.05 × 0.03 to 0.08 × 0.05Drop-likeRegularRegularDark brown to blackContinuous to
discontinuous
Millerite,
galena
0.07 × 0.03,
0.17 × 0.04 to 0.10 × 0.02
Cocoon to
bone-like
RegularRegularBrown to blackAbsentQuartz,
magnetite,
sphalerite
Lead0.4 × 0.4 to 0.10 × 0.10,
0.0.7 × 0.04 to 0.15 × 0.10
Sphere to ovoidRegularRegularStraw yellow to light brownContinuous to
discontinuous
Apachite,
ilmenite
0.03 × 0.01 to 0.10 × 0.04Drop-likeRegularRegularDark brown to blackContinuous to
discontinuous
Titanite
0.05 × 0.02CocoonRegularRegularStraw yellow to red.DiscontinuousApachite
Table 2. Chemical analysis using EMPA and SEM/EDX data (wt.%) of native gold grains.
ElementEMPASEM/EDX
G.11G.12G.13G.14Av.4G.1G.2G.3G.4Av.4
Au94.1196.2195.1898.5596.0199.0298.2095.4795.9097.15
Ag2.322.101.761.281.860.101.020.500.660.57
Cu3.151.431.450.161.870.200.502.080.860.91
Si-----0.680.281.282.581.20
Mg-------0.67-0.67
Total99.5899.7498.3999.9999.73100.00100.00100.00100.00-
Fineness975.94978.64981.84987.18981993.2997.2959.7965.6978.9
Table 3. Chemical analysis using EMPA and SEM/EDX data (wt.%) of native silver grains.
ElementEMPASEM/EDX
G.21G.22G.23G.24Av.4G.1G.2G.3Av.3
Ag75.5688.1371.6695.3482.6798.4245.6453.0565.70
Pb3.855.576.141.504.27-4.486.725.60
Ir9.863.758.460.115.55-16.83-16.83
Se3.16-4.67-3.93-4.47-4.47
Ga------4.25-4.25
Si-----1.5819.3317.3112.74
Y-------8.628.62
Ca------4.826.225.52
Ti------0.180.550.37
FeT3.120.683.671.042.13--1.551.55
Ni1.451.323.501.061.83--2.172.17
Bi-------3.813.81
Total98.0099.4599.1099.05100.38100.00100.00100.00-
Table 4. Chemical analysis using EMPA and SEM/EDX data (wt.%) of PPGM alloy grains.
ElementEMPASEM/EDX
G.61G.62G.63G.64Av.4G.1G.2Av.2
Pt40.8844.5445.7642.8943.5243.6746.4145.05
Ru16.1113.3213.6515.3214.6015.9312.4514.19
Os28.4424.6726.4325.6526.3026.5025.1825.84
Ir8.1311.0710.5310.4310.079.0910.229.66
Cu0.110.100.140.100.12---
Pb5.214.983.385.264.714.815.715.26
FeT0.100.120.100.150.12---
Total98.9198.8099.9999.8099.94100.00100.00100.00
100Pt/(Pt+Ir+Os)52.7850.4555.3254.3154.4755.1056.7355.93
Table 5. Chemical analysis using EMPA and SEM/EDX data (wt.%) of sperrylite grains.
ElementEMPASEM/EDX
G.71G.72G.73Av.3G.1G.2Av.2
Pt54.7655.8754.8855.1756.4255.5455.98
As42.5541.2142.6542.1441.7943.4442.62
Au1.541.781.891.741.751.021.39
FeT0.180.100.150.11---
Ca0.150.540.180.290.04-0.04
S0.220.200.150.19---
Total99.4099.7099.9099.64100.00100.00100.00
Table 6. Chemical analysis using EMPA and SEM/EDX data (wt.%) of native copper and cuprite grains.
ElementEMPASEM/EDX
Native CopperCuprite
G.31G.32G.33G.34Av. 4G.1G.2G.3G.4Av. 4G.1G.2G.3Av. 3
Cu90.7895.1492.5498.4294.2298.1291.6899.2579.1692.0585.5083.9385.7285.07
O----------11. 2210.0510.0310.43
Ag0.550.430.210.200.350.67---0.67----
Ca-----1.220.73-0.981.01----
Al1.300.301.100.500.80-0.63-4.572.6----
Si1.000.201.00-0.73-1.97-6.594.280.250.550.100.30
S1.501.000.80-1.10-1.24-1.601.42----
Ti------1.48-2.390.89----
FeT1.890.551.080.170.92-0.80-1.721.940.270.850.150.42
Ni1.151.221.740.501.15-0.40-0.720.28----
Zn1.000.480.530.230.56-1.68-3.840.56----
Cl------0.630.751.000.792.694.223.923.61
Sr----------0.070.400.080.18
Total99.1899.3299.0099.5699.83100.00100.00100.00-100.00100.00100.00100.00100.00
Table 7. Chemical analysis using EMPA and SEM/EDX data (wt.%) of spherical grains’ native lead grains.
ElementEMPASEM/EDX
G.41G.42G.43G.44Av.4G.1G.2G.3G.4G.5G.6G.7G.8Av.8
Pb93.2374.2284.4565.1579.26100.097.1075.5283.9183.2463.5459.6493.8681.75
Si2.166.611.178.164.52-2.903.904.401.979.441.773.954.05
Mg0.404.436.123.123.52--2.415.547.431.7111.57-5.73
Al0.331.101.434.131.75--1.141.962.563.854.40-2.78
P1.212.150.204.251.95--6.60--7.72--7.16
Ca1.322.282.501.341.86--8.360.981.4310.320.361.193.77
Ti0.320.300.342.130.77--0.67---20.44-10.56
FeT0.113.660.502.331.65--1.39--3.42--2.41
Cr0.602.222.061.781.67---2.172.42---2.30
Cu0.402.431.162.171.54---1.050.95-1.72-1.24
Total100.0899.3199.9398.5698.49100.0100.0100.00100.0100.0100.0100.0100.0-
Table 8. Chemical analysis using EMPA and SEM/EDX data (wt.%) of spherical grains of ochrolite mineral.
ElementEMPASEM/EDX
G.51G.52Av.2G.1G.2Av.2
Pb74.1276.1375.1275.4375.1575.04
Sb17.3416.9817.1618.1318.6518.39
Si0.881.231.060.901.301.10
Al0.680.730.710.780.570.68
Ti0.560.650.610.690.730.71
FeT1.431.541.491.121.661.39
Cu0.420.650.540.220.570.40
Sr0.110.230.170.27-0.27
Cl2.541.321.932.451.902.18
Total98.0899.4698.79100.00100.00-
Disclaimer/Publisher’s Note: The statements, opinions and data contained in all publications are solely those of the individual author(s) and contributor(s) and not of MDPI and/or the editor(s). MDPI and/or the editor(s) disclaim responsibility for any injury to people or property resulting from any ideas, methods, instructions or products referred to in the content.

