Article

Development of Effervescent Cleansing Tablets Containing Asiatic-Acid-Loaded Solid Lipid Microparticles

by
Lucy Mang Sung Thluai
1,2,
Varin Titapiwatanakun
1,2,
Warintorn Ruksiriwanich
3,4,5,
Korawinwich Boonpisuttinant
6 and
Romchat Chutoprapat
1,2,*
1
Pharmaceutical Sciences and Technology Program, Faculty of Pharmaceutical Sciences, Chulalongkorn University, Bangkok 10330, Thailand
2
Department of Pharmaceutics and Industrial Pharmacy, Faculty of Pharmaceutical Sciences, Chulalongkorn University, Bangkok 10300, Thailand
3
Department of Pharmaceutical Sciences, Faculty of Pharmacy, Chiang Mai University, Chiang Mai 50200, Thailand
4
Center of Excellence in Agro Bio-Circular-Green Industry (Agro BCG), Agro-Industry, Chiang Mai University, Chiang Mai 50100, Thailand
5
Lanna Rice Research Center, Chiang Mai University, Chiang Mai 50200, Thailand
6
Innovative Natural Products from Thai Wisdoms (INPTW), Faculty of Integrative Medicine, Rajamangala University of Technology Thanyaburi, Thanyaburi 12130, Thailand
*
Author to whom correspondence should be addressed.
Cosmetics 2023, 10(6), 148; https://doi.org/10.3390/cosmetics10060148
Submission received: 13 September 2023 / Revised: 8 October 2023 / Accepted: 11 October 2023 / Published: 25 October 2023
(This article belongs to the Special Issue Advanced Cosmetic Sciences: Sustainability in Materials and Processes)

Abstract

:
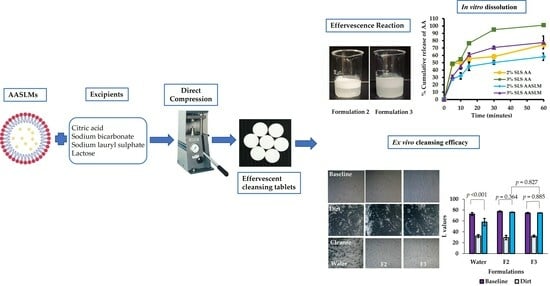
The objective of this study was to develop effervescent cleansing tablets that can be dissolved and turned into liquid soap, which can be used for bathing or soaking the body. The asiatic-acid-loaded solid lipid microparticles (AASLMs) were prepared via the hot emulsification method followed by cold re-solidification and then freeze-dried to obtained dry powder. The physicochemical properties such as morphology and % entrapment efficiency (%EE) were evaluated. The results revealed that AASLMs have an irregular shape, and the %EE for the resulting AASLMs was 92.04 ± 3.43%. The tablets were manufactured via the direct compression technique. The compatibility test was conducted to ensure that the excipients are compatible with the active ingredient. The angle of repose, Carr’s index, and Hausner’s ratio were studied to evaluate the flowability of the powder blend before compression. The weight of each tablet was set to 1000 mg, and physicochemical characteristics, in vitro dissolution, ex vivo cleansing efficacy, and stability were evaluated. The results showed that the active ingredient was compatible with other excipients, as the results obtained from FTIR spectra indicated the absence of potential chemical interaction between the active ingredient and excipients used in this study. Additionally, all formulations had good flow properties. The effervescence times of selected formulations, F2 and F3, were <5 min, with favorable pH and hardness values. The friability values of all formulations exceeded 1% because the excipients used in effervescent tablets are very fragile. The release of asiatic acid (AA) from the tablets was dependent on the concentration of SLS. In an ex vivo test, it was discovered that the developed products F2 and F3 showed much more effective cleansing efficacy than water. Nevertheless, brown spots appeared in the tablets and the AA content was significantly decreased in both tested formulations after 3 months’ storage at 40 ± 2 °C/75% RH ± 5% RH. The stability study revealed that the developed products were not stable at high temperature and humidity. Therefore, it is recommended that the developed effervescent tablets are not stored at a high temperature.

Graphical Abstract

1. Introduction

Cleansing the body is not only essential for maintaining personal hygiene but also for the skin’s appearance and overall health. Regular bathing helps to remove sweat, dirt, and bacteria from the body, reducing the risk of infections and unpleasant body odors. It contributes to a fresh and clean feeling, boosting confidence and well-being [1]. Personal cleansing products have been used by humans for a long time [2] because cleansing the skin alone with water is not sufficient to solubilize the hydrophobic contaminants and impurities found on the skin’s surface [3,4]. Accordingly, cleansers containing various ingredients that can benefit consumers are being manufactured [5]. However, a common issue faced by individuals is the difficulty of carrying out cleansing rituals while travelling due to the bulky packaging of the products. Recognizing the limitations of these products in terms of portability, innovative alternatives have emerged to address this challenge. One such solution for potential consumer preference and market trends is cleansing tablets or bath tablets. Effervescent tablets are a promising formulation, as they can be dispersed or dissolved in water while retaining properties such as easy portability, high stability, and precise dosing. By carefully selecting the acid and base constituents, the pH value of the liquid following effervescence reaction can be controlled within the desired range [6]. The pH of cleanser is an important factor to be considered, as it may contribute to stratum corneum (SC) damage. For example, research findings have shown that when the pH of cleansers is highly alkaline (>8), it leads to observable swelling of the skin’s protein [7,8]. This swelling can adversely affect the skin barrier function by disrupting the natural moisturizing factor that retains water in the skin [9]. Additionally, the highly alkaline pH of cleansers can cause the ionization of fatty acids in the lipid bilayers, thus causing destabilization of the lipid bilayers [8]. Therefore, cleansing products with a pH of 4 to 7 are recommended to maintain the skin’s pH, which is slightly acidic, approximately between 4 and 6, and protect the stratum corneum [10,11]. Recently, cleanser products composed of plant-derived active ingredients have become more popular due to their biological activities [12].
Asiatic acid (AA) is a naturally occurring pentacyclic triterpenoid and has many biological activities, such as antimicrobial, antioxidant, anti-inflammatory, and wound healing [13,14], which benefit various dermatological conditions, such as acne [15] and atopic dermatitis [16], thus attracting it enormous interest for use in cosmetics [17]. AA has been shown to effectively modulate the intercellular concentrations of reactive oxygen species (ROS) by reducing free radicals and decreasing H2O2-related cell death [18]. There are various studies that have determined the anti-inflammatory effects of AA and confirmed its effectiveness against inflammation [13]. AA is a highly lipophilic molecule that is poorly soluble in water (0.0598 mg/L at 25 °C) and has a log p-value of 5.7. It undergoes rapid metabolism resulting in poor bioavailability [14]. The formulation techniques with colloidal systems significantly increase the stability of hydrophilic and lipophilic compounds [19]. Among them, solid lipid microparticles are one of the carrier types commonly used in topical formulations [20].
SLMs are lipid-based carrier systems with a micro size range; they constitute glyceride, fatty alcohol, fatty acid, solid wax, and surfactants. SLMs can deliver lipophilic drugs with high entrapment efficiency. The solid matrix of SLMs forms a protecting wall that is generally resistant to adverse environments. Thus, it can protect the incorporated drugs from degradation [21]. The excipients used in SLMs are generally recognized as safe (GRAS) and are biocompatible and biodegradable. Moreover, SLMs can be produced on a large industrial scale with adequate physical and chemical stability, and they are cost-effective [22,23]. SLM carriers could promote the solubility of AA by incorporating it into their lipid matrix and consequently enhancing the passage of the drug to the target sites.
The tablet form of cleansing products is one of the novel cleanser formulations. It has a compact size and contains active ingredients and other excipients. The effervescent tablet (ET) formulations are designed to dissolve in water, resulting in the rapid release of active ingredients and the release carbon dioxide bubbles due to the chemical reaction that occurs between effervescent components, i.e., acid and alkali components, when they come into contact with water [24]. The reaction occurs even with a small amount of water because water is the stimulator, which accelerates the reaction rate. Consequently, the process must be carried out in low-humidity areas [24,25,26]. Effervescent tablets are formulated by mixing the active ingredients, effervescent agents, lubricants, and diluents and then compressing them into tablets. Therefore, the selection of excipients and manufacturing techniques is crucial to consistently maintain the finished product’s efficacy, quality, safety, and stability. Super disintegrants do not need to be incorporated into effervescent tablet formulations because the release of carbon dioxide accelerates the tablet disintegration process [24]. Compatibility studies between the active compound and each excipient are essential in formulation development because there could be chemical or physical interactions between the active ingredient and other excipients. The physicochemical characterization of the tablets, including effervescence time, pH, hardness, moisture content, and drug content, must be considered and controlled [25]. The tablets can be manufactured using direct compression, wet granulation, and dry granulation techniques. The direct compression technique is widely used because it is the easiest method to manufacture tablets. Additionally, this method offers several advantages over other manufacturing processes, including less material handling, fewer equipment requirements, a reduced number of processing steps, a decreased risk of contamination, increased productivity, faster production times, and lower manufacturing costs. These advantages make it a preferable choice [6,27]. Moreover, this technique is well-suited for manufacturing effervescent tablets as it avoids exposure to heat and moisture, unlike other methods. In the context of tabletability, good flowability of a dry powder blend is an essential factor for the direct compression technique [28]. This study aimed to develop effervescent cleansing tablets using a direct compression technique and evaluate physicochemical parameters, in vitro dissolution, ex vivo cleansing efficacy, and stability of developed tablet formulations.

2. Materials and Methods

2.1. Materials

Asiatic acid (95%) was obtained from SEPPIC, France. Polysorbate 80 (Tween 80), dimethyl sulfoxide (DMSO), brain–heart infusion (BHI) broth and clindamycin were bought from Merck, Darmstadt, Germany. L-α lecithin soybean (soybean lecithin with purity > 94% phosphatidylcholine and <2% triglycerides) was obtained from Sigma-Aldrich, St. Louis, MI, USA. Dextrose anhydrous and poloxamer 188 were purchased from Loba Chemie Pvt. Ltd., India and BASF, Florham Park, NJ, USA, respectively. Cetyl alcohol, citric acid anhydrous and sodium bicarbonate were obtained from Ajax Finechem, Sydney, New South Wales, Australia. Sodium lauryl sulphate (SLS) was obtained from Srichand United Dispensary Co., Ltd., Bangkok, Thailand. Lactose monohydrate was obtained from DFE Pharma, Kelver Str, Goch, Germany. Acetonitrile (99.9%), trifluoroacetic acid (99%), methanol (99.9%), and absolute ethanol (99.9%) were purchased from RCI Labscan Co., Ltd., Bangkok, Thailand. All other chemicals used were of analytical grade.

2.2. Methods

2.2.1. Preparation of Asiatic-Acid-Loaded Solid Lipid Microparticles (AASLMs)

Asiatic-acid-loaded solid lipid microparticles (AASLMs) were prepared by using the hot emulsification method, followed by cold re-solidification. The lipid phase (15% w/w cetyl alcohol, 0.01% w/w AA in 1.5% w/w ethanol) was mixed with the aqueous phase (3% w/w poloxamer 188 and 5% w/w dextrose in distilled water) at 70 °C using a high-shear homogenizer (Ultra-Turrax T25 Janke-Kunkel, IKA Labortechnik, Staufen, Germany) at a rate of 8000 rpm for 5 min. Following that, the sample was placed in ice water and stirred continuously for 5 min. Then, the sample was stored in a freezer (−78 °C) for 24 h and lyophilized using a freeze-dryer (Labconco Lyophilizer, Kansas, MO, USA) to obtain water-free SLMs [29,30,31]. Subsequently, the resulting AASLM powders were passed through a 20-mesh sieve, transferred to a tightly closed amber container, and stored at room temperature for further use.

Morphological Analysis

The shape of AASLMs before freezing and after redispersion was inspected using an optical microscope (Olympus, U-HSEXP, SN 2C51931, Shinjuku Monolith, Tokyo, Japan) [22].

Determination of Drug Entrapment Efficiency (%EE)

Entrapment efficiency (EE%) is the amount of drug entrapped in the formulation, which is determined by separating the unentrapped drug from the solid lipid microparticles using the ultracentrifugation method. AASLMs powder (1 g) was redispersed in distilled water (4 g), vortexed for 5 min, and sonicated for 5 min. Then, 8 mL of the prepared sample was centrifuged at 65,000 rpm, 4 °C (Hitachi, CP 100NX Ultracentrifugation, Tokyo, Japan) for 1.5 h. Afterward, 1 mL of the supernatant was collected and filtered using a 0.22 µm syringe filter to remove impurities and assayed using the HPLC method. The sediment (0.35 g) was diluted with methanol, and the volume was adjusted to 5 mL. Then, 1 mL of the sample was filtered using a 0.22 µm size syringe filer and assayed using high-performance liquid chromatography (HPLC). The drug entrapment efficiency in the microparticles was calculated using the following equation [32]:
%   E n t r a p m e n t   e f f i c i e n c y E E = W   a c t u a l   d r u g W   t h e o r y   d r u g × 100 %
W actual drug = the actual amount of AA entrapped in SLM, or the amount of AA analyzed from the sediment.
W theory drug = the total amount of AA from the theoretical formulation.

2.2.2. Selection of Effervescent Agents’ Ratio

The selection of effervescent components and their ratios was based on the neutralization of acids and alkalis (citric acid and sodium bicarbonate) within the permissible limits. To screen these effervescent components, molar ratios of citric acid and sodium bicarbonate, specifically 1:2, 1:2.5, and 1:3 (as indicated in Table 1), were combined with varying concentrations of sodium lauryl sulphate (SLS), AASLMs, and lactose. These ratios were chosen with the intention of controlling the pH of the resulting liquid and recognizing that other excipients in the formulation could potentially assist in neutralizing the reaction. The resulting powder blend was then compressed into tablets using a hydraulic tablet press machine (Carver, Model 4350. L, S/N 4350-1035, Cleveland, OH, USA) with a stainless-steel die (13.0 mm in diameter) and a stainless-steel round flat-faced punch at a fixed compression pressure of 2 Kp. Subsequently, the compressed tablets were then evaluated for their effervescence time, hardness, and pH value. The optimal acid-to-base ratio was selected for the next stages of formulation development.

2.2.3. Study of Powder Blend before Compression

Compatibility Study

A drug and excipient compatibility study was conducted using Fourier transform infrared spectroscopy (FTIR) (Thermo Scientific model Nicolet iS10, Madison, WI, USA) with the Attenuated Total Reflectance (ATR) technique. FTIR analysis was performed to assess the physicochemical interaction of the drug (AASLM) with the excipients. A homogeneous powder mixture, consisting of an equal amount of AASLMs and each excipient used in the formation (1:1 ratio), was prepared and placed in the diamond plate crystal holder. The spectrum was scanned within a spectral range of 4000–650 cm−1, with a scan speed of 64 and a resolution of 4 cm−1. The evaluation was performed at room temperature [33].

Angle of Repose

The angle of repose (α) of the powder blends was determined using the funneling method. During the assay, the funnel outlet was initially block using paper, and the funnel was filled with the powder blend. The outlet was then unblocked, and the powder was allowed to fall freely. Subsequently, the height and radius of the pile of the powder formed were measured. The angle of repose was calculated as follows:
T a n   α = H e i g h t   o f   t h e   p o w d e r   m a s s   ( H ) R a d i u s   o f   t h e   p o w d e r   m a s s   ( R )

Bulk Density

A certain weight of powder (11 g) was poured into a 25 mL measuring cylinder. The actual level of powder was maintained without compacting, and the untapped apparent volume was measured. The bulk density was calculated according to the formula given below:
B u l k   d e n s i t y = W e i g h t   o f   t h e   p o w d e r   m a s s   U n t a p p e d   v o l u m e   o f   t h e   p o w d e r

Tapped Density

The tapped density was measured by first gently introducing a known powder sample mass into a graduated measuring cylinder. The cylinder was then mechanically tapped using a tapped density tester that provides a suitable fixed drop distance and nominal drop rate. Then, the tapped volume near the graduated units was noted [34]. The tapped density of the powders was calculated using the following formula:
T a p p e d   d e n s i t y = W e i g h t   o f   t h e   p o w d e r   m a s s T a p p e d   v o l u m e   o f   t h e   p o w d e r

Carr’s Index

Carr’s index value of the powder was determined by utilizing the values of tapped density and bulk density, as per the following formula:
C a r r s   I n d e x   r a t i o = T a p p e d   d e n s i t y B u l k   d e n s i t y T a p p e d   d e n s i t y × 100

Hausners’ Ratio

Hausner’s ratio was determined from the values of the tapped density and bulk density using the formula given below:
H a u s n e r s   R a t i o = T a p p e d   d e n s i t y B u l k   d e n s i t y
The relationship of the angle of repose, Carr’s index, and Hausner’s ratio with powder flowability is outlined in Table 2 [31,35].

2.2.4. Production of Effervescent Cleansing Tablets Using Direct Compression Technique

The composition of the effervescent cleansing tablet containing AASLMs (F1–F5) is presented in Table 3. In brief, the AASLMs and other excipients were accurately weighed, mixed using bag mixing, and sieve through a 20-mesh sieve. The AASLM powder was manually blended with lactose for 5 min. Then, citric acid and sodium bicarbonate were added to the mixture and mixed for 5 min before blending with SLS for 2 min prior to compression. The powder blend was passed through a 20-mesh sieve to disperse any agglomerates. The powder blend was compressed into tablets by using a single-punch tableting machine (Bangkok, Thailand) with a stainless-steel die (13.0 mm in diameter) and a stainless-steel round flat-faced punch, applying a fixed compression force of 4–5 Kp. In the single-punch tableting process, the fill depth was adjusted to achieve a weight of 1000 mg manually, and the tablet’s hardness was controlled by adjusting the height of the upper punch. Subsequently, the powder was poured into the feeder bucket and compressed automatically. The resulting tablets were packed in aluminum zip-lock bag with silica gel and kept at room temperature before further evaluation [36].

2.2.5. Characterization of Effervescent Tablets

Physical Appearance

The product’s appearance was visually observed.

Measurement of Diameter and Thickness of Tablets

Ten tablets were randomly selected from each formulation, and their diameters and thicknesses were measured individually using a digital caliper (China). The results were expressed as the mean (SD).

Measurement of Tablet Hardness

Tablet hardness indicates the tablet’s ability to withstand mechanical shocks encountered during handling. Ten tablets from each formulation were individually assessed for hardness using a hardness tester (Dr. Schleuniger, Model 2E, Kansas, MO, USA). The force required to break each tablet was measured and expressed in Kp. The average of ten measurements was calculated for each formulation.

Measurement of Weight Variation of Tablets

Twenty tablets from each formulation were selected randomly and weighed individually using an analytical balance (Mettler-Toledo, Model ME303, Greifensee, Switzerland). Then, the mean (SD) was calculated.

Measurement of Tablet Friability

The friability of tablets was measured using a friability tester (Erweka, Model TAR 10, Langen, Germany). Briefly, 10 tablets were dedusted, accurately weighed, and placed into the drum of the friability tester, operating at 25 rpm for 4 min. Subsequently, the rotated tablets were dedusted and reweighed [25,26]. The percentage of tablet friability was calculated using the following equation:
F r i a b i l i t y   ( % ) = I n i t i a l   w e i g h t   o f   t a b l e t s     f i n a l   w e i g h t   o f   t a b l e t s I n i t i a l   w e i g h t   o f   t a b l e t s × 100

Measurement of Moisture Contents of Tablets

The moisture content of the tablets was measured by using a halogen moisture analyzer (Mettler-Toledo Ltd., Model HR83, Leicester, UK). Ten tablets from each formulation were ground into powder, and 3 g of the powder was placed in an aluminum sample pan and dried at a temperature of 105 °C until a constant weight was achieved. The measurements were performed in triplicate. The results were expressed as the mean (SD). A moisture content of ≤0.5% was considered acceptable [37].

Determination of Effervescence Time of Tablets

A single tablet was placed into a beaker containing 10 mL of purified water at room temperature, and the effervescence time was measured using a stopwatch. The effervescence time was recorded once all solid tablet materials had completely disappeared. Six tablets from each formulation were measured for effervescence time, and the average of six measurements was calculated for each formulation [38]. An effervescence time of less than 5 min was considered acceptable.

Measurement of pH of Tablets

A single tablet was dissolved in 10 mL of water at room temperature, and the pH of the resulting solution was measured using a pH meter (Mettler Toledo, Model FP20, Greifensee, Switzerland). The pH value was determined as an average of three measurements.

Determination of % Label Amount of Asiatic Acid (AA)

Ten tablets were randomly selected, weighed, and ground into fine powder using a mortar and pestle. The fine powder was then transferred to a centrifuge tube and dissolved in methanol, with the volume made up to 10 mL [39]. The resulting suspension was sonicated for 5 min and then centrifuged at 10,000 rpm for 30 min. The clear solution obtained was filtered through a 0.22 µm membrane syringe filter. The concentration of AA was determined using high-performance liquid chromatography (HPLC, Agilent 1290 Infinity II, DAD, Waldbronn, Germany) with a column (Osaka soda C18, 5 µm, 150 × 4.6 mm). The mobile phase consisted of 0.05% trifluoroacetic acid (TFA) in ultrapure water and 0.05% TFA in acetonitrile in a 55:45% v/v ratio, respectively. The isocratic mobile phase was filtered with a 0.22 µm nylon filter paper and degassed for 30 min before use. The flow rate was kept constant at 1.2 mL/min, and the sample injection volume was 20 µL. The column temperature was maintained at ambient, and the sample aliquots were detected at a wavelength of 210 nm using a diode array detector (DAD). The total run time was set at 16 min. The %label amount of AA in the tablets was estimated from the regression equation of the AA calibration curve [40,41].

2.2.6. Measurement of In Vitro Dissolution Test

In vitro dissolution of tablets was performed by using USP dissolution test apparatus type I, employing the basket method (Varian Vk 7000, Agilent technologies, Woburn, MA, USA). The dissolution medium consisted of 100 mL of phosphate buffer saline (PBS) at pH 7.4, with the addition of absolute ethanol (95:5 v/v) to maintain a sink condition for AA release. The inclusion of absolute ethanol in the buffer was intentional, as it helps in facilitating the release of AA due to its limited solubility in PBS [42]. The stirring speed was set at 100 rpm, and the temperature was maintained at 37 ± 0.5 °C. At predetermined time intervals (5, 10, 15, 30 and 60 min), aliquots were collected. Subsequently, the samples were stored in a refrigerator and then lyophilized using a freeze-dryer (Labconco Lyophilizer, Kansas, MO, USA) to obtain water-free powder. The collected water-free powder was then dissolved in methanol to produce a concentrated solution. This solution was centrifuged at 10,000 rpm for 30 min. One milliliter of the supernatant was collected and filtered through a 0.22 µm syringe filter and then analyzed using HPLC, following the previously described method. The cumulative percentage release of AA over time was used to construct the drug release profile [43,44]. The experiment was conducted in triplicate, and the average dissolution rate was calculated. The choice of a dissolution medium at pH 7.4 was made to closely simulate the pH of the skin, providing a more accurate assessment of the dissolution behavior and release profile of the active ingredient (AA) from the tablet. By replicating the condition encountered when the tablet dissolves in water, this test aims to evaluate how active ingredients are released.

2.2.7. Ex Vivo Cleansing Efficacy Study

Preparation of Ex Vivo Porcine Skin

In this study, porcine skin was used as a model to assess the cleansing efficacy of the tablets. The skin was obtained from a newborn piglet that did not survive and was stillborn at a local pig farm. The excess hair on the porcine skin was trimmed off and then carefully cut into pieces (15 × 5 cm2) using surgical blades, forceps, and scissors. Subsequently, the prepared skin samples were stored frozen at −20 °C and wrapped in aluminum foil for further use [45].

Preparation of Model Dirt

The model dirt used for the cleansing efficacy study was adapted from the Schrader study [46]. The ingredients included 5 g of mineral oil and 1 g of activated charcoal, which were mixed homogeneously. The activated charcoal was used as a substitute for color.

Preparation of Porcine Skin and Application of Model Dirt

The porcine skin was gently wiped with tissue to remove any excess water. After that, clear plastic squares (1.2 × 1.2 cm2) were cut for three designated sites and pressed onto the porcine skin. A total of 0.05 g of the model dirt was applied to these three designated areas of the porcine skin and evenly spread using a gloved index finger. This process was repeated five times with moderate pressure in a clockwise direction to ensure uniform distribution of the dirt within the tested area. The dirt was allowed to dry for 5 min. For this study, three groups, namely F2, F3, and water, were utilized. For the F2 and F3 formulations, one tablet was dissolved in 10 mL of water and left to dissolve for a minimum of 5 min. Then, 2 mL of each prepared sample (F2, F3, and water) was drawn using a syringe and gradually poured over the skin membrane. The samples were evenly spread using a gloved index finger with moderate pressure and in a clockwise direction, repeating the process 30 times. Subsequently, the skin was rinsed with 15 mL of purified water and wiped with tissue.
The color of the skin was assessed at various timepoints: before the application of the model dirt (baseline), and before and after cleansing with the model dirt in the three groups. The assessment was performed using the Visioscan® VC 20plus and colorimeter CL 400, as detailed in references [47,48]. To evaluate the efficacy of dirt removal, the color of the porcine skin after cleansing was compared to its color before and after the application of the model dirt at the same sites. This experiment was carried out in triplicate, and the data were expressed as the mean (SD).

2.2.8. Stability Study

Stability studies were conducted on the selected tablet formulations. The tablets were packed in plastic tubes with desiccant lids and stored at different temperatures for evaluation at a regular interval over a period of three months. These stability tests were conducted in accordance with the ICH guidelines for climatic zone IV. The tubes containing the samples were stored under three different conditions: 40 ± 2 °C (75% RH ± 5% RH), 25 ± 2 °C, and 4 ± 2 °C for 3 months [49]. At specific time points (0, 1, 2, and 3 months), various physicochemical parameters, including physical appearance, hardness, friability, effervescence time, pH, moisture content, and drug content, were analyzed to assess the stability of the tablets [22].

2.2.9. Statistical Analysis

The results were expressed as the mean (SD). Statistical analysis was performed using IBM SPSS Statistics (version 29). A p-value of less than 0.05 was selected as the level of statistical significance The p-value was calculated through one-way analysis of variance (ANOVA). The Tukey HSD post hoc criteria were employed to analyze possible statistically significant differences among the formulations [36].

3. Results and Discussion

3.1. Characterization of Solid Lipid Microparticles

3.1.1. Morphological Analysis

The morphology of AASLMs’ dispersion before freeze-drying, and the redispersion of the dried powder, is shown in Figure 1. The results reveal that the AASLM dispersion exhibited an irregular shape with a size of 20 µm both before freeze-drying and after redispersion of the dried powder.

3.1.2. Determination of Drug Entrapment Efficiency (%EE)

Entrapment efficiency is a crucial characteristics of SLM that can be assessed through encapsulation efficiency (EE%), which quantifies the total amount of drugs successfully encapsulated within the microparticles [50]. In our study, the %EE of resulting AASLM powder was found to be 92.04 ± 3.43%. This result indicates that a significant amount of drug was successfully incorporated into the SLMs during the preparation. Moreover, it was found that AA content (% label amount) remained at 95.38 ± 0.02%. This result suggests that AA did not undergo significant degradation when exposed to the temperature used during the SLM preparation process (70 °C). Therefore, it can be concluded that the heating process employed did not adversely affect the stability of AA, ensuring the efficacy of the final product, AASLMs.

3.2. Selection of Acid and Base Ratio

The quantity of acid and base ratio was calculated on a molar basis (1:2, 1:2.5, and 1:3). The tablets were allowed to react in tap water and the effervescence time was noted, while the pH of the solution was analyzed. The pH of all the resultant solutions was in the acidic range, between 5.03 ± 0.02 and 6.10 ± 0.09, and their effervescence times ranged from 2.10 ± 0.03 min to 6.52 ± 0.06 min, as shown in Table 4. Formulations with a 1:3 ratio of effervescent agents (B3, B6, B9, B12, B15, and B18) demonstrated the fastest effervescence time (2.10 ± 0.03 min, 3.45 ± 0.05 min, 3.18 ± 0.18 min, 3.01 ± 0.42 min, 3.12 ± 0.09 min, and 5.32 ± 0.12 min, respectively) and achieved the desired pH range (ranging from 5.71 ± 0.02 to 6.10 ± 0.09) for the intended formulation, as shown in Table 4.
Consequently, following careful evaluation and comparison, the citric acid-to-sodium bicarbonate ratio of 1:3 was selected for further study. This choice aligns with various investigations conducted to determine the optimal ratio for achieving effective effervescence time and overall tablet performance. Several studies have explored different effervescent ratios, and the findings consistently point to the superiority of the 1:3 ratio. This specific ratio ensures the complete neutralization of acid and base molecules [6,25,26,34,51,52,53].

3.3. Precompression Study Results

3.3.1. Compatibility of Drug and Excipient according to FTIR

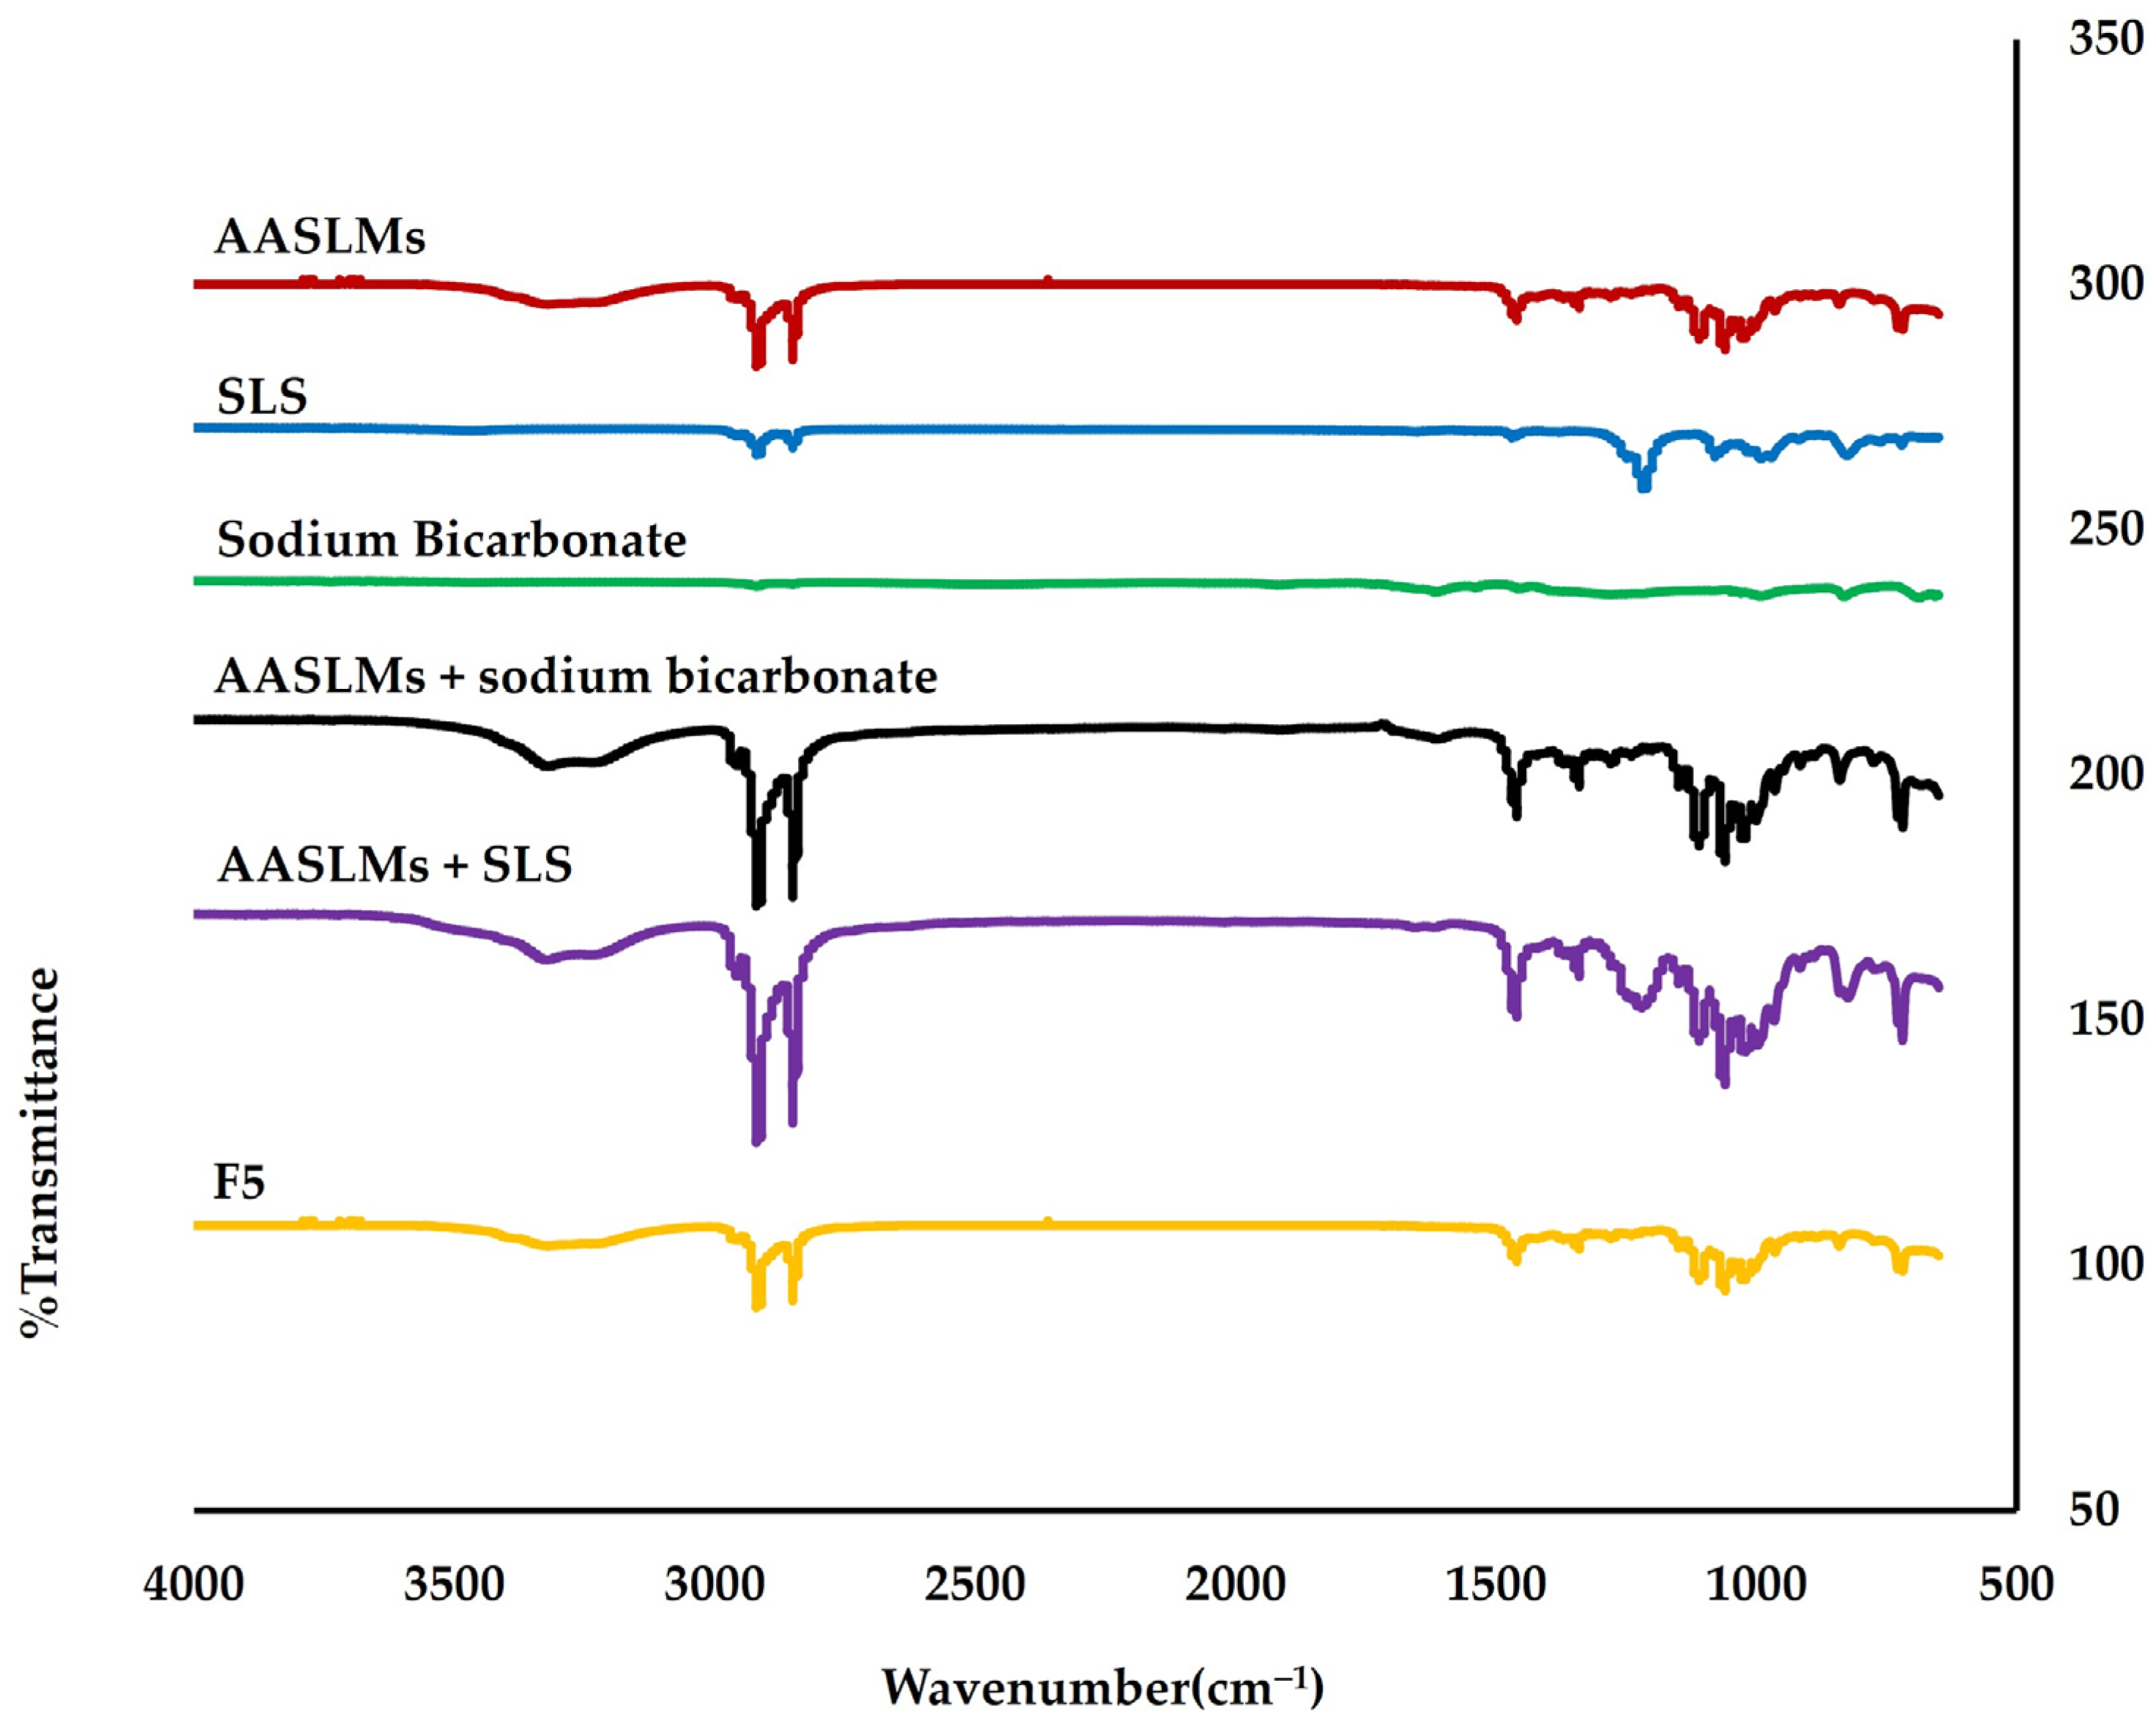
The FTIR spectra of AASLM revealed characteristic peaks at 719, 1050, 1061, 1109 cm−1 (C-O stretching), 1462, 1471 cm−1 (-CH2 stretching), 2847, 2915 cm−1 (C-H stretching), and 3317 cm−1 (-OH stretching) [54,55,56]. The intensity of AASLM peaks increased in the mixture (1:1) with sodium bicarbonate and sodium lauryl sulphate, indicating intermolecular interactions in the mixture [57] (Figure 2). There were no changes in the intensity of AASLM peaks observed in the mixture with citric acid and lactose.
When considering the FTIR spectra of the physical mixture F5, it is noteworthy that the intensity of AASLM peaks increased, with the exception of the peak at 2847 and 2915 cm−1. The observed changes in the spectra of the physical mixture could be attributed to various interactions between AASLM and the excipients used, such as van der Waals forces, dipole interactions, and hydrogen bonds [58]. However, no additional peaks were observed in the physical mixture, indicating the absence of potential chemical incompatibility between AASLM and the excipients used.

3.3.2. Angle of Repose

The angle of repose (°) for all formulations ranged from 16.07 ± 0.45° to 18.04 ± 0.80° (Table 5), indicating excellent flow characteristics of the powders, which are essential for direct compression.

3.3.3. Carr’s Index

Carr’s index is calculated based on the compressibility of the powder, and it depends on its bulk and tap densities. In this study, Carr’s index values of all powder blends ranged from 8.15 ± 2.57% to 11.26 ± 2.19% (Table 5), indicating good flow properties of the powders.

3.3.4. Hausner’s Ratio

Hausner’s Ratio values for all formulations ranged from 1.08 ± 0.03 to 1.11 ± 0.02, as presented in Table 5, indicating good flow properties for all powder blends [34].

3.3.5. Moisture Content before Compression

The moisture content of the powder blend before compression into tablets was between 0.18 ± 0.08% and 0.38 ± 0.03% in all formulations, as shown in Table 5. The moisture content of 0.5% or less was considered acceptable [25,26]. The moisture content of the powder blend before tablet compression is important for successful tablet manufacturing. This is because the moisture content can significantly affect the flowability of the powder blend. To ensure the production of tablets with consistent weight and properties, it is essential for the powder to flow freely and uniformly into the tablet dies.
Therefore, powder blends should be handled with care in humidity-controlled areas. Moisture content may also change during the tablet manufacturing process [59].

3.4. Physicochemical Properties of Effervescent Cleansing Tablets

3.4.1. Physical Appearance of Tablets

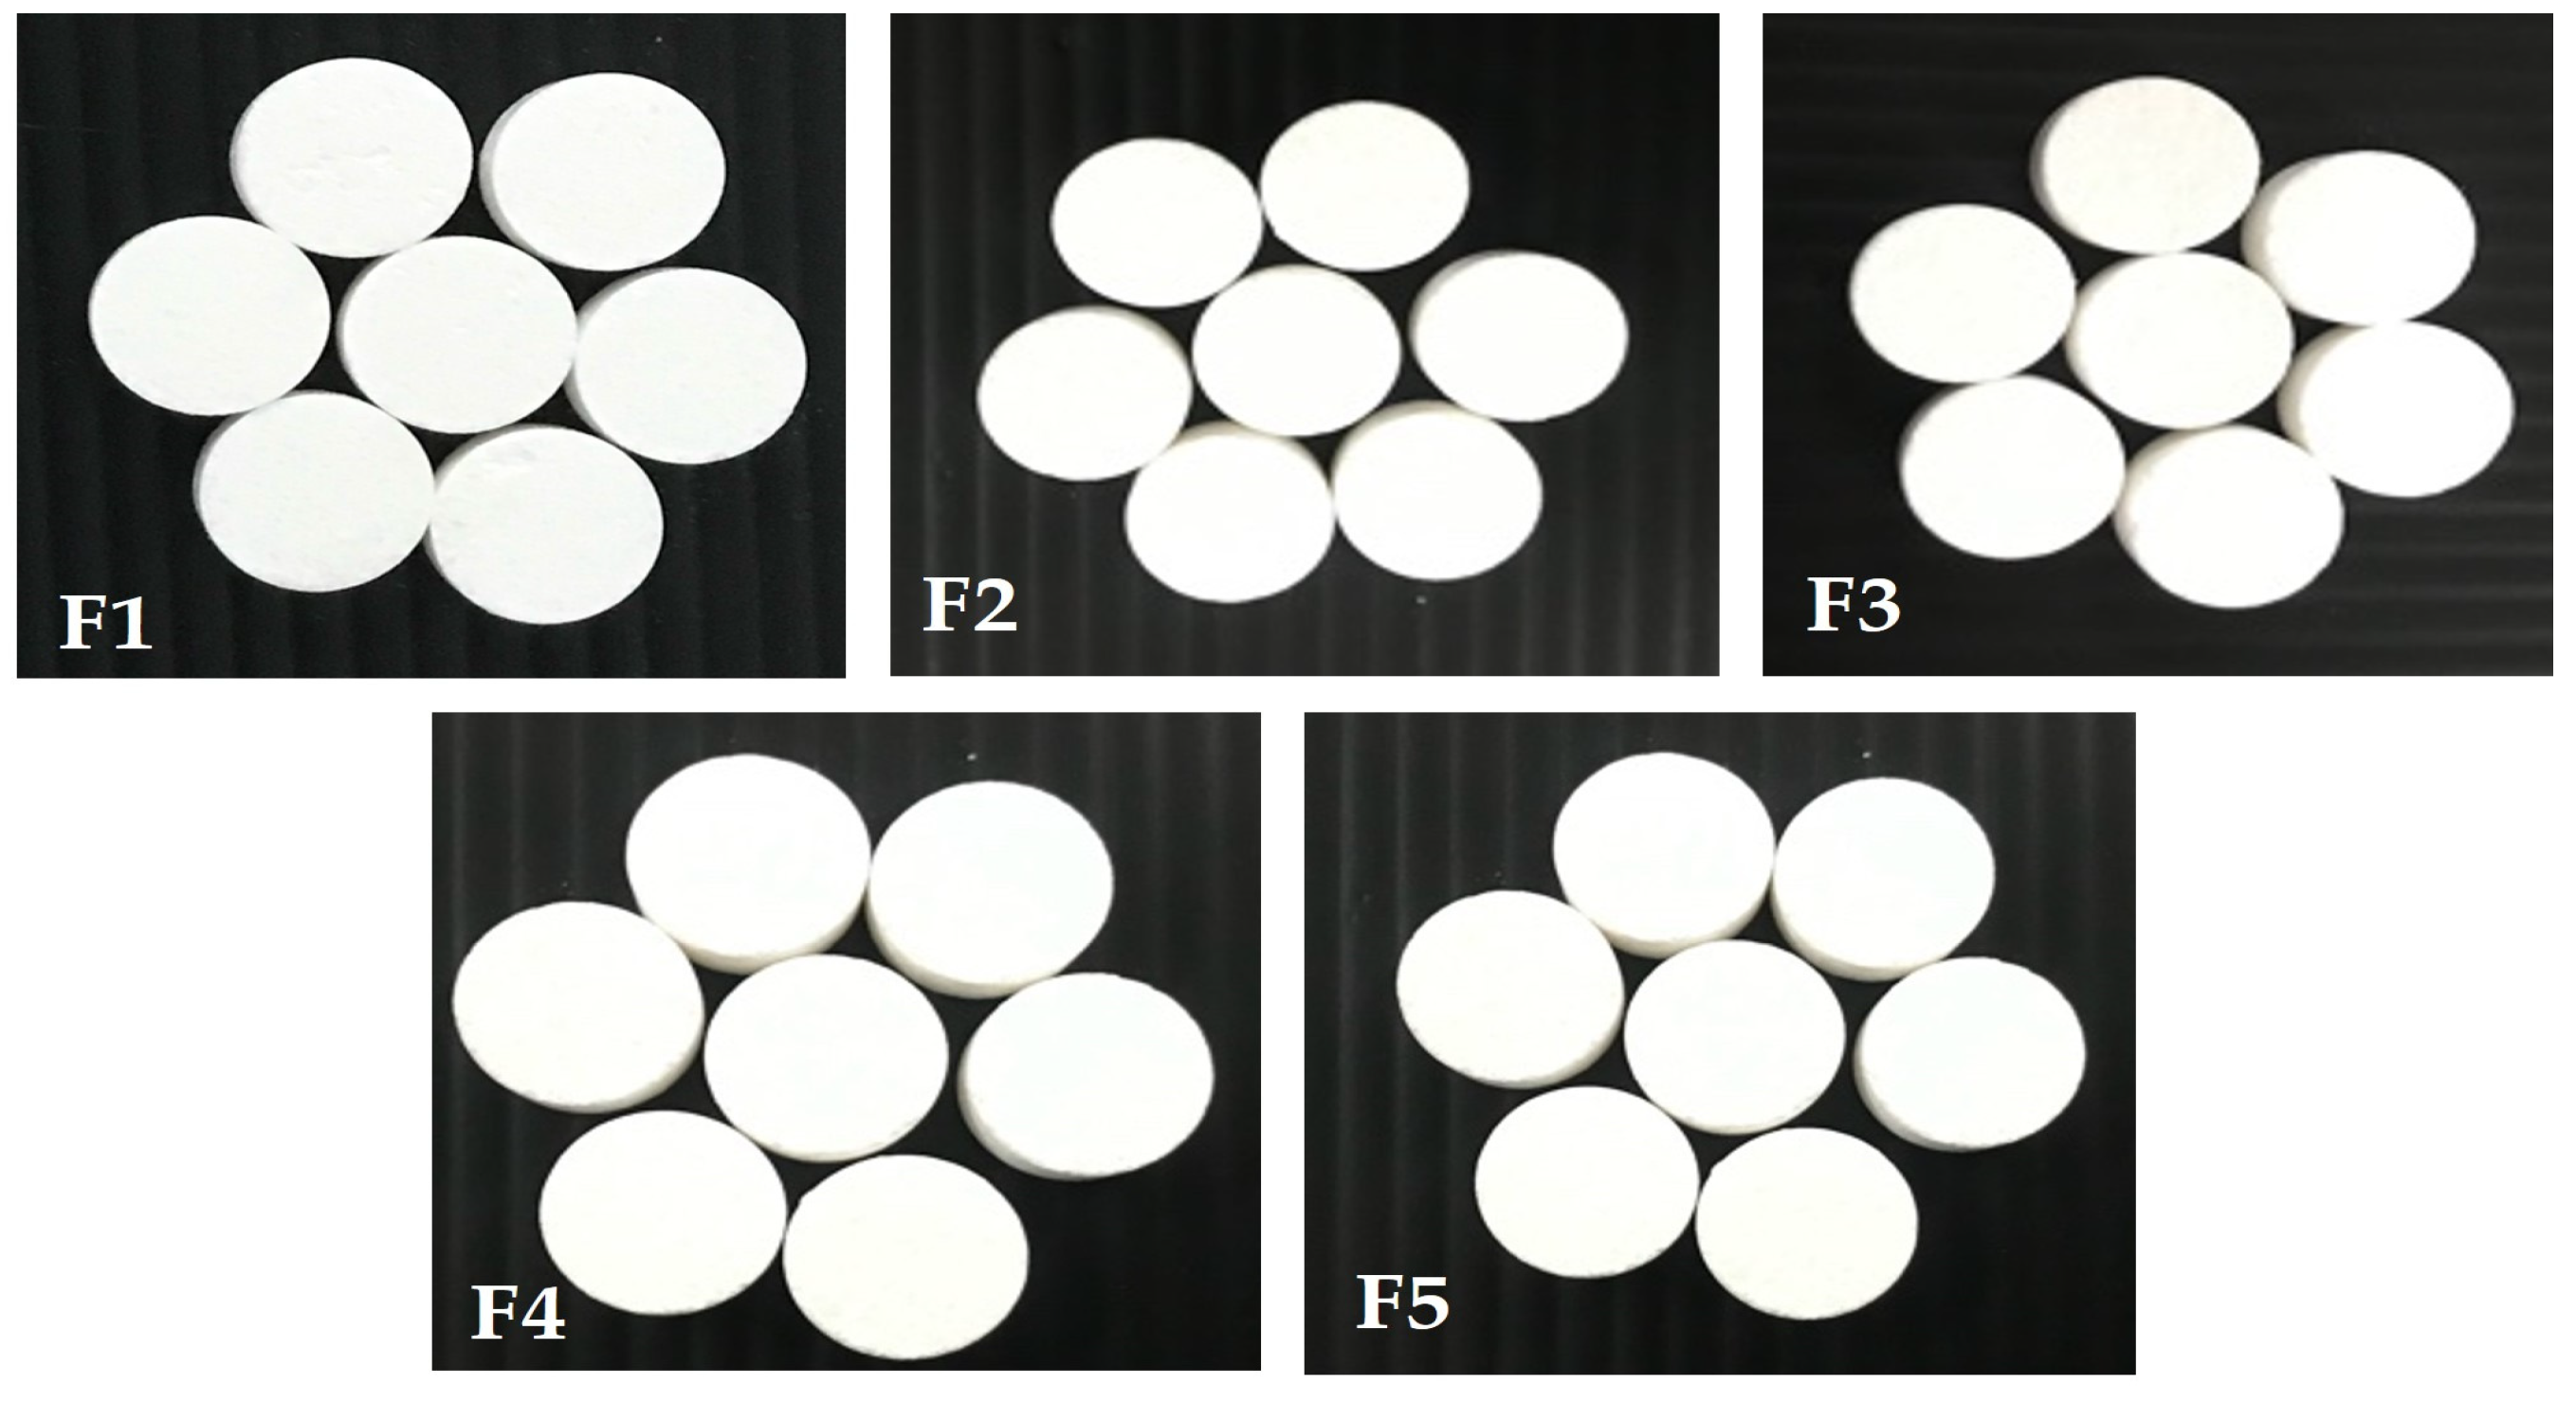
The appearances of effervescent cleansing tablets (F1, F2, F3, F4, and F5) showed similar features with flat top and bottom surfaces and white color, which was the expected color, as shown in Figure 3.

3.4.2. Diameter and Thickness

The diameter and thickness of the prepared effervescent tablets ranged from 12.56 ± 0.02 to 12.61 ± 0.02 mm and 6.17 ± 0.05 to 6.31 ± 0.02 mm, respectively (Figure 4A). Based on the results, all the tablets produced were uniform in size. Controlling the diameter and thickness of tablets is important for quality control in tablet packaging. Ensuring uniform tablet size is also crucial for enhancing customer compliance and preventing confusion due to different tablet sizes.

3.4.3. Hardness of Tablets

Tablet hardness typically varies based on the force applied during tablet compression, as well as the chemical nature and quantity of excipients used [49,50,51]. Our study revealed that the hardness values of tablets F1, F2, F3, F4, and F5 were 4.37 ± 0.46, 4.45 ± 061, 4.62 ± 0.68, 4.04 ± 0.34, and 4.66 ± 0.48 Kp, respectively, as shown in Figure 4B. The hardness values of all formulations were not significantly different (p > 0.05) because the hardness in all formulations was controlled by the compression force applied during the tableting process, ranging from 4 to 5 Kp. Therefore, the variation in hardness values could also be attributed to the quantity of SLS incorporated.

3.4.4. Moisture Content of AASLM Tablets

The moisture content of the produced tablets was between 0.18 ± 0.02% and 0.44 ± 0.03%, as shown in Figure 4C. The moisture content of 0.5% or less was considered acceptable [25]. Effervescent agents, such as citric acid and sodium bicarbonate, are hygroscopic substances that can attract moisture and initiate the effervescent reaction. Therefore, effervescent tablets should be stored in tightly closed containers to prevent the absorption of moisture from the environment and maintain the integrity of the tablets [53].

3.4.5. Weight Variation

Weight variation is a significant measurement used to ensure that each tablet contains a uniform quantity of the active ingredient. The weight variation of F1–F5 was between 1004.85 ± 2.52 mg and 1009.1 ± 3.18 mg, as shown in Figure 4D (calculated from the mean (SD) of 20 tablets). The uniform tablet weight can be attributed to the good flowability of the powder blends.

3.4.6. Effervescence Time

The reaction of citric acid with sodium bicarbonate results in the formation of carbon dioxide, which helps break up the tablets, promoting tablet disintegration and accelerating the dissolving process [53]. In this study, the effervescence time of all formulations ranged from 3.44 ± 0.41 to 9.08 ± 0.37 min, as shown in Figure 4E. Among them, F2, F3, and F4, with 2%, 3%, and 4% SLS, respectively, had the fastest effervescence times of 3.44 ± 0.4 min, 4.04 ± 0.30 min, and 4.18 ± 0.33 min, while F1 and F5, with 1% and 5% SLS, respectively, showed the slowest effervescence times of 6.25 ± 0.13 min and 9.08 ± 0.37 min, respectively (Figure 4E). Consequently, F1 and F5 were excluded from potential tablet formulations as they did not meet the criteria (<5 min) [36]. The observed outcomes can potentially be attributed to the wetting property of SLS [60]. It was also observed in this study that 2% to 4% SLS is appropriate for enhancing the wettability of tablets. This result suggests that the application of the proper amount of SLS is required to achieve the lubricating and wetting effect in solid dosage forms. The slowest effervescence time at 5% SLS in F5 might have been due to the formation of a poorly soluble complex between anionic surfactant and non-ionic surfactant (i.e., cetyl alcohol or paloxamer 188 in AASLMs) in the formulation, while the 1% SLS concentration might have been due to inadequate wetting properties to improve tablet disintegration. In another study, it was also reported that a higher concentration of SLS slowed the disintegration time of tablets [61]. It was noted that an adequate SLS concentration is needed to achieve its wetting property. Interestingly, the effervescence time of the tablets was increased when SLS levels increased from 2% to 4% w/w. Therefore, the incorporation of a specific concentration of SLS in the formulation was required to promote the wettability of the tablets, which would extend the tablet disintegration time [62].

3.4.7. pH Measurement

The pH values of the produced effervescent tablets ranged from 5.72 ± 0.14 to 6.17 ± 0.05 (Figure 4F). A slight increase in pH value was observed from F1 to F5 due to the incorporation of higher SLS concentrations (the pH range of SLS is from 7 to 9.5) in the formulations [62]. It has been reported that a pH value less than 6 is suitable for effervescent reactions [25]. In addition, skin pH is typically acidic, ranging from 4 to 6. Therefore, skin cleansers should have an acidic pH, as high pH values can cause skin irritation, disrupt the skin barrier, lead to dehydration, and alter the skin’s bacterial flora by reducing the acidic inhibition of stratum corneum chymotryptic enzymes [53,54,55]. Several studies have shown that using cleanser with an acidic pH can help lower skin surface pH and reduce bacterial counts compared to neutral and alkaline preparations [63,64]. Therefore, using cleansing products with a pH of 5–6 might be a better choice for maintaining the skin’s acid mantle. Moreover, it has been reported that asiatic acid is not stable under alkaline conditions, but it is stable at pH 5.8 and pH 7 [65]. Therefore, the pH values obtained from all formulations can be considered acceptable since the formulation is intended for a rinse-off product.

3.4.8. Friability

Friability is a test used to measure the toughness and physical strength of uncoated tablets by subjecting them to mechanical stress conditions. The friability of all effervescent tablet formulations ranged from 2.34 ± 0.10% to 3.53 ± 0.05% (Figure 4G). The friability of effervescent tablets was higher than that of conventional tablets (where friability should be less than 1%) because effervescent tablets are very fragile due to the nature of the excipients used (e.g., citric acid and sodium bicarbonate), which could facilitate rapid tablet disintegration upon contact with water [66]. Therefore, a friability of less than 1% was considered acceptable for effervescent tablets.

3.4.9. % Label Amount of AA according to HPLC

The AA content analysis was conducted via the HPLC method. It was found that the AA contents in all formulations were between 100.33 ± 2.71% and 101.86 ± 2.66% (Figure 4H), and these differences were not statistically significant (p > 0.05). These results fall within the acceptable range of 95–105% for the label amount, which is a common criterion for pharmaceutical quality control.

3.5. In Vitro Dissolution of AASLMs Tablets

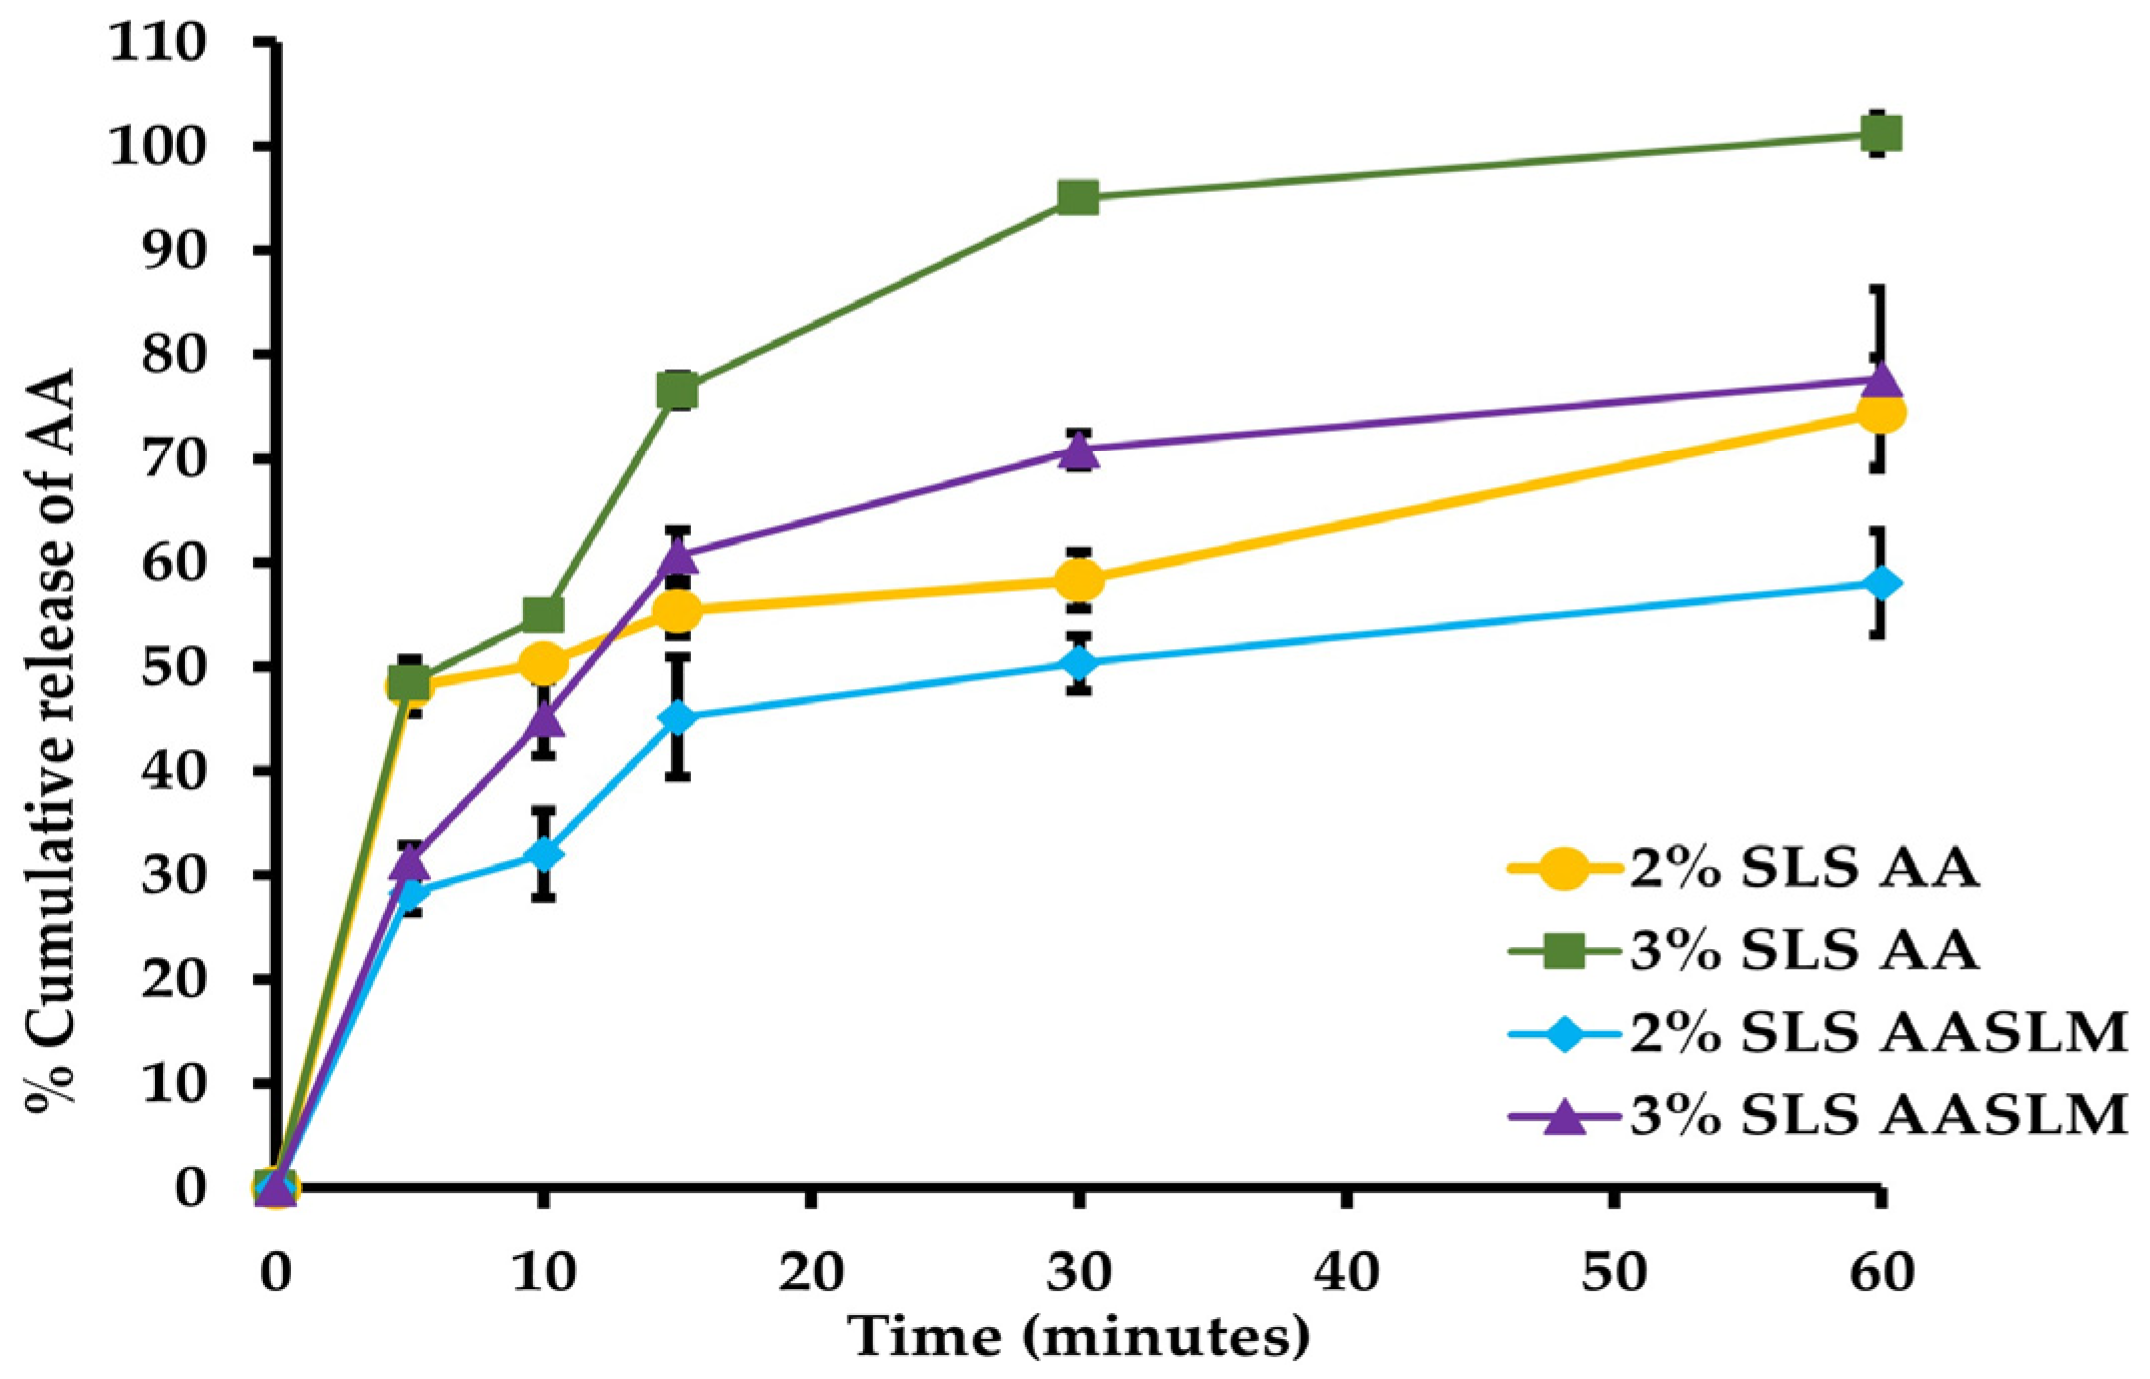
The release profiles of asiatic acid from pure AA tablets and AA-loaded SLMs tablets containing either 2% or 3% SLS in tablet formulation were compared. The result showed that in vitro release profiles of both pure AA tablets and AASLM tablets depended on the concentration of SLS in the formulations, as displayed in Figure 5. The release profiles in our study exhibited compelling and dynamic behavior, particularly within the initial 15 min.
The release rate of both AA tablets and AASLM tablets containing 3% SLS was higher than that of 2% SLS at every time point. The drug release rates from AASLM tablets with 2% and 3% SLS was 28.25 ± 1.85% and 31.26 ± 1.58%, respectively, while the release from AA tablets exceeded 45% after the first 5 min. SLS is a well-known surfactant commonly used in pharmaceutical formulations to enhance drug dissolution [61]. Therefore, the drug release rate of tablets increased with an increase in SLS concentration in the formulation.
At 10 min, the release rates of AA were 32.01 ± 4.18% in 2% SLS AASLM tablets and 50.30 ± 1.29% in 2% SLS AA tablets. These rates were not significantly different compared to their release rates at 5 min (28.24 ± 8.78% and 48.09 ± 2.64%, respectively) (p > 0.05). In contrast, the release rates of AA were 45.06 ± 3.64% in 3% SLS AASLM tablets and 54.88 ± 0.06% in 3% SLS AA tablets, representing a significant increase compared to their release rates at 5 min (31.25 ± 7.76% and 48.49 ± 0.09%, respectively) (p < 0.05). The slowdown in the release rates of AA after 5 min might be attributed to the agglomeration of AA with other excipients in the tablet formulation, which reduces the wettability of AA in dissolution medium. Several authors have reported that agglomeration can impact physical properties and negatively affect dissolution profiles [67,68]. The subsequent increase in the release rate after 10 min could be attributed to the initial solubilization of AA, possibly facilitated by the surfactant properties of SLS. SLS is a surfactant capable of forming micelles in the solution. Therefore, the initial burst release may be associated with the formation of micelles, promoting the solubility of AA [69].
At 60 min, the drug release rates from AASLM tablets with 2% and 3% SLS were 58.10 ± 5.00% and 77.62 ± 8.65%, respectively, while the release from AA tablets with 2% and 3% SLS were 74.47 ± 5.22% and 101.20 ± 1.85%, respectively. These results reveal that the release of AA was sustained in AASLM tablets. Notably, AASLM tablets (F2 and F3) released more than 50% of AA within 30 min. This observation suggests that when the body is exposed to water containing dissolved AASLM tablets for 30 min, a substantial quantity of AA can potentially achieve the desired therapeutic outcomes.

3.6. Cleansing Efficacy Study

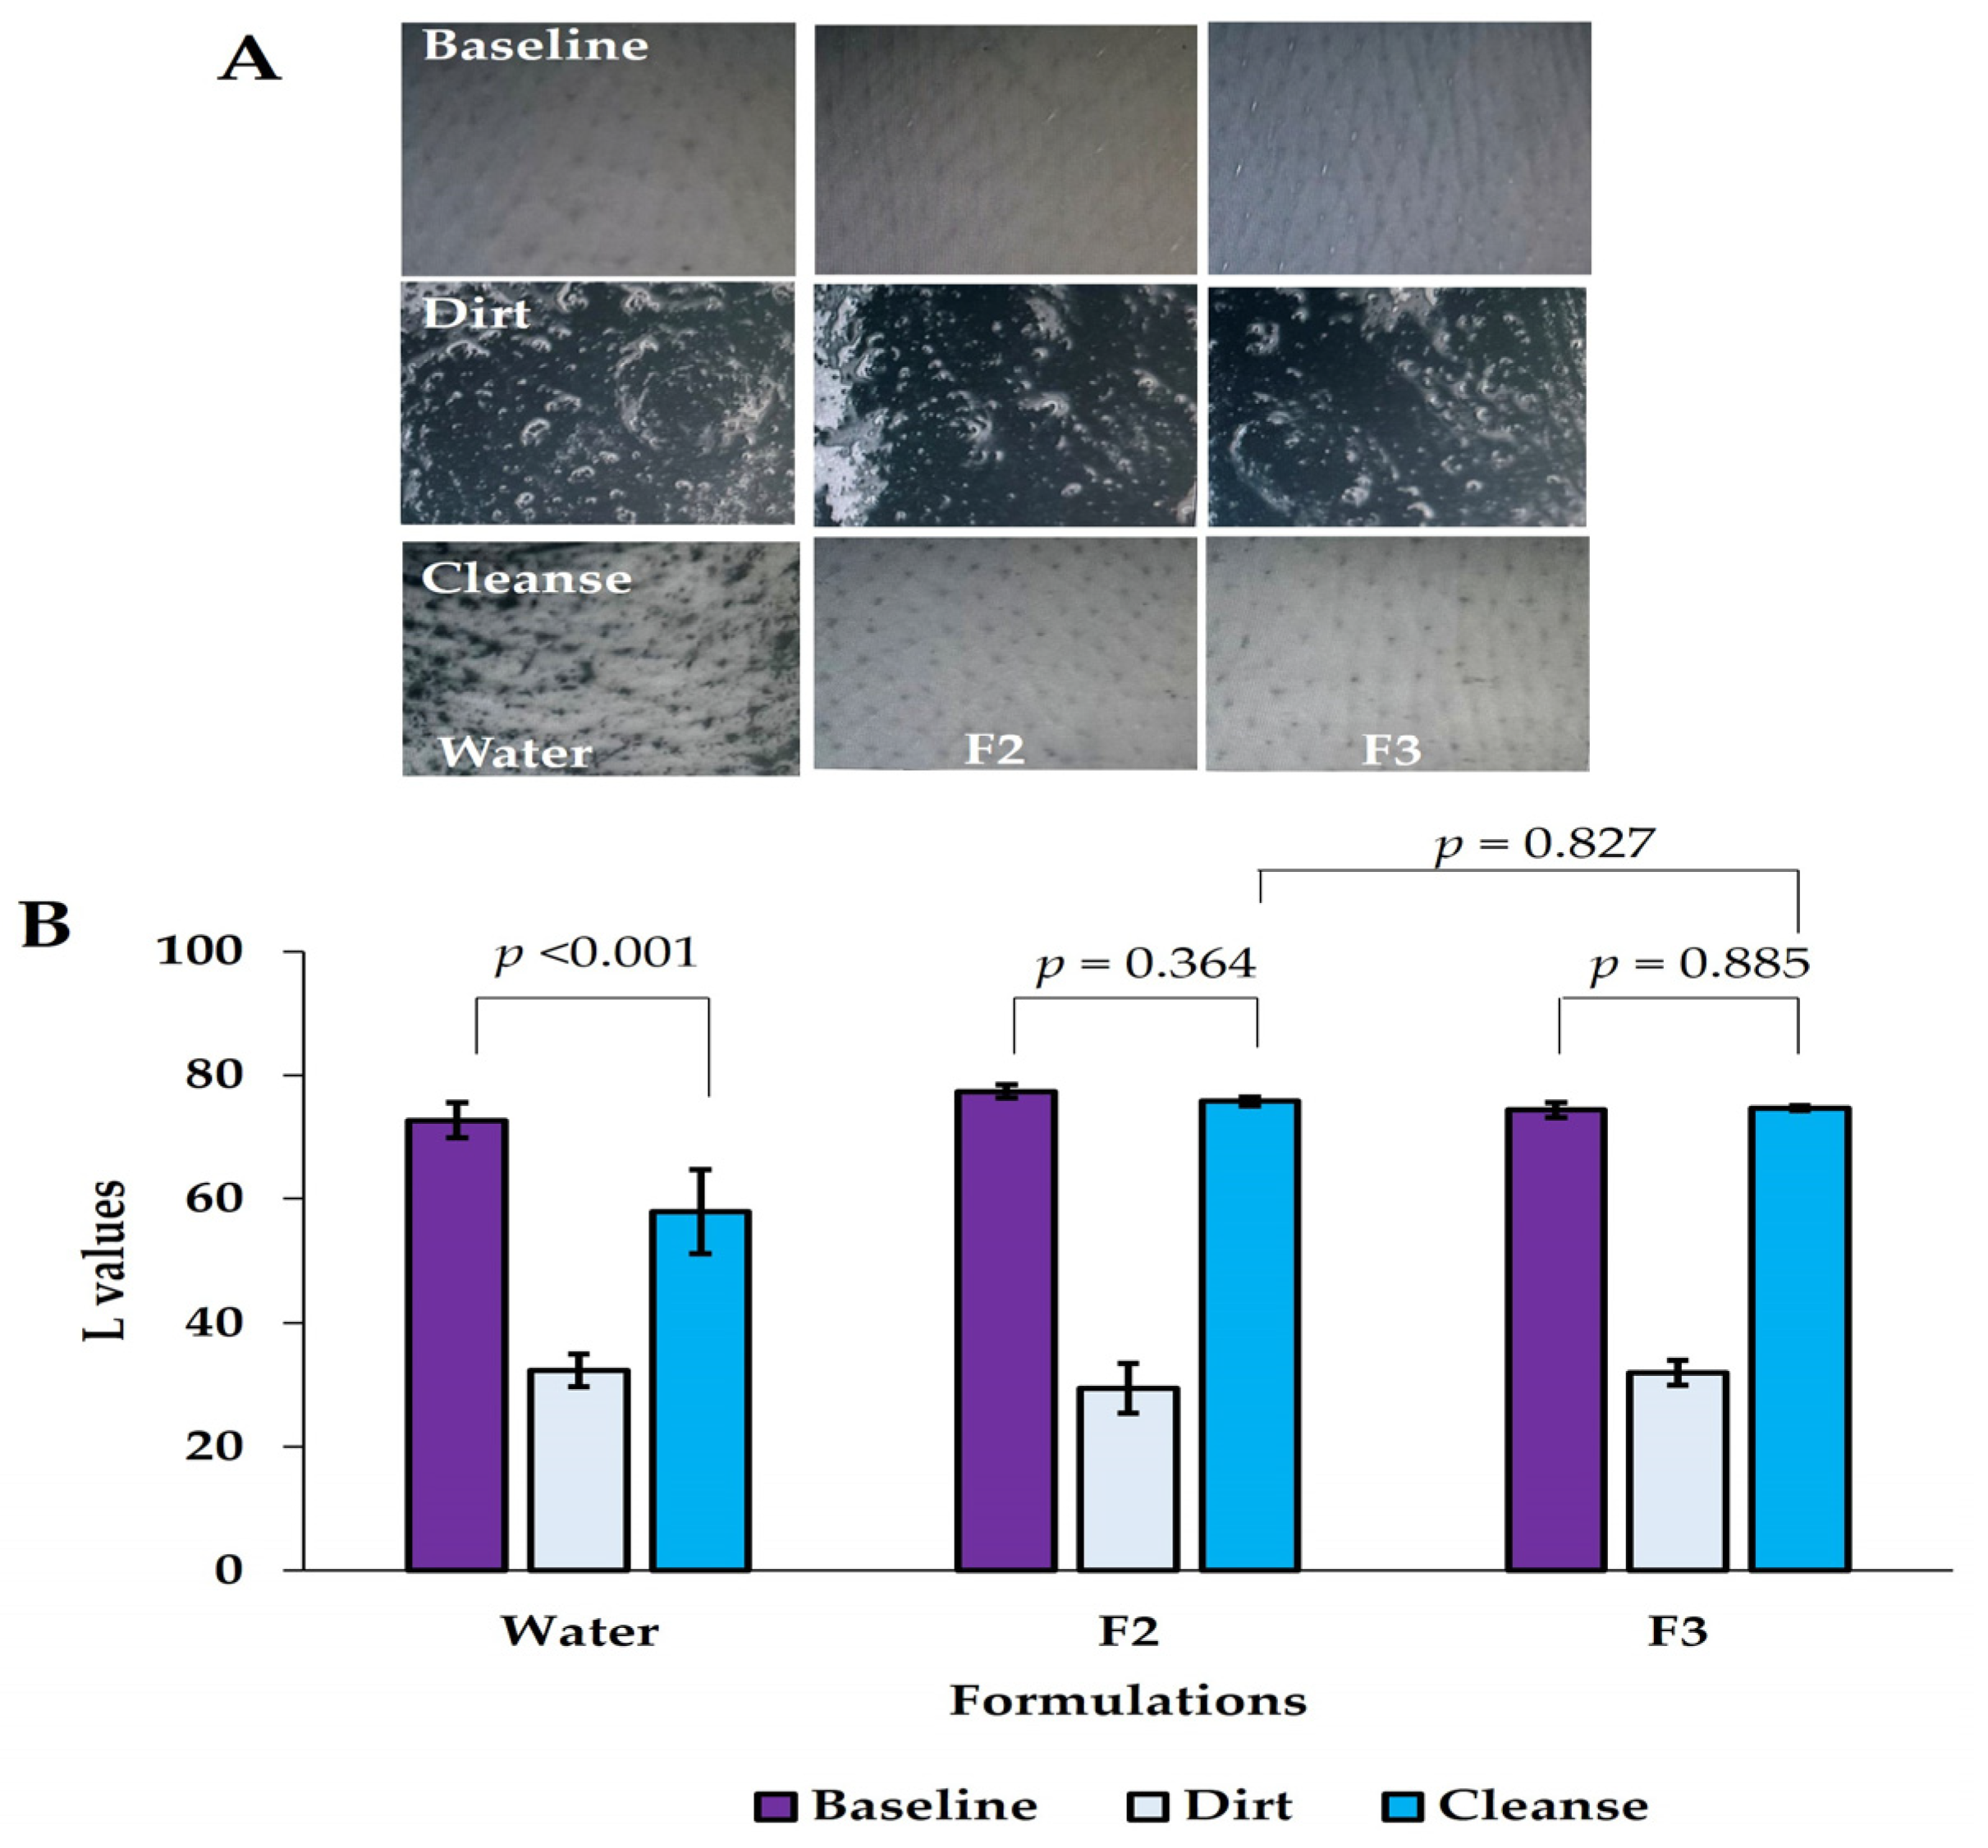
The effectiveness of the cleansing process was evaluated by comparing the change in skin color after applying a model dirt and after cleansing with three different tested groups: purified water, F2, and F3. The difference in color values (L values), measured with a colorimeter, was used to determine the removal of dirt, as shown in Figure 6.
As shown in Figure 6B, the average L values in groups F2 and F3 increased significantly after cleansing compared to their L values after applying the model dirt (p < 0.05). However, there were no statistically significant differences compared to the baseline measurements (p-values 0.364 and 0.885). Notably, there was no statistically significant difference between groups F2 and F3 (p value 0.827), as displayed in Figure 6B, indicating the successful removal of dirt in both groups. Conversely, after cleansing with water, the L values decreased significantly from the baseline measurement. Furthermore, the improvement in skin color was significantly more pronounced in groups F2 and F3 compared to water (p < 0.05) (Figure 6B). This suggests that both F2 and F3 were significantly more effective at removing dirt compared to purified water. Moreover, the image captured by Visioscan® VC 20plus (Figure 6A) supported the presence of residual black color on the skin after cleansing with purified water, indicating that water alone was ineffective at removing the dirt. In contrast, F2 and F3 visibly resulted in cleaner skin. These findings further confirm the effective cleansing efficacy of F2 and F3.

3.7. Stability Studies

Stability studies were conducted on the optimized formulations, F2 and F3, under three different storage conditions: 40 ± 2 °C (75% RH ± 5% RH), 25 ± 2 °C, and 4 ± 2 °C, over a period of 3 months. Various parameters, including physical appearance, hardness, ET, pH, moisture content, friability, and drug content, were investigated after each storage time period [49].

3.7.1. Physical Appearance

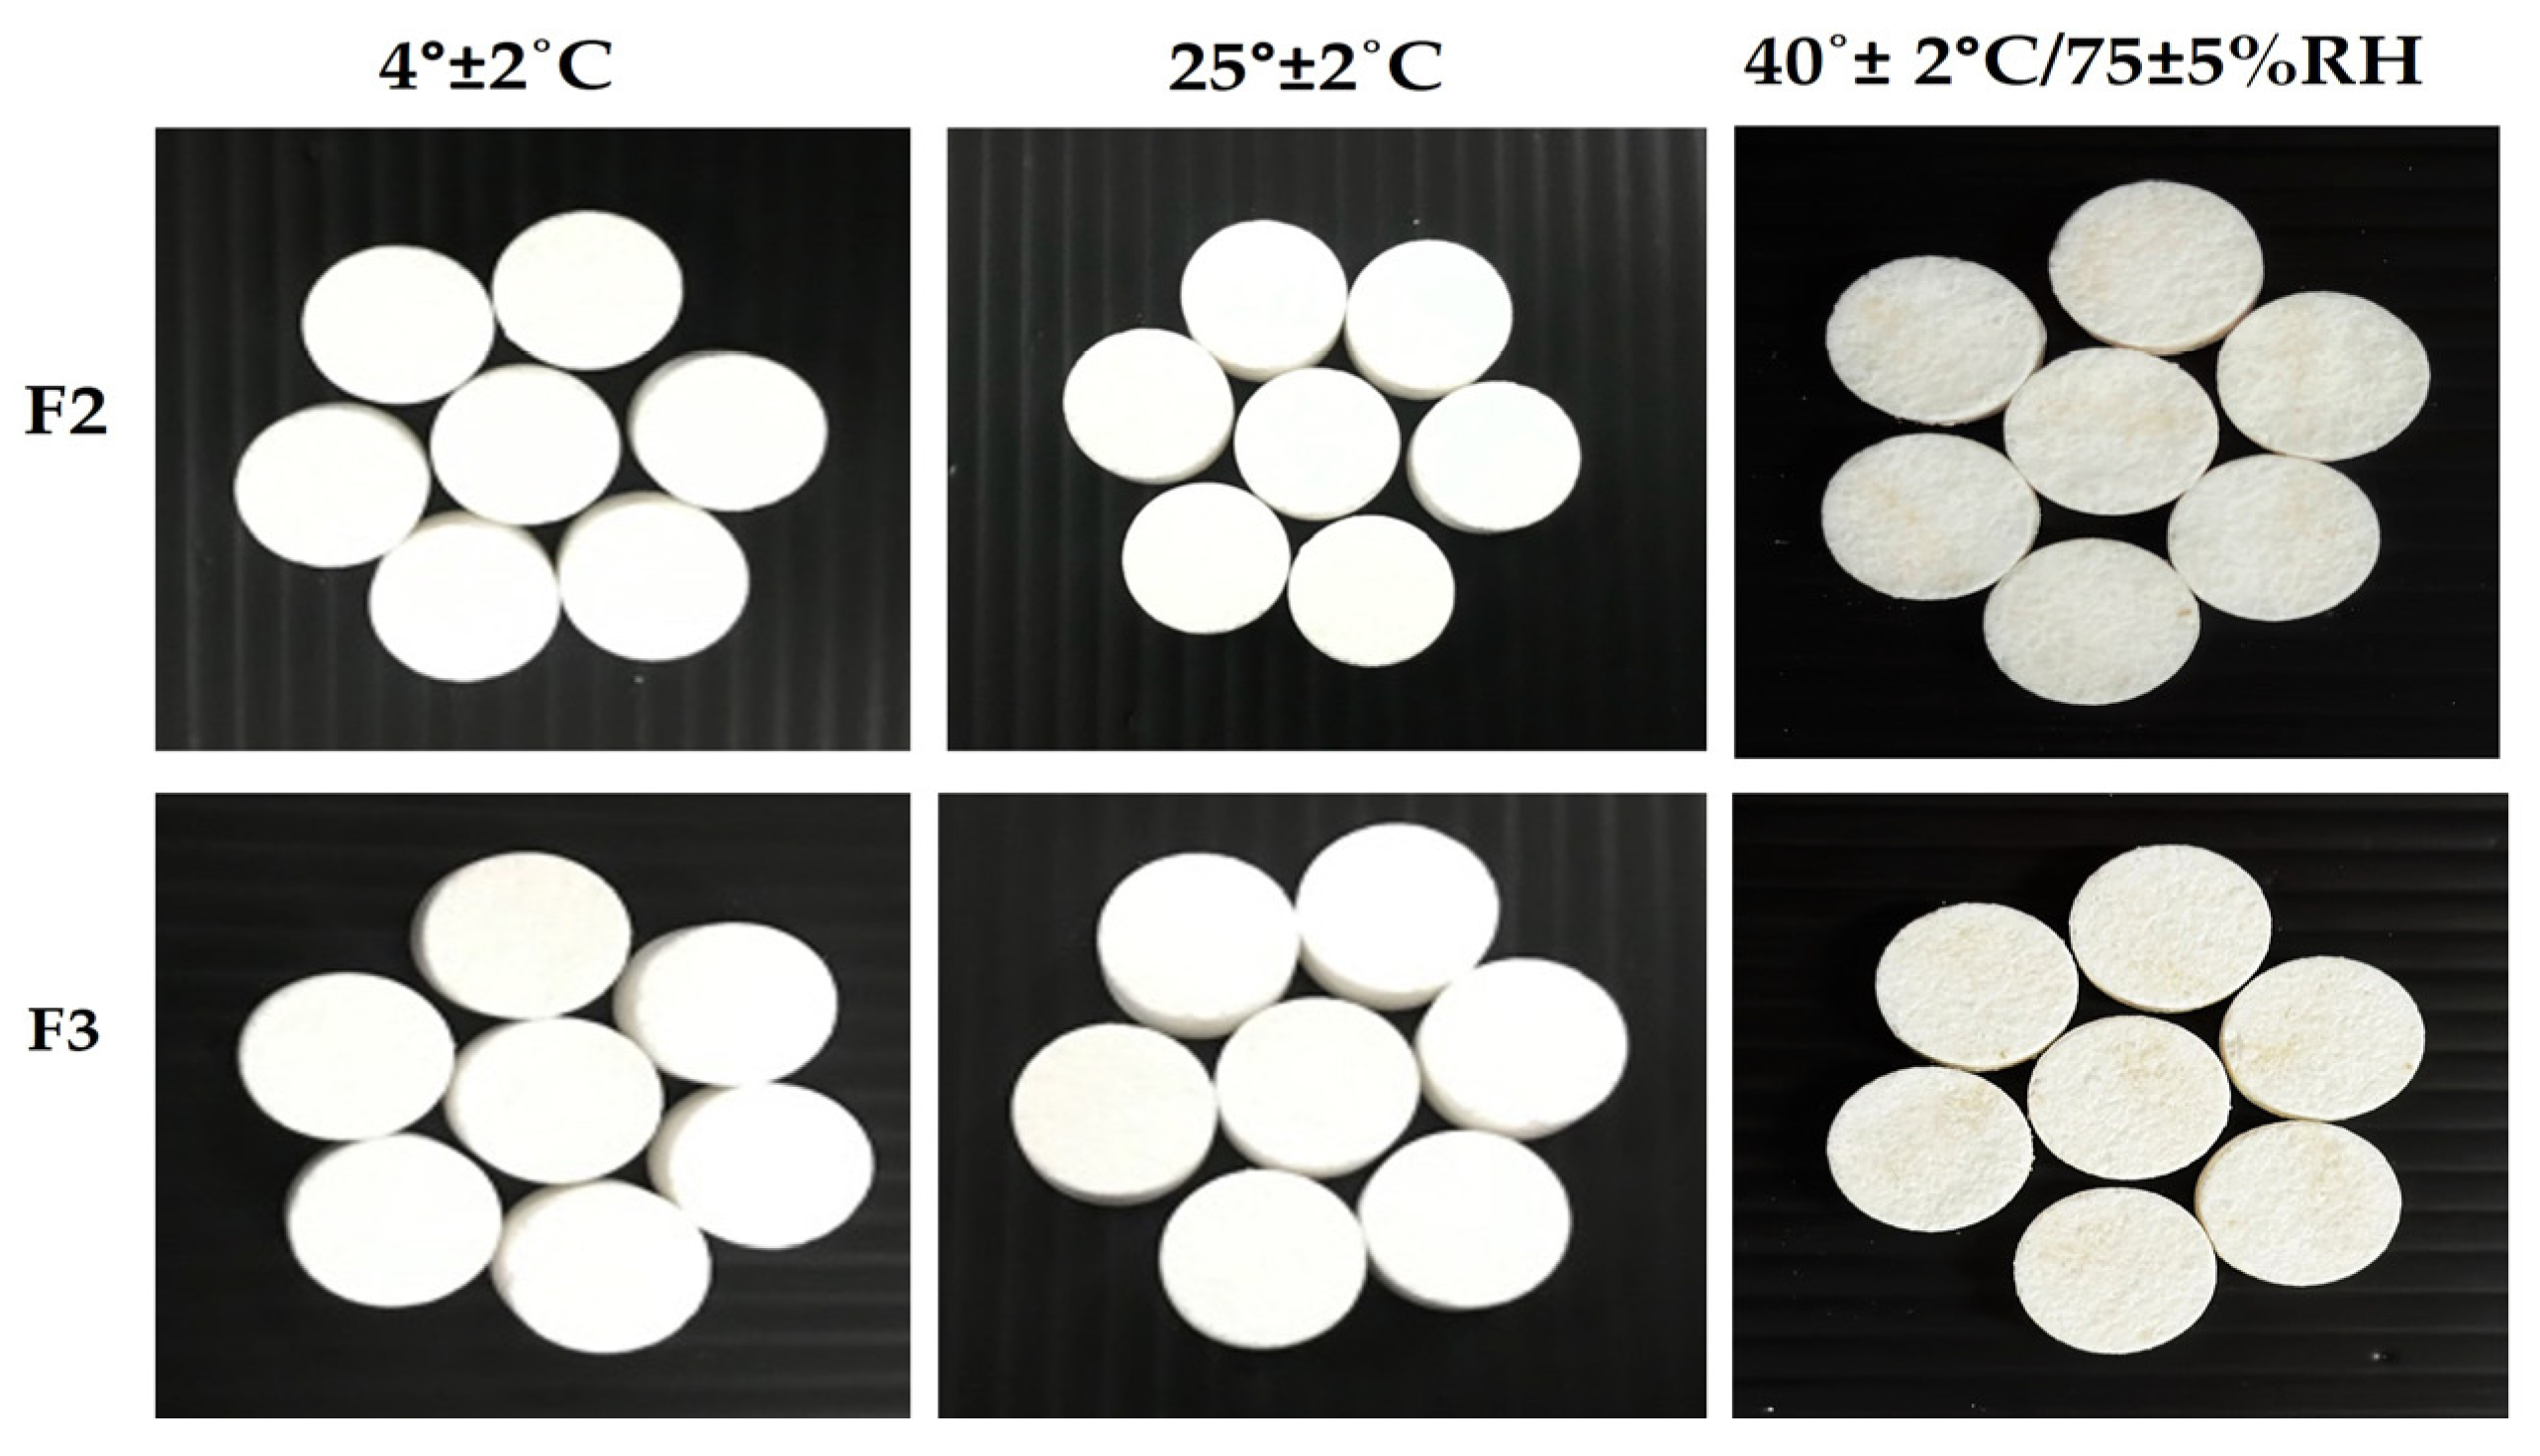
No physical changes were observed in the appearance of effervescent tablet formulations (F2 and F3) when stored at 4 ± 2 °C and 25 ± 2 °C for 3 months. This result suggests that these storage temperatures were suitable for maintaining the quality of the tablets in this study. However, when the tablets were stored at 40 ± 2 °C/75% RH ± 5% RH, brown spots began to appear on the tablets after 3 months, as shown in Figure 7. These observations align with the expectation that higher temperatures and humidity can accelerate tablet degradation, including discoloration [70]. In addition, higher temperatures accelerate chemical reactions, such as oxidation. When exposed to heat, oxygen can promote oxidative reactions, leading to the formation of brown pigments and tablet discoloration [71]. Furthermore, it has been reported that AA is sensitive to heat [65]. Therefore, the appearance of brown spots at elevated temperatures might be due to the potential degradation of AA.
To control the browning process, various approaches have been employed, including the use of ascorbic acid [72], PPO inhibitors [73], and chelating agents such as citric acid and EDTA [74], among others [75]. Despite the incorporation of citric acid into the formulations, it proved ineffective in preventing the browning effect. In order to enhance product stability and inhibit oxidation reactions, it is advisable to introduce antioxidant compounds into the formulation. These compounds can help regenerate oxidized molecules and prevent further degradation [76]. In addition, extending product shelf life can be achieved through the implementation of primary and secondary packaging. Using high-temperature and moisture-resistant plastic tubes (e.g., polypropylene (PP) tube) [77], in combination with impermeable containers like sachets or blister packs, that come into direct contact with the products, establishes a lasting barrier against the passage of solvents or gases. This, in turn, enhances product quality [52].

3.7.2. Hardness

After a 3-month storage period, the hardness of effervescent cleansing tablets F2 and F3 exhibited varying changes depending on the storage temperature conditions, as shown in Figure 8A–C.
When stored at 4 ± 2 °C, both formulations exhibited a slight increase in hardness, but this change was not statistically significant (p > 0.05) over the 3-month study period. Similarly, at 25 ± 2 °C, the hardness of both F2 and F3 remained statistically unchanged after 3 months of storage when compared to their initial values (p > 0.05). However, storing the tablets at temperatures above 25 °C may accelerate the decomposition of bicarbonate into carbonate and trigger hydrolysis processes [78], potentially contributing to the observed fluctuations in tablet hardness. Under the conditions of 40 ± 2 °C/75% RH ± 5% RH, the hardness of F2 decreased significantly (p < 0.05), whereas the hardness of F3 exhibited a decrease, although it was not statistically significant after 3-month study period. These results indicate that the storage temperature within the examined range has a limited impact on tablet hardness. However, it is evident that tablet hardness is clearly influenced by the storage temperature, as demonstrated by the observed varying trends.

3.7.3. Effervescence Time

After a 3-month storage period, the effervescence time of both F2 and F3 exhibited distinct patterns of change under different storage temperature conditions, as displayed in Figure 9.
At 4 ± 2 °C and 25 ± 2 °C, the effervescence time of F2 increased significantly from its initial value of 3.44 ± 0.41 min to 4.56 ± 0.23 min and 4.54 ± 0.24 min after 3 months, respectively (p < 0.05). In contrast, F3 showed an increase, but it was not statistically significant, changing from its initial value of 4.04 ± 0.30 min to 4.59 ± 0.28 min and 4.48 ± 0.29 min after 3 months (p > 0.05). The observed changes may be attributed to the decomposition of bicarbonate during storage, triggering hydrolysis processes, which, in turn, retard the effervescence time [79]. At 40 ± 2 °C/75% RH ± 5% RH, F2 showed a slight increase in effervescence time, while F3 exhibited a slight decrease. However, these changes were not statistically significant (p > 0.05) compared to their initial values. Interestingly, after 1 month of storage under this condition, the effervescence time of F2 increased slightly while F3 decreased. After 2 months, both F2 and F3 showed an increase in effervescence time. These contrasting results indicate that higher temperature and humidity adversely affected the tablet properties. This could be attributed to the hygroscopic nature of citric acid, which may lead to uncontrollable autocatalytic chain reactions with sodium bicarbonate, even when a small amount of moisture is present, ultimately leading to product instability [79].

3.7.4. pH

After a 3-month storage period under all study conditions, it was observed that the pH values of the solutions containing effervescent tablets from both F2 and F3 formulations exhibited an increase, as presented in Figure 10A–C. The pH values of both F2 and F3 did not show statistically significantly increases (p > 0.05) under any storage conditions, except for F2 at 4 °C, where the pH value significantly increased compared to its initial value (p < 0.05). This finding suggests that the effervescent tablets maintained their pH stability over the 3-month storage period, which is a desirable attribute for stability. It implies that the tablets have the potential to maintain their intended pH range throughout their shelf life, ensuring consistent performance and efficacy for the end-users. The slight increase in pH observed may be attributed to minor degradation or interaction of the tablet components over time. However, the extent of this increase remained within an acceptable range, considering the intended application (skin cleanser) of these tablets.

3.7.5. Friability

After a 3-month storage period under different storage conditions, changes in friability were observed for both F2 and F3 formulations, as presented in Figure 11A–C. At 4 ± 2 °C, the friability of both F2 and F3 increased from 2.74 ± 0.32% to 2.81 ± 0.16% and from 2.64 ± 0.15% to 3.39 ± 0.08%, respectively. However, these changes were statistically insignificant (p > 0.05). At 25 ± 2 °C, the friability of F2 decreased significantly after 3 months compared to its initial values (p < 0.05). The decrease in tablet friability may be attributed to an increase in moisture content. In contrast, the friability of F3 increased, but the change was not statistically significant after 3 months compared to its initial value. Under the conditions of 40 ± 2 °C/75% RH ± 5% RH, both F2 and F3 showed a significant decrease in friability compared to their initial values (p < 0.05). Specifically, the friability of F2 decreased from 2.74 ± 0.32% to 0.34 ± 0.03%, while F3 decreased from 2.64 ± 0.15% to 0.81 ± 0.05%. Although changes in friability were observed during storage in our study, they did not have a corresponding effect on tablet hardness (Figure 8A–C). The observed decrease in friability may be attributable to factors such as moisture absorption, which soften the tablet matrix, making it less prone to breakage during handling or transportation. As a result, the tablets become more resistant to friability.

3.7.6. Moisture Content

At 4 ± 2 °C, the moisture content of F2 remained relatively stable after 3 months of storage (p > 0.05). In contrast, F3 exhibited a notable increase in moisture content after only 1 month of storage, followed by a return to close to its initial level after 2 months. These variations in moisture content in F3 may be attributed to sample variability, as it is possible that there was inherent natural variability in the tablets’ moisture content from the beginning. At 25 ± 2 °C, both F2 and F3 showed a slight increase in moisture content after 1, 2, and 3 months of storage, but not statistically significantly different from their initial values (p > 0.05). However, when stored at 40 ± 2 °C/75% RH ± 5% RH, there was a significant increase in moisture content (p < 0.05), as shown in Figure 12A–C. A similar trend was seen in both F2 and F3 during our study periods. Effervescent tablets are particularly prone to absorbing and attracting moisture from their surrounding environment due to their porous nature and the hygroscopic properties of certain excipients. This can lead to a hydrolysis process [78], as we noted particularly at 40 ± 2 °C/75% RH ± 5% RH in our study. These results indicate that the tablets were not stable at higher temperature and humidity conditions because increased moisture content can cause a chemical reaction between acid and alkali in effervescent tablets, resulting in premature activation of effervescence reaction and degradation of the product. Additionally, elevated temperature and humidity create a more favorable environment for moisture absorption [80], resulting in increased levels of moisture within the tablet’s formulations. Consequently, the friability of tablets in this study decreased. Moreover, moisture uptake can be influenced by packaging materials. Therefore, it is important to consider appropriate packaging materials and storage conditions to maintain the stability of the tablets.

3.7.7. Drug Content

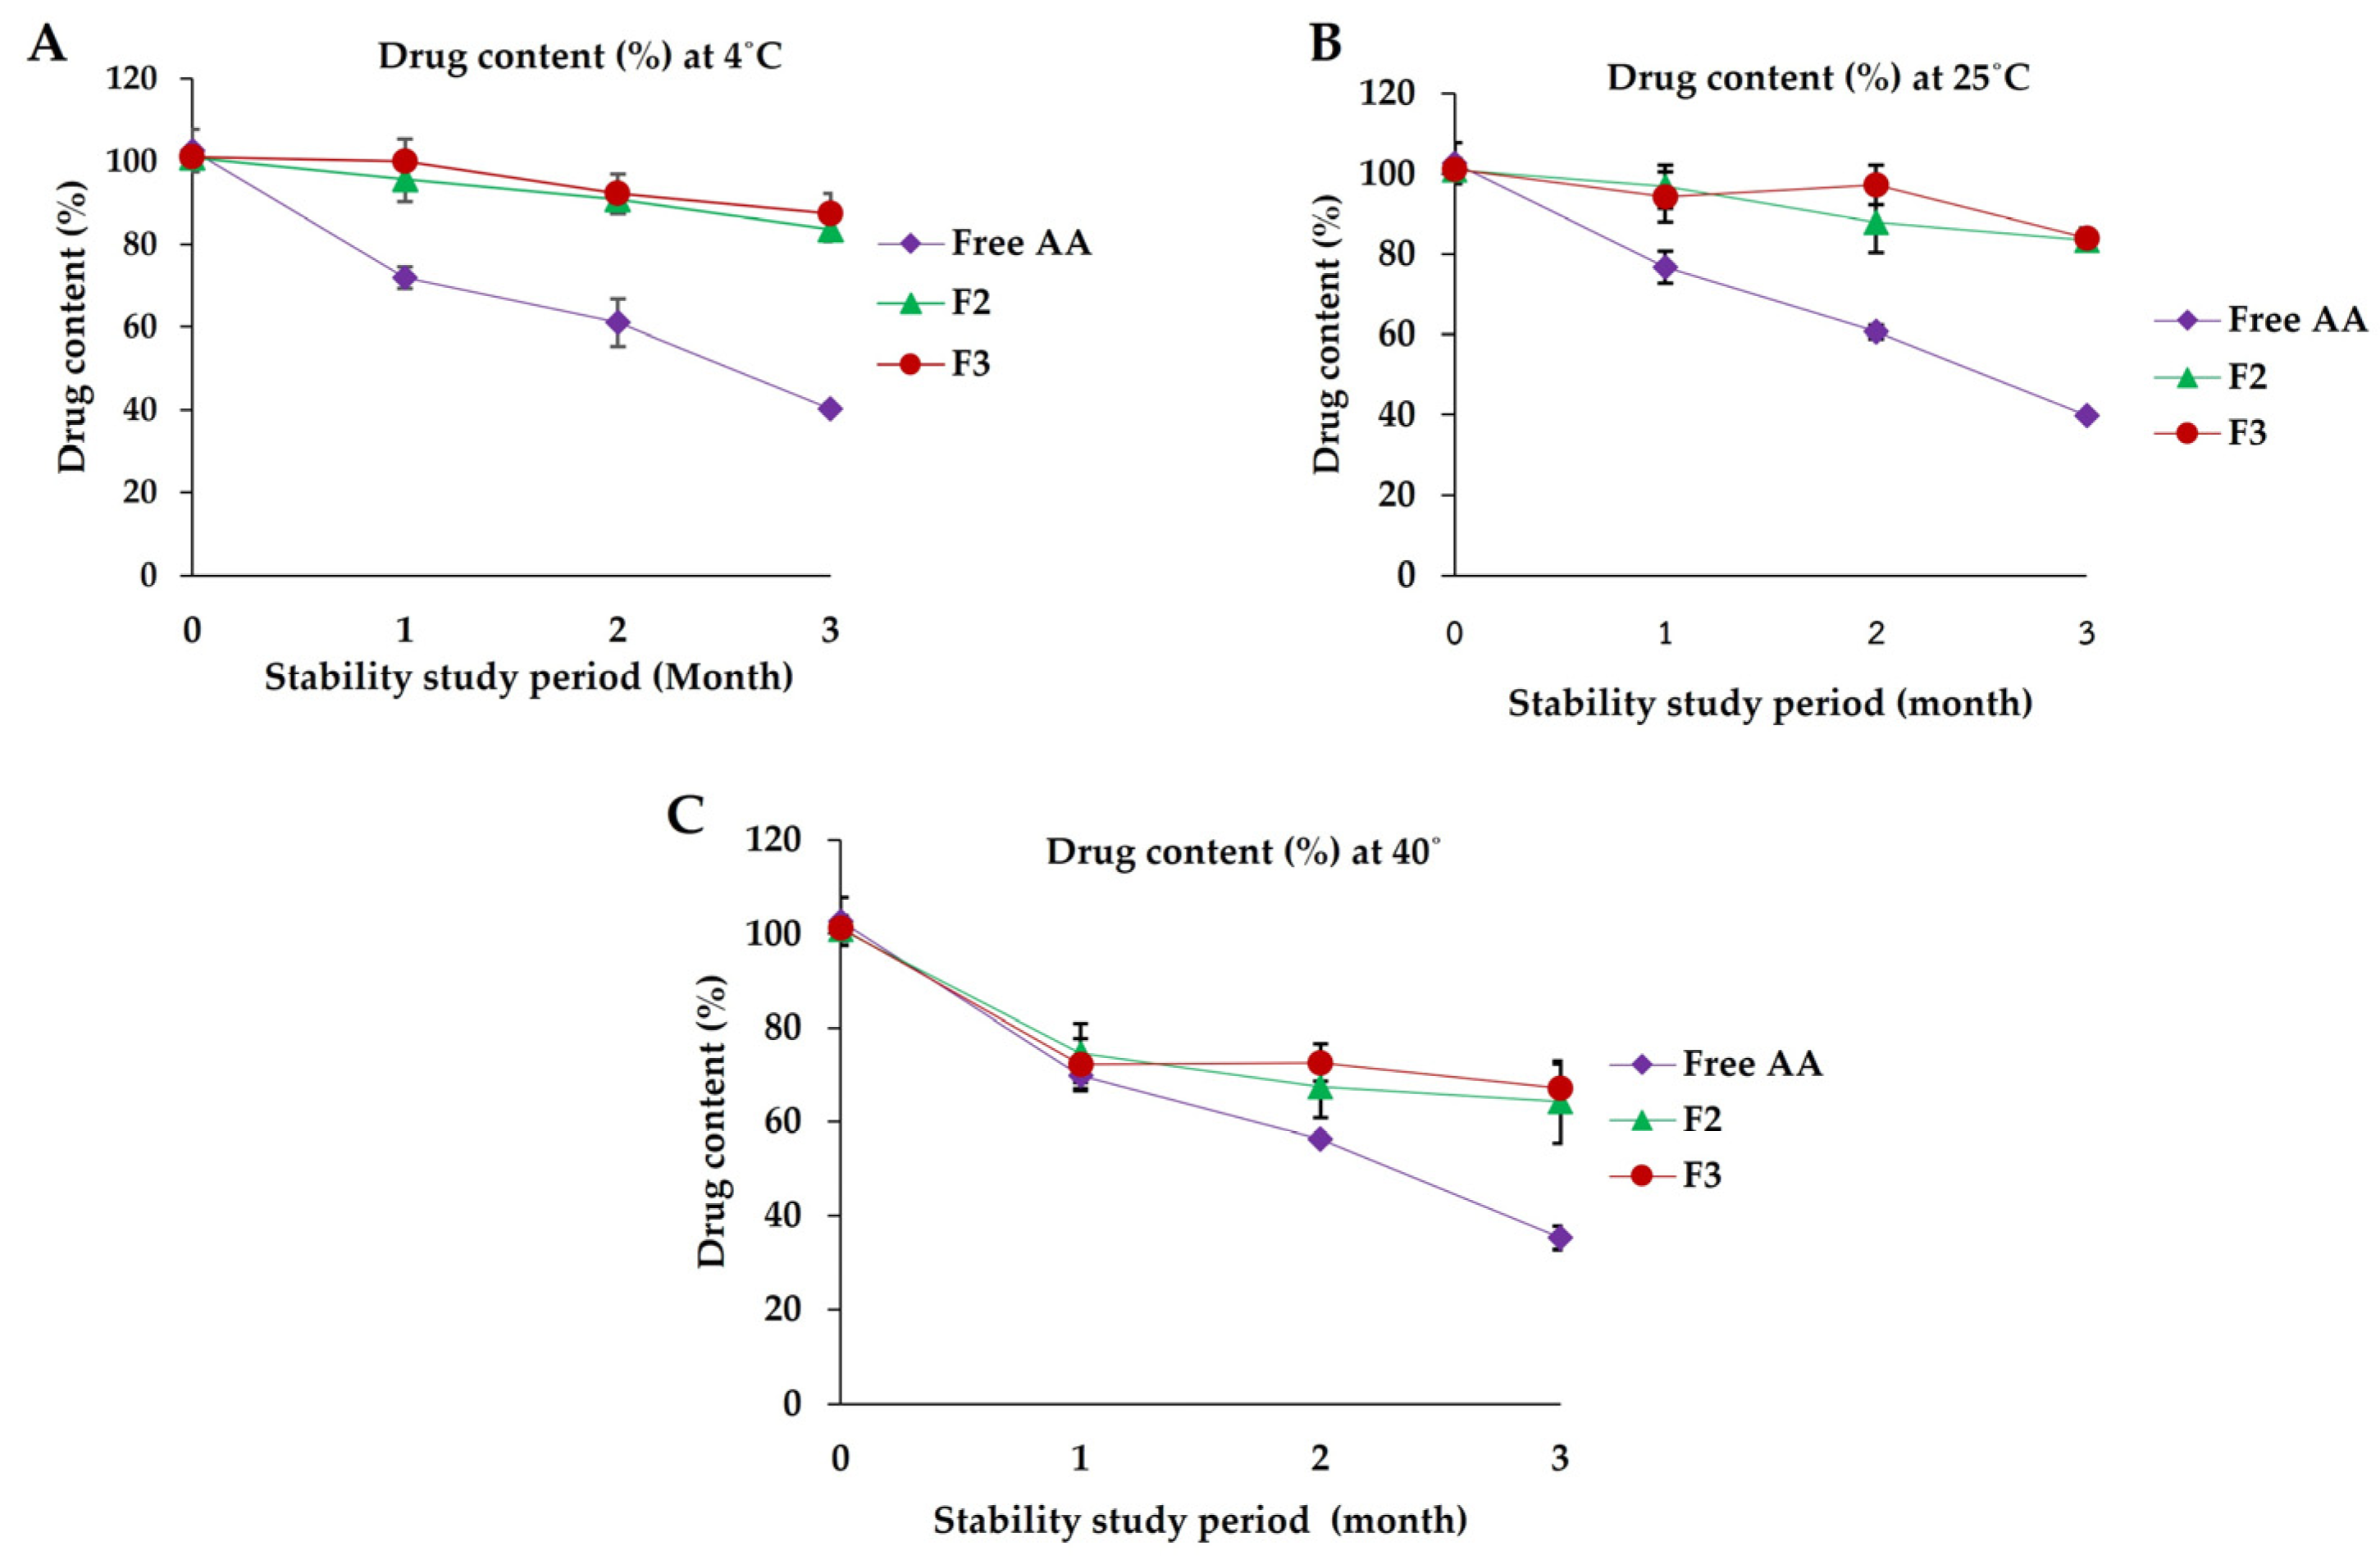
After a 3-month storage period, the AA contents of all tested formulations (free AA, F2, and F3) under various storage conditions are displayed in Figure 13A–C. The AA contents decreased significantly in all storage conditions (p < 0.05). Specifically, the AA contents in F2 and F3 were 85.58 ± 2.08% and 87.46 ± 4.86% at 4 ± 2 °C, 83.41 ± 2.43% and 84.01 ± 2.48% at 25 ± 2 °C, and 64.26 ± 8.76% and 67.14 ± 5.12% at 40 ± 2 °C/75% RH ± 5% RH, respectively. In contrast, the AA content of the free AA powder blend decreased significantly (p < 0.05) and continued to gradually decrease during the stability study period. These results confirm that the stability of AA increased after encapsulation in solid lipid microparticles when compared to free AA. The decrease in AA content might be attributed to the properties of AA in the formulation, as AA is known to be sensitive to heat, light, and temperature, which can contribute to its gradual degradation during storage [65]. Therefore, the use of appropriate packaging materials that provide improved protection against heat, light, and moisture may be necessary to ensure the stability of AA content.

4. Conclusions

In the present work, effervescent cleansing tablets containing AASLMs were successfully developed using the direct compression technique. The tablet cleansers were analyzed for their physicochemical characteristics and cleansing efficacy. The incorporation of effervescent components, i.e., citric acid and sodium bicarbonate, facilitated the immediate release of carbon dioxide bubbles upon contact with water, thereby promoting the disintegration of tablets in water. Our best acid-to-base ratio was 1:3. Among the tested formulations, F2 and F3 exhibited the fastest effervescence time and provided optimum pH values relevant to the skin. Dissolution tests demonstrated that F3, which contained a higher SLS concentration, exhibited a superior percentage release of AA compared to F2. In ex vivo tests, there was a clear difference in cleanliness between the developed formulations (F2 and F3) and purified water on porcine skin.
The effervescent cleansing tablets were found to be relatively stable and suitable for storage at 4 ± 2 °C and 25 ± 2 °C during the 3-month stability study. Nevertheless, elevated temperatures had a significant impact on the tablets, resulting in a notable decline in AA content. Moreover, significant changes were observed in other parameters such as hardness, effervescence time, friability, and moisture content. The use of packaging containing desiccant agents inside the cover can enhance the stability of the tablets, especially under different storage conditions. Additionally, implementing packaging solutions such as polypropylene (PP) tubes and impermeable containers like sachets or blister packs may reduce the risk of moisture, oxidation, or other potential risk factors, ultimately improving product quality.

Author Contributions

Conceptualization, methodology, investigation, formal analysis, writing—original draft preparation, L.M.S.T.; writing—review, V.T.; investigation, resources, W.R. and K.B.; and conceptualization, methodology, formal analysis, resources, funding acquisition, writing—review and editing, supervision, R.C. All authors have read and agreed to the published version of the manuscript.

Funding

This research was funded by the Fundamental Fund 65 (FF65) provided by Thailand Science Research and Innovation (TSRI) through Chulalongkorn University (CU_FRB65_bcg (2)_057_33_01).

Institutional Review Board Statement

Not applicable.

Informed Consent Statement

Not applicable.

Data Availability Statement

Not applicable.

Acknowledgments

The authors acknowledge the Department of Pharmaceutics and Industrial Pharmacy, Faculty of Pharmaceutical Sciences, Chulalongkorn University for its administrative support. The authors would also like to express their gratitude to the Fundamental Fund 65 (FF65) provided by Thailand Science Research and Innovation (TSRI) through Chulalongkorn University, as well as the ASEAN/Non-ASEAN scholarship from the Pharmaceutical Sciences and Technology Graduate Program at Chulalongkorn University.

Conflicts of Interest

The authors declare no conflict of interest.

References

  1. Li, Z. Modern Mild Skin Cleansing. J. Cosmet. Dermatol. Sci. Appl. 2020, 10, 85–98. [Google Scholar] [CrossRef]
  2. Walters, R.M.; Mao, G.; Gunn, E.T.; Hornby, S. Cleansing formulations that respect skin barrier integrity. Dermatol. Res. Pract. 2012, 2012, 495917. [Google Scholar] [CrossRef]
  3. Draelos, Z.; Hornby, S.; Walters, R.M.; Appa, Y. Hydrophobically modified polymers can minimize skin irritation potential caused by surfactant-based cleansers. J. Cosmet. Dermatol. 2013, 12, 314–321. [Google Scholar] [CrossRef] [PubMed]
  4. Mijaljica, D.A.-O.X.; Spada, F.A.-O.; Harrison, I.A.-O. Skin Cleansing without or with Compromise: Soaps and Syndets. Molecules 2022, 27, 2010. [Google Scholar] [CrossRef] [PubMed]
  5. Mukhopadhyay, P. Cleansers and their role in various dermatological disorders. Indian J. Dermatol. 2011, 56, 2–6. [Google Scholar] [CrossRef] [PubMed]
  6. Khan, A.; Iqbal, Z.; Rehman, Z.; Nasir, F.; Khan, A.; Ismail, M.; Roohullah; Mohammad, A. Application of SeDeM Expert system in formulation development of effervescent tablets by direct compression. Saudi Pharm. J. 2014, 22, 433–444. [Google Scholar] [CrossRef]
  7. Ananthapadmanabhan, K.P.; Moore, D.J.; Subramanyan, K.; Meyer, F. Cleansing without compromise: The impact of cleansers on the skin barrier and the technology of mild cleansing. Dermatol Ther. 2004, 1, 16–25. [Google Scholar] [CrossRef] [PubMed]
  8. Johnson, A.; Ananthapadmanabhan, K.P.; Hawkins, S.; Nole, G. Bar Cleansers. Cosmet. Dermatol. Prod. Proced. 2015, 2, 81–95. [Google Scholar]
  9. Kuehl, B.L.; Fyfe, K.S.; Shear, N.H. Cutaneous cleansers. Skin Therapy Lett. 2013, 8, 1–4. [Google Scholar]
  10. Nix, D.H. Factors to consider when selecting skin cleansing products. J. Wound Ostomy Cont. Nurs. 2000, 27, 260–268. [Google Scholar] [CrossRef]
  11. Fore-Pfliger, J. The epidermal skin barrier: Implications for the wound care practitioner, part II. Adv. Skin Wound Care 2004, 17, 480–488. [Google Scholar] [CrossRef] [PubMed]
  12. Huang, J.; Tu, T.; Wang, W.; Zhou, G.; Zhang, W.; Wu, X.; Liu, W.A.-O. Asiatic Acid Glucosamine Salt Alleviates Ultraviolet B-induced Photoaging of Human Dermal Fibroblasts and Nude Mouse Skin. Photochem. Photobiol. 2020, 96, 124–138. [Google Scholar] [CrossRef] [PubMed]
  13. Lv, J.; Sharma, A.; Zhang, T.; Wu, Y.; Ding, X. Pharmacological Review on Asiatic Acid and Its Derivatives: A Potential Compound. SLAS Technol. 2018, 23, 111–127. [Google Scholar] [CrossRef] [PubMed]
  14. Nagoor Meeran, M.F.; Goyal, S.N.; Suchal, K.; Sharma, C.; Patil, C.R.; Ojha, S.K. Pharmacological Properties, Molecular Mechanisms, and Pharmaceutical Development of Asiatic Acid: A Pentacyclic Triterpenoid of Therapeutic Promise. Front. Pharmacol. 2018, 9, 892. [Google Scholar] [CrossRef]
  15. Park, K.A.-O. Pharmacological Effects of Centella asiatica on Skin Diseases: Evidence and Possible Mechanisms. Evid. Based Complement. Alternat. Med. 2021, 2021, 5462633. [Google Scholar] [CrossRef]
  16. Moon, G.A.-O.; Lee, Y.; Kim, E.-K.; Chung, K.-H.; Lee, K.-J.; An, J.H. Immunomodulatory and Anti-inflammatory Effects of Asiatic Acid in a DNCB-Induced Atopic Dermatitis Animal Model. Nutrients 2021, 13, 2448. [Google Scholar] [CrossRef]
  17. Bylka, W.; Znajdek-Awiżeń, P.; Studzińska-Sroka, E.; Brzezińska, M. Centella asiatica in cosmetology. Postepy Dermatol. Alergol. 2013, 30, 46–49. [Google Scholar] [CrossRef]
  18. Mook-Jung, I.; Shin, J.E.; Yun, S.H.; Huh, K.; Koh, J.Y.; Park, H.K.; Jew, S.S.; Jung, M.W. Protective effects of asiaticoside derivatives against beta-amyloid neurotoxicity. J. Neurosci. Res. 1999, 58, 417–425. [Google Scholar] [CrossRef]
  19. Yuan, C.; Jin, Z.; Xu, X. Inclusion complex of astaxanthin with hydroxypropyl-β-cyclodextrin: UV, FTIR, 1H NMR and molecular modeling studies. Carbohydr. Polym. 2012, 89, 492–496. [Google Scholar] [CrossRef]
  20. Garanti, T.A.-O.; Alhnan, M.A.-O.; Wan, K.A.-O. RGD-decorated solid lipid nanoparticles enhance tumor targeting, penetration and anticancer effect of asiatic acid. Nanomedicine 2020, 15, 1567–1583. [Google Scholar] [CrossRef]
  21. Umeyor, E.C.; Kenechukwu, F.C.; Ogbonna, J.D.; Chime, S.A.; Attama, A. Preparation of novel solid lipid microparticles loaded with gentamicin and its evaluation in vitro and in vivo. J. Microencapsul. 2012, 29, 296–307. [Google Scholar] [CrossRef] [PubMed]
  22. Gugu, T.H.; Chime, S.A.; Attama, A.A. Solid lipid microparticles: An approach for improving oral bioavailability of aspirin. AJPS 2015, 10, 425–432. [Google Scholar] [CrossRef]
  23. Scalia, S.; Young, P.M.; Traini, D. Solid lipid microparticles as an approach to drug delivery. Expert Opin. Drug Deliv. 2015, 12, 583–599. [Google Scholar] [CrossRef] [PubMed]
  24. Advankar, A.; Maheshwari, R.; Tambe, V.; Todke, P.; Raval, N.; Kapoor, D.; Tekade, R. Specialized tablets: Ancient history to modern developments. In Drug Delivery Systems; Academic Press: Cambridge, MA, USA, 2019; pp. 615–664. [Google Scholar] [CrossRef]
  25. Aslani, A.; Fattahi, F. Formulation, characterization and physicochemical evaluation of potassium citrate effervescent tablets. Adv. Pharm. Bull. 2013, 3, 217–225. [Google Scholar] [CrossRef] [PubMed]
  26. Aslani, A.; Jahangiri, H. Formulation, characterization and physicochemical evaluation of ranitidine effervescent tablets. Adv. Pharm. Bull. 2013, 3, 315–322. [Google Scholar] [CrossRef]
  27. Rosch, M.; Lucas, K.A.-O.; Al-Gousous, J.; Pöschl, U.; Langguth, P. Formulation and Characterization of an Effervescent Hydrogen-Generating Tablet. Pharmaceuticals 2021, 14, 1327. [Google Scholar] [CrossRef]
  28. Abe, H.; Yasui, S.; Kuwata, A.; Takeuchi, H. Improving powder flow properties of a direct compression formulation using a two-step glidant mixing process. Chem. Pharm. Bull. 2009, 57, 647–652. [Google Scholar] [CrossRef]
  29. Wolska, E.; Sznitowska, M. Technology of stable, prolonged-release eye-drops containing Cyclosporine A, distributed between lipid matrix and surface of the solid lipid microspheres (SLM). Int. J. Pharm. 2013, 441, 449–457. [Google Scholar] [CrossRef]
  30. Sznitowska, M.; Wolska, E.; Baranska, H.; Cal, K.; Pietkiewicz, J. The effect of a lipid composition and a surfactant on the characteristics of the solid lipid microspheres and nanospheres (SLM and SLN). Eur. J. Pharm. Biopharm. 2017, 110, 24–30. [Google Scholar] [CrossRef]
  31. Chimombe, T.; Mukhopadhyay, S.; Veroniaina, H.; Han, L.; Xu, X.; Juan, T.; Wu, Z. Orally disintegrating tablets: Formulation, preparation, evaluation and recent advances: A review. World J. Pharm. Pharm. Sci. 2019, 9, 304–328. [Google Scholar]
  32. Rahimpour, Y.; Javadzadeh, Y.; Hamishehkar, H. Solid lipid microparticles for enhanced dermal delivery of tetracycline HCl. Colloids Surf. B: Biointerfaces 2016, 145, 14–20. [Google Scholar] [CrossRef] [PubMed]
  33. Rojek, B.; Wesolowski, M. FTIR and TG analyses coupled with factor analysis in a compatibility study of acetazolamide with excipients. Spectrochim. Acta A Mol. Biomol. Spectrosc. 2019, 208, 285–293. [Google Scholar] [CrossRef] [PubMed]
  34. Iqbal, N.; Agrawal, A.; Kumar, J. Development of effervescent tablet formulation for rapid control of mosquito problem in early stages from different breeding sites. Arab. J. Chem. 2021, 14, 103082. [Google Scholar] [CrossRef]
  35. Amidon, G.; Secreast, P.; Mudie, D. Particle, Powder, and Compact Characterization. In Pharmaceutical Theory and Practice; Academic Press: Cambridge, MA, USA, 2009; pp. 163–186. [Google Scholar] [CrossRef]
  36. Zhao, F.; Li, M.; Meng, L.; Yu, J.; Zhang, T. Characteristics of Effervescent Tablets of Lactobacilli Supplemented with Chinese Ginseng (Panax ginseng C.A. Meyer) and Polygonatum sibiricum. Appl. Sci. 2020, 10, 3194. [Google Scholar] [CrossRef]
  37. Vogl, J.; Ostermann, M. On the measurement of the moisture content in different matrix materials. Accredit. Qual. 2006, 11, 356–362. [Google Scholar] [CrossRef]
  38. European Pharmacopoeia, 5th ed.; Council of Europe: Strasbourg, France, 2005; Volume 1.
  39. Hill, S.; Varker, A.S.; Karlage, K.; Myrdal, P.B. Analysis of drug content and weight uniformity for half-tablets of 6 commonly split medications. J. Manag. Care Pharm. 2009, 15, 253–261. [Google Scholar] [CrossRef]
  40. Tiwari, R.; Chanda, S.; Mundkinajeddu, D.; Murli, B.; Agarwal, A. HPLC method validation for simultaneous estimation ofmadecassoside, asiaticoside and asiatic acid in Centella asiatica. J. Chem. Pharm. Res. 2010, 2, 223–229. [Google Scholar]
  41. Wu, C.L.; Kuo, Y.H.; Lee, C.L.; Hsu, Y.W.; Pan, T.M. Synchronous high-performance liquid chromatography with a photodiode array detector and mass spectrometry for the determination of citrinin, monascin, ankaflavin, and the lactone and acid forms of monacolin K in red mold rice. J. AOAC Int. 2011, 94, 179–190. [Google Scholar] [CrossRef]
  42. Li, M.; Wang, Q.; Chen, N.; Yao, S.; Sun, X.; Quan, P.; Chen, Y.A.-O. Probing Pharmaceutical Strategies to Promote the Skin Delivery of Asiatic Acid from Hydrogels: Enhancement Effects of Organic Amine Counterions, Chemical Enhancers, and Microneedle Pretreatment. Pharmaceutics 2022, 14, 2532. [Google Scholar] [CrossRef]
  43. Bhoyar, P.K.; Biyani, D.M. Formulation and In vitro Evaluation of Sustained Release Dosage Form with Taste Masking of Metformin Hydrochloride. Indian J. Pharm. Sci. 2010, 72, 184–190. [Google Scholar] [CrossRef]
  44. Kim, E.A.; Park, J.S.; Kim, M.S.; Jeong, M.Y.; Park, H.J.; Choi, J.H.; Seo, J.H.; Choi, Y.S.; Kang, M.J. High-Payload Nanosuspension of Centella asiatica Extract for Improved Skin Delivery with No Irritation. Int. J. Nanomed. 2021, 16, 7417–7432. [Google Scholar] [CrossRef] [PubMed]
  45. Davies, D.J.; Heylings, J.R.; McCarthy, T.J.; Correa, C.M. Development of an in vitro model for studying the penetration of chemicals through compromised skin. Toxicol. Vitr. 2015, 29, 176–181. [Google Scholar] [CrossRef] [PubMed]
  46. Schrader, K.; Rohr, M. Methods for measuring the skin-cleansing effect of surfactants in comparison with skin roughness and compatibility. Clin. Dermatol. 1996, 14, 57–65. [Google Scholar] [CrossRef] [PubMed]
  47. Elsner, P.; Seyfarth, F.; Sonsmann, F.; John, S.M.; Diepgen, T.; Schliemann, S. Development of a standardized procedure for testing the efficacy of workplace cleansers. Contact Dermat. 2014, 70, 35–43. [Google Scholar] [CrossRef] [PubMed]
  48. Tulina, D.A.-O.; Béguin, A.; Pong, H.; Cabarbas, M.D.M.; Klokol, D.; Chan, M.K.S.; Wong, M.B.F. Evaluation of the in vivo cosmetic efficacy of the MF3 blue cell serum gel. One- and two-month test results. J. Cosmet. Dermatol. 2018, 17, 193–202. [Google Scholar] [CrossRef]
  49. Bajaj, S.; Singla, D.; Sakhuja, N. Stability Testing of Pharmaceutical Products. J. Appl. Pharm. Sci. 2012, 2, 129–138. [Google Scholar] [CrossRef]
  50. Momoh, M.A.; Ossai, E.C.; Chidozie, O.E.; Precscila, O.O.; Kenechukwu, F.C.; Ofokansi, K.O.; Attama, A.A.; Olobayo, K.O. A new lipid-based oral delivery system of erythromycin for prolong sustain release activity. Mater. Sci. Eng. C 2019, 97, 245–253. [Google Scholar] [CrossRef]
  51. Lambros, M.; Tran, T.H.; Fei, Q.; Nicolaou, M. Citric Acid: A Multifunctional Pharmaceutical Excipient. Pharmaceutics 2022, 14, 972. [Google Scholar] [CrossRef]
  52. Stahl, H. Effervescent: Dosage manufacturing. Pharm. Technol. Eur. 2003, 15, 25–28. [Google Scholar]
  53. Sun, H.; Wang, X.A.-O.; Wang, J.; Shi, G.; Chen, L. Influence of the formula on the properties of a fast dispersible fruit tablet made from mango, Chlorella, and cactus powder. Food Sci. Nutr. 2019, 8, 479–488. [Google Scholar] [CrossRef]
  54. Chinnasamy, V.; Sreekumar, A. Preparation, Thermo-Physical Studies and Corrosion Analysis of Stable Capric Acid/Cetyl Alcohol Binary Eutectic Phase Change Material for Cold Thermal Energy Storage. Energy Technol. 2018, 6, 397–405. [Google Scholar] [CrossRef]
  55. Karekar, P.; Vyas, V.; Shah, M.; Sancheti, P.; Pore, Y. Physicochemical investigation of the solid dispersion systems of etoricoxib with poloxamer 188. Pharm. Dev. Technol. 2009, 14, 373–379. [Google Scholar] [CrossRef] [PubMed]
  56. Liao, S.; Ma, Q.; An, G.; Zhang, N.; Wang, J.; Xu, C.; Cui, B.; She, X.; Fan, R.; Yongcong, S.; et al. Preparation and evaluation of solid dispersion of asiatic acid with PVPK 30. Dig. J. Nanomater. Biostructures 2013, 8, 685–690. [Google Scholar]
  57. Song, Y.; Wang, L.; Yang, P.; Wenslow, R.M., Jr.; Tan, B.; Zhang, H.; Deng, Z. Physicochemical characterization of felodipine-kollidon VA64 amorphous solid dispersions prepared by hot-melt extrusion. J. Pharm. Sci. 2013, 102, 1915–1923. [Google Scholar] [CrossRef] [PubMed]
  58. Badria, F.A.-O.; Fayed, H.A.; Ibraheem, A.K.; State, A.F.; Mazyed, E.A. Formulation of Sodium Valproate Nanospanlastics as a Promising Approach for Drug Repurposing in the Treatment of Androgenic Alopecia. Pharmaceutics 2020, 12, 866. [Google Scholar] [CrossRef]
  59. Crouter, A.; Briens, L. The effect of moisture on the flowability of pharmaceutical excipients. AAPS PharmSciTech. 2014, 15, 65–74. [Google Scholar] [CrossRef]
  60. Dun, J.; Osei-Yeboah, F.; Boulas, P.; Lin, Y.; Sun, C.C. A systematic evaluation of dual functionality of sodium lauryl sulfate as a tablet lubricant and wetting enhancer. Int. J. Pharm. 2018, 552, 139–147. [Google Scholar] [CrossRef]
  61. Mahmood, Z. Formulation design and evaluation of Cefuroxime axetil 125 mg immediate release tablets using different concentration of sodium lauryl sulphate as solubility enhancer. Braz. J. Pharm. Sci. 2014, 50, 11. [Google Scholar]
  62. Alshora, D.H.; Ibrahim, M.A.; Zayed, G.; Al Rwashed, M.A.; Abou-Taleb, H.A.; Ali, M.F. The role of sodium lauryl sulfate on formulation of directly compressed tablets containing simvastatin and aspirin: Effect on drugs dissolution and gastric mucosa. Saudi Pharm. J. 2022, 30, 635–645. [Google Scholar] [CrossRef]
  63. Korting, H.C.; Kober, M.; Mueller, M.; Braun-Falco, O. Influence of repeated washings with soap and synthetic detergents on pH and resident flora of the skin of forehead and forearm. Results of a cross-over trial in health probationers. Acta Derm. Venereol. 1987, 67, 41–47. [Google Scholar] [CrossRef]
  64. Weller, R.; Price, R.J.; Ormerod, A.D.; Benjamin, N.; Leifert, C. Antimicrobial effect of acidified nitrite on dermatophyte fungi, Candida and bacterial skin pathogens. J. Appl. Microbiol. 2001, 90, 648–652. [Google Scholar] [CrossRef]
  65. Puttarak, P.; Brantner, A. Biological Activities and Stability of a Standardized Pentacyclic Triterpene Enriched Centella asiatica Extract. Nat. Prod. Sci. 2016, 22, 20. [Google Scholar] [CrossRef]
  66. Shaw, D. Drugs Acting on the Gastrointestinal Tract, 7th ed.; APA Publication Manual; American Psychological Association: Washington, DC, USA, 2017; pp. 404–416. [Google Scholar] [CrossRef]
  67. Alizadeh, M.N.; Shayanfar, A.; Jouyban, A. Solubilization of drugs using sodium lauryl sulfate: Experimental data and modeling. J. Mol. Liq. 2018, 268, 410–414. [Google Scholar] [CrossRef]
  68. Kale, K.; Hapgood, K.; Stewart, P. Drug agglomeration and dissolution—What is the influence of powder mixing? Eur. J. Pharm. Biopharm. 2009, 72, 156–164. [Google Scholar] [CrossRef]
  69. Lachiver, E.D.; Abatzoglou, N.; Cartilier, L.; Simard, J.-S. Agglomeration tendency in dry pharmaceutical granular systems. Eur. J. Pharm. Biopharm. 2006, 64, 193–199. [Google Scholar] [CrossRef]
  70. Pavlovska, G.; Tanevska, S. Influence of temperature and humidity on the degradation process of ascorbic acid in vitamin C chewable tablets. J. Therm. Anal. Calorim. 2013, 111, 1971–1977. [Google Scholar] [CrossRef]
  71. Betti, M.; Hrynets, Y.; Bhattacherjee, A. Nonenzymatic Browning Reactions: Overview. In Reference Module in Food Science; Elsevier: Amsterdam, The Netherlands, 2017. [Google Scholar] [CrossRef]
  72. Bobo, G.; Arroqui, C.; Merino, G.; Vírseda, P. Antibrowning Compounds for Minimally Processed Potatoes: A Review. Food Rev. Int. 2019, 36, 1–18. [Google Scholar] [CrossRef]
  73. Win Yee, L.; Cheun, C.; Wong, C.W. Inhibition of enzymatic browning in sweet potato (Ipomoea batatas (L.)) with chemical and natural anti-browning agents. J. Food Process. 2019, 43, e14195. [Google Scholar] [CrossRef]
  74. Ali, H.M.; El-Gizawy, A.M.; El-Bassiouny, R.E.; Saleh, M.A. The role of various amino acids in enzymatic browning process in potato tubers, and identifying the browning products. Food Chem. 2016, 192, 879–885. [Google Scholar] [CrossRef]
  75. Hamdan, N.; Lee, C.A.-O.; Wong, S.A.-O.; Fauzi, C.; Zamri, N.M.A.; Lee, T.A.-O. Prevention of Enzymatic Browning by Natural Extracts and Genome-Editing: A Review on Recent Progress. Molecules 2022, 27, 1101. [Google Scholar] [CrossRef]
  76. Bellucci, E.R.B.; Bis-Souza, C.V.; Domínguez, R.; Bermúdez, R.A.-O.; Barretto, A.C.d.S. Addition of Natural Extracts with Antioxidant Function to Preserve the Quality of Meat Products. Biomolecules 2022, 12, 1506. [Google Scholar] [CrossRef]
  77. Mohd Sabee, M.M.S.; Uyen Thanh, N.; Ahmad, N.; Abdul Hamid, Z. Plastics Packaging for Pharmaceutical Products. In Reference Module in Materials Science and Materials Engineering; Elsevier: Amsterdam, The Netherlands, 2021. [Google Scholar] [CrossRef]
  78. Meisner, M.; Duda, P.; Szulc-Musioł, B.; Sarecka-Hujar, B. Characteristics of Commercial Effervescent Tablets Using Selected Pharmacopeial and Novel Analytical Methods. Appl. Sci. 2023, 13, 3171. [Google Scholar] [CrossRef]
  79. Pagire, S.; Seaton, C.; Paradkar, A. Improving Stability of Effervescent Products by Co-Crystal Formation: A Novel Application of Crystal Engineered Citric Acid. Cryst. Growth Des. 2020, 20, 4839–4844. [Google Scholar] [CrossRef]
  80. Jones, F.R.; Foreman, J. The response of aerospace composites to temperature and humidity. In Polymer Composites in the Aerospace Industry; Woodhead Publishing: Sawston, UK, 2015; pp. 335–369. [Google Scholar] [CrossRef]
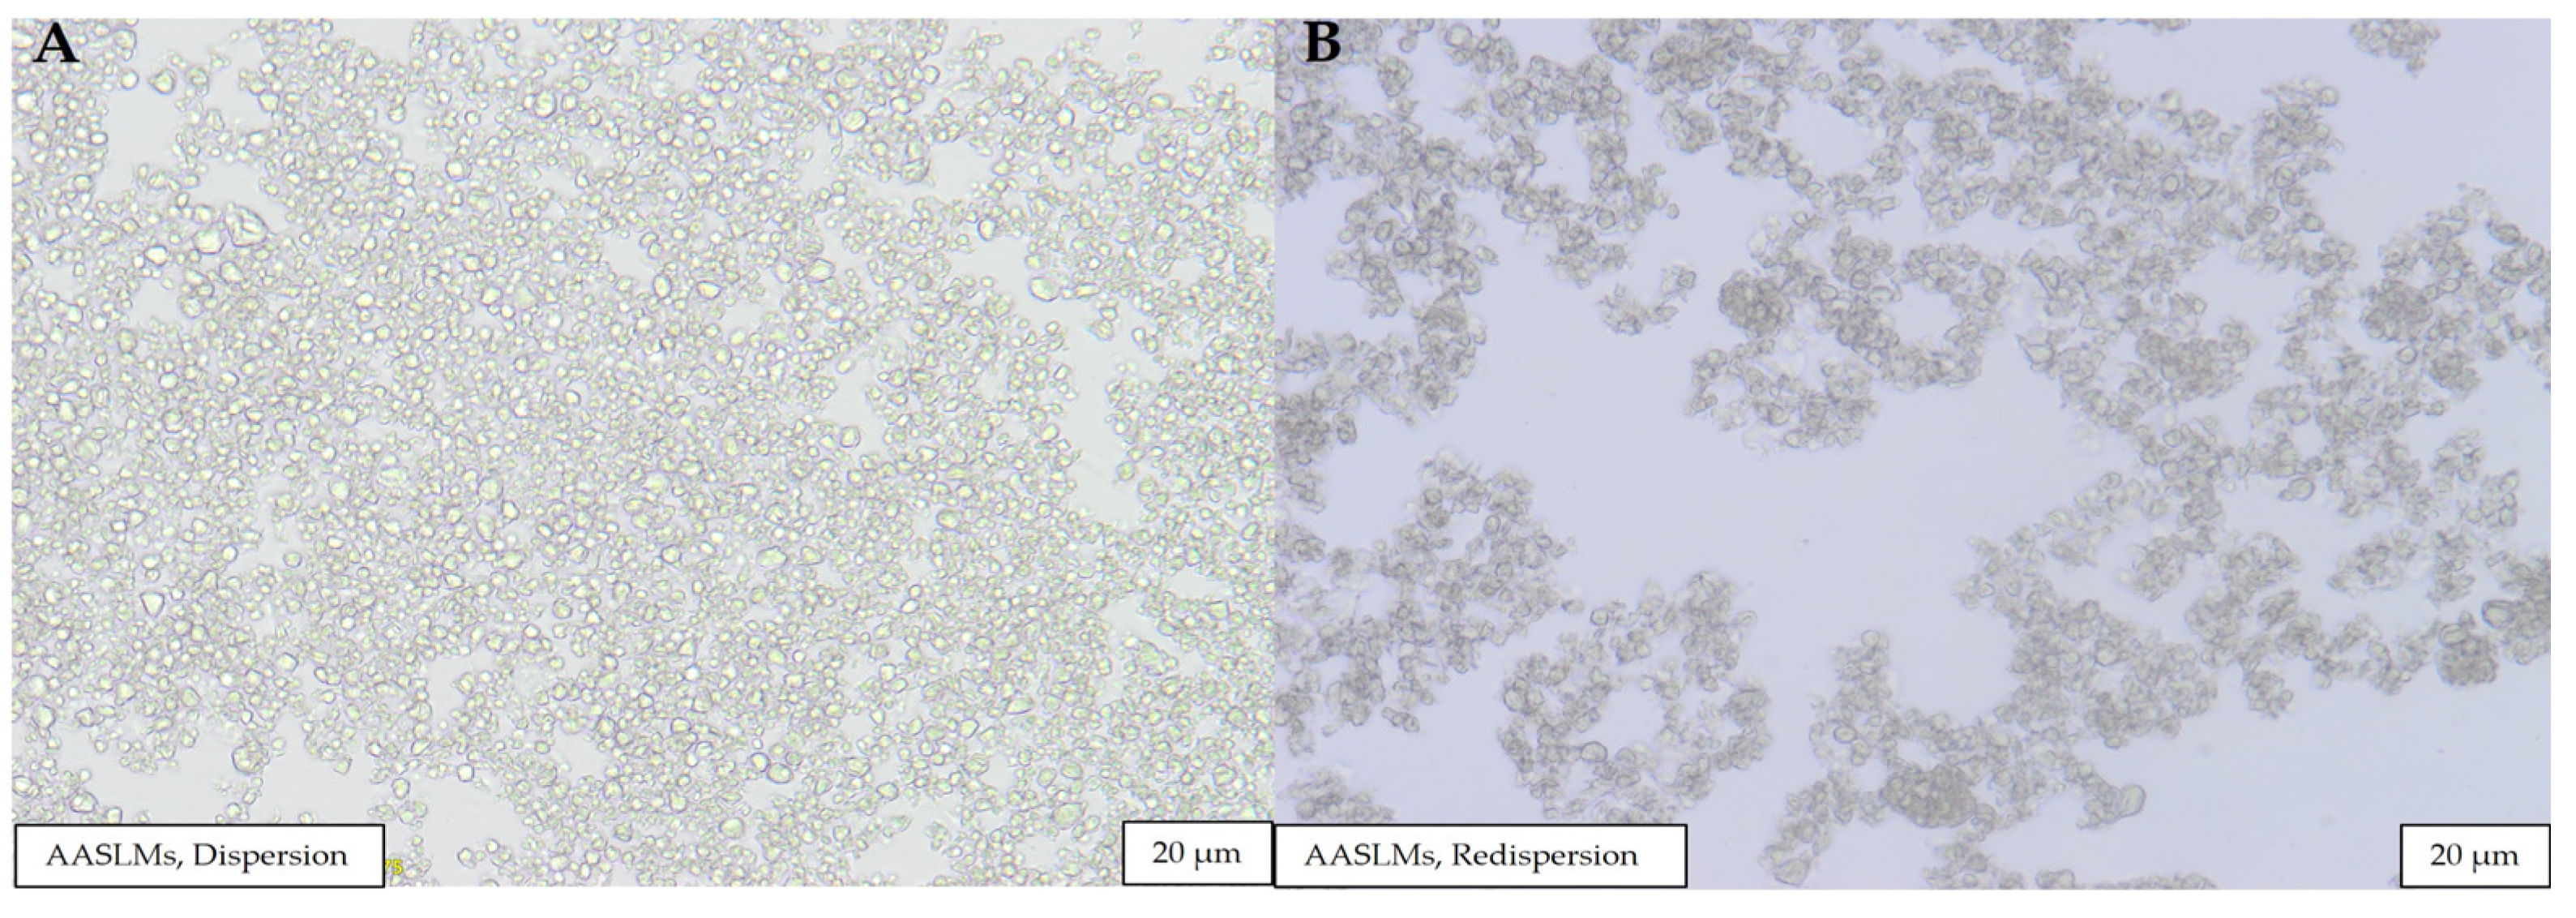
Figure 1. The morphology of (A) AASLM dispersion before freeze-drying and (B) AASLM redispersion of the dried powder under an optical microscope at 40× magnification.
Cosmetics 10 00148 g001
Figure 2. Fourier transform infrared spectra of powder blends.
Cosmetics 10 00148 g002
Figure 3. Physical appearance of effervescent cleansing tablets.
Cosmetics 10 00148 g003
Figure 4. (A) Diameter and thickness, (B) hardness, (C) moisture content, (D) weight, (E) effervescence time, (F) pH, (G) friability, and (H) drug content. All values are expressed as mean (SD). Diameter (n = 10), thickness (n = 10), hardness (n = 10), effervescence time (n = 6), pH (n = 3), friability (n = 10 tablets for triplicate), weight variation (n = 20), moisture content (n = 10), and % drug content (n = 10).
Cosmetics 10 00148 g004
Figure 5. In vitro dissolution profiles of AASLM tablets compared with pure AA tablets containing 2% and 3% SLS (n = 3).
Cosmetics 10 00148 g005
Figure 6. Cleansing efficacy of water, F2, and F3 on porcine skin with model dirt. (A) Photograph from Visioscan® VC 20plus, (B) L values from colorimeter CL 400, and the baseline representing the color of porcine skin before the application of the model dirt.
Cosmetics 10 00148 g006
Figure 7. The physical appearance of effervescent cleansing tablets F2 and F3 stored at 4 ± 2 °C, 25 ± 2 °C, and 40 ± 2 °C (75% RH ± 5% RH) for a duration of 3 months.
Cosmetics 10 00148 g007
Figure 8. Hardness of effervescent cleansing tablets F2 and F3 stored at (A) 4 ± 2 °C, (B) 25 ± 2 °C, and (C) 40 ± 2 °C (75% RH ± 5% RH) for a duration of 3 months.
Cosmetics 10 00148 g008
Figure 9. Effervescence time of effervescent cleansing tablets F2 and F3 stored at (A) 4 ± 2 °C, (B) 25 ± 2 °C, and (C) 40 ± 2 °C (75% RH ± 5% RH) for a duration of 3 months.
Cosmetics 10 00148 g009
Figure 10. pH values of effervescent cleansing tablets F2 and F3 stored at (A) 4 ± 2 °C, (B) 25 ± 2 °C, and (C) 40 ± 2 °C (75% RH ± 5% RH) for a duration of 3 months.
Cosmetics 10 00148 g010
Figure 11. Friability of effervescent cleansing tablets F2 and F3 stored at (A) 4 ± 2 °C, (B) 25 ± 2 °C, and (C) 40 ± 2 °C (75% RH ± 5% RH) for a duration of 3 months.
Cosmetics 10 00148 g011
Figure 12. Moisture content of effervescent cleansing tablets F2 and F3 stored at (A) 4 ± 2 °C, (B) 25 ± 2 °C, and (C) 40 ± 2 °C (75% RH ± 5% RH) for a duration of 3 months.
Cosmetics 10 00148 g012
Figure 13. AA content of effervescent cleansing tablets F2, F3, and control powder blend (free AA) stored at (A) 4 ± 2 °C, (B) 25 ± 2 °C, and (C) 40 ± 2 °C (75% RH ± 5% RH) for a duration of 3 months.
Cosmetics 10 00148 g013
Table 1. Composition (in mg) of effervescent tablet formulations for selecting the optimal acid-to-base ratio and potential formulations for further development.
CodeCitric AcidSodium BicarbonateAASLMsSLSLactose
B110087.45505757.55
B2 100109.31505735.69
B3 100131.18505713.82
B4 10087.455010752.55
B5 100109.315010730.69
B6 100131.185010708.82
B7 10087.455020742.55
B8 100109.315020720.69
B9 100131.185020698.82
B10 10087.455030732.55
B11 100109.315030710.69
B12 100131.185030688.82
B13 10087.455040722.55
B14 100109.315040700.69
B15 100131.185040678.82
B16 10087.455050712.55
B17 100109.315050690.69
B18 100131.185050668.82
Note: One tablet was calculated as 1000 mg.
Table 2. Powder flowability based on the angle of repose, Carr’s index, and Hausner’s ratio.
Angle of Repose (Degree)Carr’s Index (%)Hausner’s RatioType of Flow
25–30≤101.00–1.11Excellent
31–3511–151.12–1.18Good
36–4016–201.19–1.25Fair
41–4521–251.26–1.34Passable
46–5526–311.35–1.45Poor
56–6532–371.46–1.59Very poor
>66>38>1.60Extremely poor
Table 3. Compositions (% w/w) of effervescent cleansing tablet formulations.
Code Citric AcidSodium BicarbonateAASLMsSLSLactose
F11013.125170.88
F21013.125269.88
F31013.125398.88
F41013.125467.88
F51013.125566.88
Note: One tablet was calculated as 1000 mg.
Table 4. Effervescence time, pH, and hardness of effervescent tablets containing selected acid and base ratios and other ingredients.
CodeEffervescence Time pH Hardness
B13.03 ± 0.375.03 ± 0.023.50 ± 0.28
B2 2.20 ± 0.085.43 ± 0.013.33 ± 0.47
B3 2.10 ± 0.035.71 ± 0.023.10 ± 0.67
B4 5.51 ± 0.095.10 ± 0.203.64 ± 0.52
B5 5.33 ± 0.065.66 ± 0.103.80 ± 0.80
B6 3.45 ± 0.055.85 ± 0.043.04 ± 0.30
B7 4.09 ± 0.295.23 ± 0.023.33 ± 0.25
B8 3.52 ± 0.435.51 ± 0.023.65 ± 0.53
B9 3.18 ± 0.185.86 ± 0.193.43 ± 0.31
B10 4.38 ± 0.155.08 ± 0.044.35 ± 0.45
B11 4.37 ± 0.035.92 ± 0.034.45 ± 0.21
B12 3.01 ± 0.426.03 ± 0.024.45 ± 0.70
B13 4.23 ± 0.125.11 ± 0.023.73 ± 0.10
B14 4.08 ± 0.365.59 ± 0.043.80 ± 0.08
B15 3.12 ± 0.096.08 ± 0.013.85 ± 0.10
B16 6.52 ± 0.065.10 ± 0.024.10 ± 0.74
B17 5.38 ± 0.135.66 ± 0.074.35 ± 0.75
B18 5.32 ± 0.126.10 ± 0.094.40 ± 0.28
Note: Sample number for testing effervescence time (n = 3), pH (n = 3), and hardness (n = 10).
Table 5. Angle of repose (AOR, °), Carr’s index (CI, %C), Hausner’s ratio (HR), and moisture content before compression (MCBC, %) of powder blends F1–F4.
CodeAOR CI HR MCBC
F116.07 ± 0.458.15 ± 2.571.08 ± 0.030.27 ± 0.09
F217.89 ± 0.2410.75 ± 1.861.11 ± 0.020.18 ± 0.08
F318.04 ± 0.8011.26 ± 2.191.11 ± 0.020.28 ± 0.10
F416.99 ± 1.0410.29 ± 3.561.10 ± 0.040.38 ± 0.03
F517.55 ± 1.299.04 ± 2.241.09 ± 0.020.34 ± 0.09
Disclaimer/Publisher’s Note: The statements, opinions and data contained in all publications are solely those of the individual author(s) and contributor(s) and not of MDPI and/or the editor(s). MDPI and/or the editor(s) disclaim responsibility for any injury to people or property resulting from any ideas, methods, instructions or products referred to in the content.