Abstract
The peroxisome proliferator-activated receptor (PPAR) ligands modulate a variety of skin functions but are rarely used in cosmetics. The aim of this double-blind, placebo-controlled, in vivo study was to determine the effect of a topically applied 0.1% PPAR ligand on the composition and physiological parameters of the stratum corneum (SC). By comparing verum and placebo groups post-treatment, we demonstrate (via lipidomic analysis of tape strips) an unstatistically significant trend toward an increase in long-chain triacylglycerols (C50–C56) and medium- and long-chain ceramides (C42–C50) at the superficial SC. By comparing treated and untreated skin using confocal Raman microspectroscopy, we found that the changes in lipid composition in the verum group led to a significant increase in the number of trans conformers and orthorhombic organisation of lipids at the exemplary SC depth. An increase in unfolded states in the secondary and tertiary keratin structures results in an increased ability to bind water. The concentrations of tightly and strongly bound water increase, while weakly bound and unbound water decrease in the entire SC, indicating a transformation of water mobility to a state of increased hydrogen bonding. Thus, the topical PPAR ligands improve the water-holding capacity and the barrier function of the SC.
1. Introduction
The stratum corneum (SC), the outermost horny layer of the skin, consists of cells that have lost their nucleus and most organelles (corneocytes), which are surrounded by inner protein and outer lipid envelopes [1], tightly interconnected by corneodesmosomes, and embedded in the structurally organised lipid matrix [2]. The SC plays an important role in protecting the body from external stressors, including pathogens and sunlight, as well as water and electrolyte loss. The dry mass of the SC comprises ≈ 75–80% proteins (mainly keratin), ≈5–15% intercellular lipids (ICLs), and up to 10% natural moisturising factor molecules [3,4], which, in combination with water, enzymes, antioxidants, and other substances [5,6] form a stable morpho-functional unity system, which is directly or indirectly involved in the formation and maintenance of the skin barrier function.
The composition of the ICL matrix is unique and comprises ceramides (CERs ≈ 50 mass%), free fatty acids (FFAs ≈ 10 mass%), cholesterol (CHOL ≈ 25 mass%), cholesterol sulphate, triacylglycerols (TGs) and others (≈15 mass%) [7,8] released from lamellar granules of the stratum granulosum [9] to form a membrane-like lipid structure in the lamellae. This composition and the proportion of ICLs are important for the physiology of healthy skin and are altered in skin diseases [10]. The lipid concentration is non-homogeneous throughout the SC, with a maximum near the surface and a minimum at the bottom [11,12,13]. The surface lipid portion is secreted with the sebum and contains a mixture of TGs, FFAs, CHOL, wax esters, and squalene [14]. TGs are the main component of sebum (also called sebaceous lipids) [15] and are partly degraded by lipases to FFAs [16]. Amphiphilic ceramides are the main components of the SC ICL matrix in mammals and have both a polar hydrophilic ‘head’ and a nonpolar hydrophobic ‘tail’, forming a unique lamellar structure that exhibits self-organisation properties [17,18,19]. The polar hydrophilic lipid heads are connected, facing toward the water environment, and form the periphery of the lipid membrane. The nonpolar hydrophobic lipid tails are not in contact with water and form a common hydrophobic central membrane zone [20,21]. There is no generally accepted understanding of how the ICLs in the lamellae are structured. A three-layer model of the lamellar structure, consisting of alternating long (≈13.4 nm) and short (≈6.4 nm) periodicity phases, has been reported [22,23,24]. Alternative models describe the lamellar structure as consisting only of the short periodicity phase of ≈4.2–4.8 nm [18,25,26,27] or an asymmetric phase of ≈11 nm, which is a combination of two phases of 4.5 and 6.5 nm [18,28]. Thus, the ICLs within the lamellae form a heterogeneous, layered zone that is parallel to the skin surface [19] and structurally organised with a combination of orthorhombic (ordered, very densely packed lipids) and hexagonal (ordered, less densely packed lipids) lateral packing organisations [18,29]. Short-chain length lipids increase the hexagonal organisation, while long-chain length lipids increase the orthorhombic organisation of the ICL matrix and, thus, influence skin barrier function [30,31]. Therefore, skin diseases that are associated with impaired barrier function are mainly connected with a decrease in long-chain and an increase in short-chain lipids in the SC [29,32,33].
The lateral packing of ICLs is non-homogeneous in the SC of healthy human skin and exhibits a distinct orthorhombic organisation at ≈20–40% of the SC depth ex vivo [34,35] and in vivo [36,37]. The orthorhombic organisation directly determines the lateral organisation of the ICL within the lamellae and, consequently, the quality of the skin barrier function [24,29,38,39]. As a result, the structurally organised ICL matrix represents a hard permeable membrane that does not allow most xenobiotics to permeate the SC and reach the cells of the viable epidermis and dermis [40]. At the same time, the ICL matrix ensures a constant value of trans-epidermal water loss (TEWL) and balanced skin hydration, thus regulating the water homeostasis of the entire body.
The SC is non-homogeneously hydrated [41] and has the lowest water concentration (≈35%) on the surface and the highest concentration (≈62%) on the bottom SC depth in healthy human skin in vivo [11]. Most of the SC water is found in the corneocytes and not in the ICL lamellae [42] due to the lower binding ability of water with the polar head groups of lipids compared to keratin and natural moisturising factor molecules [43,44]. The water-binding properties of the SC are also non-homogeneous in depth: at the uppermost depth (0–30% of the SC thickness), natural moisturising factor molecules are mainly responsible for water binding, whereas, at the remaining depth (40–100% of the SC thickness), the keratin filaments have most of the binding sites and are responsible for water binding [45].
Keratin, the main protein of the SC, is non-homogeneously distributed in depth and has the highest concentration at the surface and the lowest concentration at the bottom of the SC [12,46]. At the boundary between the stratum granulosum and the SC, the large profilaggrin protein (>400 kDa) is dephosphorylated and divided into numerous filaggrin monomers, which bind to keratin filaments and form fibrils. Under the influence of transglutaminases, the keratin fibrils are cross-linked by disulfide bonds, resulting in a dense, insoluble in water keratin matrix [47]. In an aqueous solution, the nonpolar side groups of the amino acids have no contact with water molecules, while the polar hydrophilic groups are on the surface of the keratin. Since most of the water in the SC is inside the corneocytes, the secondary and tertiary keratin structures are important for understanding the regulation of water content and binding in the SC. The secondary structure of keratin is related to the spatial organisation of the polypeptide chains, the main types of which are the α-helix and the β-sheets. The tertiary structure of keratin reflects the spatial shape of its secondary structure, which results from its stabilisation by various interactions. The tertiary structure includes keratin folding and is associated with intramolecular interactions due to cystine disulfide bonds, tyrosine hydrogen bonds, ionic bonds between oppositely charged side groups of amino acid residues, and other electrostatic forces that occur between side chains within a protein. A keratin-water interaction can be studied with Raman spectroscopy [45,48] and is advantageous for in vivo application, for instance, in the investigation of the influence of cosmetic formulations on SC hydration [49], especially during occlusion-induced swelling of the corneocytes [50].
Cosmetics offer moisturising, strengthening, and nourishing effects that target the SC exclusively. The strengthening effect is related to the enhancement of the skin barrier function and is mainly associated with the topical application of lipids [51,52]. It is known that peroxisome proliferator-activated receptors (PPARs) are nuclear hormone receptors and comprise three different isoforms, namely PPAR-α, PPAR-γ, and PPAR-β/δ, which are activated by fatty acids and their derivatives [53]. After binding with specific ligands, PPARs have several functions, such as regulation of gene expression, cell growth and differentiation, apoptosis, inflammatory responses, glucose and lipid homeostasis, and tumour genesis. PPARs also modulate a variety of skin functions, including keratinocyte proliferation, epidermal barrier formation, wound healing, melanocyte proliferation, and sebum production [54,55,56]. PPAR-α/γ are preferentially expressed in the suprabasal epidermis, while PPAR-β/δ is found throughout the epidermis. PPAR-γ protects against excessive collagen synthesis and has antifibrotic [57], anti-inflammatory [58], and anti-obesity [59] activities in the skin. PPAR-γ activators stimulate the expression of aquaporin 3 in keratinocytes, which can influence the SC hydration and water binding properties [60] and is an essential element of hair follicle development [61] and stem cell biology [62].
Due to their manifold beneficial effects, PPAR ligands are used in clinical trials, particularly in cancer therapy, anti-inflammatory therapy of multiple sclerosis and rheumatoid arthritis, and as antidiabetic agents. Natural plant food terpenoids [53] and aloe phytosterols [63] act as ligands of PPAR-α and PPAR-γ and may be useful in the treatment of obesity-induced metabolic disorders. Dietary PPAR-γ agonists exert inhibitory effects on pro-inflammatory cytokines and promote differentiation in immune cells into anti-inflammatory phenotypes [64]. The PPAR-γ isotype plays a role in stimulating sebocyte development and lipogenesis but does not appear to contribute to epidermal tissue differentiation [65,66]. In addition, PPAR ligands are used topically for the treatment of skin diseases with minimal side effects [67]. For instance, a cream containing sunflower oleodistillate—a natural PPAR-α agonist—has demonstrated a therapeutic effect on the skin of patients with atopic dermatitis, similar to the effect of topical steroids [68].
Considering the fact that there is still a need for non-toxic cosmetic actives beneficial for the SC, the use of PPARs in cosmetics seems very promising and has only been shown in a few studies so far. Topical application of natural plant extracts has been shown to act as a reversible PPAR-α agonist that induces the synthesis of ceramides and filaggrin, thereby accelerating barrier repair activity [69]. The improvement of skin barrier function by activation of PPAR-α and anti-inflammatory activity has been reported following the topical application of exemplary flavonoids [70]. Topical mevalonolactone has been shown to promote fatty acid transport to lamellar granules, which improves barrier function through increased expression of PPAR-β/δ [71]. Tachibana et al. [72] have recently shown that many natural compounds can activate PPAR-α and can potentially be used as cosmetic actives. Exemplary PPAR-γ agonists have been shown to reduce melanogenesis, thus acting as whiteners in cosmetics [73].
The aim of this double-blind placebo-controlled in vivo study was to investigate the cosmetic effect of the topical application of PPAR ligand, in particular the PPAR-α and PPAR-γ agonists, or oxeglitazar on the lipid composition and organisation, water binding, and keratin folding in the SC using low-invasive (tape stripping) lipidomic analysis and non-invasive confocal Raman microspectroscopy.
2. Materials and Methods
2.1. Study Design
During visit 1 (V1), before the first treatment, the 4 cm × 4 cm area on the volar forearm was marked for measurements at a distance of ≈30 cm from the middle fingertip. If necessary, hair was carefully removed from the measurement position using scissors without influencing the SC integrity. Eight of the volunteers were randomly assigned to the verum group and the other eight to the placebo group. The volunteers were also randomly assigned to apply the cream on the left or right forearm.
Subsequently, 3 measurements of the TEWL were performed on the marked area using a Tewameter TM 300 (Courage+Khazaka electronic GmbH, Cologne, Germany). Then, depth profiles at 10 different skin positions were recorded using CRM. The measurements did not influence each other. Within the marked skin area and beside the position used for the TEWL and CRM measurements, 5 tape strips were taken from half of the volunteers of both groups. Further, the tape strips were prepared for lipidomic analysis. TEWL, CRM, and tape stripping were performed before the beginning and at the end of the study during visit 2 (V2) after 21 days of treatment.
Subsequent to the experiments, the volunteers autonomously applied an amount of ≈0.3 g of either a verum or a placebo cream twice daily (in the morning and evening) on the volar forearm for the 21-day study period. The study personnel performed the first cream treatment to show the volunteers the treatment procedure. The measurements and, if applicable, the tape stripping procedure were repeated one day after the last cream application. Neither the investigators nor the volunteers were aware which cream was the verum during the study and subsequent analysis.
2.2. Volunteers
Sixteen healthy Caucasian volunteers (six male and ten female) aged 23 to 62 years (mean age of 37 years) were included in this study. The volunteers were instructed not to apply any skin care products on the arms at least 72 h prior to the beginning of the study. During the 21-day study period, the volunteers were required to use only test creams and no other cosmetic formulations on their arms. Before the measurements, the volunteers acclimated for 15 min in laboratory conditions (temperature +21 °C). The volunteers gave their written informed consent to participate in this study. Approval for the measurements was obtained from the Ethics Committee of the Charité–Universitätsmedizin Berlin (EA1/190/19).
2.3. Applied Substances
The creams were provided by Merck Electronics KGaA (Darmstadt, Germany) and consisted of a base cosmetic formulation (placebo cream) containing Cetearyl Alcohol, Cetearyl Glucoside (4.0%), Sorbitan Stearate (1.5%), Caprylic/Capric Triglyceride (10.0%), Propylene Glycol (3.0%), Xanthan Gum (0.3%), Aqua (79.1%), and Phenoxyethanol and Ethylhexyl Glycerin (1.0%). The verum cream additionally contained 0.1% of oxeglitazar (5-(7-methoxy-3,3-dimethyl-2,3-dihydro-1-benzoxepin-5-yl)-3-methyl-penta-2,4 dienoic acid)—a non-therapeutic peroxisome proliferator-activated receptor (PPAR) ligand, specifically acting as a PPAR-α and PPAR-γ agonist. The molecular formula of the oxeglitazar was C19H22O4, and the molecular weight was 314.4. The chemical structure of the oxeglitazar is shown in Supplementary Figure S1.
2.4. Confocal Raman Microspectroscopy (CRM)
Confocal Raman microspectroscopic measurements were performed in vivo and non-invasively on the inner forearm skin area using a Model 3510 skin composition analyser (RiverD International B.V., Rotterdam, The Netherlands). Depth profiles at 10 different skin positions in the fingerprint (FP: 400–2200 cm−1, excitation at 785 nm, ≈20 mW) and in the high wavenumber (HWN: 2500–4000 cm−1, excitation at 671 nm, 11 mW) regions were recorded from the skin surface to a depth of 40 µm at increments of 2 µm, which ensures the entire SC was covered, which usually has a typical thickness of around 20 µm [74]. The spatial and spectral resolutions of the CRM were <5 µm and <2 cm−1, respectively.
The SC thickness was evaluated by the distance from the skin surface, determined by half of the maximum of the keratin-related Raman band intensity at 1650 cm−1 [46], to the border of the SC to the underlying stratum granulosum, determined by the position, where the water gradient profile (Raman band at 3000–3700 cm−1) reaches 0.5, proposed by Crowther et al. [75]. Determining the skin surface position by the keratin-related Raman band at 1650 cm−1 is advantageous [76], as no superposition with cream-related bands exists (Supplementary Figure S2).
The following substances and physiological parameters of the SC were determined depth-dependently:
The lipid concentration was determined by the ratio of lipid- (at 2850 and 2880 cm−1) to keratin-related Raman band (at 2930 cm−1) intensities in the HWN region, i.e., (I2850 + I2880)/I2930 according to the algorithm described in [36], which separates the overlapping of lipid and keratin Raman band contributions in the HWN region.
The lamellar ICL organisation was determined by calculating the ratio of the Raman band AUCs (area under the curve) at 1080 cm−1, which indicated the presence of lipid chains containing gauche conformers (a less ordered lamellar organisation of ICLs), to 1060 and 1130 cm−1, which indicated the presence of trans conformers (a more ordered lamellar organisation of ICLs). This ratio is described as I1080/(I1060 + I1130), according to the literature [36,77].
The full width at half maximum (FWHM) of the Gaussian band at 2850 cm−1, determined after deconvolution of the broad 2820–3030 cm−1 Raman band by four Gaussian functions [78], characterised the lateral organisation state of the ICL. A narrower FWHM denotes a higher hexagonal (disordered) ICL organisation, while a broader FWHM denotes a higher orthorhombic (ordered) ICL organisation [79].
The β-sheet/α-helix ratio characterised the secondary structure of keratin and was determined by calculating the ratio of the Raman band AUCs for β-sheet keratin forms (952–966 cm−1) to those for α-helix keratin forms (924–946 cm−1), expressed as I952–966/I924–946, as described in the literature [45,80].
The exposed states of CH3 side-chains of keratin, i.e., folding/unfolding states of keratin [81], were determined by the position of a Gaussian function at ≈2930 cm−1 after decomposition of the broad Raman band, which characterised the symmetric stretching vibration of the hydrophobic CH3 group, i.e., the tertiary structure of keratin [45,82,83].
The cysteine forming disulphide bonds in keratin filaments described the tertiary keratin structure and was determined by the ratio of C–S (690–712 cm−1)/S–S (474–578 cm−1) AUCs, i.e., I690–712/I474–578, according to the literature [45].
The buried and exposed configurations of aromatic rings of tyrosine in keratin were determined by the ratio of the ring-breathing Raman band AUCs sensitive to buried (830 cm−1) and exposed (850 cm−1) tyrosine side chains, i.e., I830/I850, as described in the literature [45,77,84].
To compensate for the light loss caused by absorption and scattering in the skin, the relative concentration of total water was determined by the ratio of the AUCs of the water-related Raman band (3350–3550 cm−1) to the keratin-related Raman band (2935–2980 cm−1) [5].
The relative concentrations of tightly bound (Raman shift position at 3015 cm−1), strongly bound (Raman shift position at 3225 cm−1), weakly bound (Raman shift position at 3451 cm−1), and unbound (Raman shift position at 3633 cm−1) water mobility states were determined by the ratio of the corresponding decomposed Gaussian band intensity at I3015, I3225, I3451, or I3633 to the sum intensity of all water-related decomposed Gaussian bands (I3015 + I3225 + I3451 + I3633), as described elsewhere [48,85]. The values are in % of the total water concentration.
The hydrogen bonding state of the water (water mobility state) in the SC represents the ratio of weakly bound to strongly bound water, introduced by Choe et al. [85]. Lower values represent an increased number of hydrogen bonds between the water and its surroundings (keratin, NMF, and ICLs), which is associated with a stronger skin barrier function.
The presented parameters were calculated based on the spectral Raman profiles throughout the entire SC and were interpolated at steps of 10% of the SC thickness (% SC depth) for every profile. For readability, the profiles are shown without standard deviation.
2.5. Tape Stripping
D-squame tape strip discs (CuDerm, Dallas, TX, USA) were taken, and each tape strip was placed in a plastic tube (Safe-Lock Tubes 2.0 mL, Eppendorf, Hamburg, Germany) and stored at −80 °C. To prepare tape strip samples for lipidomic analysis, 1 mL methanol (Biosolve BV, ULC/MS-CC/SFC, Valkenswaard, Netherlands) was added to each plastic tube and incubated for one hour on a rotary shaker (PMR-30, Grant Instruments Ltd., Shepreth, UK). The tape strip disc was always placed at the bottom of the tube and covered with methanol. Then, the methanol solution was transferred to a new plastic tube (Safe-Lock Tubes 1.5 mL, Eppendorf, Hamburg, Germany) using 1 mL Eppendorf tips (new for each sample), dried in SpeedVac (concentrator 5301, Eppendorf, Hamburg, Germany), stored at −80 °C, and shipped on dry ice for further lipidomic analysis.
2.6. Lipidomic Analysis
TGs from the SC samples were extracted with tert-methyl-butyl ether (MTBE) solvent and analysed by reverse-phase liquid chromatography–tandem mass spectrometry (RP-LC/MS2). CERs from the SC samples were extracted using a mixture of chloroform, isopropanol, and methanol and analysed by direct-infusion, high-resolution tandem mass spectrometry (DI-MS2). RP-LC/MS2 and DI-MS2 workflows and the preparation and data analysis procedures are described in detail in the literature [86,87].
The following TGs: TG(14:0_14:0_15:0), TG(14:0_15:0_16:1), TG(15:0_15:0_16:0), TG(15:1_16:0_16:1), TG(15:0_16:0_16:1), TG(15:0_16:0_16:0), TG(14:0_16:1_18:1), TG(16:0_16:0_16:1), TG(16:0_16:0_16:0), TG(15:1_16:1_18:1), TG(15:0_16:1_18:1), TG(15:0_16:0_18:1), TG(15:0_16:0_18:0), TG(16:1_16:1_18:2), TG(16:0_16:0_18:1), TG(16:0_16:0_18:0), TG(16:1_17:1_18:1), TG(16:0_17:1_18:1), TG(16:0_17:0_18:1), TG(16:0_17:0_18:0), TG(16:1_18:1_18:2), TG(16:0_18:1_18:2), TG(16:0_18:0_18:1), TG(17:1_18:1_18:1), TG(17:0_18:1_18:1), TG(18:1_18:2_17:1), TG(18:0_18:1_18:1), TG(18:1_18:1_19:1), TG(18:1_18:1_20:2), and TG(18:1_18:1_20:1) and the following CERs: Cer(d16:2/18:0), dhCer(d18:0/18:1), Cer(d20:1/18:0), dhCer(d20:0/18:0), Cer(t18:0/20:0), Cer(m18:2/23:0), dhCer(d22:0/18:0), Cer(m20:2/22:0), Cer(d18:2/23:0), Cer(d18:2/24:0), Cer(t17:0/24:0), Cer(m20:2/24:0), Cer(d19:2/24:0), Cer(t16:0/26:0), α|ω-Cer(t17:0/24:0), α|ω-Cer(d18:2/25:0), dhCer(d20:0/24:0), Cer(t18:0/25:0), α|ω-Cer(t18:0/24:0), Cer(m22:2/24:0), Cer(d18:2/27:0), α|ω-Cer(d20:1/24:0), Cer(t18:0/26:0), α|ω-Cer(t18:0/25:0), Cer(m21:2/26:0), Cer(d20:2/26:0), Cer(d19:2/26:0), dhCer(d20:0/26:0), Cer(d21:1/24:0), α|ω-Cer(t18:0/26:0), α|ω-Cer(d20:2/26:0), Cer(t20:1/26:0), Cer(t18:0/28:0), α|ω-Cer(t21:0/24:0), Cer(d22:2/26:0), α|ω-Cer(d20:2/27:0), dhCer(d24:0/24:0), Cer(t22:0/25:0), Cer(m22:2/28:0), Cer(t20:0/28:0), and Cer(d20:2/30:0) were determined in the SC tapes using lipidomic analysis. The mean values obtained from 5 tape strips for 4 volunteers in the verum group and 4 volunteers in the placebo group are presented.
2.7. Statistical Analysis
Statistical evaluation was performed using the statistical functions of OriginPro 9.0 (Northampton, MA, USA) and MATLAB R2019b (The MathWorks, Inc., Natick, MA, USA).
During the lipidomic analysis, the mean values averaged for 5 tape strips were compared, suggesting the non-normal distribution of the data due to the low number of volunteers in every group (4 in the placebo and verum groups). Thus, the comparison between V1 (untreated) and V2 (post-treated) within one group was performed using a paired sample Wilcoxon Signed Rank test, and the comparison between the verum and placebo groups was performed using a Mann–Whitney test. The difference in fold change from 1 has been proven using a one sample t-test.
During the Raman analysis, the mean values of 5–10 profiles for every subject measured during V1 (untreated) and V2 (post-treated) were compared for the verum and placebo groups and between the groups for every SC depth using a paired sample t-test.
During the TEWL and SC thickness analysis, the mean values were compared, suggesting the non-normal distribution of the data due to the low number of volunteers in every group (8 in the placebo and verum groups). Thus, the comparison between V1 (untreated) and V2 (post-treated) within one group was performed using a paired sample Wilcoxon Signed Rank test, and the comparison between the verum and placebo groups was performed using a Mann–Whitney test.
p < 0.05 were considered significant, and p < 0.01 were considered strongly significant. Compensation for type 1 errors due to multiple testing was not performed; therefore, the occurrence of single significant differences should be considered carefully.
3. Results
The total amount of applied cream per volunteer during the 21-day study period was, on average, 12 ± 8 g for the placebo and 14 ± 8 g for the verum group. The verum cream was slightly denser, with 0.35 g per stroke, as opposed to 0.32 g per stroke for the placebo cream. According to surveys at the end of this study, two volunteers of the placebo group forgot once, and one volunteer of the placebo group forgot twice to apply the cream during the study period.
3.1. Influence of the Test Formulations on the Lipids of the SC
3.1.1. Triacylglycerols (TGs)
Figure 1A shows the change in the concentration of all thirty measured superficial SC TGs in the verum and placebo groups (V1: before, and V2: after the treatment period of 21 days). No significant differences were measured before and after treatment in both groups, but a tendency for a slight increase in the total TG concentration in the placebo compared to the verum group was observed (1.2 vs. 1.0 times on average). The fold change (V2/V1 ratio) is presented in Figure 1B and shows no significant differences between the verum and placebo groups. The mean non-significant fold change was 1.0 ± 0.2 in the verum and 1.3 ± 0.5 in the placebo group, calculated for all thirty TGs. Figure 1C shows the TG fold change during V2 (verum V2/placebo V2 ratio) for all thirty measured TGs. It is obvious that verum treatment results in a strong, non-significant increase in the concentration of mainly long-length chain TGs: TG(15:0_16:0_18:0), TG(16:0_16:0_18:1), TG(16:1_18:1_18:2), TG(16:0_18:1_18:2), TG(16:0_18:0_18:1), TG(18:1_18:2_17:1), TG(18:0_18:1_18:1), TG(18:1_18:1_19:1), TG(18:1_18:1_20:2), and TG(18:1_18:1_20:1), while placebo treatment results in a significant increase in the concentration of short- and medium-length chain TGs: TG(14:0_14:0_15:0), TG(14:0_15:0_16:1), TG(15:1_16:0_16:1), TG(15:0_16:0_16:1), TG(15:0_16:0_16:0), TG(16:0_16:0_16:1), TG(15:0_16:0_18:1), and TG(16:0_17:0_18:0) and a non-significant increase in mainly the short- and medium-length chain TGs: TG(15:0_15:0_16:0), TG(14:0_16:1_18:1), TG(16:0_16:0_16:0), TG(15:1_16:1_18:1), TG(15:0_16:1_18:1), TG(16:1_16:1_18:2), TG(16:0_16:0_18:0), TG(16:1_17:1_18:1), TG(16:0_17:1_18:1), and TG(16:0_17:0_18:1).

Figure 1.
The influence of creams on human SC TGs. Changes in the mean concentration of thirty TGs in the verum/placebo groups before (dark grey/light grey) and after (green/red) treatment (A); the fold change (V2/V1 ratio) in the verum (green) and placebo (red) groups (B); the fold change (verum V2/placebo V2 ratio) (C). “*”/”×” represent significant differences p < 0.05/p < 0.01 between the verum and placebo groups. The horizontal line in (B,C) means that there are no changes between the groups—zoom in for better visualisation.
Normalising to the concentration of the short-length chain TG(14:0_14:0_15:0) shows that the ≥2-fold change between the verum and placebo groups during V2 (verum V2 normalised/placebo V2 normalised ratio) was observed for the following twelve TGs: TG(16:0_16:0_18:1), TG(16:0_16:0_18:0), TG(16:1_18:1_18:2), TG(16:0_18:1_18:2), TG(16:0_18:0_18:1), TG(17:1_18:1_18:1), TG(17:0_18:1_18:1), TG(18:1_18:2_17:1), TG(18:0_18:1_18:1), TG(18:1_18:1_19:1), TG(18:1_18:1_20:2), and TG(18:1_18:1_20:1), which are medium- and majorly long-length chain TGs (≥C50). A significant fold change of ≈9 was observed for the long-length chain TG(18:0_18:1_18:1) (Supplementary Figure S3). The mean acyl chain length of all TGs (determined by the total number of carbons in the three fatty acids) before and after the treatment showed no significant changes in the verum (C48.0 ± 0.1 and C48.6 ± 1.3) and placebo (C48.0 ± 0.1 and C48.0 ± 0.1) groups and also between the groups. However, the verum group has a stronger tendency for TG acyl chain length to increase following treatment than the placebo group (Figure 1C, Supplementary Figure S3).
3.1.2. Ceramides (CERs)
Figure 2A shows the change in the concentration of all forty-one measured superficial SC CERs in the placebo and verum groups (V1: before, and V2: after the treatment period of 21 days). No significant differences were measured before and after treatment in both groups, but a tendency for a slight increase in the total CER concentration in the placebo compared to the verum group was observed (1.2 vs. 1.1 times). The fold change (V2/V1 ratio) is presented in Figure 2B and shows no significant differences between the verum and placebo groups for all forty-one CERs. The mean non-significant fold change was 1.2 ± 0.2 in the verum and 1.4 ± 0.3 in the placebo group. Figure 2C shows the CER fold change during V2 (verum V2/placebo V2 ratio) for all forty-one measured CERs. It is obvious that the verum treatment results in a non-significant increase in the concentration of eleven short-, medium- and long-length chain CERs: dhCer(d18:0/18:1), Cer(d20:1/18:0), dhCer(d20:0/18:0), Cer(m20:2/22:0), α|ω-Cer(t18:0/24:0), α|ω-Cer(d20:1/24:0), α|ω-Cer(t18:0/26:0), α|ω-Cer(t21:0/24:0), dhCer(d24:0/24:0), Cer(t22:0/25:0), and Cer(t20:0/28:0), while the placebo treatment results in a significant increase in the concentration of medium-length chain Cer(d18:2/27:0) and a non-significant increase in the remaining twenty-nine CERs. Normalising to the concentration of the short-length chain Cer(d16:2/18:0) shows that the ≥2-fold change between the verum and placebo groups during V2 (verum V2 normalised/placebo V2 normalised ratio) is observed for the following thirteen CERs: Cer(m20:2/22:0), α|ω-Cer(t18:0/24:0), α|ω-Cer(d20:1/24:0), α|ω-Cer(t18:0/25:0), Cer(d19:2/26:0), α|ω-Cer(t18:0/26:0), α|ω-Cer(d20:2/26:0), Cer(t20:1/26:0), α|ω-Cer(t21:0/24:0), α|ω-Cer(d20:2/27:0), dhCer(d24:0/24:0), Cer(t22:0/25:0), and Cer(t20:0/28:0), which are the medium- and long-length chain CERs (≥C42). A significant fold change of ≈2.5 was observed for the long-length chain Cer(t20:0/28:0) (Supplementary Figure S4). The mean CER chain length (determined by the total number of carbons in the fatty acid and sphingoid moieties) before and after the treatment showed no significant changes in the verum (C44.8 ± 1.1 and C45.3 ± 0.8) and placebo (C44.3 ± 0.9 and C44.8 ± 1.1) groups and also between the groups. Nevertheless, the clear tendency for CER chain length to increase after the treatment is stronger pronounced in the verum than in the placebo group (Supplementary Figure S4).

Figure 2.
The influence of creams on human SC CERs. Changes in the mean concentration of forty-one CERs in the verum/placebo groups before (dark grey/light grey) and after (green/red) treatment (A); the fold change (V2/V1 ratio) in the verum (green) and placebo (red) groups (B); the fold change (verum V2/placebo V2 ratio) (C). “*” represents a significant difference p < 0.05 between the verum and placebo groups. The horizontal line in (B,C) means that there are no changes between the groups—zoom in for better visualisation.
3.1.3. Lipid Concentration
The depth profile of the total lipid concentration in the SC before (V1) and after treatment (V2) determined by CRM is shown in Figure 3A. After treatment, the lipid concentration significantly increased at 0–40% SC depth in the placebo and at 0–30% SC depth in the verum group. This could be an effect of the penetrated creams, as the directly measured lipid concentration was 4.9 ± 1.1 Arb. Unit for the placebo and 5.8 ± 1.3 Arb. Unit for the verum cream are higher than the values at the untreated superficial SC depth (≈1.1 Arb. Unit, Figure 3A). The differences between the placebo and verum groups during V2 were not statistically significant, except for the exemplary 70% SC depth, with a higher concentration in the placebo group.
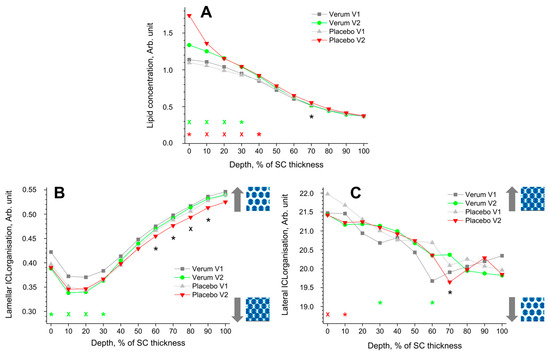
Figure 3.
The influence of creams on human SC lipids. Depth profiles of lipid concentration (A), lamellar (B), and lateral (C) ICL organisation in the SC in the verum/placebo groups before (V1, dark grey/light grey) and after (V2, green/red) treatment. Significant (p < 0.05, marked with “*”) and strongly significant (p < 0.01, marked with “×”) differences between untreated (V1) and post-treated (V2) skin are shown with green/red colours for the verum/placebo groups and with black for the comparison of verum V2 and placebo V2 at a certain SC depth. The SC thickness is normalised to 100% (0%: surface; 100%: bottom of the SC).  /
/ : more or less ordered structure of ICLs in the SC.
/: more or less ordered structure of ICLs in the SC.
3.1.4. Lamellar ICL Organisation
The lamellar ICL organisation is an indirect measure of the skin barrier function and can be determined using CRM by the I1080/(I1060 + I1130) ratio. Lower values represent a higher amount of trans conformers (higher-ordered ICL state), while higher values represent a higher number of gauche conformers (lower-ordered ICL state). In the trans conformation, the lipid alkyl chains are oriented straight, making the lipid molecules more densely packed. The directly measured I1080/(I1060 + I1130) value was 0.40 ± 0.07 for the placebo and 0.42 ± 0.06 for the verum cream, which is very close to the initial values at the superficial SC of untreated skin (I1080/(I1060 + I1130) ≈ 0.35–0.42) (Figure 3B). Thus, the creams themselves have no influence on the obtained profiles after the verum and placebo treatments.
All groups showed a minimum I1080/(I1060 + I1130) ratio (maximal number of trans conformers) at 10–20% SC depth. For the verum group, the number of trans conformers significantly increases in this region (0–30% SC depths), directly indicating an enhancement of the skin barrier function. During V2, the placebo group shows a significantly higher number of trans conformers than the verum group at 60–90% SC depth.
3.1.5. Orthorhombic/Hexagonal Lateral State of ICLs
The FWHM of the 2850 cm−1 band is a measure of the lateral state of ICLs [78]. A narrower FWHM denotes a higher hexagonal (low ordered state) ICL organisation, while a broader FWHM denotes a higher orthorhombic ICL organisation (highly ordered state). Both groups show a continuous decrease in the FWHM towards the deeper SC depth. The ICL organisation of the placebo group decreased significantly after treatment at 0–10% SC depth, which was not observed for the verum group. For the verum group, the ICL organisation is significantly increased towards higher orthorhombic organisation at 30 and 60% SC depth. During V2, the placebo group shows a significantly lower ICL organisation, only at 70% SC depth, compared to the verum group. The observed changes could not be attributed to the penetrated creams, as the directly measured FWHM of the 2850 cm−1 band was 20.8 ± 0.8 cm−1 for the placebo and 20.4 ± 0.7 cm−1 for the verum cream, i.e., very close to the values at the surface of the untreated skin (≈21.7 cm−1).
3.2. Influence of the Test Formulations on the Keratin of the SC
3.2.1. β-Sheet/α-Helix Keratin Forms
The β-sheet/α-helix ratio is determined by the ratio of the I952–966/I924–946 band intensities, and its depth profiles in the SC are shown in Figure 4A. The α-helix form is highly stable with less exposed side chains and a lower possibility to bind water than the β-sheet form. All profiles show a minimum at 10% SC thickness (highest α-helix form) and a gradual increase towards the bottom of the SC (highest β-sheet form). While no significant differences were found for the placebo group, the β-sheet/α-helix ratio is significantly higher for the verum group during V2 throughout the entire SC. This means that the possibility of binding water with keratin significantly increases after the application of verum cream. The creams themselves do not influence the obtained results; as directly measured, the I952–966/I924–946 ratio was 0.23 ± 0.03 for the placebo and 0.29 ± 0.04 for the verum cream, which is considerably lower than the values corresponding to the skin surface (≈0.45).

Figure 4.
The influence of creams on human SC keratin. The depth profiles of β-sheet/α-helix keratin forms (A), cysteine forming disulphide bonds in the keratin filaments (B), buried/exposed tyrosine (C), and Raman band position at 2930 cm−1 (D) in the SC in the verum/placebo groups before (V1, dark grey/light grey) and after (V2, green/red) treatment. Significant (p < 0.05, marked with “*”) and strongly significant (p < 0.01, marked with “×”) differences between untreated (V1) and post-treated (V2) skin are shown with green/red colours for the verum/placebo groups and with black for the comparison between verum V2 and placebo V2 at a certain SC depth. The SC thickness is normalised to 100% (0%: surface; 100%: bottom of the SC). The colour in the arrows represents the increase (dark blue) and decrease (light blue) of water molecules bonding by keratin.
3.2.2. Cysteine Forming Disulphide Bonds in the Keratin Filaments
The cysteine forming disulphide bonds in the keratin filaments are determined by the I690–712/I474–578 ratio, and its depth profiles in the SC are shown in Figure 4B. Higher values denote a lower amount of cysteine, which forms disulphide bonds in keratin chains, which entails weak interaction between the cysteine side chains and, hence, reduced folding, thereby enhancing the possibility of binding water. All profiles show a minimum at ≈10% SC depth and a gradual increase towards the bottom of the SC. No significant differences between the placebo and the verum groups were found when comparing V1 and V2. During V2, the verum group shows significantly higher values at 0–10 and 90% SC depths compared to the placebo group, which indicates an increased possibility for water binding at these depths. Directly measured, the I690–712/I474–578 ratio was 0.04 ± 0.02 for the placebo and 0.04 ± 0.01 for the verum cream, i.e., the creams have no or only a negligible influence on the results.
3.2.3. Buried/Exposed Tyrosine
Buried tyrosine forms hydrogen bonds with keratin side chains, while exposed tyrosine forms hydrogen bonds with water and biomolecules outside the keratin chains. Therefore, an increased buried/exposed tyrosine ratio, determined by the I830/I850 value, denotes an increased folding of keratin and a decreased possibility of binding water. All profiles shown in Figure 4C have minimal values at 20–40% SC depth, indicating the lowest water binding possibilities at the skin surface and at the bottom of the SC. For the placebo group, the ratio is significantly decreased at the surface (0% SC depth) and increased at 60–80 and 100% SC depth during V2 compared to V1. For the verum group, it decreased only at 0% SC depth. During V2, the buried/exposed tyrosine ratio of the verum group is significantly higher than that of the placebo group at 40% SC depth. The creams themselves have no influence on the results, as the directly measured I830/I850 ratio was 0.52 ± 0.05 for the placebo and 0.54 ± 0.04 for the verum cream, which is very close to the values corresponding to the superficial SC of the untreated skin (≈0.51).
3.2.4. Folding States of CH3 Residues in Keratin Chains
A shift towards higher (lower) wavenumbers of the band position at ≈2930 cm−1 is related to an unfolding (folding) of keratin’s tertiary structure, entailing stronger (weaker) exposure of the side chains and consequently stronger (weaker) possibility to bind water [45]. All profiles shown in Figure 4D increase from the skin surface to ≈30% SC depth and decrease only slightly from this region towards the bottom of the SC. The 2930 cm−1 band position significantly shifts towards lower wavenumbers in the placebo group at 0–60 and 90% SC depths during V2 compared to V1. For the verum group, it significantly shifts towards higher wavenumbers at 40–50 and 80% SC depth during V2. Significant differences between the placebo and verum groups were not found during V2. Directly measured, the band position around 2930 cm−1 was 2928.3 ± 0.3 cm−1 for the placebo and 2928.5 ± 0.6 cm−1 for the verum cream, i.e., much lower than the values corresponding to the skin surface (≈2933.7 cm−1). Thus, the cream could potentially influence the results for the placebo and verum groups at the superficial SC depth.
3.3. Influence of the Test Formulations on the Water of the SC
The data on tightly, strongly, weakly bound, unbound, and total water are inconsistent, have large standard deviations, and show interindividual variation. Therefore, the data in Figure 5 are presented in the form of differences in the mean values (V2–V1) for better clarity.
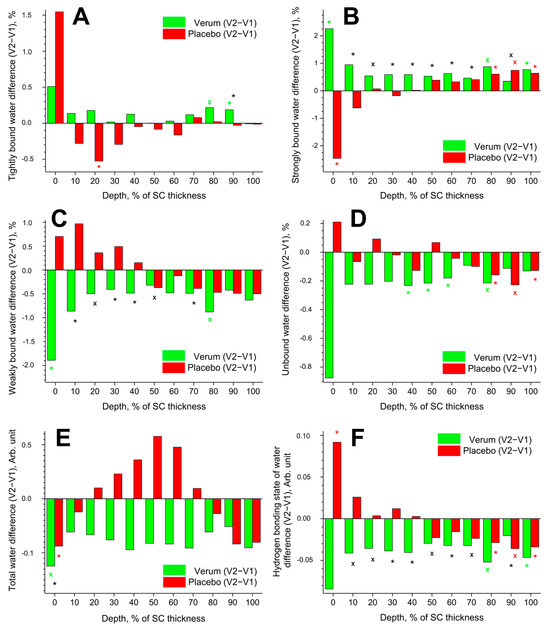
Figure 5.
Influence of creams on human SC water. Difference between V2 and V1 in the mean concentration of tightly bound (A), strongly bound (B), weakly bound (C), unbound (D) water mobility states, total water concentration (E), and hydrogen bonding state of water (F) in the SC in the verum (green) and placebo (red) groups. Significant (p < 0.05, marked with “*”) and strongly significant (p < 0.01, marked with “×”) differences between untreated (V1) and post-treated (V2) skin are shown with green/red colours for the verum/placebo groups and with black for the comparison between verum V2 and placebo V2 at a certain SC depth. The SC thickness is normalised to 100% (0%: surface; 100%: bottom of the SC).
3.3.1. Tightly Bound Water
Tightly bound water makes up ≈3% of the total water in the SC. The difference (V2–V1) in the concentration of tightly bound water is presented in Figure 5A. Significant differences were found only at exemplary SC depths: an increase at 80–90% SC depth in the verum and a decrease at 20% SC depth in the placebo group. At 90% SC depth, the verum group had significantly more tightly bound water than the placebo group.
3.3.2. Strongly Bound Water
Strongly bound water makes up ≈41% of the total water in the SC. The difference (V2–V1) in the concentration of strongly bound water is shown in Figure 5B. Significant differences were observed only at the exemplary SC depth: an increase at 0, 80, and 100% SC depth in the verum group; an increase at 80–100% SC depth in the placebo group; and a decrease at 0% SC depth in the placebo group. During V2, the concentration of strongly bound water was significantly higher in the placebo than in the verum group at 10–70 and 90% SC depth.
3.3.3. Weakly Bound Water
Weakly bound water makes up ≈54% of the total water in the SC. The difference (V2–V1) in the concentration of weakly bound water is illustrated in Figure 5C. A significant decrease was only observed at 0 and 80% SC depth in the verum group. During V2, the concentration of weakly bound water was significantly higher in the verum than in the placebo group at 10–50 and 70% SC depth.
3.3.4. Unbound Water
Unbound water makes up ≈2% of the total water in the SC. The difference (V2–V1) in the concentration of unbound water is depicted in Figure 5D. A significant decrease was observed at 40–60 and 80% SC depth in the verum group and at 80–100% SC depth in the placebo group. Significant differences between the verum and placebo groups during V2 were not found.
3.3.5. Total Water
The difference (V2–V1) in the concentration of total water is represented in Figure 5E. A significant decrease was only found at 0% SC depth in the verum and placebo groups. During V2, the water concentration was significantly higher in the verum than in the placebo group at 0% SC depth. No significant differences were found at the remaining SC depth.
3.3.6. Hydrogen Bonding State of Water
The difference (V2–V1) in the hydrogen bonding state of water is shown in Figure 5F. A lower value indicates an increased number of hydrogen bonds between the water and the environment. Significant differences were observed only at the exemplary SC depth: a decrease at 80 and 100% SC depth in the verum group; an increase at 0% SC depth; and a decrease at 80–100% SC depth in the placebo group. During V2, the hydrogen bonding state of water was significantly higher in the verum than in the placebo group at 10–70 and 90% SC depth. The mean reduction in the hydrogen bonding state of water from V1 to V2 was higher in the verum than in the placebo group (≈3.0% vs. ≈0.2%), indicating stronger water binding in the SC of the verum group after treatment.
3.4. Influence of the Test Formulations on the Trans-Epidermal Water Loss (TEWL)
Significant differences in TEWL values between the placebo and verum groups or between V1 and V2 were not found. However, TEWL tended to decrease slightly from V1 to V2 in the placebo group, while it did not change in the verum group (Figure 6A).
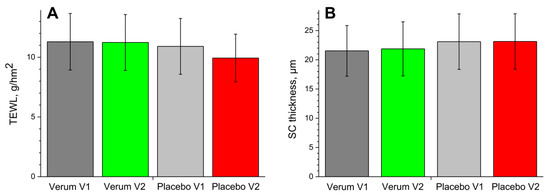
Figure 6.
The TEWL (A) and SC thickness (B) in the verum/placebo groups before (V1, dark grey/light grey) and after (V2, green/red) treatment.
3.5. Influence of the Test Formulations on the SC Thickness
The changes in the SC thickness are shown in Figure 6B. There were no significant differences in the SC thickness between the placebo and verum groups or between V1 and V2 of both groups. This indicates that an occlusion effect induced by the creams can be neglected.
4. Discussion
Topically applied substances penetrate the SC mainly intercellularly and, thus, influence the ICL concentration and organisation inside the lamellae. The lipidomic analysis shows non-significant changes in the total concentration of TGs and CERs in the superficial SC depth (collected from five tape strips) after treatment with verum or placebo cream with a clear tendency for a greater increase in the placebo compared to the verum group (1.2 vs. 1.1 times in average, Figure 1A and Figure 2A). The observed trend is in complete agreement with the Raman data, which show a significant increase in lipid concentration at the superficial SC depth after treatment (Figure 3A). This increase is most likely due to the accumulation of cream residues at the superficial SC depth without significant differences between the placebo and verum groups. The fold changes (V2/V1 ratio) in the concentration of exemplary lipids among thirty TGs (Figure 1A,B) and forty-one CERs (Figure 2A,B) are not significant, with a tendency for a greater increase in the placebo (TGs: 1.3; CERs: 1.4) than in the verum group (TGs: 1.0; CERs: 1.2). To find any trends, the fold change (Verum V2/Placebo V2) was analysed with a limitation: data before treatment were not considered. The comparison of the verum and placebo groups after treatment clearly shows that the verum treatment resulted in a strong non-significant increase in the concentration of mainly long-length chain TGs (C50–C56) (Figure 1C, Supplementary Figure S3) and medium- and long-length chain CERs (C42–C50) (Figure 2C, Supplementary Figure S4), while the placebo treatment leads to a significant increase in the concentration of short- and medium-length chain TGs (C43–C51) (Figure 1C, Supplementary Figure S3) with no pronounced effect on CERs (Figure 2C, Supplementary Figure S4). Although no significant changes in the mean chain length of all TGs and CERs after treatment were found, the clear tendency to increase is more pronounced in the verum than in the placebo group (Supplementary Figures S3 and S4). This indicates an effect of the active ingredient of the verum cream (PPAR ligand) on the lipid composition in the superficial SC. These lipidomic results are an indirect indication of the improvement in skin barrier function after the verum treatment, as an increase in long-length acyl chain lipids is always associated with an enhancement in skin barrier function [30,31], while an increase in short-length chain lipids leads to a reduction in skin barrier function and is often observed in the SC of diseased skin with a disrupted barrier [29,32,33]. These results are in accordance with the recent findings of Lee et al. [31], which show that long-length chain TGs can improve CER content and skin barrier function. PPAR signalling is known to modulate lipid metabolism in health and disease states [88,89,90]. In the epidermis, very long chain lengths of fatty acids-bound ceramides are elongated by the ELOVL enzymes [91,92,93]. These enzymes are known to be regulated by the PPAR ligands and also contribute to enhanced triglycerol synthesis and adipogenesis [94,95,96]. Furthermore, ELOVL3 participates in the formation of specific neutral lipids that are essential for the function of the skin [97]. In addition, genes targeted by PPAR-γ in adipocytes suggest that PPAR-γ senses incoming non-esterified long-chain fatty acids and induces the pathways to store long-chain fatty acids as TGs [98]. These are the likely reasons why we observe a shift towards mainly long-length chain TGs and medium- and long-length chain CERs after treatment with a PPAR agonist. However, further research is needed to confirm this and identify the specific ELOVL enzyme(s) responsible for this shift.
Thus, the ELOVL enzymes contribute to the PPAR signalling, which is known to be crucial for the maintenance of the skin barrier function [90]. Although the thiazolidinedione PPAR-γ agonists like Pioglitazone and Rosiglitazone have been shown to be efficacious in the treatment of plaque psoriasis [99], the systemic administration of these molecules could lead to adverse events. These include fluid retention, oedema, bone fractures, and an increased risk for heart failure [62,100]. These could be circumvented by topical application and further use of a molecule with a comparatively superior toxicological profile. Ideally, both these options should be explored in the treatment of skin ailments.
Given these results, the question arises whether the observed PPAR ligand-induced changes in lipid composition impact skin barrier function, which is determined indirectly by lamellar and directly by lateral ICL organisation in the SC [36,78]. The Raman data describing lamellar ICL organisation (I1080/(I1060 + I1130)) show that the verum treatment increases the number of trans conformers of ICLs at 0–30% SC depth, while the placebo has no effect (Figure 3B). Analysis of lateral ICL organisation (FWHM of the 2850 cm−1 band) shows that the verum leads to a significant increase in the orthorhombic organisation at 30 and 60% SC depth (20–70% SC depth as a clear trend), while the placebo significantly increases the hexagonal ICL organisation at 0–10% SC depth (Figure 3C). These results confirm the topically applied PPAR ligand’s positive effect on improving skin barrier function (strengthening effect). An unexpected significant difference was found between the verum and placebo groups at 60–90% SC depth, where the placebo showed an increase in trans conformers of ICLs, while the verum group was comparable to untreated skin (Figure 3B). This effect is difficult to explain by the composition of the placebo cream, which is also the basis of the verum cream. It is important to mention that the chosen parameters (I1080/(I1060 + I1130) and FWHM of the 2850 cm−1 band) are almost the same for creams and the superficial SC, so the creams themselves have no influence on the present analysis. Other parameters commonly used for the analysis of lateral ICL organisation, such as I2880/I2850 [36] and Raman band position at 2850 cm−1 [78], were not used because of great differences between the superficial SC and cream values and, thus, a strong potential influence on the obtained results.
Another parameter describing the skin barrier function is the TEWL [101], which is known to be artefactual in topically treated skin due to induced skin occlusion. For this reason, the last cream treatment was made the day before the measurements of V2. Thus, an occlusion effect caused by the applied creams ought to be largely reduced. There were no significant differences in TEWL between V1 and V2 and between the verum and placebo groups. However, the mean TEWL did not change in the verum and tended to decrease slightly in the placebo group (Figure 6A). This could be a sign of a decrease in skin barrier function in the placebo group, which is also evident in an increase in hexagonal ICL organisation at the superficial SC depth (Figure 3C) but also indicates the presence of cream residues in the superficial SC (Figure 3A), which reduce the TEWL.
Using CRM, it was shown that the application of the verum cream changes the secondary structure of keratin in the entire SC towards an increase in the β-sheet form (Figure 4A). The β-sheet form contains a large number of open side chains, i.e., compared to the α-helix form, it is more exposed and is characterised by an enhanced ability to bind water. The difference between verum and placebo during V2 is significant at 0, 20–40, and 80–90% SC depth, while a clear trend is observed in the entire SC. These results are supported by a clear trend towards an increase in tightly bound (Figure 5A) and strongly bound water (Figure 5B) and a decrease in weakly bound (Figure 5C) and unbound water (Figure 5D) in the entire SC in the verum group. This is also consistent with the decrease in the value of the hydrogen bonding state of water in the verum group, which shows a trend toward an increase in hydrogen bonds between the water and the environment (Figure 5F). The placebo group shows the opposite trend of a decrease in strongly bound (Figure 5B), an increase in weakly bound water (Figure 5C), and an increase in the hydrogen bonding state of water (Figure 5F) at the 0–40% SC depth, which is a typical sign of the skin occlusion–transportation of water from a more strongly to a more weakly hydrogen bonding state in the uppermost part of the SC [50].
Figure 4B–D shows the distribution of the parameters describing keratin’s tertiary structure, which is also inhomogeneous in the SC, and determines the water binding efficiency [45]. Figure 4B shows that there are no significant changes in cysteine forming disulphide bonds in the verum and placebo group, but the difference between the groups is significant at 0–10 and 90% SC depth (a clear trend in the entire SC), pointing a shift towards the unfolded state in the verum group, indicating an increased possibility for water binding. A significant transition of tyrosine from an unfolded, exposed state to a folded, buried state is observed in the placebo group at 60–80 and 100% SC depth (Figure 4C), indicating a lower possibility of binding water. No such transition is observed in the verum group. Thus, the application of the placebo cream increases the amount of buried tyrosine, which decreases the ability to bind water, while the verum cream does not. At the skin’s surface, the opposite behaviour is observed in both the verum and placebo groups—a significant shift towards an increase in exposed keratin, which is able to bind water more efficiently. The folding state of the tertiary keratin structure shows a significant shift towards the folded state at 0–60 and 90% SC depth (0–100% SC depth as a clear trend) in the placebo group (Figure 4D). Conversely, a significant shift towards the unfolded state is observed in the verum group at 40–50 and 80–90% SC depth (40–90% SC depth as a clear trend). The unfolded state of the keratin tertiary structure is characterised by the improved ability to bind water. As a result, the tertiary structure of keratin in the verum group has more possibilities to bind water than in the placebo group, which is consistent with the parameters of the secondary keratin structure (Figure 4A) and a transformation of water from a weakly to a strong hydrogen bonding state (Figure 5A–F).
An occlusion effect caused by topically applied creams could prevent water evaporation from the skin and accumulate water, leading to SC swelling. The concentration of total water is significantly reduced only at the surface in both the verum and placebo groups, showing no significant differences in the remaining SC depth (Figure 5E), which is also confirmed in Figure 6B, showing no changes in the SC thickness. The tendency for water concentration to increase at the intermediate 20–70% SC depth in the placebo group could be explained by the occlusion effect [50], whose molecular signs were discussed above. Due to the strong variance in the water mobility state profiles, it is difficult to associate an effect with the cream treatment. However, after treatment with verum cream, a clear tendency to the enhancement of tightly (on average by ≈0.2%, Figure 5A) and strongly bound water (on average by ≈0.8%, Figure 5B) and a decrease in weakly bound (on average by ≈0.7%, Figure 5C) and unbound water (on average by ≈0.3%, Figure 5D) was observed, which indicates the transformation of the water mobility state towards increased hydrogen bonding state (Figure 5F), which is the sign of the skin barrier function improvement.
5. Conclusions
Concentrations of TGs and CERs, organisation of lamellar and lateral ICLs, total water content, and water concentration depending on the strength of its hydrogen bonds (tightly, strongly, weakly bound, and unbound water), the hydrogen bonding state of water, and parameters of the secondary and tertiary structure of the keratin in the SC, TEWL and SC thickness were determined in this double-blind, placebo-controlled, in vivo study. The results show that the topical application of a non-therapeutic PPAR agonist, tested at a concentration of 0.1% for 21 days, has no significant influence on lipid composition when comparing values before and after treatment. However, a positive effect on the barrier function of human skin, causing an increase in mainly long-length chain TGs (C50–C56) and medium- and long-length chain CERs (C42–C50) at the superficial SC depth was observed as a clear trend by lipidomic analysis of the tape strips comparing the placebo and verum groups after the treatment. The tendential increase in mainly medium- and long-length chain TGs and CERs induced by a PPAR ligand likely caused a change in the lateral organisation of ICLs at a specific depth in the skin, leading to an increase in the number of trans conformers and an orthorhombic packing phase that maintain the skin barrier function, determined in vivo by CRM. When using CRM, it was shown that the ability to bind water is increased at the entire SC in the PPAR ligand-treated group and decreased or did not change in the placebo group, which is consistent with the parameters of keratin’s secondary and tertiary structures. Thus, in the verum group, an increase in tightly and strongly bound water and a decrease in weakly bound and unbound water in the entire SC indicates a transformation of water mobility to a state of increased hydrogen bonding, i.e., an increase in water-holding capacity, which is an indirect sign of skin barrier function improvement. Although some of the observed changes are not significant, they are recognisable as a clear trend. We assume that the small number of test subjects represents a main limitation of this study.
Supplementary Materials
The following supporting information can be downloaded at https://www.mdpi.com/article/10.3390/cosmetics11020044/s1; Figure S1: chemical structure of oxeglitazar; Figure S2: baseline removed Raman spectra of untreated skin (SC, depth ≈7 µm) (black), placebo cream (red), and verum cream (green) in the FP (A) and HWN (B) ranges; Figure S3: triacylglycerol fold change during visit 2 (verum V2 normalised/placebo V2 normalised ratio) normalised to the concentration of short-length chain TG(14:0_14:0_15:0). The horizontal line indicates a 2-fold change between the verum and placebo groups; Figure S4: ceramide fold change during visit 2 (verum V2 normalised/placebo V2 normalised ratio) normalised to the concentration of short-length chain Cer(d16:2/18:0). The horizontal line indicates a 2-fold change between the verum and placebo groups.
Author Contributions
Conceptualisation: J.v.H., J.L. and M.E.D.; methodology: A.S., J.S. and M.E.D.; software: J.S.; validation: J.S., A.S. and M.E.D.; formal analysis: A.S. and J.S.; investigation: J.S. and M.E.D.; resources: J.v.H., A.S. and J.L.; data curation: J.v.H., M.E.D. and J.L.; writing—original draft preparation: M.E.D.; writing—review and editing: A.S., J.S., J.v.H. and J.L.; supervision: M.E.D. and J.v.H.; project administration: J.v.H. and J.L.; funding acquisition: A.S. and J.v.H. All authors have read and agreed to the published version of the manuscript.
Funding
This study was sponsored by Merck KGaA, Darmstadt, Germany.
Institutional Review Board Statement
This study was conducted in accordance with the Declaration of Helsinki and approved by the Ethics Committee of the Charité–Universitätsmedizin Berlin (protocol code EA1/190/19, approved on 9 August 2019).
Informed Consent Statement
Informed consent was obtained from all subjects involved in this study.
Data Availability Statement
The data are available from the corresponding author upon reasonable request. The data are not publicly available due to privacy or ethical restrictions.
Acknowledgments
The authors would like to thank Maria Fedorova from the Center of Membrane Biochemistry and Lipid Research, Technical University Dresden, Germany, for performing lipidomic measurements. The authors would also like to thank Gabriele Witte, Jutta zur Lage, and their team for their tremendous support in generating the formulated creams used in this study.
Conflicts of Interest
The authors declare no conflicts of interest. Andrew Salazar and Jörg von Hagen are employers of Merck KGaA. Maxim E. Darvin is no longer affiliated with Charité–Universitätsmedizin Berlin. However, as the entire work was conducted during his employment at the Charité, he uses the affiliation with the permission of the Center of Experimental and Applied Cutaneous Physiology.
References
- Elias, P.M.; Gruber, R.; Crumrine, D.; Menon, G.; Williams, M.L.; Wakefield, J.S.; Holleran, W.M.; Uchida, Y. Formation and Functions of the Corneocyte Lipid Envelope (CLE). BBA-Mol. Cell Biol. Lipids 2014, 1841, 314–318. [Google Scholar] [CrossRef] [PubMed]
- Proksch, E.; Jensen, J.-M. Skin as an Organ of Protection. In Fitzpatrick’s Dermatology in General Medicine, 8e; Goldsmith, L.A., Katz, S.I., Gilchrest, B.A., Paller, A.S., Leffell, D.J., Wolff, K., Eds.; McGraw-Hill: New York, NY, USA, 2008; Chapter 47. [Google Scholar]
- Gray, G.M.; White, R.J.; Williams, R.H.; Yardley, H.J. Lipid-Composition of the Superficial Stratum-Corneum Cells of Pig Epidermis. Brit. J. Dermatol. 1982, 106, 59–63. [Google Scholar] [CrossRef] [PubMed]
- Schaefer, H.; Redelmeier, T.E. Skin Penetration. In Contact Dermatitis; Frosch, P.J., Menné, T., Lepoittevin, J.-P., Eds.; Springer: Berlin/Heidelberg, Germany, 2006; pp. 167–178. [Google Scholar]
- Caspers, P.J.; Lucassen, G.W.; Carter, E.A.; Bruining, H.A.; Puppels, G.J. In Vivo Confocal Raman Microspectroscopy of the Skin: Noninvasive Determination of Molecular Concentration Profiles. J. Investig. Dermatol. 2001, 116, 434–442. [Google Scholar] [CrossRef] [PubMed]
- Darvin, M.E.; Lademann, J.; von Hagen, J.; Lohan, S.B.; Kolmar, H.; Meinke, M.C.; Jung, S. Carotenoids in Human Skin In Vivo: Antioxidant and Photo-Protectant Role against External and Internal Stressors. Antioxidants 2022, 11, 1451. [Google Scholar] [CrossRef] [PubMed]
- Weerheim, A.; Ponec, M. Determination of Stratum Corneum Lipid Profile by Tape Stripping in Combination with High-Performance Thin-Layer Chromatography. Arch. Dermatol. Res. 2001, 293, 191–199. [Google Scholar] [CrossRef] [PubMed]
- Wertz, P.W. Current Understanding of Skin Biology Pertinent to Skin Penetration: Skin Biochemistry. Ski. Pharmacol. Physiol. 2013, 26, 217–226. [Google Scholar] [CrossRef] [PubMed]
- Wertz, P. Epidermal Lamellar Granules. Ski. Pharmacol. Phys. 2018, 31, 262–268. [Google Scholar] [CrossRef] [PubMed]
- Coderch, L.; López, O.; de la Maza, A.; Parra, J.L. Ceramides and Skin Function. Am. J. Clin. Dermatol. 2003, 4, 107–129. [Google Scholar] [CrossRef]
- Darvin, M.E.; Choe, C.S.; Schleusener, J.; Lademann, J. Non-Invasive Depth Profiling of the Stratum Corneum in Vivo Using Confocal Raman Microscopy Considering the Non-Homogeneous Distribution of Keratin. Biomed. Opt. Express 2019, 10, 3092–3103. [Google Scholar] [CrossRef]
- Zhang, L.S.; Cambron, T.; Niu, Y.Q.; Xu, Z.G.; Su, N.; Zheng, H.Y.; Wei, K.; Ray, P. MCR Approach Revealing Protein, Water, and Lipid Depth Profile in Atopic Dermatitis Patients’ Stratum Corneum via in Vivo Confocal Raman Spectroscopy. Anal. Chem. 2019, 91, 2784–2790. [Google Scholar] [CrossRef]
- Starr, N.J.; Khan, M.H.; Edney, M.K.; Trindade, G.F.; Kern, S.; Pirkl, A.; Kleine-Boymann, M.; Elms, C.; O’Mahony, M.M.; Bell, M.; et al. Elucidating the Molecular Landscape of the Stratum Corneum. Proc. Natl. Acad. Sci. USA 2022, 119, e2114380119. [Google Scholar] [CrossRef] [PubMed]
- Smith, K.R.; Thiboutot, D.M. Thematic Review Series: Skin Lipids. Sebaceous Gland Lipids: Friend or Foe? J. Lipid Res. 2008, 49, 271–281. [Google Scholar] [CrossRef] [PubMed]
- Tascini, A.S.; Noro, M.G.; Seddon, J.M.; Chen, R.; Bresme, F. Mechanisms of Lipid Extraction from Skin Lipid Bilayers by Sebum Triglycerides. Phys. Chem. Chem. Phys. 2019, 21, 1471–1477. [Google Scholar] [CrossRef] [PubMed]
- Wertz, P.W. Lipids and the Permeability and Antimicrobial Barriers of the Skin. J. Lipids 2018, 2018, 5954034. [Google Scholar] [CrossRef] [PubMed]
- Norlen, L. Current Understanding of Skin Barrier Morphology. Ski. Pharmacol. Physiol. 2013, 26, 213–216. [Google Scholar] [CrossRef] [PubMed]
- Boncheva, M. The Physical Chemistry of the Stratum Corneum Lipids. Int. J. Cosmet. Sci. 2014, 36, 505–515. [Google Scholar] [CrossRef]
- Schmitt, T.; Neubert, R.H.H. State of the Art in Stratum Corneum Research. Part II: Hypothetical Stratum Corneum Lipid Matrix Models. Ski. Pharmacol. Physiol. 2020, 33, 213–230. [Google Scholar] [CrossRef]
- Madison, K.C.; Swartzendruber, D.C.; Wertz, P.W.; Downing, D.T. Presence of Intact Intercellular Lipid Lamellae in the Upper Layers of the Stratum Corneum. J. Investig. Dermatol. 1987, 88, 714–718. [Google Scholar] [CrossRef]
- Masukawa, Y.; Narita, H.; Shimizu, E.; Kondo, N.; Sugai, Y.; Oba, T.; Homma, R.; Ishikawa, J.; Takagi, Y.; Kitahara, T.; et al. Characterization of Overall Ceramide Species in Human Stratum Corneum. J. Lipid Res. 2008, 49, 1466–1476. [Google Scholar] [CrossRef]
- Bouwstra, J.A.; Gooris, G.S.; van der Spek, J.A.; Bras, W. Structural Investigations of Human Stratum Corneum by Small-Angle X-Ray Scattering. J. Investig. Dermatol. 1991, 97, 1005–1012. [Google Scholar] [CrossRef]
- Van Smeden, J.; Janssens, M.; Gooris, G.S.; Bouwstra, J.A. The Important Role of Stratum Corneum Lipids for the Cutaneous Barrier Function. Biochim. Biophys. Acta 2014, 1841, 295–313. [Google Scholar] [CrossRef] [PubMed]
- Bouwstra, J.A.; Dubbelaar, F.E.R.; Gooris, G.S.; Ponec, M. The Lipid Organisation in the Skin Barrier. Acta Derm. Venereol. 2000, 80, 23–30. [Google Scholar]
- Hill, J.R.; Wertz, P.W. Molecular Models of the Intercellular Lipid Lamellae from Epidermal Stratum Corneum. Biochim. Biophys. Acta 2003, 1616, 121–126. [Google Scholar] [CrossRef] [PubMed]
- Kiselev, M.A.; Ryabova, N.Y.; Balagurov, A.M.; Dante, S.; Hauss, T.; Zbytovska, J.; Wartewig, S.; Neubert, R.H. New Insights into the Structure and Hydration of a Stratum Corneum Lipid Model Membrane by Neutron Diffraction. Eur. Biophys. J. 2005, 34, 1030–1040. [Google Scholar] [CrossRef]
- Schroter, A.; Kessner, D.; Kiselev, M.A.; Hauss, T.; Dante, S.; Neubert, R.H. Basic Nanostructure of Stratum Corneum Lipid Matrices Based on Ceramides [EOS] and [AP]: A Neutron Diffraction Study. Biophys. J. 2009, 97, 1104–1114. [Google Scholar] [CrossRef] [PubMed]
- Iwai, I.; Han, H.M.; den Hollander, L.; Svensson, S.; Ofverstedt, L.G.; Anwar, J.; Brewer, J.; Bloksgaard, M.; Laloeuf, A.; Nosek, D.; et al. The Human Skin Barrier Is Organized as Stacked Bilayers of Fully Extended Ceramides with Cholesterol Molecules Associated with the Ceramide Sphingoid Moiety. J. Investig. Dermatol. 2012, 132, 2215–2225. [Google Scholar] [CrossRef] [PubMed]
- Janssens, M.; van Smeden, J.; Gooris, G.S.; Bras, W.; Portale, G.; Caspers, P.J.; Vreeken, R.J.; Hankemeier, T.; Kezic, S.; Wolterbeek, R.; et al. Increase in Short-Chain Ceramides Correlates with an Altered Lipid Organization and Decreased Barrier Function in Atopic Eczema Patients. J. Lipid Res. 2012, 53, 2755–2766. [Google Scholar] [CrossRef]
- Mojumdar, E.H.; Kariman, Z.; van Kerckhove, L.; Gooris, G.S.; Bouwstra, J.A. The Role of Ceramide Chain Length Distribution on the Barrier Properties of the Skin Lipid Membranes. Biochim. Biophys. Acta (BBA)-Biomembr. 2014, 1838, 2473–2483. [Google Scholar] [CrossRef]
- Lee, J.-Y.; Jeon, S.; Han, S.; Liu, K.-H.; Cho, Y.; Kim, K.-P. Positive Correlation of Triacylglycerols with Increased Chain Length and Unsaturation with ω-O-Acylceramide and Ceramide-NP as Well as Acidic pH in the Skin Surface of Healthy Korean Adults. Metabolites 2022, 13, 31. [Google Scholar] [CrossRef]
- Li, Q.; Fang, H.; Dang, E.; Wang, G. The Role of Ceramides in Skin Homeostasis and Inflammatory Skin Diseases. J. Dermatol. Sci. 2020, 97, 2–8. [Google Scholar] [CrossRef]
- Van Smeden, J.; Janssens, M.; Boiten, W.A.; van Drongelen, V.; Furio, L.; Vreeken, R.J.; Hovnanian, A.; Bouwstra, J.A. Intercellular Skin Barrier Lipid Composition and Organization in Netherton Syndrome Patients. J. Investig. Dermatol. 2014, 134, 1238–1245. [Google Scholar] [CrossRef] [PubMed]
- Pilgram, G.S.K.; Engelsma-van Pelt, A.M.; Bouwstra, J.A.; Koerten, H.K. Electron Diffraction Provides New Information on Human Stratum Corneum Lipid Organization Studied in Relation to Depth and Temperature. J. Investig. Dermatol. 1999, 113, 403–409. [Google Scholar] [CrossRef] [PubMed]
- Doucet, J.; Potter, A.; Baltenneck, C.; Domanov, Y.A. Micron-Scale Assessment of Molecular Lipid Organization in Human Stratum Corneum Using Microprobe X-Ray Diffraction. J. Lipid. Res. 2014, 55, 2380–2388. [Google Scholar] [CrossRef] [PubMed]
- Choe, C.; Lademann, J.; Darvin, M.E. A Depth-Dependent Profile of the Lipid Conformation and Lateral Packing Order of the Stratum Corneum in Vivo Measured Using Raman Microscopy. Analyst 2016, 141, 1981–1987. [Google Scholar] [CrossRef] [PubMed]
- Choe, C.; Schleusener, J.; Lademann, J.; Darvin, M.E. Age Related Depth Profiles of Human Stratum Corneum Barrier-Related Molecular Parameters by Confocal Raman Microscopy in Vivo. Mech. Ageing Dev. 2018, 172, 6–12. [Google Scholar] [CrossRef] [PubMed]
- Bouwstra, J.A.; Gooris, G.S. The Lipid Organization in Human Stratum Corneum and Model Systems. Open Dermatol. J. 2010, 4, 10–13. [Google Scholar]
- Van Smeden, J.; Boiten, W.A.; Hankemeier, T.; Rissmann, R.; Bouwstra, J.A.; Vreeken, R.J. Combined LC/MS-Platform for Analysis of All Major Stratum Corneum Lipids, and the Profiling of Skin Substitutes. Biochim. Biophys. Acta 2014, 1841, 70–79. [Google Scholar] [CrossRef]
- Darvin, M.E. Optical Methods for Non-Invasive Determination of Skin Penetration: Current Trends, Advances, Possibilities, Prospects, and Translation into In Vivo Human Studies. Pharmaceutics 2023, 15, 2272. [Google Scholar] [CrossRef]
- Caspers, P.J.; Lucassen, G.W.; Bruining, H.A.; Puppels, G.J. Automated Depth-Scanning Confocal Raman Microspectrometer for Rapid in Vivo Determination of Water Concentration Profiles in Human Skin. J. Raman Spectrosc. 2000, 31, 813–818. [Google Scholar] [CrossRef]
- Silva, C.L.; Topgaard, D.; Kocherbitov, V.; Sousa, J.J.S.; Pais, A.A.C.C.; Sparr, E. Stratum Corneum Hydration: Phase Transformations and Mobility in Stratum Corneum, Extracted Lipids and Isolated Corneocytes. Biochim. Biophys. Acta (BBA)-Biomembr. 2007, 1768, 2647–2659. [Google Scholar] [CrossRef]
- Imokawa, G.; Kuno, H.; Kawai, M. Stratum-Corneum Lipids Serve as a Bound-Water Modulator. J. Investig. Dermatol. 1991, 96, 845–851. [Google Scholar] [CrossRef] [PubMed]
- Yamamura, T.; Tezuka, T. The Water-Holding Capacity of the Stratum-Corneum Measured by H-1-Nmr. J. Investig. Dermatol. 1989, 93, 160–164. [Google Scholar] [CrossRef] [PubMed]
- Choe, C.; Schleusener, J.; Lademann, J.; Darvin, M.E. Keratin-Water-NMF Interaction as a Three Layer Model in the Human Stratum Corneum Using in Vivo Confocal Raman Microscopy. Sci. Rep. 2017, 7, 15900. [Google Scholar] [CrossRef] [PubMed]
- Choe, C.; Choe, S.; Schleusener, J.; Lademann, J.; Darvin, M.E. Modified Normalization Method in in Vivo Stratum Corneum Analysis Using Confocal Raman Microscopy to Compensate Nonhomogeneous Distribution of Keratin. J. Raman Spectrosc. 2019, 50, 945–957. [Google Scholar] [CrossRef]
- Brown, S.J.; Irwin McLean, W.H. One Remarkable Molecule: Filaggrin. J. Investig. Dermatol. 2012, 132, 751–762. [Google Scholar] [CrossRef] [PubMed]
- Darvin, M.E.; Schleusener, J.; Lademann, J.; Choe, C.-S. Current Views on Noninvasive in Vivo Determination of Physiological Parameters of the Stratum Corneum Using Confocal Raman Microspectroscopy. SPP 2022, 35, 125–136. [Google Scholar] [CrossRef] [PubMed]
- Schleusener, J.; Salazar, A.; von Hagen, J.; Lademann, J.; Darvin, M.E. Retaining Skin Barrier Function Properties of the Stratum Corneum with Components of the Natural Moisturizing Factor-A Randomized, Placebo-Controlled Double-Blind In Vivo Study. Molecules 2021, 26, 1649. [Google Scholar] [CrossRef] [PubMed]
- Choe, C.; Schleusener, J.; Choe, S.; Ri, J.; Lademann, J.; Darvin, M.E. Stratum Corneum Occlusion Induces Water Transformation towards Lower Bonding State: A Molecular Level in Vivo Study by Confocal Raman Microspectroscopy. Int. J. Cosmet. Sci. 2020, 42, 482–493. [Google Scholar] [CrossRef]
- Meckfessel, M.H.; Brandt, S. The Structure, Function, and Importance of Ceramides in Skin and Their Use as Therapeutic Agents in Skin-Care Products. J. Am. Acad. Dermatol. 2014, 71, 177–184. [Google Scholar] [CrossRef]
- Blaak, J.; Dähnhardt, D.; Bielfeldt, S.; Theiss, C.; Simon, I.; Wilhelm, K.-P.; Dähnhardt-Pfeiffer, S.; Staib, P. Improvement of Human Epidermal Barrier Structure and Lipid Profile in Xerotic- and Atopic-Prone Skin via Application of a Plant-Oil and Urea Containing pH 4.5 Emulsion. Cosmetics 2023, 10, 95. [Google Scholar] [CrossRef]
- Goto, T.; Takahashi, N.; Hirai, S.; Kawada, T. Various Terpenoids Derived from Herbal and Dietary Plants Function as PPAR Modulators and Regulate Carbohydrate and Lipid Metabolism. PPAR Res. 2010, 2010, 483958. [Google Scholar] [CrossRef] [PubMed]
- Peters, J.M.; Shah, Y.M.; Gonzalez, F.J. The Role of Peroxisome Proliferator-Activated Receptors in Carcinogenesis and Chemoprevention. Nat. Rev. Cancer 2012, 12, 181–195. [Google Scholar] [CrossRef]
- Gupta, M.; Mahajan, V.K.; Mehta, K.S.; Chauhan, P.S.; Rawat, R. Peroxisome Proliferator-Activated Receptors (PPARs) and PPAR Agonists: The ‘Future’ in Dermatology Therapeutics? Arch. Dermatol. Res. 2015, 307, 767–780. [Google Scholar] [CrossRef] [PubMed]
- Schmuth, M.; Jiang, Y.J.; Dubrac, S.; Elias, P.M.; Feingold, K.R. Thematic Review Series: Skin Lipids. Peroxisome Proliferator-Activated Receptors and Liver X Receptors in Epidermal Biology. J. Lipid Res. 2008, 49, 499–509. [Google Scholar] [CrossRef] [PubMed]
- Ghosh, A.K. Pharmacological Activation of PPAR-γ: A Potential Therapy for Skin Fibrosis. Int. J. Dermatol. 2021, 60, 376–383. [Google Scholar] [CrossRef]
- McAleer, J.P. Obesity and the Microbiome in Atopic Dermatitis: Therapeutic Implications for PPAR-γ Agonists. Front. Allergy 2023, 4, 1167800. [Google Scholar] [CrossRef] [PubMed]
- Choi, M.-H.; Yang, S.-H.; Lee, Y.-J.; Sohn, J.H.; Lee, K.S.; Shin, H.-J. Anti-Obesity Effect of Daidzein Derived from Pachyrhizus erosus (L.) Urb. Extract via PPAR Pathway in MDI-Induced 3T3-L1 Cell Line. Cosmetics 2023, 10, 164. [Google Scholar] [CrossRef]
- Jiang, Y.J.; Kim, P.; Lu, Y.F.; Feingold, K.R. PPARgamma Activators Stimulate Aquaporin 3 Expression in Keratinocytes/Epidermis. Exp. Dermatol. 2011, 20, 595–599. [Google Scholar] [CrossRef]
- Sadgrove, N.; Batra, S.; Barreto, D.; Rapaport, J. An Updated Etiology of Hair Loss and the New Cosmeceutical Paradigm in Therapy: Clearing ‘the Big Eight Strikes’. Cosmetics 2023, 10, 106. [Google Scholar] [CrossRef]
- Ramot, Y.; Bertolini, M.; Boboljova, M.; Uchida, Y.; Paus, R. PPAR-γ Signalling as a Key Mediator of Human Hair Follicle Physiology and Pathology. Exp. Dermatol. 2020, 29, 312–321. [Google Scholar] [CrossRef]
- Nomaguchi, K.; Tanaka, M.; Misawa, E.; Yamada, M.; Toida, T.; Iwatsuki, K.; Goto, T.; Kawada, T. Aloe Vera Phytosterols Act as Ligands for PPAR and Improve the Expression Levels of PPAR Target Genes in the Livers of Mice with Diet-Induced Obesity. Obes. Res. Clin. Pract. 2011, 5, e190–e201. [Google Scholar] [CrossRef] [PubMed]
- Ciavarella, C.; Motta, I.; Valente, S.; Pasquinelli, G. Pharmacological (or Synthetic) and Nutritional Agonists of PPAR-γ as Candidates for Cytokine Storm Modulation in COVID-19 Disease. Molecules 2020, 25, 2076. [Google Scholar] [CrossRef] [PubMed]
- Di-Poï, N.; Michalik, L.; Desvergne, B.; Wahli, W. Functions of Peroxisome Proliferator-Activated Receptors (PPAR) in Skin Homeostasis. Lipids 2004, 39, 1093–1099. [Google Scholar] [CrossRef] [PubMed]
- Icre, G.; Wahli, W.; Michalik, L. Functions of the Peroxisome Proliferator-Activated Receptor (PPAR) α and β in Skin Homeostasis, Epithelial Repair, and Morphogenesis. J. Investig. Dermatol. Symp. Proc. 2006, 11, 30–35. [Google Scholar] [CrossRef] [PubMed]
- Lamers, C.; Schubert-Zsilavecz, M.; Merk, D. Therapeutic Modulators of Peroxisome Proliferator-Activated Receptors (PPAR): A Patent Review (2008–Present). Expert. Opin. Ther. Pat. 2012, 22, 803–841. [Google Scholar] [CrossRef] [PubMed]
- De Belilovsky, C.; Roo-Rodriguez, E.; Baudouin, C.; Menu, F.; Chadoutaud, B.; Msika, P. Natural Peroxisome Proliferator-Activated Receptor-Alpha Agonist Cream Demonstrates Similar Therapeutic Response to Topical Steroids in Atopic Dermatitis. J. Dermatol. Treat. 2011, 22, 359–365. [Google Scholar] [CrossRef] [PubMed]
- Majewski, G.; Craw, J.; Falla, T. Accelerated Barrier Repair in Human Skin Explants Induced with a Plant-Derived PPAR-α Activating Complex via Cooperative Interactions. CCID 2021, 14, 1271–1293. [Google Scholar] [CrossRef]
- Kim, B.; Choi, Y.-E.; Kim, H.-S. Eruca sativa and Its Flavonoid Components, Quercetin and Isorhamnetin, Improve Skin Barrier Function by Activation of Peroxisome Proliferator-Activated Receptor (PPAR)-α and Suppression of Inflammatory Cytokines. Phytother. Res. 2014, 28, 1359–1366. [Google Scholar] [CrossRef]
- Chen, B.; Lu, N.; Lee, K.; Ye, L.; Hasegawa, C.; Maeda, K. Application of Mevalonolactone Prevents Deterioration of Epidermal Barrier Function by Accelerating the Lamellar Granule Lipid Transport System. Ski. Res. Technol. 2022, 28, 804–814. [Google Scholar] [CrossRef]
- Tachibana, K.; Fukuda, S.; Fukushima, J.; Ishimoto, K.; Sakata, M.; Nishimori, Y.; Doi, T. Exploring Compounds to Be Used as Cosmetic Agents That Activate Peroxisome Proliferator-activated Receptor Alpha. Intern. J. Cosmet. Sci. 2022, 44, 189–200. [Google Scholar] [CrossRef]
- Wiechers, J.W.; Rawlings, A.V.; Garcia, C.; Chesne, C.; Balaguer, P.; Nicolas, J.C.; Corre, S.; Galibert, M.-D. A New Mechanism of Action for Skin Whitening Agents: Binding to the Peroxisome Proliferator-Activated Receptor1. Int. J. Cosmet. Sci. 2005, 27, 123–132. [Google Scholar] [CrossRef]
- Ri, J.S.; Choe, S.H.; Schleusener, J.; Lademann, J.; Choe, C.S.; Darvin, M.E. In Vivo Tracking of DNA for Precise Determination of the Stratum Corneum Thickness and Superficial Microbiome Using Confocal Raman Microscopy. Ski. Pharmacol. Physiol. 2020, 33, 30–37. [Google Scholar] [CrossRef] [PubMed]
- Crowther, J.M.; Sieg, A.; Blenkiron, P.; Marcott, C.; Matts, P.J.; Kaczvinsky, J.R.; Rawlings, A.V. Measuring the Effects of Topical Moisturizers on Changes in Stratum Corneum Thickness, Water Gradients and Hydration in Vivo. Br. J. Dermatol. 2008, 159, 567–577. [Google Scholar] [CrossRef] [PubMed]
- Choe, C.; Schleusener, J.; Choe, S.; Lademann, J.; Darvin, M.E. A Modification for the Calculation of Water Depth Profiles in Oil-Treated Skin by in Vivo Confocal Raman Microscopy. J. Biophotonics 2020, 13, e201960106. [Google Scholar] [CrossRef]
- Vyumvuhore, R.; Tfayli, A.; Duplan, H.; Delalleau, A.; Manfait, M.; Baillet-Guffroy, A. Effects of Atmospheric Relative Humidity on Stratum Corneum Structure at the Molecular Level: Ex Vivo Raman Spectroscopy Analysis. Analyst 2013, 138, 4103–4111. [Google Scholar] [CrossRef] [PubMed]
- Choe, C.; Lademann, J.; Darvin, M.E. Lipid Organization and Stratum Corneum Thickness Determined in Vivo in Human Skin Analyzing Lipid-Keratin Peak (2820-3030 Cm(-1)) Using Confocal Raman Microscopy. J. Raman Spectrosc. 2016, 47, 1327–1331. [Google Scholar] [CrossRef]
- Snyder, R.G.; Hsu, S.L.; Krimm, S. Vibrational-Spectra in C-H Stretching Region and Structure of Polymethylene Chain. Spectrochim Acta A 1978, 34, 395–406. [Google Scholar] [CrossRef]
- Vyumvuhore, R.; Tfayli, A.; Duplan, H.; Delalleau, A.; Manfait, M.; Baillet-Guffroy, A. Raman Spectroscopy: A Tool for Biomechanical Characterization of Stratum Corneum. J. Raman Spectrosc. 2013, 44, 1077–1083. [Google Scholar] [CrossRef]
- Verma, S.P.; Wallach, D.F.H. Changes of Raman-Scattering in CH-Stretching Region during Thermally Induced Unfolding of Ribonuclease. Biochem. Bioph. Res. Commun. 1977, 74, 473–479. [Google Scholar] [CrossRef]
- Gniadecka, M.; Faurskov Nielsen, O.; Christensen, D.H.; Wulf, H.C. Structure of Water, Proteins, and Lipids in Intact Human Skin, Hair, and Nail. J. Investig. Dermatol. 1998, 110, 393–398. [Google Scholar] [CrossRef]
- Choe, C.S.; Lademann, J.; Darvin, M.E. Gaussian-Function-Based Deconvolution Method to Determine the Penetration Ability of Petrolatum Oil into in Vivo Human Skin Using Confocal Raman Microscopy. Laser Phys. 2014, 24, 105601. [Google Scholar] [CrossRef]
- Siamwiza, M.N.; Lord, R.C.; Chen, M.C.; Takamatsu, T.; Harada, I.; Matsuura, H.; Shimanouchi, T. Interpretation of the Doublet at 850 and 830 cm−1 in the Raman Spectra of Tyrosyl Residues in Proteins and Certain Model Compounds. Biochemistry 1975, 14, 4870–4876. [Google Scholar] [CrossRef]
- Choe, C.; Lademann, J.; Darvin, M.E. Depth Profiles of Hydrogen Bound Water Molecule Types and Their Relation to Lipid and Protein Interaction in the Human Stratum Corneum in Vivo. Analyst 2016, 141, 6329–6337. [Google Scholar] [CrossRef] [PubMed]
- Striesow, J.; Lackmann, J.-W.; Ni, Z.; Wenske, S.; Weltmann, K.-D.; Fedorova, M.; von Woedtke, T.; Wende, K. Oxidative Modification of Skin Lipids by Cold Atmospheric Plasma (CAP): A Standardizable Approach Using RP-LC/MS2 and DI-ESI/MS2. Chem. Phys. Lipids 2020, 226, 104786. [Google Scholar] [CrossRef] [PubMed]
- Criscuolo, A.; Zeller, M.; Cook, K.; Angelidou, G.; Fedorova, M. Rational Selection of Reverse Phase Columns for High Throughput LC–MS Lipidomics. Chem. Phys. Lipids 2019, 221, 120–127. [Google Scholar] [CrossRef] [PubMed]
- Michalik, L.; Wahli, W. PPARs Mediate Lipid Signaling in Inflammation and Cancer. PPAR Res. 2008, 2008, e134059. [Google Scholar] [CrossRef] [PubMed]
- Walczak, R.; Tontonoz, P. PPARadigms and PPARadoxes: Expanding Roles for PPARγ in the Control of Lipid Metabolism. J. Lipid Res. 2002, 43, 177–186. [Google Scholar] [CrossRef]
- Ramot, Y.; Mastrofrancesco, A.; Camera, E.; Desreumaux, P.; Paus, R.; Picardo, M. The Role of PPARγ-Mediated Signalling in Skin Biology and Pathology: New Targets and Opportunities for Clinical Dermatology. Exp. Dermatol. 2015, 24, 245–251. [Google Scholar] [CrossRef]
- Cha, H.J.; He, C.; Zhao, H.; Dong, Y.; An, I.-S.; An, S. Intercellular and Intracellular Functions of Ceramides and Their Metabolites in Skin (Review). Int. J. Mol. Med. 2016, 38, 16–22. [Google Scholar] [CrossRef]
- Uchida, Y. The Role of Fatty Acid Elongation in Epidermal Structure and Function. Derm. Endocrinol. 2011, 3, 65–69. [Google Scholar] [CrossRef]
- Jump, D.B. Mammalian Fatty Acid Elongases. In Lipidomics: Volume 1: Methods and Protocols; Armstrong, D., Ed.; Methods in Molecular Biology; Humana Press: Totowa, NJ, USA, 2009; pp. 375–389. ISBN 978-1-60761-322-0. [Google Scholar]
- Jörgensen, J.A.; Zadravec, D.; Jacobsson, A. Norepinephrine and Rosiglitazone Synergistically Induce Elovl3 Expression in Brown Adipocytes. Am. J. Physiol. Endocrinol. Metab. 2007, 293, E1159–E1168. [Google Scholar] [CrossRef] [PubMed]
- Kobayashi, T.; Zadravec, D.; Jacobsson, A. ELOVL2 Overexpression Enhances Triacylglycerol Synthesis in 3T3-L1 and F442A Cells. FEBS Lett. 2007, 581, 3157–3163. [Google Scholar] [CrossRef] [PubMed]
- Kobayashi, T.; Fujimori, K. Very Long-Chain-Fatty Acids Enhance Adipogenesis through Coregulation of Elovl3 and PPARγ in 3T3-L1 Cells. Am. J. Physiol.-Endocrinol. Metab. 2012, 302, E1461–E1471. [Google Scholar] [CrossRef] [PubMed]
- Westerberg, R.; Tvrdik, P.; Undén, A.-B.; Månsson, J.-E.; Norlén, L.; Jakobsson, A.; Holleran, W.H.; Elias, P.M.; Asadi, A.; Flodby, P.; et al. Role for ELOVL3 and Fatty Acid Chain Length in Development of Hair and Skin Function. J. Biol. Chem. 2004, 279, 5621–5629. [Google Scholar] [CrossRef]
- Nakamura, M.T.; Yudell, B.E.; Loor, J.J. Regulation of Energy Metabolism by Long-Chain Fatty Acids. Prog. Lipid Res. 2014, 53, 124–144. [Google Scholar] [CrossRef] [PubMed]
- Chang, G.; Wang, J.; Song, J.; Zhang, Z.; Zhang, L. Efficacy and Safety of Pioglitazone for Treatment of Plaque Psoriasis: A Systematic Review and Meta-Analysis of Randomized Controlled Trials. J. Dermatol. Treat. 2020, 31, 680–686. [Google Scholar] [CrossRef] [PubMed]
- Issa, D.; Wattacheril, J.; Sanyal, A.J. Treatment Options for Nonalcoholic Steatohepatitis—A Safety Evaluation. Expert Opin. Drug Saf. 2017, 16, 903–913. [Google Scholar] [CrossRef]
- Damien, F.; Boncheva, M. The Extent of Orthorhombic Lipid Phases in the Stratum Corneum Determines the Barrier Efficiency of Human Skin in Vivo. J. Investig. Dermatol. 2010, 130, 611–614. [Google Scholar] [CrossRef]
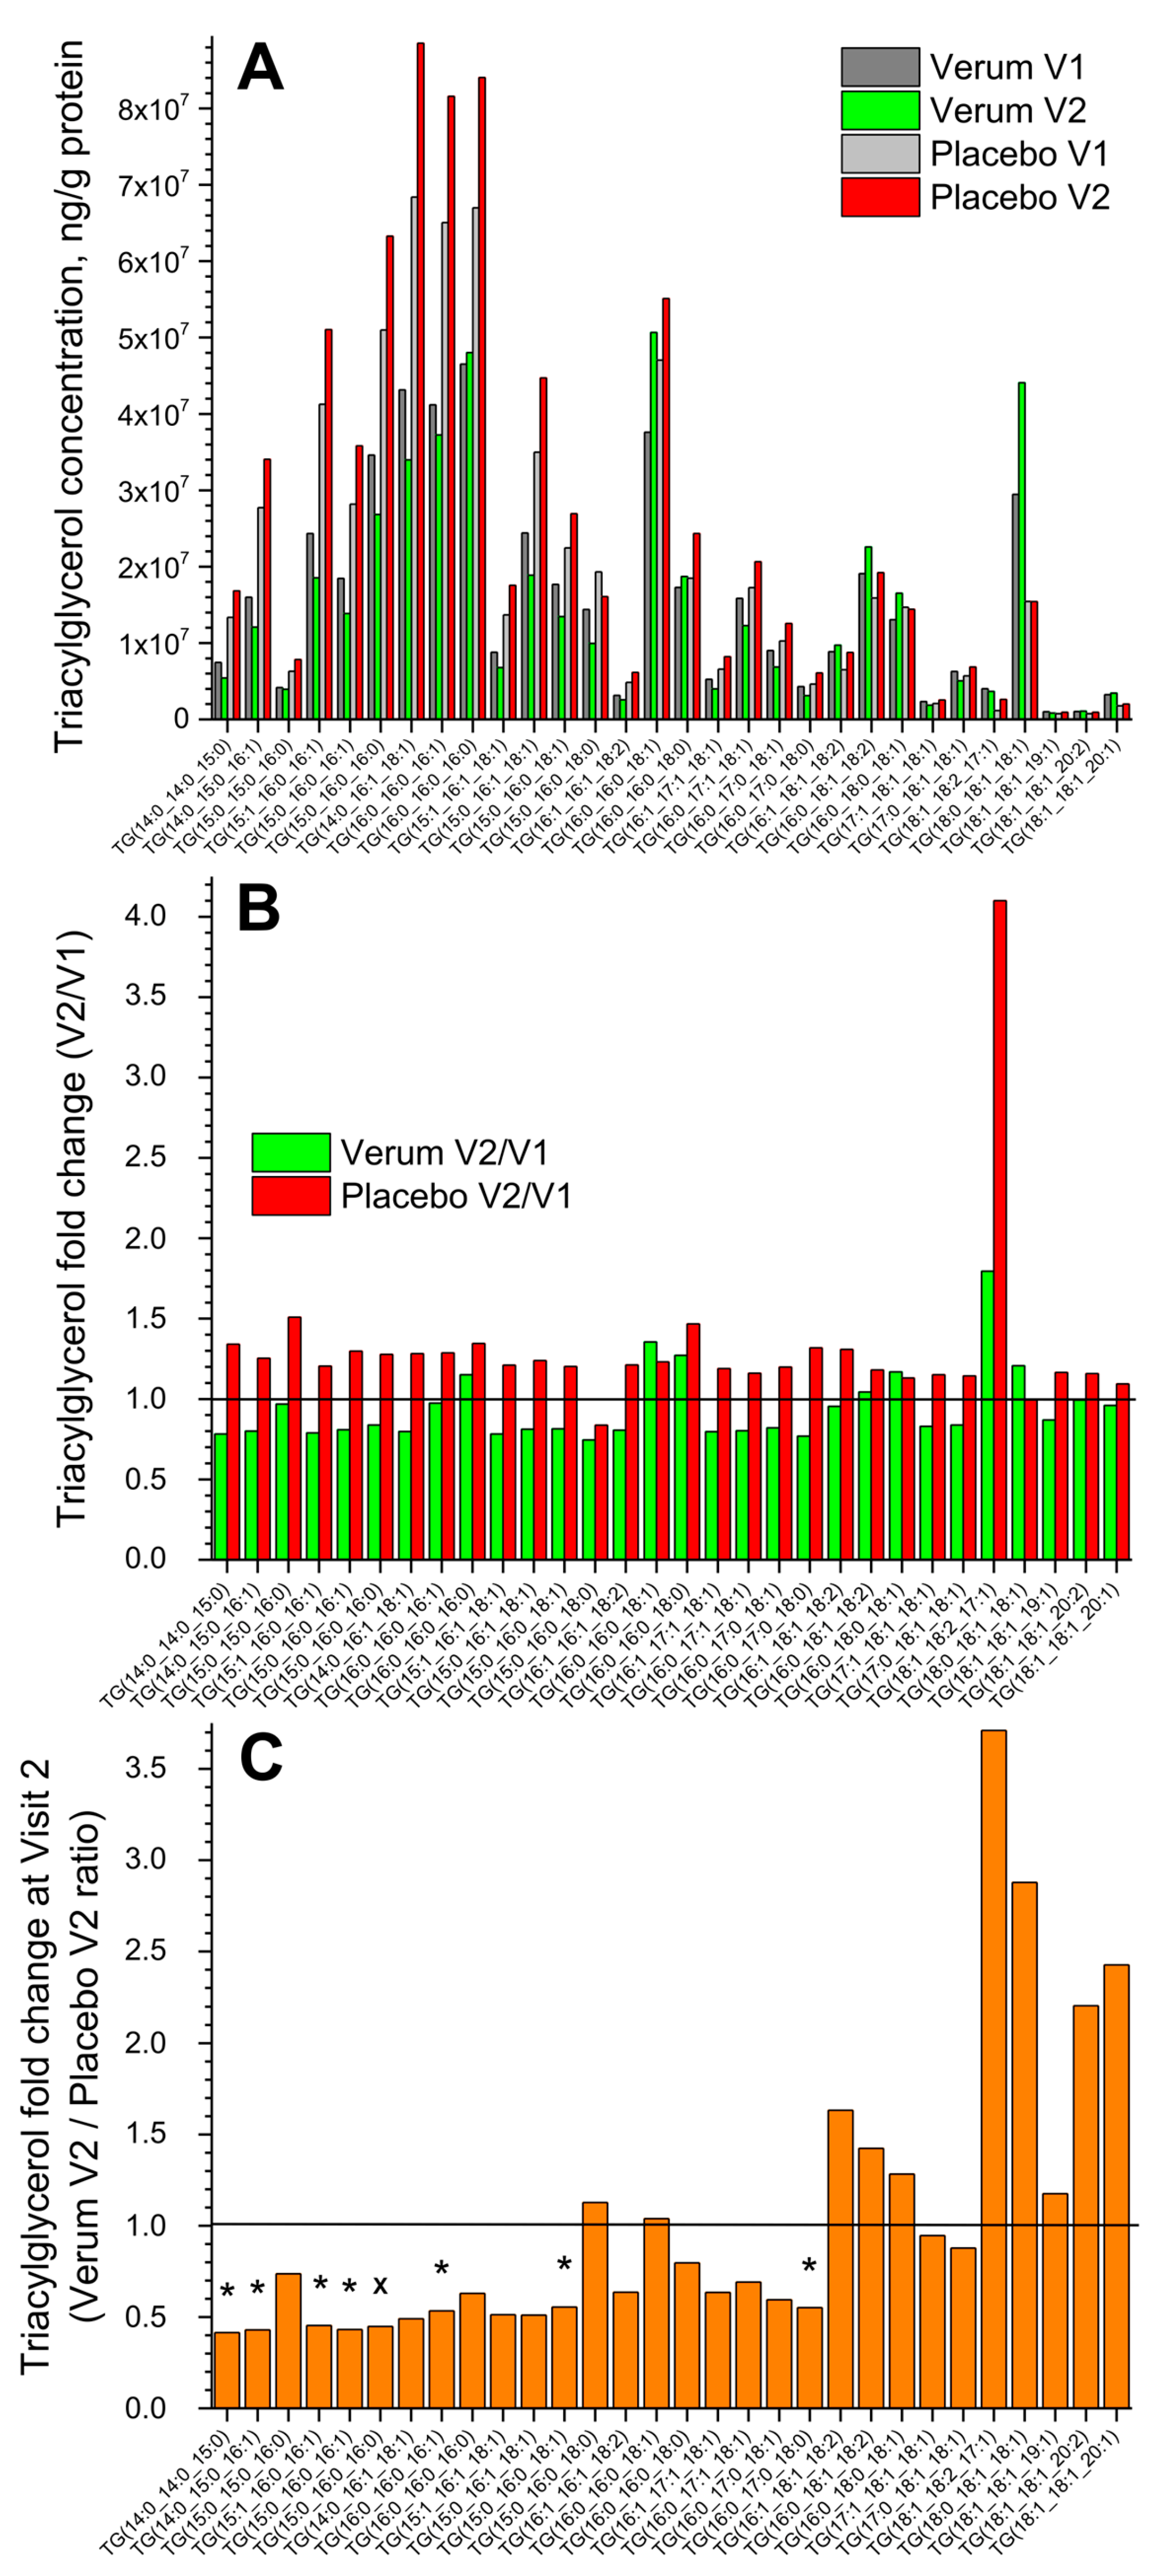
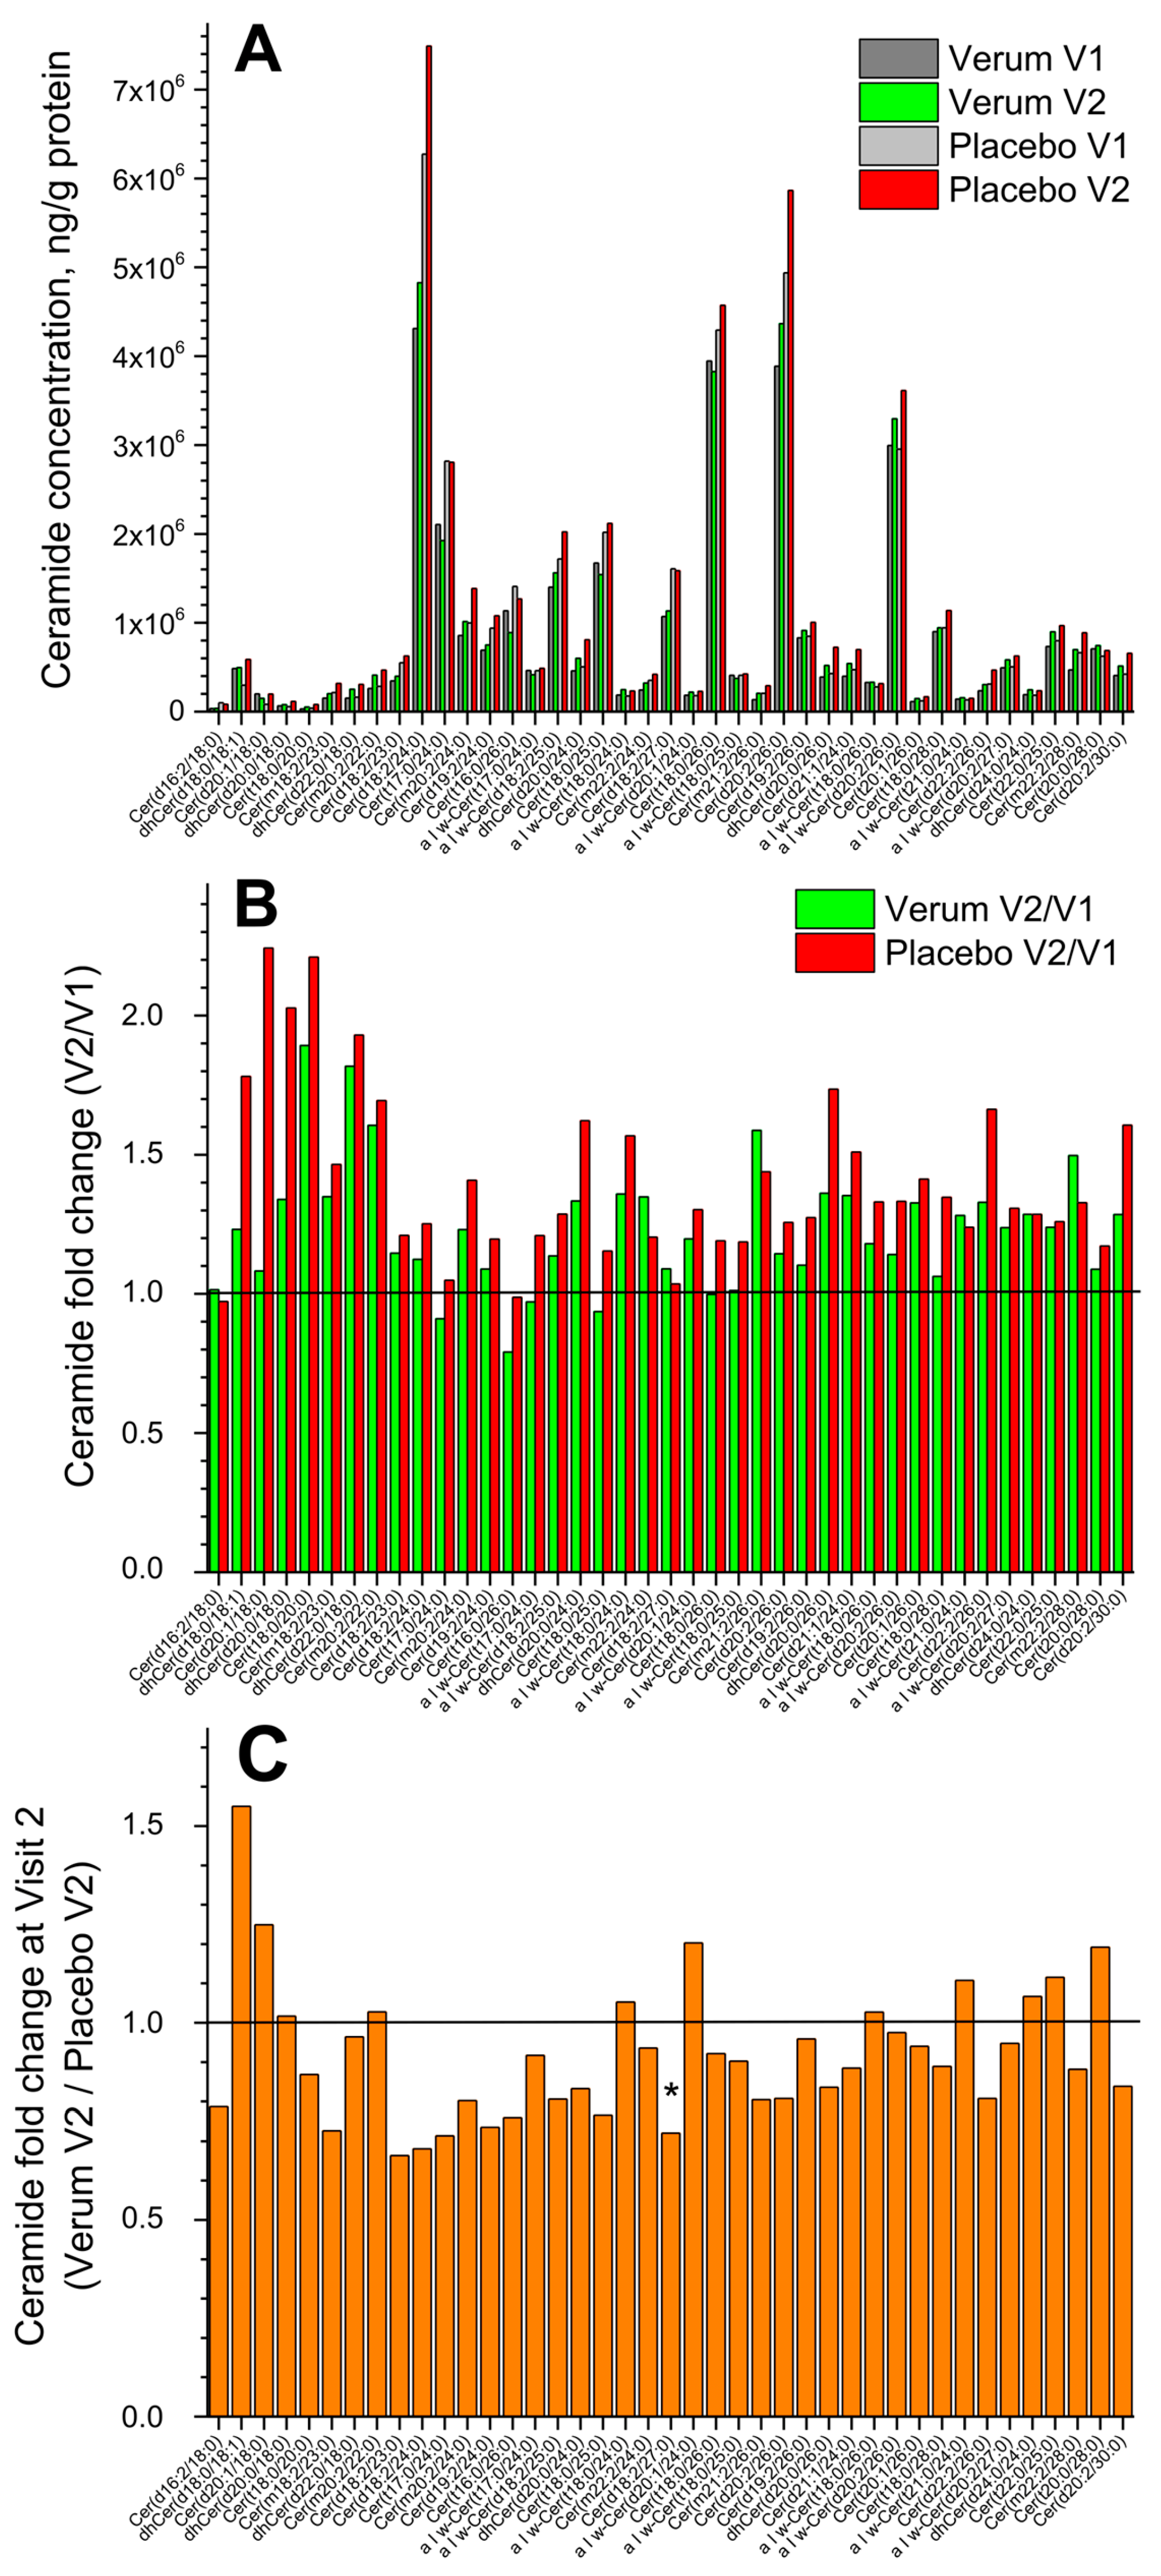
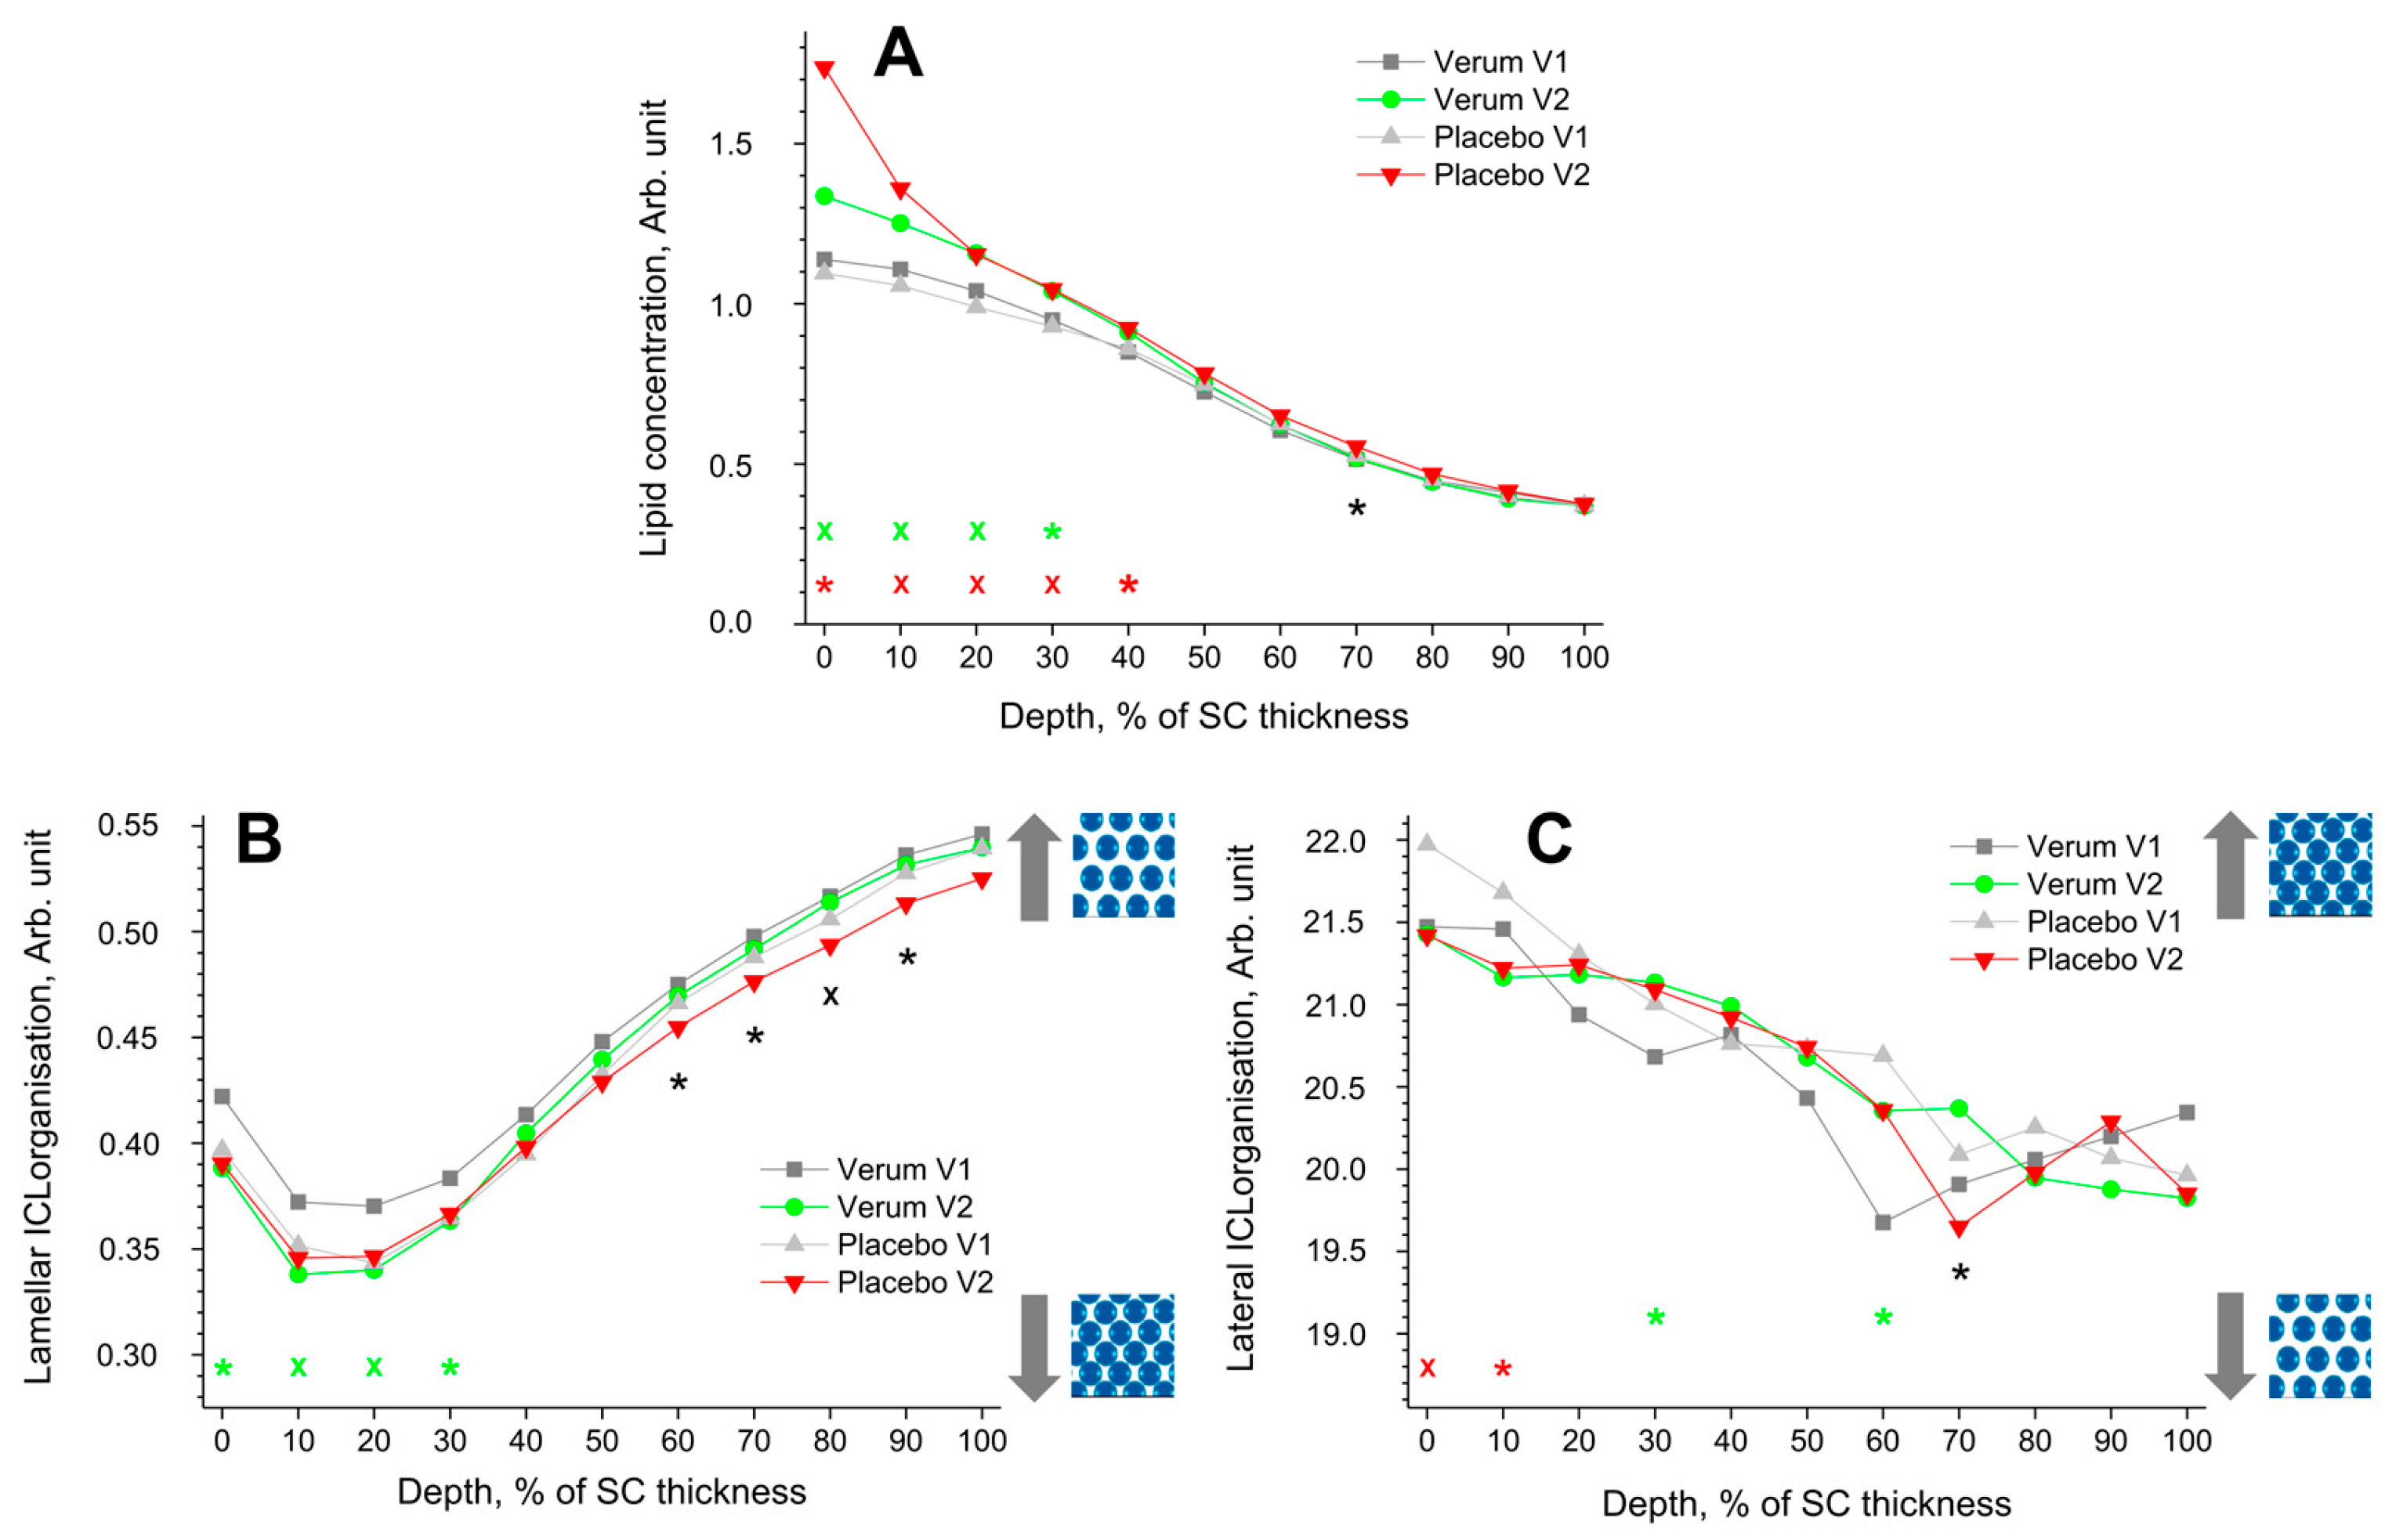
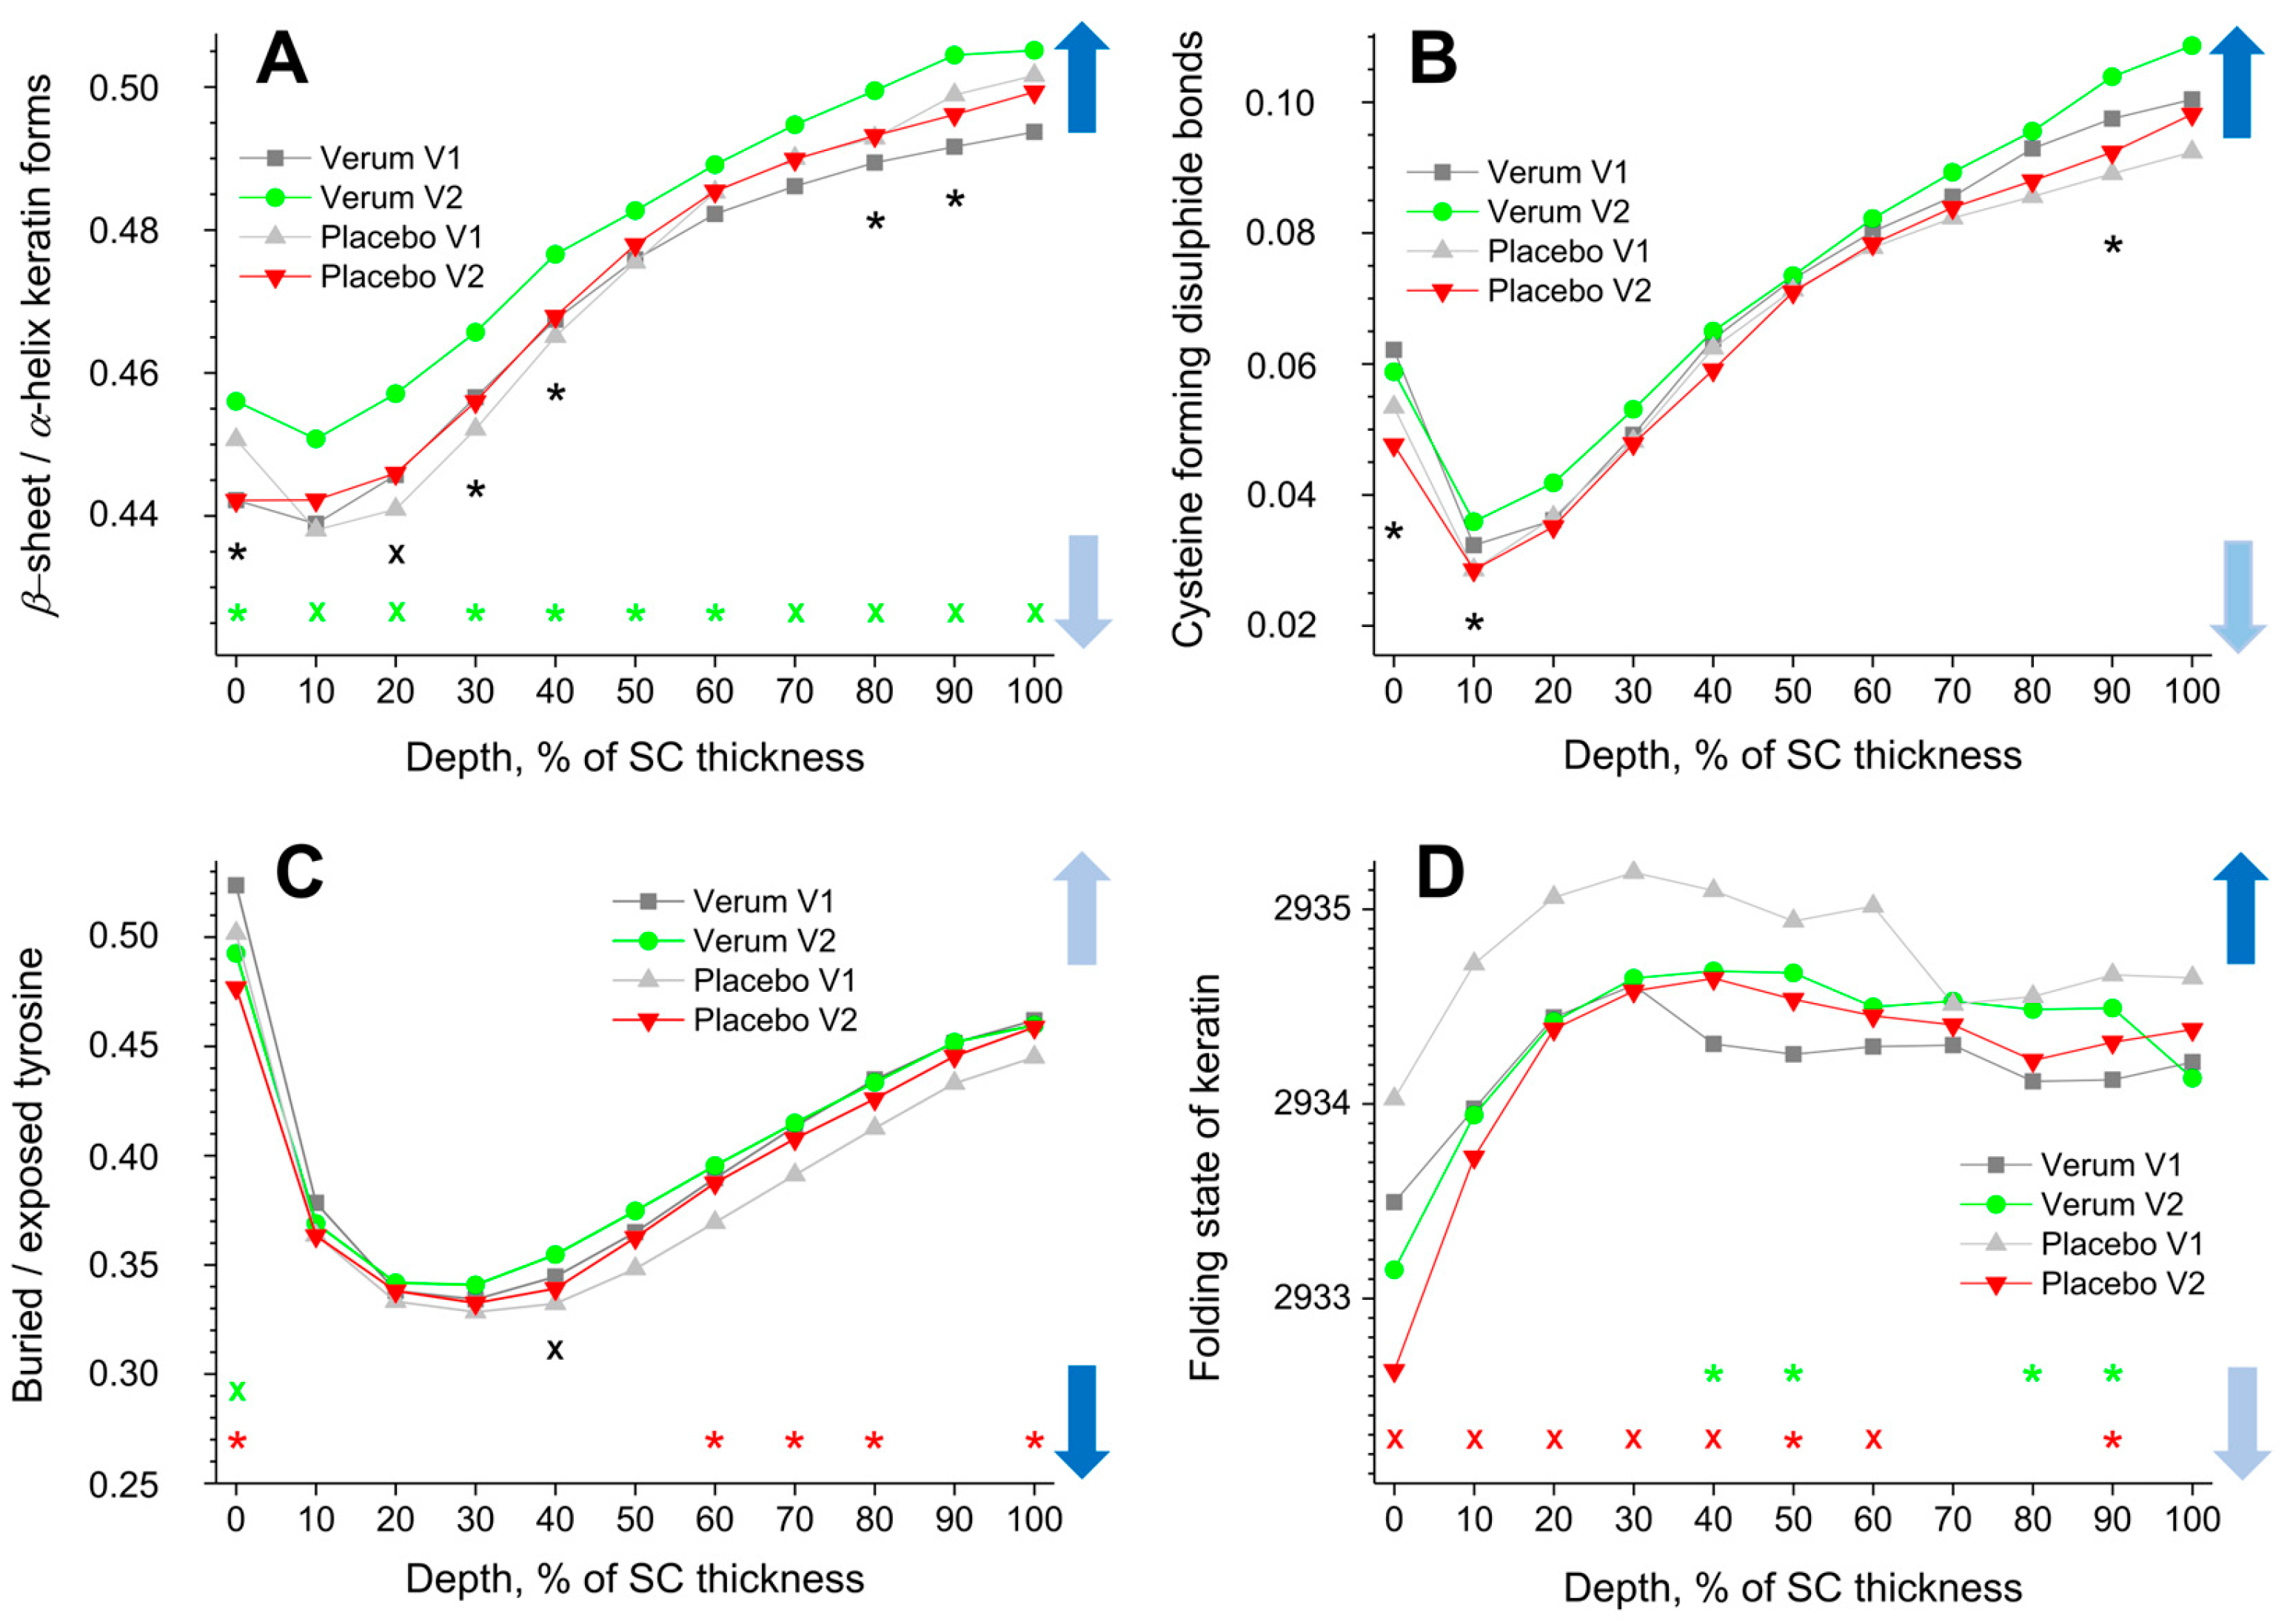
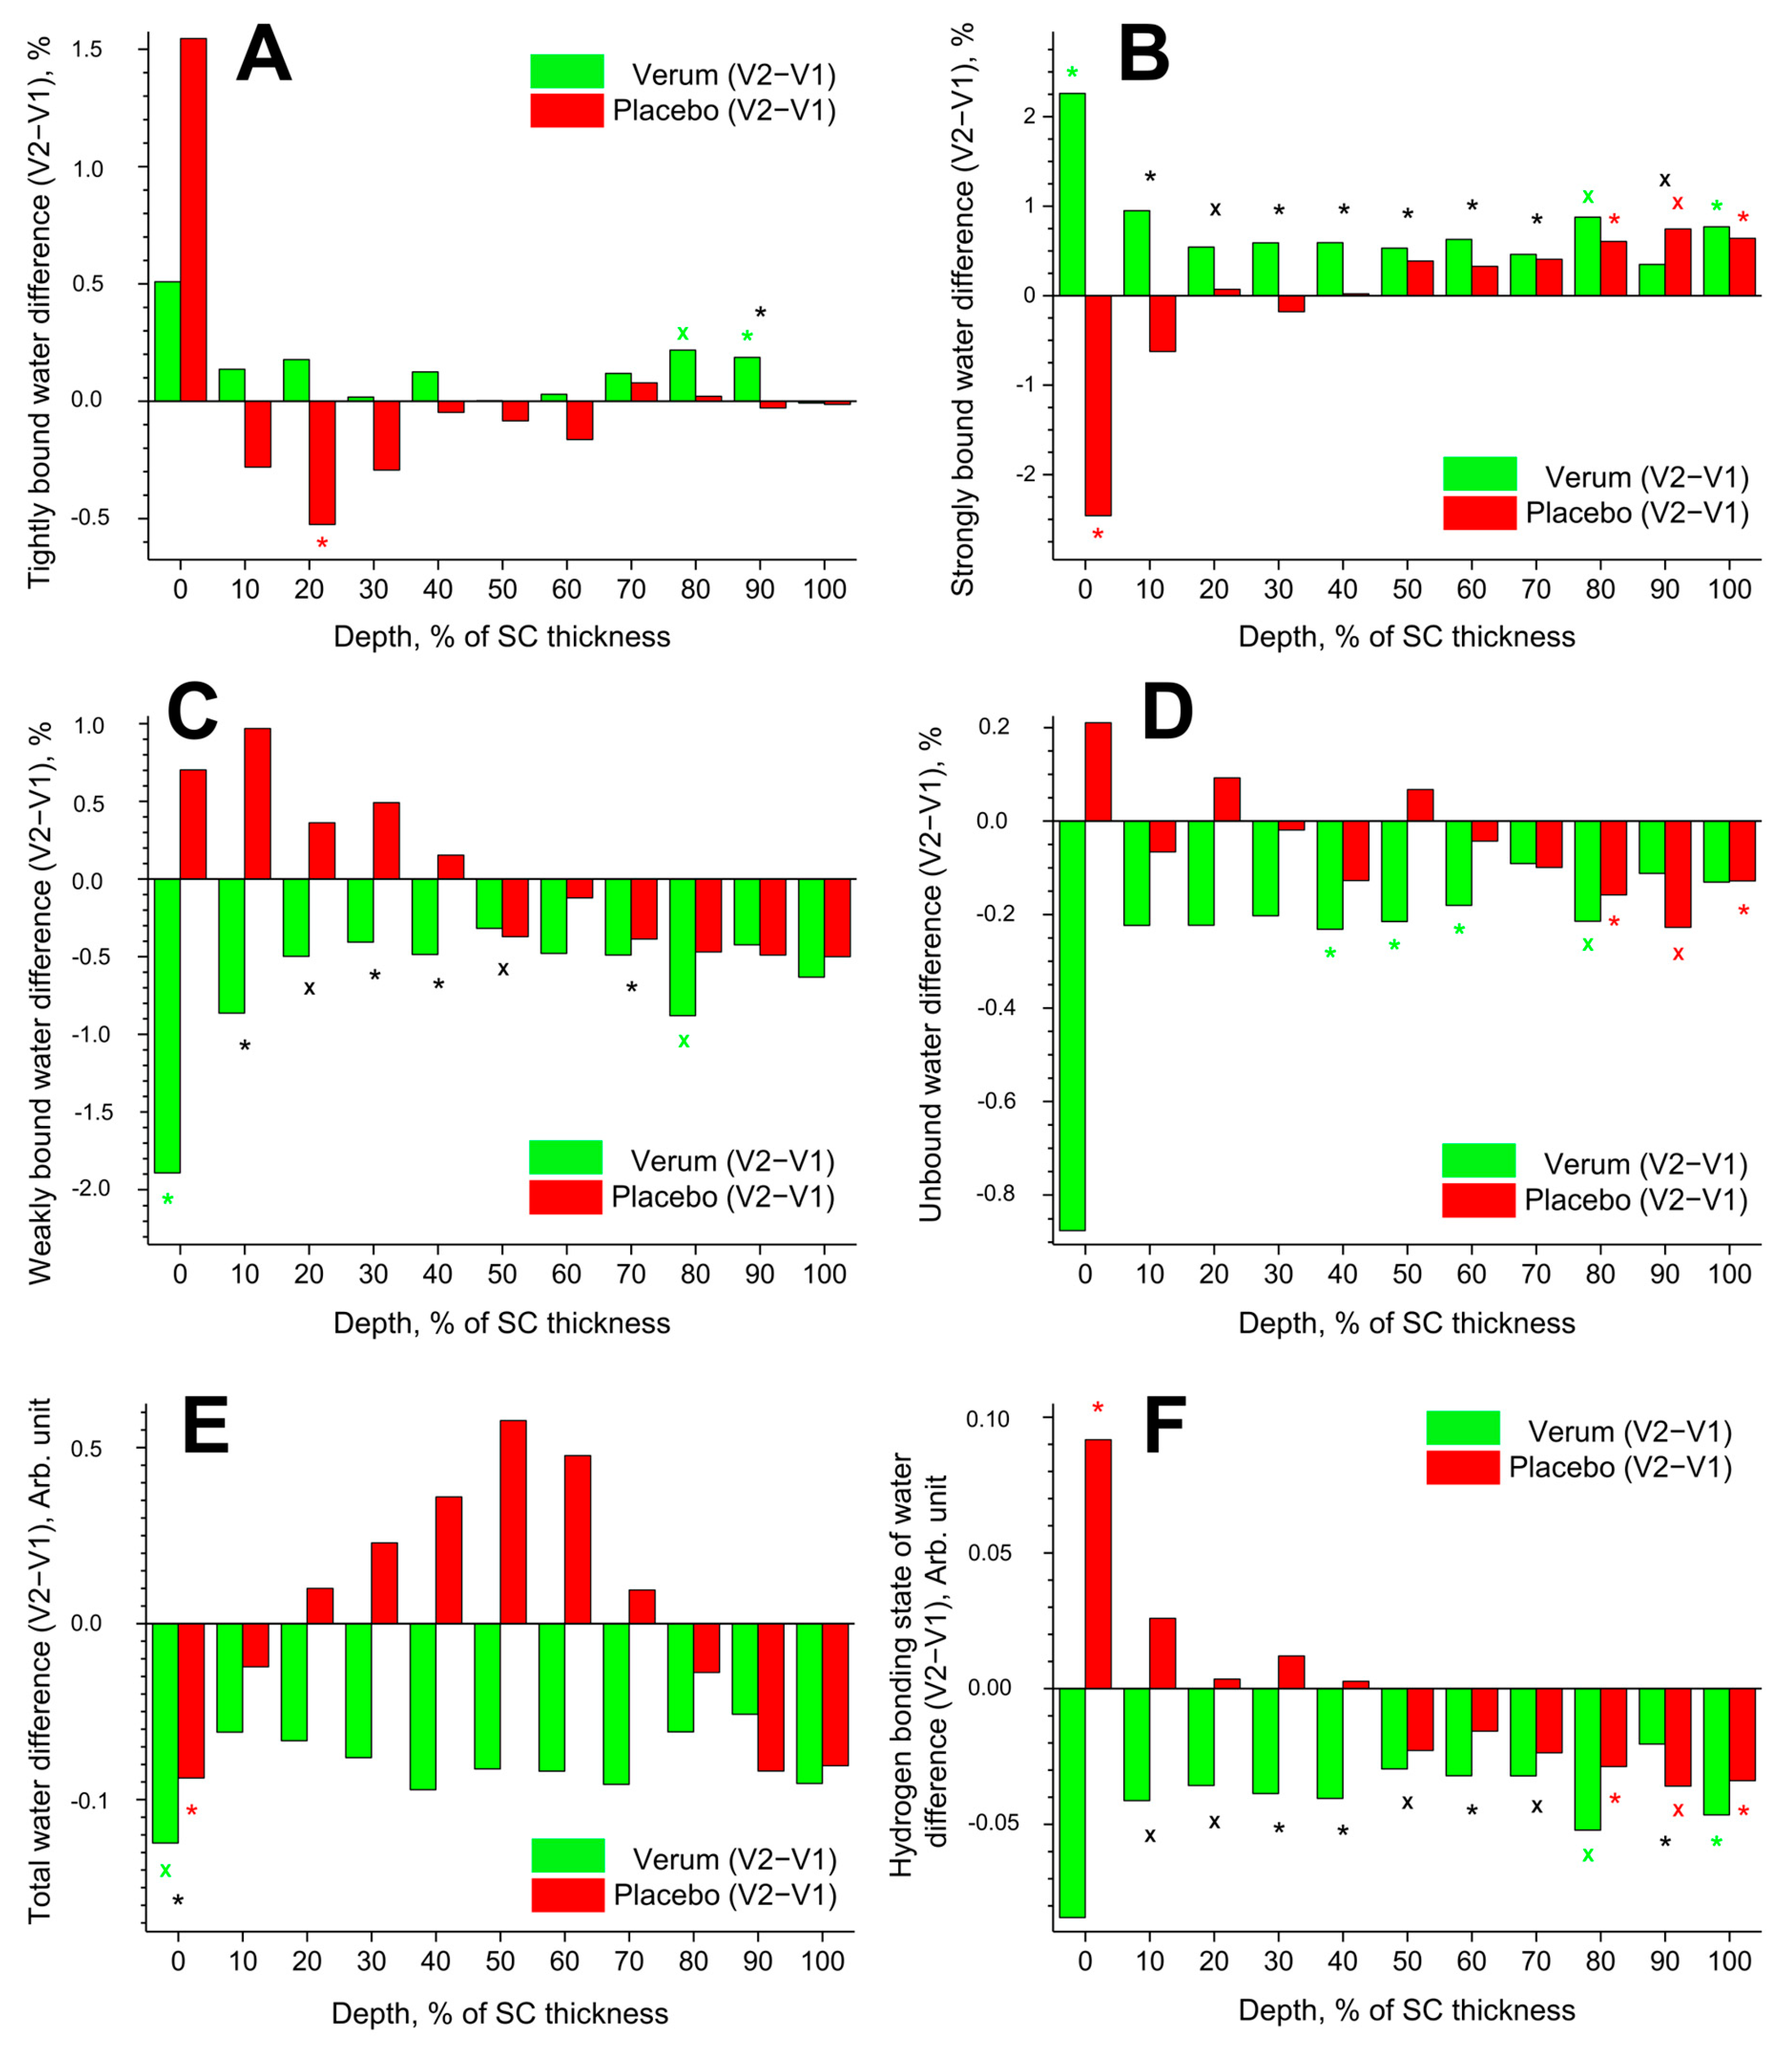

Disclaimer/Publisher’s Note: The statements, opinions and data contained in all publications are solely those of the individual author(s) and contributor(s) and not of MDPI and/or the editor(s). MDPI and/or the editor(s) disclaim responsibility for any injury to people or property resulting from any ideas, methods, instructions or products referred to in the content. |
© 2024 by the authors. Licensee MDPI, Basel, Switzerland. This article is an open access article distributed under the terms and conditions of the Creative Commons Attribution (CC BY) license (https://creativecommons.org/licenses/by/4.0/).