Article

Evaluation of Inflammatory Cellular Model by Advanced Bioanalytic and Artificial Intelligence Analyses of Lipids: Lipidomic Landscape of Inflammaging

1
Department of Human Science and Quality of Life Promotion, Telematic University San Raffaele, 00166 Rome, Italy
2
Department of Pharmaceutical Sciences, University of Milan, Via L. Mangiagalli 25, 20133 Milan, Italy
3
Department of Theoretical and Applied Sciences, Insubria University, 21100 Varese, Italy
*
Author to whom correspondence should be addressed.
Cosmetics 2024, 11(4), 140; https://doi.org/10.3390/cosmetics11040140
Submission received: 22 May 2024 / Revised: 13 July 2024 / Accepted: 7 August 2024 / Published: 16 August 2024

Abstract

:
Lipids are emerging as important potential targets for the early diagnosis and prognosis of several inflammatory diseases. Studying the lipid profiles is important for understanding cellular events such as low-grade inflammation, a condition common to many human diseases, including cancer, neurodegenerative diseases, diabetes, and obesity. This work aimed to explore lipid signatures in an inflammation cellular model using an advanced bioanalytical approach complemented by Machine Learning techniques. Analyses based on the high-resolution mass spectrometry of extracted lipids in TNF-α inflamed cells (R3/1 NF-κB reporter cells) versus lipids in control cells resulted in 469 quantified lipids, of which 20% were phosphatidylcholines (PCs) and phosphatidylethanolamines (PEs), 10% were sphingomyelins (SMs), 6% were phosphatidylinositols (PIs), 7% were ceramides (Cer), 6% were phosphatidylglycerols (PGs), and 5% were phosphatidylserines (PSs). TNF-α induced a significant alteration compared to the control, with a fold change higher than 1.5; of the 88 lipids, 71 were upregulated and 17 were downregulated, impacting various pathways as revealed by network analyses. To validate the inflammation model, the TNF-α induced cells were treated with polyphenols from thinned young apples (TAPs), which are known to have anti-inflammatory properties. The dysregulation of ceramides (Cer(d18:1/23:0), Cer(d18:1/23:0), and Cer(d18:1/22:0)) observed in TNF-α inflamed cells was completely reverted after TAP treatment. Network analyses showed the alteration of arachidonic acid and TNF signaling, which were modulated by polyphenols from thinned young apples. The results highlighted the potentiality of the inflammatory model and the bioanalytical approach to describe lipid profiles in complex biological matrices and different states. In addition, the quantified lipids were interpreted by an Artificial Intelligence approach to identify relevant signatures and clusters of lipids that can impact cellular states. Lastly, this study underlines both the potential applications of lipidomics combined with Machine Learning and how to build and validate Machine Learning models to predict inflammation based on lipid-related pattern signatures.

1. Introduction

Inflammation is a complex biological response involved in multiple signal pathways, including nuclear transcription factor kappa-B (NF-κB) and mitogen-activated protein kinases (MAPKs). The activation of transcription factors like NF-κB and activator protein-1 (AP-1) leads to the transcription of specific genes, resulting in the production of pro-inflammatory cytokines such as interleukin (IL)-6 and tumor necrosis factor (TNF)-α, as well as inflammatory mediators like inducible NO synthase (iNOS) and cyclooxygenase (COX)-2. Moreover, inflammation is a rather intricate network of cellular and molecular events, at the core of which is a plethora of pre-formed or newly synthesized mediators. Endogenous lipids are arguably the most important mediators implicated in all phases of inflammation and the regulation and fine-tuning of its course and cessation. Indeed, lipids are the major constituents of cell membranes, very efficient energy sources, and key pathophysiological mediators of several intercellular and intracellular processes. The changes in lipids and lipoproteins that occur during inflammation are part of the innate immune response. They, therefore, are likely important for protection from the detrimental effects of inflammatory stimuli [1,2]. A better understanding of inflammatory response pathways and molecular mechanisms will undoubtedly contribute to improving the prevention and treatment of inflammatory diseases. While, to date, different markers have been used to diagnose acute inflammation, i.e., protein C, only a few lipids are employed as signatures for mild inflammation (inflammaging). In addition, to address the limitations associated with the bias in quantifying single biomarkers, identifying a set of lipid-related pathways linked to inflammaging could provide a robust strategy for phenotyping cellular inflammation models, potentially applicable for studying large patient cohorts and evaluating natural molecules in vivo [3]
To advance this field, our study employs an integrated approach combining lipidomics with Machine Learning (ML) and Artificial Intelligence (AI) techniques. This innovative method aims to identify lipid signatures and clusters potentially useful for the prognosis, diagnosis, and prediction of inflammatory conditions. Untargeted lipidomics based on high-resolution mass spectrometry was employed to determine significant changes in lipid composition in an engineered cellular model featuring a gene reporter for NF-κB, stimulated by TNF-αas an inflammatory inducer. Then, AI-based bioinformatics, as an emerging tool suitable for extracting meaningful information from complex and multidimensional datasets, supports (1) the identification of lipid signatures and clusters obtained by lipidomics and AI-clustering (i.e., unsupervised AI approaches to organizing data in sub-groups based on similar features automatically) and (2) the validation of the identified clusters of lipids by simulating a large dataset of cells to compute the accuracy of a subset of important lipids in predicting the cellular condition [4,5].
Furthermore, our methodological approach evaluates the anti-inflammatory activity of natural extracts containing polyphenols. Considering the well-known health benefits of food-derived polyphenols as a source of bioactive compounds effective against inflammation and oxidative stress [6], there is growing scientific interest in reusing by-products from processing waste from agri-food supply chains. Specifically, thinned apples (i.e., a waste product particularly rich in polyphenols) represent a valuable source of natural compounds that may be applied as a food supplement and/or functional ingredient for treating chronic inflammatory diseases [7]. Some studies report the beneficial effect of dietary polyphenols by modulating lipid metabolism, i.e., the sphingolipid-mediated mechanisms [8,9]. Moreover, polyphenol-rich beverage consumption affects the parameters of lipid metabolism in healthy subjects [10]. Since fewer studies on polyphenol’s health benefits on lipid metabolism are available, a deep investigation is carried out in this paper. Overall, integrating AI and ML in lipidomics, corroborated by network analyses, offers opportunities to accelerate research, enhance data analysis, and uncover new insights into lipid biology and its implications for health and disease. This approach significantly advances our understanding of lipid-related processes and their implications across various research areas and applications. Although it is still evolving, such integrated research paves the way for innovative strategies in diagnosing and managing inflammatory conditions, particularly within the realm of personalized medicine. This underscores the dynamic landscape of biomedical research and the potential for technology-driven solutions in healthcare.

2. Materials and Methods

2.1. Chemicals

R3/1 NF-κB reporter cell lines, glutamine, and penicillin/streptomycin antibiotics were purchased from Lonza Bioscience. Dulbecco’s Modified Eagle’s Medium (DMEM), trypsin-EDTA 0.5% 10×, and sodium pyruvate were obtained from Gibco® (Thermo Fisher Scientific, Bremen, Germany). Fetal Bovine Serum (FBS) and phosphate-buffered saline (PBS) were obtained from Euroclone® (Milan, Italy). Methanol (MeOH), acetonitrile (MeCN), 2-propanol (i-PrOH), and formic acid (FA) (all ULC/MS-CC/SRATIO grade) were purchased from Biosolve (Valkenswaard, The Netherlands). Methyl-tert-butyl-ether (≥99%, MTBE) and ammonium format (NH4HCO2) MS grade were purchased from Sigma-Aldrich (Taufkirchen, Germany). SPLASH® LIPIDOMIX® Mass Spec Standard was purchased from Avanti Polar Lipids Inc. (Alabaster, AL, USA). In-house water purification was performed using a PureLab Ultra Analytic System (ELGA Lab Water, Celle, Germany), achieving a resistance >18 MΩ·cm−1 and a total organic content of <10 ppb.

2.2. Cell Culture and Treatment

R3/1 NF-κB cells (5000 cells/well) were cultured as a monolayer in a complete medium containing DMEM 10% FBS, 1% L-glutamine, and 1% penicillin/streptomycin at 37 °C in a humidified atmosphere of 5% CO2. Then, cells were stimulated for 24 h with 10 ng/mL TNF-α. The concentration of TNF-α selected in this study was 10 ng/mL because it is considered the optimal functional concentration of TNF-α in many cell types and in experimental studies [7]. Three untreated flasks were used as the control, and 10 µM of rosiglitazone was used as a positive control [11]. The cells were seeded in T-75 flasks and were treated in biological triplicate with 200 µg/mL of extract of thinned apples with a polyphenol content of 48 mg/100 g, as determined by the Folin–Ciocalteu colorimetric test, where its composition was investigated in [7]. The viability of the cells was evaluated using the MTT reduction assay (Sigma-Aldrich) and Real Time Glo-MT kit assay (Promega), as previously described [2].

2.3. Sample Preparation

Once treated, all the cells were trypsinized (2 mL of trypsin-EDTA 0.5% 1:10 v/v in PBS), transferred to Eppendorf tubes, and pelleted in cold PBS by two cycles of centrifuge (400× g, 4 °C for 5 min); then, the supernatant was removed. Briefly, 500 μL of antioxidant buffer (0.1% w/v butylated hydroxytoluene, BHT in water) was used for the resuspension, and the solution was transferred to a new tube. Another 500 μL of the same buffer was added to wash the old tube and pull it together, followed by centrifugation (10 min, 4 °C, and 1000× g) and the discharge of the supernatant. To normalize the extraction volumes, the final resuspension (0.1% w/v BHT in water) was performed according to the cell number for each sample, at 0.030 × 10⁵ cells/μL. Appropriate volumes corresponding to 50 ug of proteins were subjected to lipid extraction.

2.4. Lipid Extraction by MTBE

A total of 50 μL of resuspended pellet was quickly spiked with 5 μL of SPLASH® LIPIDO-MIX® (Internal Standard, ISTD) and left on ice for 15 min. Lipid extraction was performed using the standard MTBE protocol, with MTBE/methanol/water (10:3:2.5, v/v/v) as the extraction solvent ratio [12]. All solvents contained BHT 0.1% w/v to prevent unwanted oxidation. Briefly, 375 μL of MeOH was added to each sample and vortexed for 5 s. Then, 1250 μL of MTBE was added, followed by 5 s of vortexing and incubation (1 h, 4 °C, and 210 rpm). The phase separation was induced by adding 315 μL of H2O, followed by 5 s of vortexing and 10 min of incubation (4 °C and 210 rpm). Once centrifugated (4 °C, 10 min, and 2000× g), the upper phase was collected in a new tube. The re-extraction was performed through 323 μL MTBE, 96.8 μL MeOH, and 80.7 μL H20 (all spiked with 0.1% w/v BHT in H20) followed by centrifugation (4 °C, 10 min, and 2000× g). The upper phases were pulled together and dried under vacuum (Eppendorf concentrator 5301, 1 mbar). Before the LC-MS analyses, lipid extracts were dissolved in 100 μLi-PrOH and vortexed. Total quality control samples (QCs, n = 3) were obtained by mixing 10 μL each, and group pool samples (n = 3, i.e., wild-type, Wt; inflamed, Inf; and inflamed treated with thinned apple polyphenols, Inf_TAP) were obtained by mixing 5 μL of 3 biological replicates. The QC sample was used to optimize the following chromatographic, mass spectrometric analysis, and data annotation.

2.5. Mass Spectrometry for Untargeted Analysis of Lipidome

All samples were analyzed at UNITECH OMICs (University of Milano, Italy) using an ExionLC™ AD system (SCIEX) connected to a TripleTOF™ 6600 System (SCIEX) equipped with a Turbo V™ Ion Source and an ESI Probe. Chromatographic separation was achieved on a Kinetex® EVO C18 (Phenomenex) 100 (Length) × 2.1 mm (ID) × 1.7 µm (Particle Size) using mobile phase A (H2O/ACN (60/40, v/v, with ammonium acetate 10 mM and 0.1% formic acid) and mobile phase B (i-PrOH/ACN (90/10, v/v, with ammonium acetate 10 mM and 0.1% formic acid) at a flow rate of 400 µL/min. The column and temperatures were set to 45 °C. The sample injection volume was 5 µL. The elution gradient was set as follows: 0–2 min (45% B), 2–12 min (45–97% B), 12–17 min (97% B), 17–17.10 min (97–45% B), and 17.10–20 min (45% B). MS spectra were collected over an m/z range of 140–1500 Da, operating in an IDA® mode (Information Dependent Acquisition). Collision energy was set to 35 (CES 15) (polarity: positive/negative). Three technical replicates (LC-MS/MS runs) were performed. Raw LC-HRMS files of all samples were first imported into MS-DIAL 4.8 (http://prime.psc.riken.jp/compms/msdial/main.html, 1 April 2023) [13], followed by manual annotation and integration, for peak detection, deconvolution, and alignment. A linear-weighted moving average was used as the default for peak detection to determine the peak left and right edges accurately. The next step matched features with the integrated MS2 spectral Lipidblast database using the corresponding predicted fragment ions in MS-DIAL. MS1 and MS2 tolerance was fixed at 0.01 Da and 0.025 Da, respectively. To avoid false positives, the identification score cut-off was set to 80%. Peak intensities were aligned across QC samples as reference files, followed by additional manual curation for the correct peak integrations. The retention time tolerance was fixed at 0.05 min with MS1 tolerance at 0.015 Da. The stability of the lipidomic method was evaluated by analyzing 6 replicate QC samples in both positive and negative ionization. The carry-over was controlled by regularly measured blank samples and registration of standard signals. Unknown entries were removed from the identifications. According to the guidelines of the Lipidomics Standards Initiative, a level 2 quantitation was performed for representative lipid classes based on spiked deuterium-labeled internal standards with known concentrations. In brief, Cers were normalized by Cer(d18:1/17:0); CEs, DGs, and TGs were normalized by TG 15:0/18:1(d7)_15:0; LPCs were normalized by LPC 18:1(d7); LPE and LPE-O were normalized by LPE 18:1(d7); PCs and PC-O were normalized by PC 15:0/18:1(d7); PEs, PE-O, PE-S, were normalized by PE 15:0_18:1(d7); PGs were normalized by PG 15:0/18:1(d7); and PIs were normalized by PI 15:0/18:1(d7). The minor classes, such as CAL and NAE, were not normalized with IS. The quantified lipids from positive and negative were merged into a single dataset, as reported in Table S1. TG was detected as [M+NH4]+, Cers were identified in positive runs as [M+Na]+, [M+H]+, and [M+H-H2O]+, whereas PIs and PGs were detected as [M-H]. Some lipids were annotated in both positive and negative runs (for example, phosphatidylcholines and sphingomyelin were detected as protonated molecular species ([M+H]+) in the positive ion mode and as adducts [M+HCOO] in the negative ion mode).
Relative quantification was based on the determination of the Area Under the Curve (AUC) for each lipid correctly identified and then normalized by the AUC of the used ISTD to the corresponding lipid species and the original cell number. Normalized peak intensities were then exported to Excel for statistical analysis using MetaboAnalyst version 5.0.

2.6. Statistical and Networking Data Analysis

MetaboAnalyst v 5.0 online software (https://www.metaboanalyst.ca/, 1 April 2023), coupled with a Pareto scale (mean-centered and divided by the square root of the standard deviation of each variable) prior to Principal Component Analysis (PCA) [14], was used to perform statistical analyses (p-value < 0.05, fold change > 2, FDR) [15]. Log2ratio, a statistical measure used in lipidomics to compare the relative abundance of lipids between two different conditions and z-scores and to predict the activation or inhibition of biological pathways or functions based on the observed expression patterns of lipids in the IPA knowledge database, was employed. Lipids showing significant changes were identified with unique IDs corresponding to the human metabolome database (HMDB) and subjected to network analysis using Ingenuity Pathways Analysis software (IPA, Qiagen, version 21/03/24).

2.7. AI, ML, Monte Carlo, and ROC Analyses

Python was used to validate the detected relevant clusters of lipids to develop a program to simulate a large dataset of cells using the Monte Carlo method [16]. The number of Monte Carlo iterations was determined by using the formula 3 d e v _ s t d ( x ) a v g ( x ) 0.05 ) 2 , where x is the starting dataset of each lipid under study. We assumed a normal distribution for the simulated cells. The simulated cells were used as a training set of an ML algorithm (based on univariate logistic regression functions [17] and the Scikit-learn package in Python) to predict the cell condition (i.e., wild-type, inflamed, and inflamed with treatment) from the observation of the peak normalized intensity of each lipid under study. Each simulated dataset was partitioned into training, test, and validation sets by following the rule of 60%, 20%, and 20%. The Receiver Operating Characteristic Curve (ROC) and the ROC-related Area Under the Curve (AUC) scores were computed to evaluate the accuracy of our ML model in predicting the cell conditions.

3. Results and Discussion

3.1. Setup of Analytical Method of Lipid Analysis

The metabolism alteration and unbalanced biosynthesis of lipids are involved in the pathogenesis and clinical course of chronic inflammation diseases [18]. The aims of this work were to first develop an untargeted HPLC-TripleTOF method for lipid identification, followed by an integrated lipid signature prediction by AI and feature-based molecular network analysis. The lipidomics study aimed to (i) select an appropriate cellular in vitro model as R3/1 NF-κB reporter cells to study the inflammation under external stimuli of inflammation, (ii) apply AI to identify clusters of lipid signatures and ML models able to predict the cell’s conditions, (iii) investigate the potential role of thinned apple polyphenols (TAPs) on inflamed R3/1 NF-κB reporter cells, and (iv) cover novel insights into lipid metabolism, lipid signaling pathways, and lipid–lipid interactions by network analysis. The engineered cell line, with the gene reporter for NF-κB, was employed as an in vitro model to investigate the inflammation when TNF-α, a potently pro-inflammatory cytokine, was used as an inflammatory inducer. The same cellular model was then used to probe the anti-inflammatory activity of TAPs. The transcription factor NF-κB regulates multiple aspects of innate and adaptive immune functions and serves as a pivotal mediator of inflammatory responses. NF-κB induces the expression of various pro-inflammatory genes, including those encoding cytokines and chemokines, and participates in inflammasome regulation. In addition, NF-κB plays a critical role in regulating the survival, activation, and differentiation of innate immune cells and inflammatory T cells.
With the aim of representing broader lipidome coverage, lipids from wild-type (Wt), inflamed (Inf), and inflamed cells treated with TAPs (Inf_TAP) were extracted, and data were acquired independently in positive and negative ion modes (three biological replicates in technical triplicates). The manual curated identification allowed the identification of 469 lipid molecular species. Among the identified lipid species, phosphatidylcholines (PCs) and phosphatidylethanolamines (PEs) each represent 20% of the total lipids identified, followed by sphingomyelin (SM, 10%), phosphatidylinositols (PIs, 7%), ceramides (Cers, 7%), phosphatidylglycerols (PGs, 6%), and phosphatidylserines (PSs, 5%), as reported in Table 1. A complete lipidomic dataset (final list of identified/aligned lipid species, their relative abundance values, and differentially abundant lipids) is provided in Table S1A.

3.2. Effect of Induced Inflammation on R3/1 NF-κB Reporter Cells: Study of Lipidome of Cellular Model

The obtained global lipidome and LC-MS data were statistically evaluated using techniques such as fold change analysis and volcano plots to distinguish lipids statistically dysregulated between the Wt and Inf conditions. AI-based algorithms such as Partial Least Squares Discriminant Analysis (PLS-DA) and Hierarchical Clustering Analysis (including dendrograms and heatmaps) were adopted for predictive and descriptive modeling as well as for discriminative variable selection. PLS-DA, with components 1 and 2 accounting for 28.8% and 23.5% of the variance, respectively, showed a clear cluster separation between cells stimulated with the pro-inflammatory cytokine TNF-α and the wild-type (Wt) (Figure 1A). Moreover, TNF-α induced a significant alteration based on a ratio (>1.5) of 88 features, of which 71 were upregulated and 17 were downregulated (Figure 1B and Table S1B). The dysregulated lipids belong to acylcarnitines (CARs; n = 2), phosphatidylcholines (PCs; n = 16), lyso-phosphatidylcholines (LPCs; n = 9), phosphatidylethanolamines (PEs; n = 8), lyso-phosphatidylethanolamines (LPEs; n = 9), phosphatidylserines (PSs; n = 10), and sphingomyelins (SMs; n = 8). Significant differences between TNF-α vs. Wt based on the two-sample t-test and Wilcoxon rank-sum test (p < 0.05) were observed, suggesting a significant cellular effect related to the induced inflammation (Figure 1C). Moreover, information about the importance of the variables in the studied model was obtained by considering the VIP variables (Figure 1D).
Confirming the inflammatory state, a greater relative abundance of LPC was observed for LPC 16:0 (log2ratio = 1.37), LPC 18:0 (log2ratio = 1.32), and LPC 16:1 (log2ratio = 1.32). Specifically, increasing evidence underlines the role of LPC in the release of inflammatory cytokines, such as IL-6 and IL-8 [19], as well as the induction of marked COX-2 expression [20]. The LPC can induce the migration of lymphocytes and macrophages, increase the production of pro-inflammatory cytokines, induce oxidative stress, and promote apoptosis, which can aggregate inflammation and promote the development of diseases. Specifically, LPC originates from the cleavage of phosphatidylcholine by phospholipase A2 (PLA2) and plays a biological role by binding to G protein-coupled receptors and Toll-like receptors [21]. Moreover, LPC increases the expression of target genes through Ca2+-mediated second messenger or directly downstream inflammatory signaling pathways [21]. Furthermore, LPE 20:4 (log2ratio = 1.33) and LPE 22:6 (log2ratio = 1.29), which contain the omega-6 fatty acid arachidonic acid and the omega-3 fatty acid docosahexaenoic acid, respectively, can also contribute to inflammation by serving as substrates to produce eicosanoids, which are potent mediators of inflammation [22,23]. Alternatively, inflammation induced by TNF-α exposure is characterized by a reduction in phosphatidylserine (PS) levels, known to suppress the production of pro-inflammatory cytokines such as interleukin-6 (IL-6) and tumor necrosis factor-alpha (TNF-α) by immune cells like macrophages and dendritic cells [24]. Specifically, PS 18:0/18:1 (log2ratio = −1.16), PS 18:0/22:4 (log2ratio = −1.10), and PS 18:0/20:4 (log2ratio = −1.08) were found to be downregulated as revealed by thorough lipid analyses. This detailed characterization of TNF-α inflamed cells underscores the robustness of the cellular model and the bioanalytical approach employed. Another lipid class dysregulated in an inflamed condition was the PC. Due to the nature of their fatty acid compositions, some of them were related to inflammation; for example PC 34:4|PC 14:0/20:4 (log2ratio = 0.84) contains arachidonic acid (20:4), which is a precursor for the synthesis of eicosanoids, a group of molecules extensively involved in inflammatory processes. Eicosanoids include prostaglandins, thromboxanes, and leukotrienes, all of which are mediators and regulators of inflammation. In addition, PC 34:3|PC 16:1/18:2 (log2ratio = 0.66) contains linoleic acid (18:2), an omega-6 fatty acid. While omega-6 fatty acids are generally considered pro-inflammatory due to their role in the synthesis of pro-inflammatory eicosanoids, linoleic acid is a precursor to arachidonic acid, which is centrally involved in inflammatory processes. Similarly, SM 35:2;2O|SM 18:2;2O/17:0 (log2ratio = 0.88) which contains linoleic acid (18:2), is a precursor to arachidonic acid. As previously mentioned, arachidonic acid can be metabolized into various eicosanoids, which are potent mediators of inflammation.

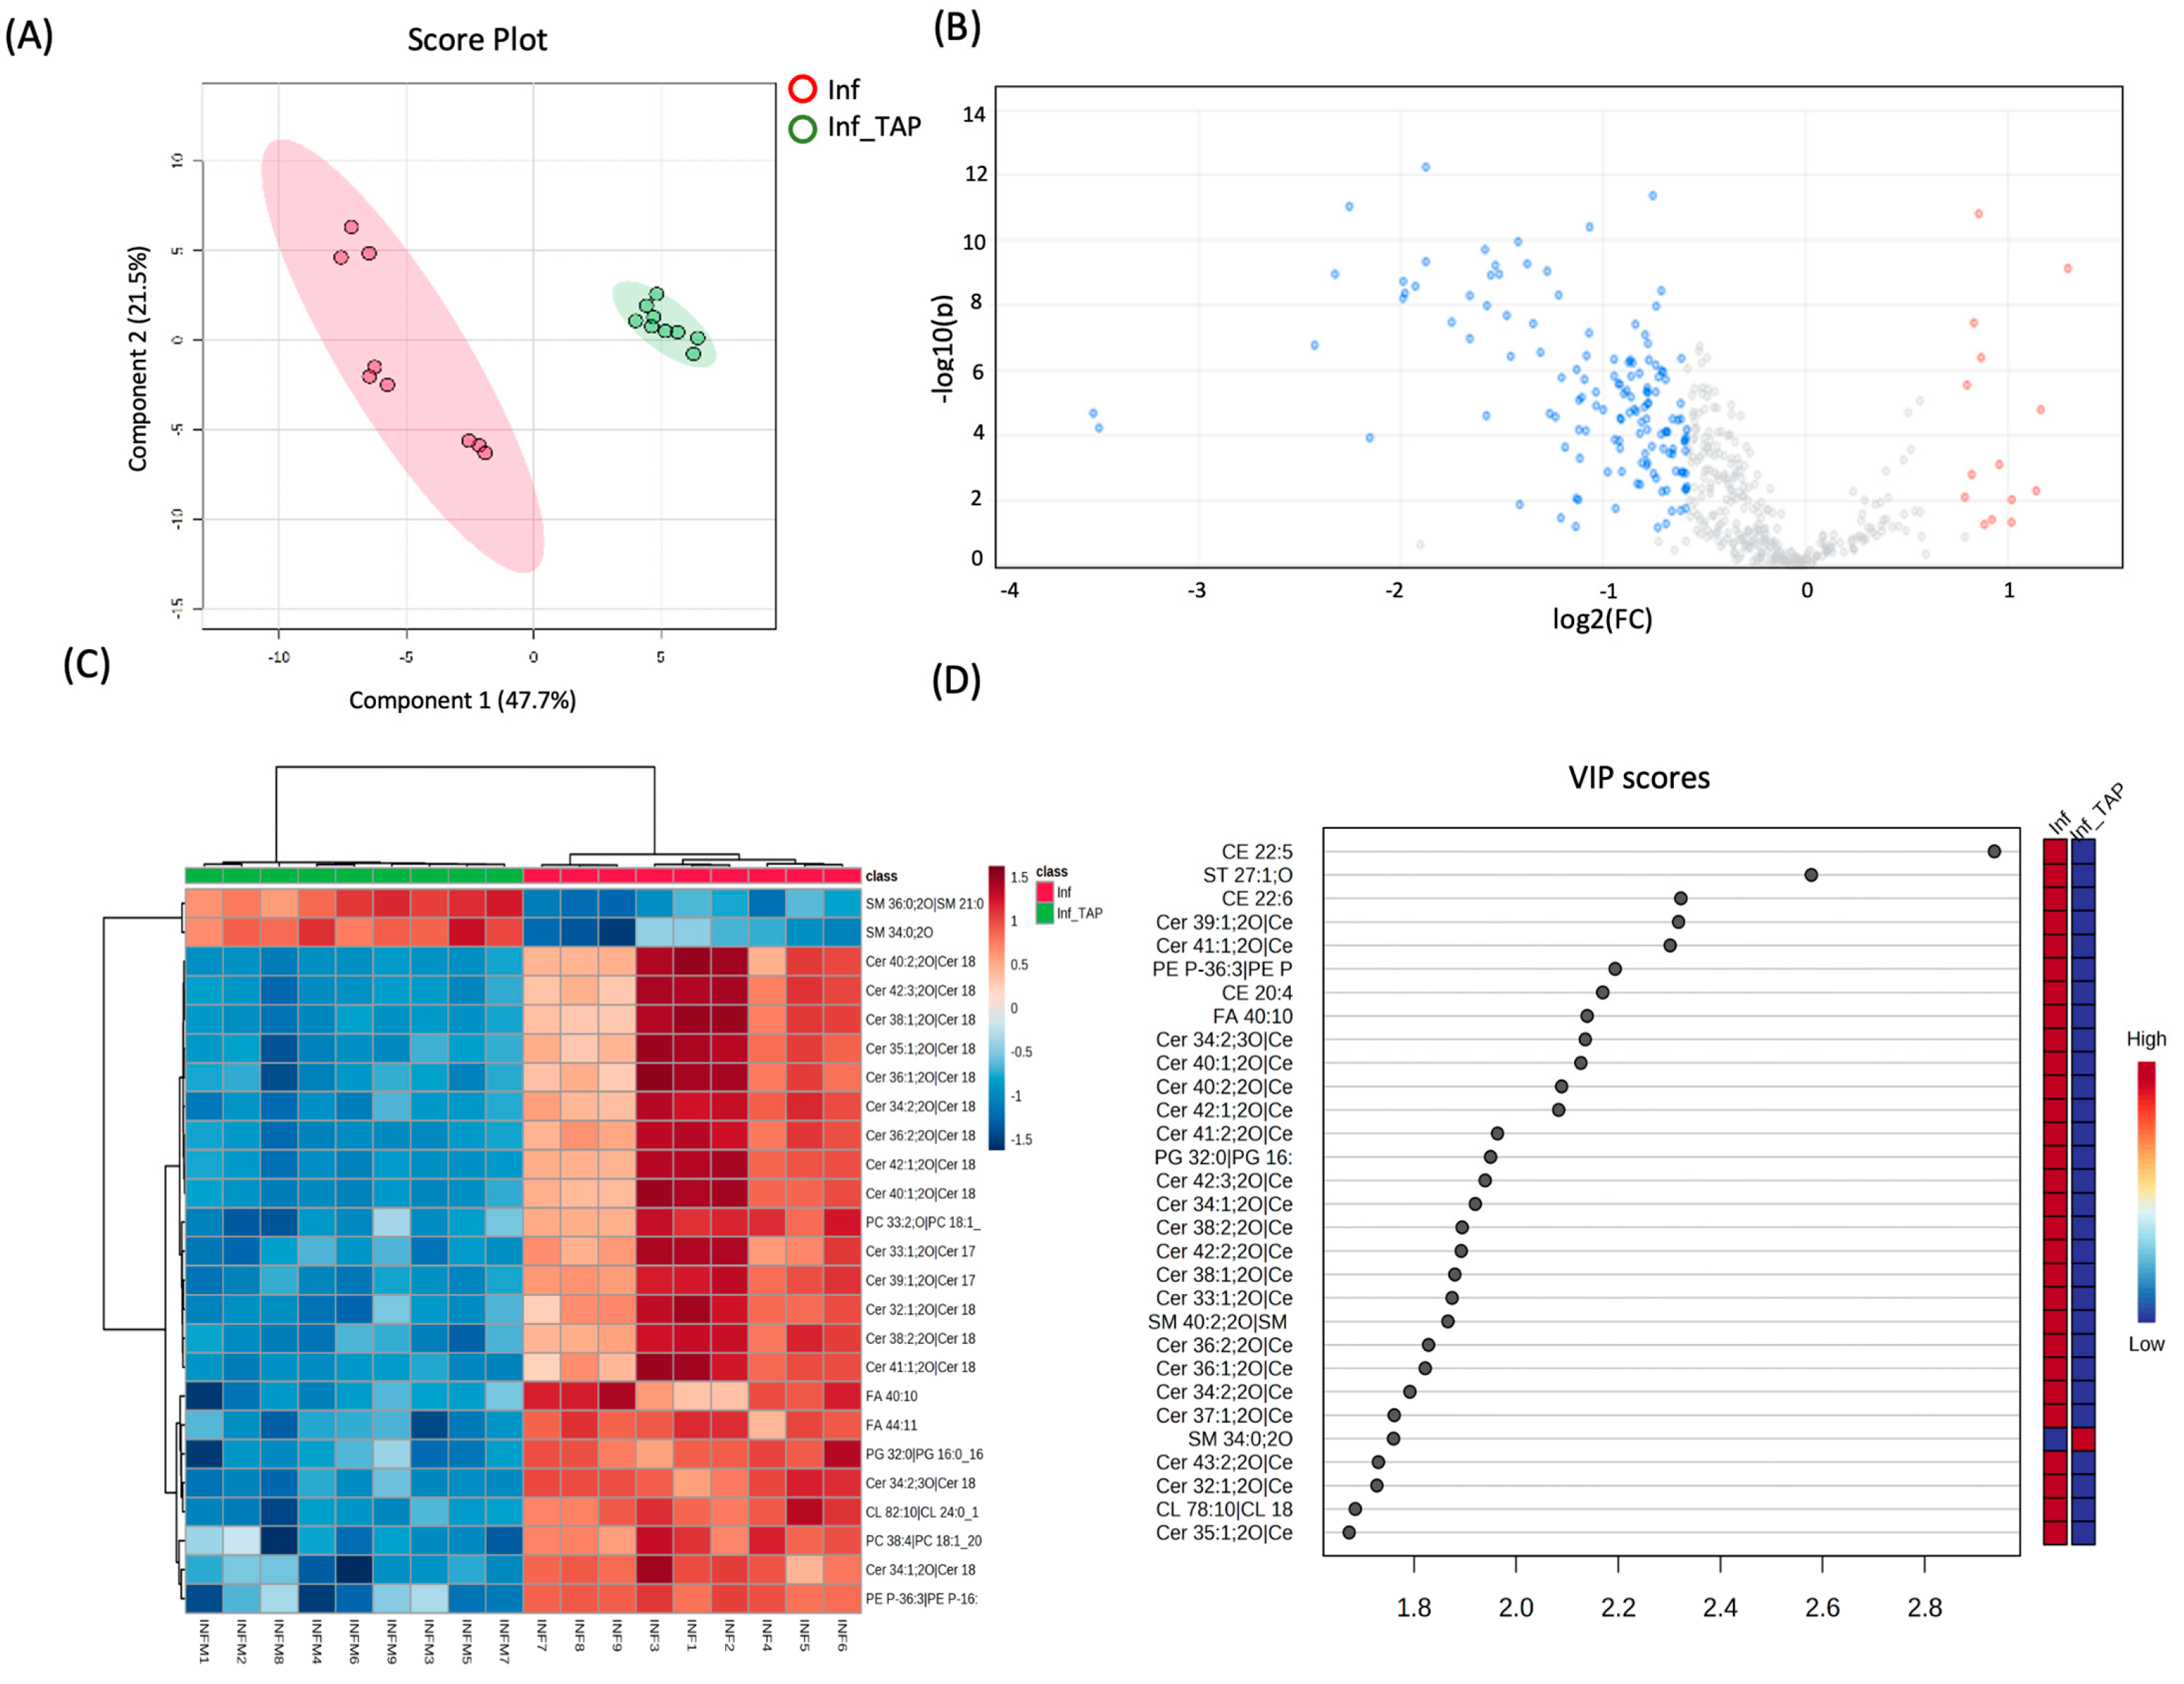
3.3. Effect of Thinned Apple Polyphenols (TAPs) on Inflamed R3/1 NF-κB Reporter Cells

To further validate both the cellular model and the analytical approach, the potential anti-inflammatory effects of TAPs were investigated in TNF-α exposed cells using high-throughput lipidomics. Statistical analysis was conducted on quantitative lipid data obtained by comparing the TAP-treated group to the inflamed conditions without TAP treatment. Additionally, to complement a prior study by Ferrario et al., which demonstrated an increase in enzymatic antioxidant cellular activity and the activation of protective oxidoreductases and their nucleophilic substrates like GSH and NADPH in response to thinned apples [7], here, the impact on the lipidome was also assessed. The treatment with TAPs (Inf_TAP) induced a significant dysregulation, based on a ratio >1.5 using 161 features, of which 149 were downregulated and 12 were upregulated (Figure 2B and Table S1B). The covariance between Inf_TAP and Inf was obtained by PLS-DA (Figure 2A). The effect of TAPs on TNF-α exposed R3/1 NF-κB reporter cells is shown in Figure 2C, which shows the hierarchical clustering heatmaps of the 25 most significantly altered lipids upon TAP treatment.
As demonstrated by unsupervised clustering and VIP analyses, the Inf_TAP is clearly separated from Inf one (Figure 2C,D). Most of the downregulated lipids belong to the ceramide class, as shown in Table 2, where all dysregulated ceramides are presented.
Ceramide can act as a pro-inflammatory mediator by stimulating the production of cytokines and other inflammatory molecules by inducing the formation of inflammasomes, which are multi-protein complexes that activate caspase-1, resulting in the production of pro-inflammatory cytokines such as interleukin-1 beta (IL-1β). Ceramides are considered a mediator of inflammation and are involved in the pathogenesis of various inflammatory diseases, such as atherosclerosis, rheumatoid arthritis, and inflammatory bowel disease [25,26].
Table 2. Dysregulated ceramides after TAP treatment.
Ceramide SpeciesInf_TAP vs. Inf
Log2RatioReferences
Cer 32:1;2O| Cer(d18:1/14:0)−1.28[27]
Cer 33:1;2O| Cer(d17:1/16:0)−1.52
Cer 34:1;2O| Cer(d18:1/16:0)−1.56[28,29]
Cer 34:2;2O| Cer(d18:2/16:0)−1.38
Cer 34:2;3O| Cer(d18:2/16:0(2OH)) −1.88
Cer 35:1;2O| Cer(d18:1/17:0)−1.22
Cer 36:1;2O| Cer(d18:1/18:0)−1.48[28,29]
Cer 36:2;2O| Cer(d18:2/18:0)−1.42
Cer 37:1;2O| Cer(d18:1/19:0)−1.46
Cer 38:0;2O| Cer(d18:0/20:0)−1.09
Cer 38:1;2O| Cer(d18:1/20:0)−1.58
Cer 38:2;2O| Cer(d18:2/20:0)−1.53
Cer 39:1;2O| Cer(d17:1/22:0)−2.26
Cer 40:0;2O| Cer(d18:0/22:0)−1.08
Cer 40:1;2O| Cer(d18:1/22:0)−1.99
Cer 40:2;2O| Cer(d18:2/22:0)−1.93
Cer 41:1;2O| Cer(d18:1/23:0)−2.33
Cer 41:2;2O| Cer(d18:1/23:1)−1.75
Cer 42:1;2O| Cer(d18:0/24:1)−1.11
Cer 42:1;2O| Cer(d18:1/24:0)−1.88[28,29]
Cer 42:1;3O| Cer(d18:0/24:1(2OH))−0.80[28,29]
Cer 42:2;2O| Cer(d18:1/24:1) −1.66
Cer 42:3;2O| Cer(d18:2/24:1)−1.66
Cer 43:2;2O| Cer(d18:1/25:1)−1.35
Moreover, ceramide is reported as an inducer of the inflammasome by activating the NLRP3 inflammasome, which is a key mediator of inflammatory responses [30]. Ceramide may play a role in cardiovascular diseases as it has been shown to increase the formation of atherosclerotic plaques and cause inflammatory arteriolar dilation [31]. Since ceramides are involved in various pathophysiological processes, i.e., oxidative stress/inflammatory pathways, and are linked to the onset and progression of cardiometabolic diseases, they could serve as promising therapeutic targets. The three ceramide species, i.e., Cer(d18:1/16:0) (log2ratio = −1.56), Cer(d18:1/18:0) (log2ratio = −1.48), and Cer(d18:0/24:1(2OH)) (log2ratio = −0.80), downregulated by TAPs are notable for their association with stable and acute coronary artery disease and metabolic abnormalities (e.g., insulin resistance) [32,33]. Therefore, since the three latter ceramides are considered good predictors of adverse cardiovascular events, the efficacy of polyphenols, specifically those from thinned young apples (TAPs) in modulating the expression levels of these ceramides was highlighted. Moreover, a clear downregulation of other ceramides, i.e., Cer(d18:1/23:0) (log2ratio = −2.32), Cer(d17:1/22:0) (log2ratio = 2.25), and Cer(d18:1/22:0) (log2ratio = −1.99) (Figure 2B–D), was observed.
Within our dataset, the majority of dysregulated ceramides exhibit long and saturated fatty acid chains, such as 22:0, which have been noted for their significant role in triggering cellular stress and apoptosis, particularly evident in conditions like cancer and diabetes [34]. Various studies have demonstrated that polyphenols such as resveratrol, epigallocatechin gallate (EGCG), and quercetin possess the ability to inhibit ceramide synthesis by downregulating the expression of key enzymes involved in their production. These polyphenols also exhibit a wide array of beneficial effects, including anticancer, anti-inflammatory, antioxidant, vasoprotective, and antifibrotic actions [35]. Moreover, grape polyphenol supplementation was associated with decreasing the expression of genes required for the biosynthesis of ceramides, which impairs glucose homeostasis [36]. Interestingly, our findings corroborate the evidence that the co-administration of tyrosol (a dietary phenolic compound) and white wine decreased the levels of three ceramides, namely, Cer C16:0, Cer C18:0, and Cer C24:1, with respect to Cer C24:0 by improving the endothelial function in subjects at high risk of cardiovascular disease [37].

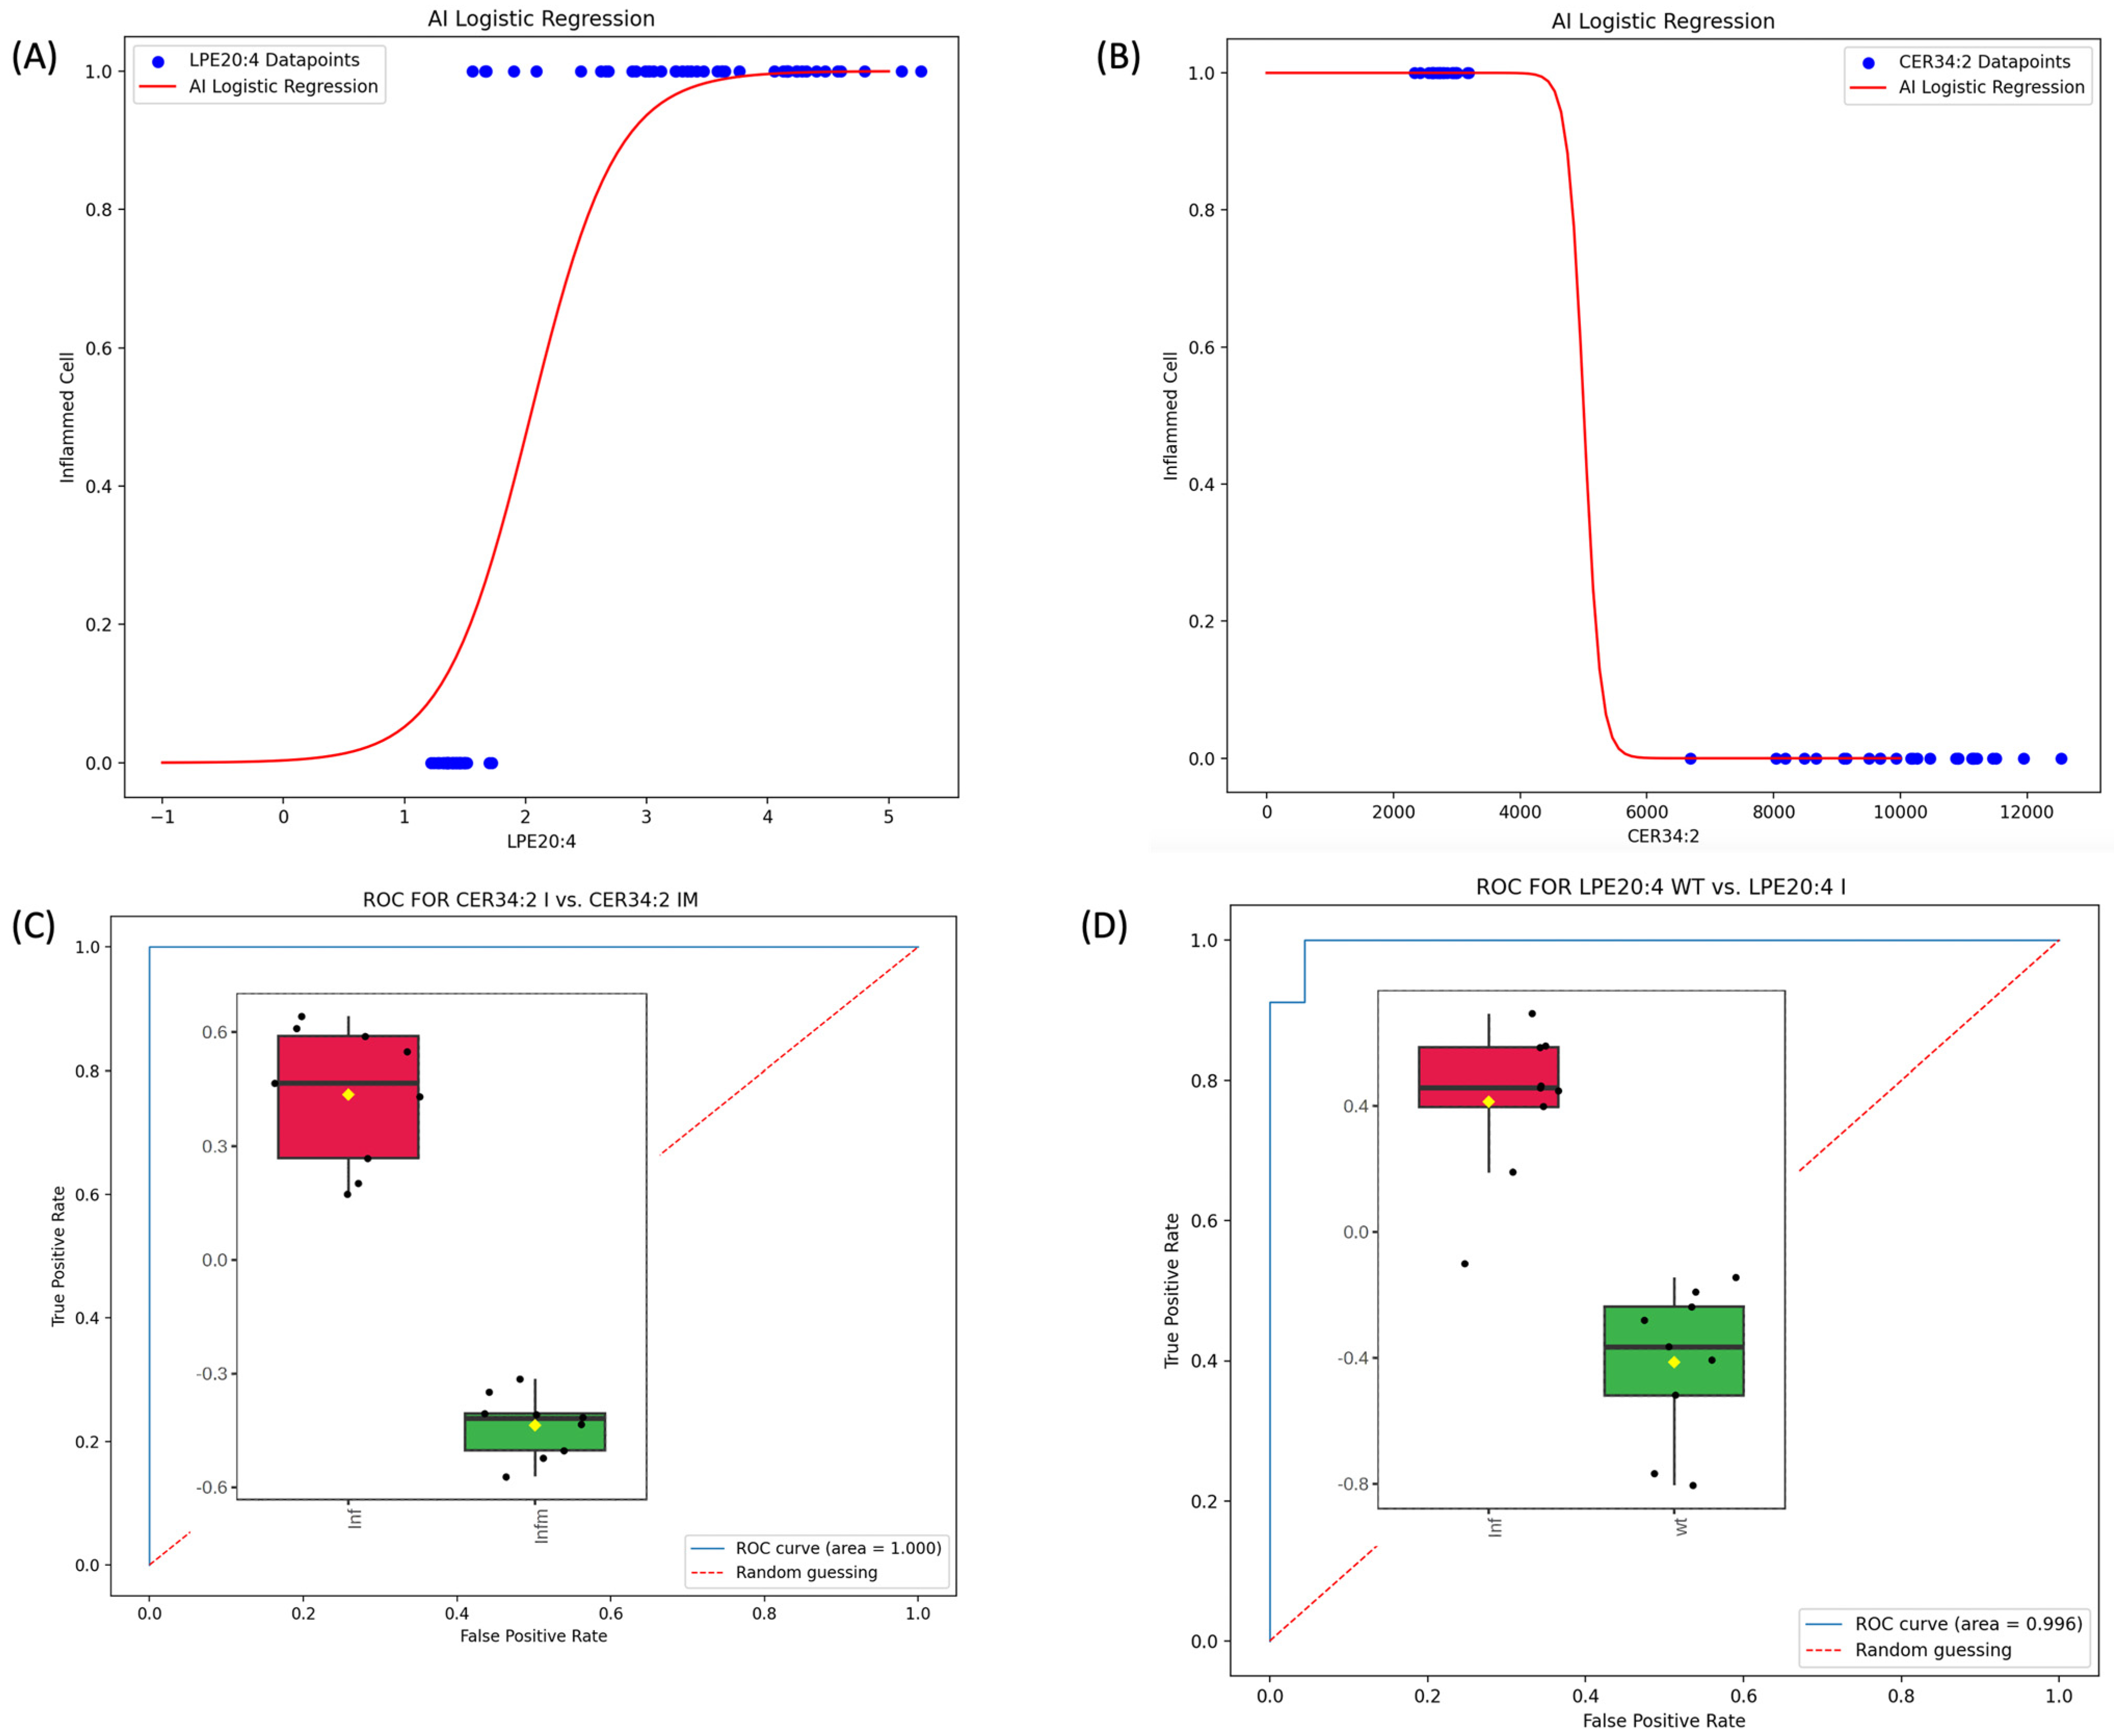
3.4. Construction of ML Diagnostic Model for Inf vs. Wt and Inf_TAP vs. Inf

To corroborate the quantitative LC-MS/MS data, the ML algorithm was applied to the lipid dataset. Two of the most relevant upregulated and downregulated lipids detected based on their VIP scores (i.e., LPE 20:4 and Cer 34:2|Cer 18:2;2O/16:0) on inflamed and inflamed plus treatment conditions (Figure 1B and Figure 2B) were selected to exemplify the potentiality of an ML-based approach. Researchers can extend and apply this approach to other lipids that are of interest and relevant according to the VIP scores and hierarchical clustering. Using the Monte Carlo method, a simulation for LPE 20:4 and Cer34:2 was performed to generate a dataset of 189 and 54, respectively. The dimension of each dataset was calculated by applying the formula reported in Section 2. The output datasets were used as input to train an ML algorithm based on regression to construct diagnostic models that are able to distinguish between inflamed, inflamed treated, and wild-type cells. The ROC approach tested the quality of the ML regression models to validate their accuracy (see Figure 3).
In general, the relation between two variables reflected by a statistical model takes the form of a mathematical equation (or equations) with the predicted value (response) on one side and the predictors on the other side. Linear regression models are widely accepted as an efficient way to predict responses when their relation to the predictors is linear. An alternative approach to model non-linear relations is logistic regression [17], where the predicted value is never above 1 or below 0. Univariate logistic regression models can be represented by the sigmoid equation:
p = 1 1 + e ( b 0 + b 1 x )
where p is the probability that the predicted response is 1, b1 is the slope of the line, and b0 is the intercept.
As depicted in Figure 3, the value of the lipids LPE20:4 and Cer34:2 have predictive power in detecting inflammation and inflammation reduction after treatment, respectively. This conclusion is supported by the very high scores of the AUC (0.996 (Figure 3C) and 1.000 (Figure 3D)) in our Monte Carlo simulated testing environment.

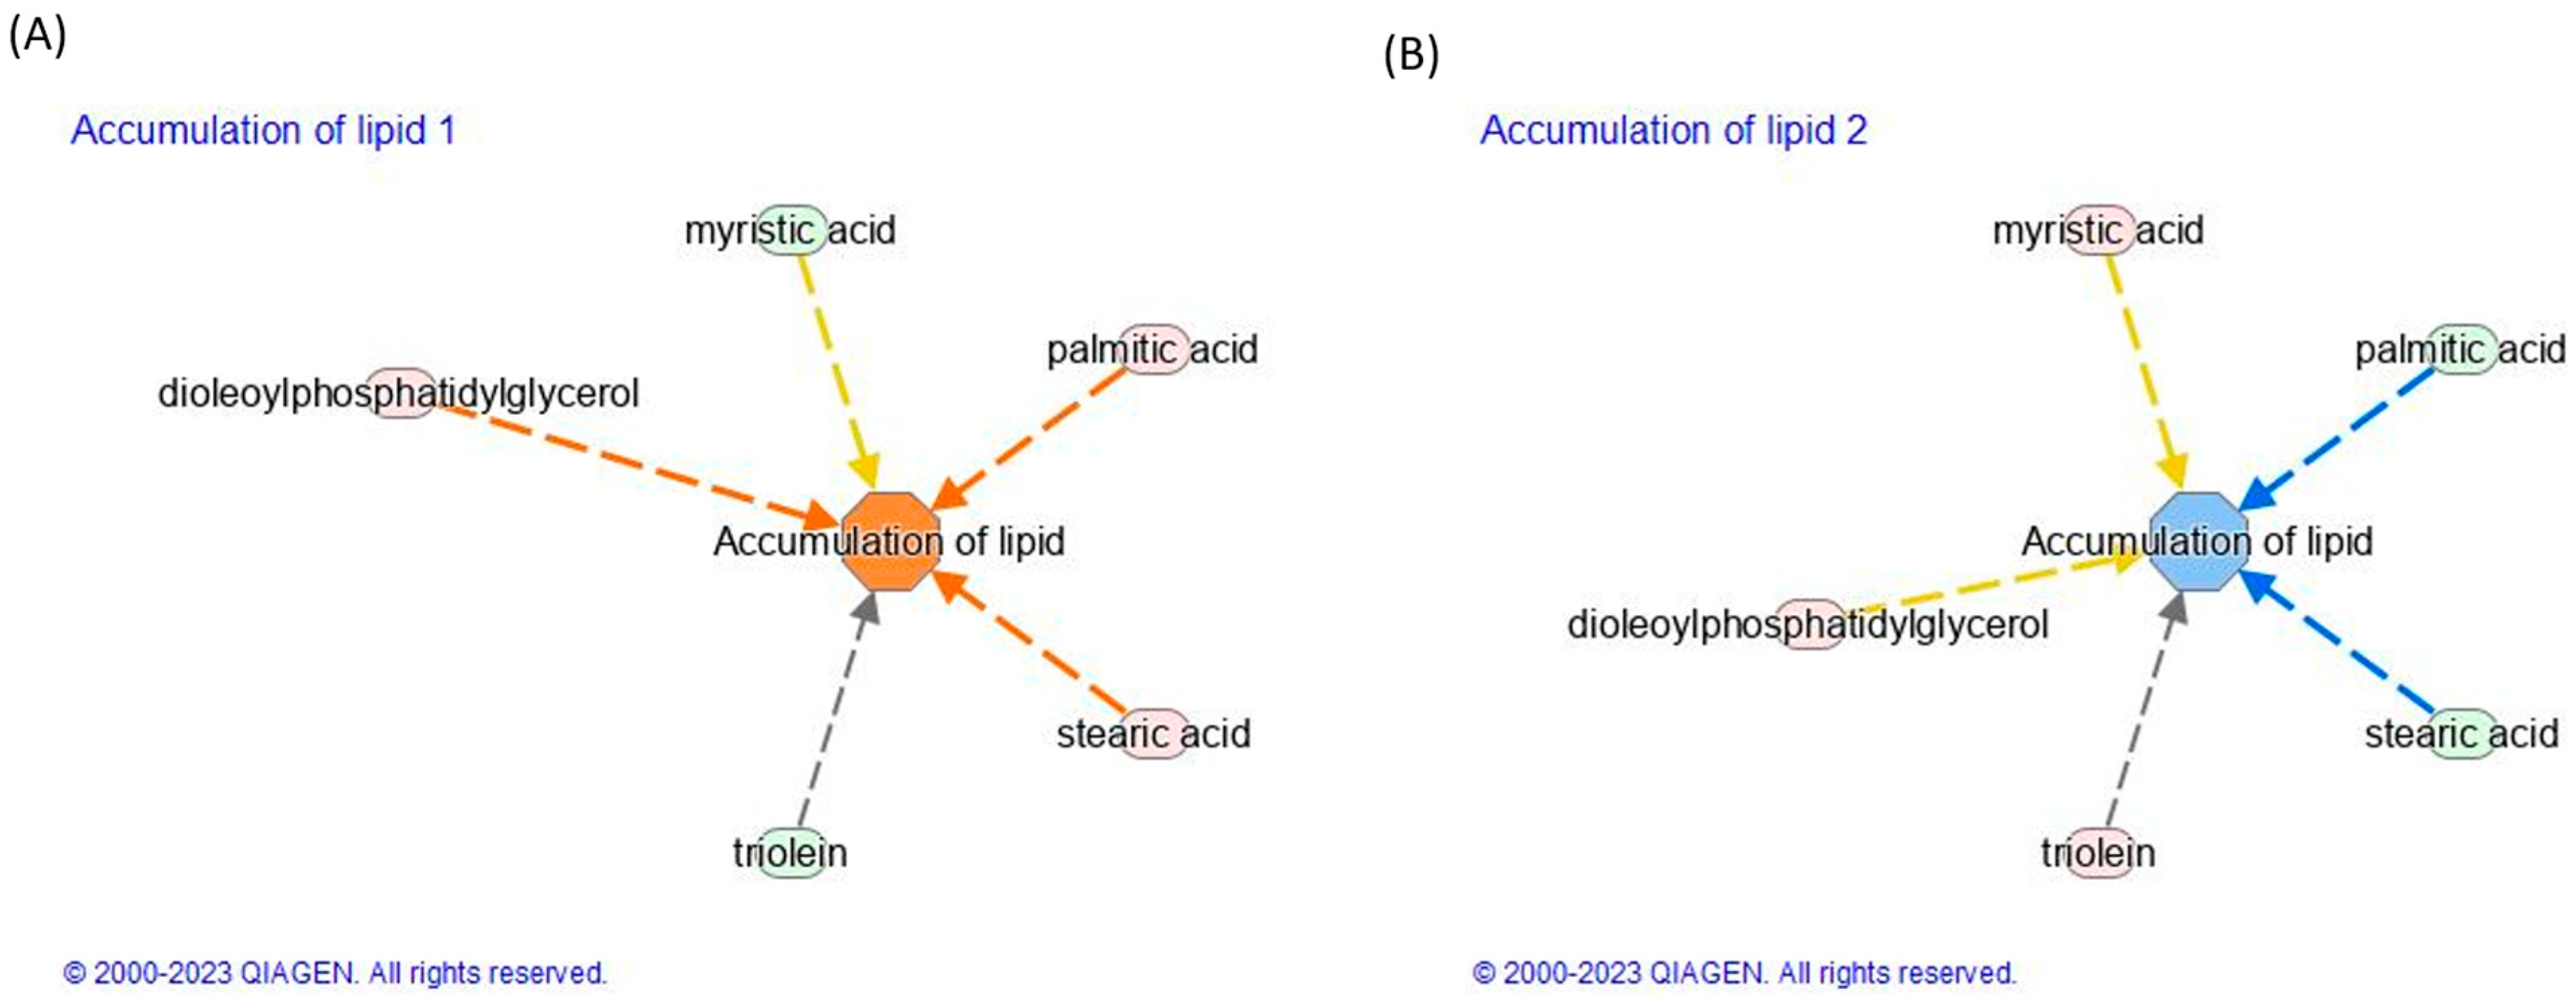
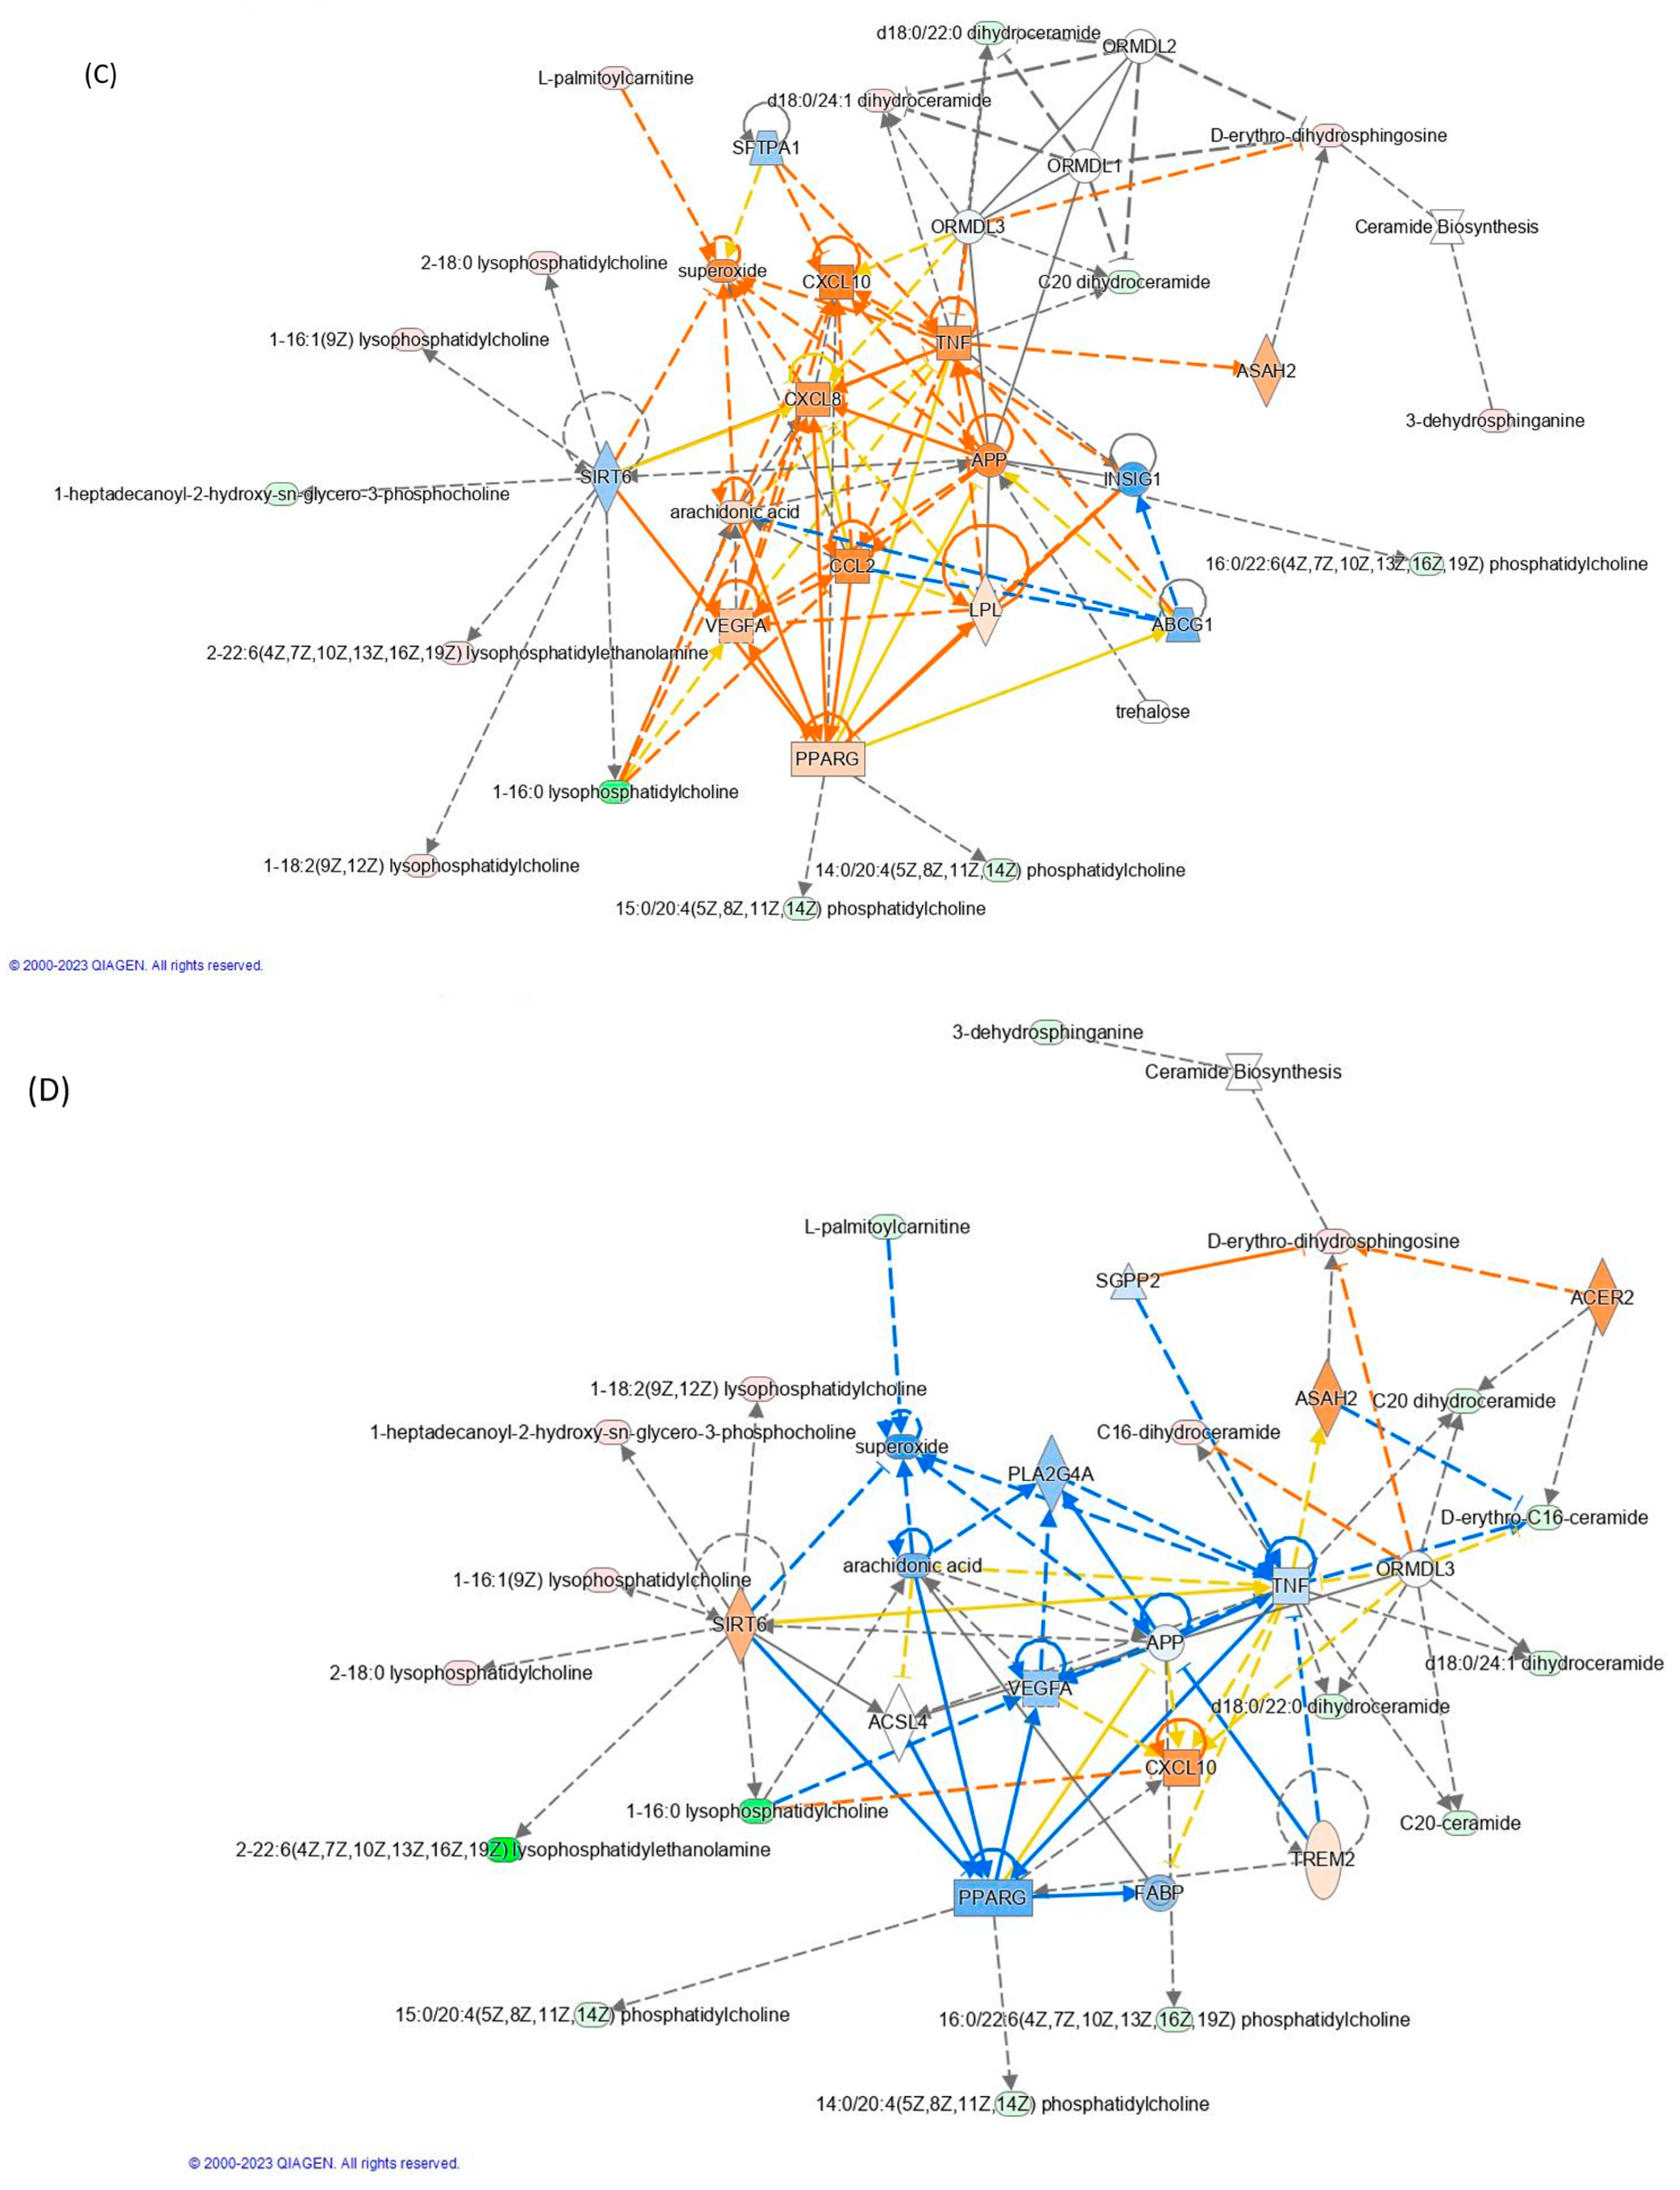
3.5. Effect of TNF-α and TAPs on Signaling Pathway Modulation by Network Analysis

To investigate the molecular pathways in which the identified lipids were involved, the network analysis was performed by IPA. The TNF-α induced inflammation by increasing lipid accumulation, as indicated by a z-score of 1.23. Subsequently, treatment with polyphenols from thinned young apples (TAPs) significantly reduced lipid accumulation, with a corresponding z-score of −0.54. The details are presented in Figure 4A,B and Table 3.
The accumulation of lipids, particularly saturated fatty acids, has been implicated in the development and progression of inflammation. When cells are exposed to high levels of lipids, particularly saturated fatty acids like palmitic acid, metabolic stress and dysfunction, known as lipotoxicity, occur. Lipotoxicity can trigger a cascade of events that promote inflammation. Moreover, saturated fatty acids like palmitic acid can activate Toll-like receptors (TLRs) on immune cells, which can trigger the production of pro-inflammatory cytokines and chemokines. This can lead to the recruitment and activation of additional immune cells, exacerbating the inflammatory response. Palmitic (FA 16:0) and stearic acid (FA 18:0) have been implicated in the activation of lipid accumulation upon TNF-α-induced inflammation (Figure 4A). Conversely, the effect of TAPs reduces the levels of FA16:0 (Log2ratio = −0.27) and FA 18:0 (Log2ratio = −0.23), leading to a positive reduction in lipid accumulation (see Figure 4B and Table S1C).
TNF-α induced the activation of some interleukins such as CXCL8 (IL-8) and CXCL10 (Figure 4C). Both act as a chemoattractant for immune cells, particularly T cells, at sites of inflammation. Additionally, CXCL10 can enhance the activation of immune cells and promote the production of other inflammatory cytokines [38]. Concurrently, the activation of the arachidonic acid (ARA) and vascular endothelial growth factor A (VEGFA) pathways triggers the synthesis of potent pro-inflammatory mediators like prostaglandins, leukotrienes, and thromboxanes. The initiation of both ARA and VEGFA pathways is mediated by LPC 16:0 (log2ratio = −10.4), initiating a signaling cascade that promotes the proliferation, migration, and survival of endothelial cells. Specifically, LPC 16:0 is a type of lysophospholipid that has been implicated in the regulation of angiogenesis and inflammation. Several studies have shown that LPC can stimulate the expression and activity of VEGFR2 in endothelial cells, leading to the activation of downstream signaling pathways and the promotion of angiogenesis. Our findings highlighted a negative regulation of LPC 16:0 (log2ratio = −19.6) mediated by TAPs, which induce the downregulation of the VEGFA pathway (Figure 4D). Nonetheless, further research is warranted to fully elucidate the molecular mechanisms governing the interactions between LPC and VEGFA signaling in angiogenesis regulation.
In addition to LPC, L-palmitoylcarnitine (CAR 16:0, log2ratio = 0.75) notably prompted the upregulation of superoxide in TNF-α treated cells, while CAR 16:00 levels decreased upon TAP treatment (log2ratio = −1.29), resulting in a reduction in superoxide. Given that superoxide plays a pivotal role in inflammation by contributing to tissue damage and fostering the production of pro-inflammatory molecules, its inhibition through TAP action represents a promising strategy for mitigating inflammation. Overall, both LPC 16:0 and CAR 16:0 emerge as potential mediators of inflammation, capable of inducing vasodilation, increasing vascular permeability, facilitating immune cell migration to the inflammation site, and bolstering the production of other inflammatory mediators.

4. Conclusions

In summary, the integration of untargeted lipidomics with AI and ML techniques offers a precise, cost-effective, and time-efficient method for detecting changes in lipid-related patterns, particularly in describing inflammation. Our finding underlines that: (i) under induced inflammation, the most altered lipid classes were mainly PCs, LPCs, LPEs (upregulated), and PSs (downregulated) and that (ii) ceramides were mainly modulated by polyphenol treatment, which leads to a reduction in the accumulation of intracellular lipids. Moreover, the integration of omics, such as lipidomics, with AI and ML serves as a crucial strategy to identify accurate and robust lipid signatures of diseases primarily driven by inflammation. The example designed, implemented, and validated for LPE 20:4 and Cer 34:2 demonstrated that ML univariate logistic regressions result in powerful models that are able to efficaciously predict cells’ conditions (such as inflamed and inflamed followed by polyphenol treatment) simply by observing the levels of lipids under analysis. However, the investigated lipid signature necessitates further validation, particularly across large-scale patient cohorts characterized by molecular and clinical heterogeneities. Our results highlight the value of integrating lipidomics with Machine Learning algorithms to explore the pathophysiology of inflammation and, consequently, improve clinical lipid signature identification. The proposed analytical and data integration can aid in personalized medicine by identifying lipidomic signatures associated with specific diseases or therapeutic interventions, thus facilitating the translational passage in routine clinical practices after the validation of the model’s performance on an external dataset to assess its generalizability. Achieving this objective requires close collaboration among biochemists and clinicians, leveraging diverse skills within a multidisciplinary collaborative team.

Supplementary Materials

The following supporting information can be downloaded at: https://www.mdpi.com/article/10.3390/cosmetics11040140/s1. Table S1. List of quantified lipids obtained by MSDAIAL software (ver. 4.90) after manual curations.

Author Contributions

Conceptualization, M.C., A.D., G.A. (Giancarlo Aldini) and D.T.; methodology, G.A. (Gilda Aiello) and A.D.; formal analysis, G.A. (Gilda Aiello), A.D. and D.T.; resources, M.C. and G.A (Giancarlo Aldini); data curation, G.A. (Gilda Aiello), D.T. and A.D.; and writing—original draft preparation and review, all authors. All authors have read and agreed to the published version of the manuscript.

Funding

This research received no external funding.

Data Availability Statement

Upon request.

Acknowledgments

We acknowledge UNITECH OMICs, the mass spectrometry platform of Università degli Studi di Milano, for running mass spectrometry analyses.

Conflicts of Interest

The authors declare no conflicts of interest.

References

  1. Barcia, A.M.; Harris, H.W. Triglyceride-rich lipoproteins as agents of innate immunity. Clin. Infect. Dis. 2005, 41, S498–S503. [Google Scholar] [CrossRef]
  2. Khovidhunkit, W.; Kim, M.S.; Memon, R.A.; Shigenaga, J.K.; Moser, A.H.; Feingold, K.R.; Grunfeld, C. Effects of infection and inflammation on lipid and lipoprotein metabolism: Mechanisms and consequences to the host. J. Lipid Res. 2004, 45, 1169–1196. [Google Scholar] [CrossRef]
  3. Doyle, R.; Sadlier, D.M.; Godson, C. Pro-resolving lipid mediators: Agents of anti-ageing? Semin. Immunol. 2018, 40, 36–48. [Google Scholar] [CrossRef] [PubMed]
  4. Sen, P.; Lamichhane, S.; Mathema, V.B.; McGlinchey, A.; Dickens, A.M.; Khoomrung, S.; Oresic, M. Deep learning meets metabolomics: A methodological perspective. Brief. Bioinform. 2021, 22, 1531–1542. [Google Scholar] [CrossRef]
  5. Tosi, D.; Campi, A. How Data Analytics and Big Data Can Help Scientists in Managing COVID-19 Diffusion: Modeling Study to Predict the COVID-19 Diffusion in Italy and the Lombardy Region. J. Med. Internet Res. 2020, 22, e21081. [Google Scholar] [CrossRef]
  6. Jin, Y.N.; Arroo, R. The protective effects of flavonoids and carotenoids against diabetic complications-A review of in vivo evidence. Front. Nutr. 2023, 10, 1020950. [Google Scholar] [CrossRef] [PubMed]
  7. Ferrario, G.; Baron, G.; Gado, F.; Della Vedova, L.; Bombardelli, E.; Carini, M.; D’Amato, A.; Aldini, G.; Altomare, A. Polyphenols from Thinned Young Apples: HPLC-HRMS Profile and Evaluation of Their Anti-Oxidant and Anti-Inflammatory Activities by Proteomic Studies. Antioxidants 2022, 11, 1577. [Google Scholar] [CrossRef] [PubMed]
  8. Dei Cas, M.; Ghidoni, R. Cancer Prevention and Therapy with Polyphenols: Sphingolipid-Mediated Mechanisms. Nutrients 2018, 10, 940. [Google Scholar] [CrossRef]
  9. Ma, J.; Zheng, Y.M.; Tang, W.J.; Yan, W.X.; Nie, H.F.; Fang, J.; Liu, G. Dietary polyphenols in lipid metabolism: A role of gut microbiome. Anim. Nutr. 2020, 6, 404–409. [Google Scholar] [CrossRef]
  10. Rahn, C.; Bakuradze, T.; Stegmuller, S.; Galan, J.; Niesen, S.; Winterhalter, P.; Richling, E. Polyphenol-Rich Beverage Consumption Affecting Parameters of the Lipid Metabolism in Healthy Subjects. Int. J. Mol. Sci. 2023, 24, 841. [Google Scholar] [CrossRef]
  11. Baron, G.; Altomare, A.; Mol, M.; Garcia, J.L.; Correa, C.; Raucci, A.; Mancinelli, L.; Mazzotta, S.; Fumagalli, L.; Trunfio, G.; et al. Analytical Profile and Antioxidant and Anti-Inflammatory Activities of the Enriched Polyphenol Fractions Isolated from Bergamot Fruit and Leave. Antioxidants 2021, 10, 141. [Google Scholar] [CrossRef]
  12. Matyash, V.; Liebisch, G.; Kurzchalia, T.V.; Shevchenko, A.; Schwudke, D. Lipid extraction by methyl-tert-butyl ether for high-throughput lipidomics. J. Lipid Res. 2008, 49, 1137–1146. [Google Scholar] [CrossRef] [PubMed]
  13. Tsugawa, H.; Cajka, T.; Kind, T.; Ma, Y.; Higgins, B.; Ikeda, K.; Kanazawa, M.; VanderGheynst, J.; Fiehn, O.; Arita, M. MS-DIAL: Data-independent MS/MS deconvolution for comprehensive metabolome analysis. Nat. Methods 2015, 12, 523–526. [Google Scholar] [CrossRef] [PubMed]
  14. Chong, J.; Wishart, D.S.; Xia, J. Using MetaboAnalyst 4.0 for Comprehensive and Integrative Metabolomics Data Analysis. Curr. Protoc. Bioinform. 2019, 68, e86. [Google Scholar] [CrossRef]
  15. Xia, J.G.; Psychogios, N.; Young, N.; Wishart, D.S. MetaboAnalyst: A web server for metabolomic data analysis and interpretation. Nucleic Acids Res. 2009, 37, W652–W660. [Google Scholar] [CrossRef]
  16. Zweig, M.H.; Campbell, G. Receiver-Operating Characteristic (Roc) Plots—A Fundamental Evaluation Tool in Clinical Medicine. Clin. Chem. 1993, 39, 561–577. [Google Scholar] [CrossRef]
  17. Dominguez-Almendros, S.; Benitez-Parejo, N.; Gonzalez-Ramirez, A.R. Logistic Regression Models. Allergol. Immunopathol. 2011, 39, 295–305. [Google Scholar] [CrossRef]
  18. Shimizu, T. Lipid Mediators in Health and Disease: Enzymes and Receptors as Therapeutic Targets for the Regulation of Immunity and Inflammation. Annu. Rev. Pharmacol. Toxicol. 2009, 49, 123–150. [Google Scholar] [CrossRef]
  19. Chang, M.C.; Lee, J.J.; Chen, Y.J.; Lin, S.I.; Lin, L.D.; Liou, E.J.W.; Huang, W.L.; Chan, C.P.; Huang, C.C.; Jeng, J.H. Lysophosphatidylcholine induces cytotoxicity/apoptosis and IL-8 production of human endothelial cells: Related mechanisms. Oncotarget 2017, 8, 106177–106189. [Google Scholar] [CrossRef] [PubMed]
  20. Brkic, L.; Riederer, M.; Graier, W.F.; Malli, R.; Frank, S. Acyl chain-dependent effect of lysophosphatidylcholine on cyclooxygenase (COX)-2 expression in endothelial cells. Atherosclerosis 2012, 224, 348–354. [Google Scholar] [CrossRef]
  21. Liu, P.P.; Zhu, W.; Chen, C.; Yan, B.; Zhu, L.; Chen, X.; Peng, C. The mechanisms of lysophosphatidylcholine in the development of diseases. Life Sci. 2020, 247, 117443. [Google Scholar] [CrossRef]
  22. Joffre, C.; Rey, C.; Laye, S. N-3 Polyunsaturated Fatty Acids and the Resolution of Neuroinflammation. Front. Pharmacol. 2019, 10, 1022. [Google Scholar] [CrossRef] [PubMed]
  23. Serhan, C.N.; Chiang, N.; Van Dyke, T.E. Resolving inflammation: Dual anti-inflammatory and pro-resolution lipid mediators. Nat. Rev. Immunol. 2008, 8, 349–361. [Google Scholar] [CrossRef] [PubMed]
  24. Scott, R.S.; McMahon, E.J.; Pop, S.M.; Reap, E.A.; Caricchio, R.; Cohen, P.L.; Earp, H.S.; Matsushima, G.K. Phagocytosis and clearance of apoptotic cells is mediated by MER. Nature 2001, 411, 207–211. [Google Scholar] [CrossRef] [PubMed]
  25. Hannun, Y.A.; Obeid, L.M. Principles of bioactive lipid signalling: Lessons from sphingolipids. Nat. Rev. Mol. Cell Biol. 2008, 9, 139–150. [Google Scholar] [CrossRef] [PubMed]
  26. Gomez-Munoz, A.; Presa, N.; Gomez-Larrauri, A.; Rivera, I.G.; Trueba, M.; Ordonez, M. Control of inflammatory responses by ceramide, sphingosine 1-phosphate and ceramide 1-phosphate. Prog. Lipid Res. 2016, 61, 51–62. [Google Scholar] [CrossRef] [PubMed]
  27. Serna, I.M.R.; Sitina, M.; Stokin, G.B.; Medina-Inojosa, J.R.; Lopez-Jimenez, F.; Gonzalez-Rivas, J.P.; Vinciguerra, M. Lipidomic Profiling Identifies Signatures of Poor Cardiovascular Health. Metabolites 2021, 11, 747. [Google Scholar] [CrossRef] [PubMed]
  28. Li, Q.; Wang, X.; Pang, J.; Zhang, Y.; Zhang, H.Y.; Xu, Z.L.; Chen, Q.; Ling, W.H. Associations between plasma ceramides and mortality in patients with coronary artery disease. Atherosclerosis 2020, 314, 77–83. [Google Scholar] [CrossRef] [PubMed]
  29. Laaksonen, R.; Ekroos, K.; Sysi-Aho, M.; Hilvo, M.; Vihervaara, T.; Kauhanen, D.; Suoniemi, M.; Hurme, R.; März, W.; Scharnagl, H.; et al. Plasma ceramides predict cardiovascular death in patients with stable coronary artery disease and acute coronary syndromes beyond LDL-cholesterol. Eur. Heart J. 2016, 37, 1967–1976. [Google Scholar] [CrossRef]
  30. Scheiblich, H.; Schlutter, A.; Golenbock, D.T.; Latz, E.; Martinez-Martinez, P.; Heneka, M.T. Activation of the NLRP3 inflammasome in microglia: The role of ceramide. J. Neurochem. 2017, 143, 534–550. [Google Scholar] [CrossRef]
  31. Field, B.C.; Gordillo, R.; Scherer, P.E. The Role of Ceramides in Diabetes and Cardiovascular Disease Regulation of Ceramides by Adipokines. Front. Endocrinol. 2020, 11, 569250. [Google Scholar] [CrossRef] [PubMed]
  32. Havulinna, A.S.; Sysi-Aho, M.; Hilvo, M.; Kauhanen, D.; Hurme, R.; Ekroos, K.; Salomaa, V.; Laaksonen, R. Circulating Ceramides Predict Cardiovascular Outcomes in the Population-Based FINRISK 2002 Cohort. Arterioscler. Thromb. Vasc. Biol. 2016, 36, 2424–2430. [Google Scholar] [CrossRef]
  33. Gaggini, M.; Ndreu, R.; Michelucci, E.; Rocchiccioli, S.; Vassalle, C. Ceramides as Mediators of Oxidative Stress and Inflammation in Cardiometabolic Disease. Int. J. Mol. Sci. 2022, 23, 2719. [Google Scholar] [CrossRef] [PubMed]
  34. Fretts, A.M.; Jensen, P.N.; Hoofnagle, A.N.; McKnight, B.; Howard, B.V.; Umans, J.; Sitlani, C.M.; Siscovick, D.S.; King, I.B.; Djousse, L.; et al. Plasma ceramides containing saturated fatty acids are associated with risk of type 2 diabetes. J. Lipid Res. 2021, 62, 100119. [Google Scholar] [CrossRef] [PubMed]
  35. Kim, H.S.; Quon, M.J.; Kim, J.A. New insights into the mechanisms of polyphenols beyond antioxidant properties; lessons from the green tea polyphenol, epigallocatechin 3-gallate. Redox Biol. 2014, 2, 187–195. [Google Scholar] [CrossRef] [PubMed]
  36. Tveter, K.M.; Villa-Rodriguez, J.A.; Cabales, A.J.; Zhang, L.; Bawagan, F.G.; Duran, R.M.; Roopchand, D.E. Polyphenol-induced improvements in glucose metabolism are associated with bile acid signaling to intestinal farnesoid X receptor. BMJ Open Diabetes Res. Care 2020, 8, e001386. [Google Scholar] [CrossRef] [PubMed]
  37. Rodriguez-Morato, J.; Boronat, A.; Serreli, G.; Enriquez, L.; Gomez-Gomez, A.; Pozo, O.J.; Fito, M.; de la Torre, R. Effects of Wine and Tyrosol on the Lipid Metabolic Profile of Subjects at Risk of Cardiovascular Disease: Potential Cardioprotective Role of Ceramides. Antioxidants 2021, 10, 1679. [Google Scholar] [CrossRef]
  38. Karin, N.; Razon, H. Chemokines beyond chemo-attraction: CXCL10 and its significant role in cancer and autoimmunity. Cytokine 2018, 109, 24–28. [Google Scholar] [CrossRef]
Figure 1. (A) 2D scores plots reconstructed using PLS-DA. The green group corresponds to the control samples (Wt), and the red group corresponds to cells treated with TNF-α. (B) Volcano plot of Inf vs. Wt. The features in red were significantly upregulated (fold change (FC) > 1.5, adjusted p-value < 0.05), and the features in blue were significantly downregulated (fold change (FC) < 1.5, adjusted p-value < 0.05). (C) Two-sample t-tests and Wilcoxon rank-sum tests (p-value < 0.05). (D) List of VIP scores obtained from the PLS-DA analysis of Inf vs. Wt.
Cosmetics 11 00140 g001
Figure 2. (A) 2D scores plots reconstructed using PLS-DA. The red group corresponds to Inf samples, and the green corresponds to those treated with TAPs. (B) Volcano plot of Inf_TAP vs. Inf. Features significantly upregulated with a fold change (FC) > 1.5 and adjusted p-value < 0.05 are shown in red, while those significantly downregulated with an FC < 1.5 and adjusted p-value < 0.05 are shown in blue. (C) Hierarchical clustering heatmaps of the 25 most significant altered lipids (one-way ANOVA and post-hoc analysis, p < 0.05) of Inf_TAP and Inf. More expressed lipids are indicated in red, with intensity values represented by colored cells (red for higher expression and dark blue for lower expression); the samples are shown in the rows, and the features are shown in the columns. (D) List of VIP scores obtained from the PLS-DA analysis of Inf_TAP vs. Inf.
Cosmetics 11 00140 g002
Figure 3. (A) ML logistic regression model for lipid LPE 20:4 for wild-type and inflamed cells. (B) ML logistic regression model for Cer34:2 (Cer(d18:2/16:0)) for inflamed and treated TAP cells. (C) ROC curve for LPE 20:4 and the associated AUC score obtained by testing the regression model in classifying cells by simply observing the value of LPE 20:4. (D) ROC curve for Cer 34:2 (Cer 18:2;2O/16:0) and the associated AUC score obtained by testing the regression model in classifying cells by simply observing the value of Cer 34:2.
Cosmetics 11 00140 g003
Figure 4. Modulation of lipid accumulation in (A) inflamed vs. control and (B) inflamed_TAP vs. inflamed. Network analysis by the IPA of (C) inflamed vs. control and (D) inflamed_TAP vs. inflamed. The orange and blue colors of the central hub indicate an upregulation and a downregulation of the module, respectively. The orange line represents activation, the blue line represents deactivation, the yellow line represents findings inconsistent with the state of the downstream molecule, and the grey line represents the effect that is not predicted. (For the interpretation of the references to color in this figure legend, refer to the Web version).
Cosmetics 11 00140 g004aCosmetics 11 00140 g004b
Table 1. Total lipids identified at the bulk and structure levels divided by classes. CAR = carnitine, CE = cholesterol ester, Cer = ceramide, HexCer = hexosylceramide, CL = cardiolipid, NAE = N-acylethanolamine, MG = monoacylglycerol, SPB = sphinganine, ST = sterol lipid, LPI = lyso-phosphatidylinositol, LPS = lipopolysaccharides, SM = sphingomyelin, TG = triacylglycerol, DG = diacylglycerol, PC = phosphatidylcholine, LPC = lyso-phosphatidylcholine, PE = phosphatidylethanolamine; LPE = lyso-phosphatidylethanolamine; PI = phosphatidylinositol; PG = phosphatidylglycerol; and PS = phosphatidylserine.
Number of
Lipids
% Number of
Lipids
%
Identified Features in MS-DIAL469Identified Features in MS-DIAL
PC9420.2
PE9620.2LPE102.0
SM4710.1HexCer91.8
PI286.9CAR30.6
Cer36.3CE30.6
PG265.3NAE51.0
PS245.1MG20.4
DG184.5ST20.4
FA214.3SPB20.4
TG193.8LPG10.2
CL163.2LPI10.2
LPC102.2LPS10.2
Table 3. Functional modules evoked by TNF-α and TAP exposure. A positive z-score indicates the activation pathway, and a negative z-score indicates the downregulation of the pathway (the analysis was performed by IPA (Qiagen) using the quantitative LFQ dataset).
Inf vs. WtInf_TAP vs. Inf
Canonical Pathwayp-Valuez-Scorep-Valuez-Score
Accumulation of lipids4.23 × 10−31.234.23 × 10−3−0.54
Inf vs. WtInf_TAP vs. Inf
Lipid nomenclatureLog2RatioLog2Ratio
FA 14:0 (myristic acid)−5.9 × 10−14.2 × 10−1
TG 54:3|TG 18:1_18:1_18:1 (triolein)−6.0 × 10−37.0 × 10−2
FA 16:0 (palmitic acid)9.0 × 10⁻³−2.7 × 10⁻¹
FA 18:0 (stearic acid)1.5 × 10⁻²−2.3 × 10⁻¹
Disclaimer/Publisher’s Note: The statements, opinions and data contained in all publications are solely those of the individual author(s) and contributor(s) and not of MDPI and/or the editor(s). MDPI and/or the editor(s) disclaim responsibility for any injury to people or property resulting from any ideas, methods, instructions or products referred to in the content.

