Abstract
Non-invasive, in vivo assessment of target substances penetration into the skin remains a significant challenge in dermatology and cosmetology. While various optical methods have been employed for this purpose, each has inherent limitations. Here, we present a novel non-invasive imaging approach using optical coherence elastography (OCE) to simultaneously determine the penetration depth of topically applied osmotically active substances in biological objects and associated water content changes with high sensitivity. Most substances are osmotically active and generate osmotic pressure proportional to their concentration, inducing deformations in biological objects. These osmotic strains can be visualized similarly to mechanical or thermal strains. Using OCE, we evaluated penetration and dehydration depth profiles in polyacrylamide gel phantoms, ex vivo cartilage, and porcine ear skin samples treated with aqueous glycerol solutions of varying concentrations. Additionally, the penetration and effect of jojoba oil were assessed in treated skin samples. The results are consistent with those obtained by other established methods, confirming the reliability and applicability of OCE. This technique offers unique capabilities not achievable with other optical methods, making it a valuable complementary tool for non-invasive studies. It holds significant promise for advancing both research and clinical applications in dermatology and cosmetology, including its potential translation to in vivo assessments.
1. Introduction
Delivering active pharmaceutical ingredients and functional cosmetic ingredients into the skin is a complex challenge in dermatology, cosmetology, and pharmacy. It requires a sophisticated understanding of the skin barrier structure [1], presumably provided by the stratum corneum [2] and stratum granulosum [3] epidermal layers. Most therapeutic drugs are specifically developed to permeate the stratum corneum or the entire epidermis to reach targets in the viable epidermis or dermis, while cosmetics are allowed to be deposited in the stratum corneum only [4,5]. Thus, the determination of the penetration depth and the effect of topically applied substances in the skin is of high importance. The existing techniques generally include invasive, low-invasive, and non-invasive methods. An important advantage of non-destructive, label-free, and rapid imaging techniques is obvious and lies in their ability to preserve tissue integrity while providing real-time, high-resolution, and substance-specific information. These methods encompass a broad range of optical imaging and spectroscopic modalities, including fluorescence and reflectance confocal laser scanning microscopy; two-photon tomography integrated with autofluorescence, fluorescence lifetime imaging, second-harmonic generation, coherent anti-Stokes Raman scattering, and reflectance confocal microscopy; three-photon tomography; and optical coherence tomography (OCT). Additionally, advanced Raman-based techniques such as confocal Raman micro-spectroscopy, surface-enhanced Raman scattering micro-spectroscopy, and stimulated Raman scattering microscopy are included. A comprehensive review of all optical methods employed to assess the penetration depth and the effect of topically applied substances in the skin is provided in [6]. Additionally, penetrating substances may exhibit selective absorption of light at specific wavelengths, allowing their detection via the photoacoustic effect [7,8].
The key strengths of the OCT method include non-invasiveness, rapid image acquisition (typically <1 s), deep tissue imaging (1–2 mm), and the ability to produce high-contrast and high-resolution images of skin structures and particulate formulations in the micrometer range [9,10]. However, for glucose, propylene glycol, and glycerol solutions, which cause severe skin dehydration and act as penetration enhancers [11] and optical clearing agents [12], it has been reported that OCT is capable of determining their penetration depth into the skin in vivo [13,14]. The monitoring of glucose diffusion in the sclera with OCT has also been reported [15]. Despite these strengths, OCT also presents notable limitations: the ability to visualize non-particulate substances is difficult, and its spatial resolution and optical contrast are generally sufficient only for the detection of particle agglomerates [16], which restricts its applicability in the assessment of uniform or molecular-level diffusion processes in cosmetics. For effective visualization of the penetration with OCT, the particulate substances must exhibit optical absorption and scattering properties distinct from those of the surrounding skin—this is an essential requirement for generating adequate contrast OCT images [6].
Optical coherence elastography (OCE) is a non-invasive and real-time imaging technique that combines dual information of structural imaging from OCT with biomechanical data of elastography and serves as an extended OCT method. OCE uses interferometric detection of the OCT to capture detailed structural high-resolution cross-sectional images of biological objects and evaluates their mechanical properties, such as stiffness and elasticity, by detecting deformations under applied forces. By comparing the phase of the reflected light before and after a mechanical excitation, OCE detects tiny displacements within biological objects on the order of nanometers [17]. The application of deep-learning methods and noise reduction can enhance the sensitivity of OCE [18,19,20], while the application of line-field screening reduces the screening time [21,22]. This phase sensitivity is key for quantifying mechanical changes and serves as the basis of the OCE method. The mechanical contrast among various morphological components or conditions of biological tissues visualized with OCE is, therefore, about an order of magnitude larger than the differences visible in structural OCT images [23]. These principles work together to allow non-invasive, high-resolution mapping of mechanical properties in biological objects.
OCE has been used in biomedical applications in the field of ophthalmology [24,25,26,27,28,29], oncology [30,31,32,33,34,35,36,37], cardiology [38,39,40,41,42,43], and dermatology [30,44,45]. An endoscope-based version of OCE has recently been reported [46,47,48]. The mechanical properties of skin are critical biomarkers in dermatology, reflecting both physiological and pathological changes. OCE enables non-invasive, quantitative, real-time, fast assessment of these properties with micrometer-scale resolution and millisecond-scale temporal response [30,49], aiding in the diagnosis and monitoring of various cutaneous conditions in various skin layers [50]. Its integration into clinical dermatology is advancing the capabilities of non-invasive diagnostics. OCE can help distinguish benign from malignant skin lesions by evaluating differences in tissue stiffness. Malignant lesions, such as basal cell carcinomas and melanomas, often exhibit altered mechanical properties compared to benign nevi, with increased stiffness due to abnormal cell proliferation and extracellular matrix remodeling [51]. Skin elasticity is anisotropic [52] and decreases with age and in the presence of scar tissue [53]. OCE has been used to monitor these changes by providing detailed maps of dermal stiffness, enabling quantification of age-related biomechanical alterations or scar maturation processes [54,55], as well as skin burn assessment [56,57]. In other diseases such as scleroderma and systemic sclerosis, pathological fibrosis leads to increased skin stiffness. OCE can detect these changes at early stages, offering a valuable tool for both diagnosis and longitudinal monitoring of treatment response [58]. Ability of the OCE method to distinguish lesion types, monitor aging or scarring, and assess fibrotic skin conditions supports its growing role in the early diagnosis and management of skin disorders [51,59,60].
The applied solutions interact with the biological objects, inducing deformation that depends on their osmotic concentration relative to the tissue—a hypertonic solution induces tissue dehydration and shrinkage, whereas a hypotonic solution promotes swelling due to osmotic water influx [61]. OCE has been utilized to study changes in the mechanical properties of tissues treated with various chemicals, including clearing agents and dehydrating or preserving solutions [62,63,64]. For instance, cartilage exposed to 20% glucose showed a gradual increase in Young’s modulus over 140 min, while higher concentrations (40% and 70%) led to a marked decrease in stiffness. During impregnation with a moderately concentrated glucose solution, a non-monotonic mechanical response was observed: an initial rise in the Young’s modulus was followed by a transient drop, then a gradual rise again [64]. Arteries treated with hyperosmotic propylene glycol (60% and 80%) exhibited increased stiffness and heterogeneous transverse deformation—shrinkage of the intima and adventitia with concurrent swelling of the media—although only steady-state strain was evaluated [62]. Additionally, corneal swelling and deswelling kinetics under 20% dextran treatment were shown in [63]. Taking the above-mentioned advantages into consideration, OCE is increasingly explored in cosmetology for assessing skin rejuvenation following cosmetic treatments like laser therapies, chemical peels, and anti-aging procedures [65,66]. Even though these measurements could provide insights for optimizing cosmetic/medical topical interventions and tracking treatment outcomes, OCE has never been used to determine the penetration depth into the skin and the effect of cosmetic/medical formulations on the skin.
This review summarizes the current state of the art in the application of OCE for assessing the penetration depth of topically applied substances in biological tissues and for evaluating their effects on tissue dehydration. The results show that real-time mapping of the penetration of topically applied formulations in the skin using OCE is a novel approach, which has been presented here for the first time.
2. Optical Coherence Elastography for the Visualization of Penetration in Biological Objects—Theoretical Aspects
OCE is a non-invasive imaging technique that combines some additional stimuli applied to the studied tissue with OCT to visualize the tissue response, which makes it possible to evaluate the mechanical properties of biological objects, such as stiffness and elasticity, by detecting deformations caused by the applied forces. Usually, the controlled external mechanical forces (mainly compression, mechanical tapping, air puffs, or acoustic waves) are applied non-destructively to induce small deformations. The method discussed here utilizes OCT-based spatially resolved visualization of axial strains in the biological objects. Such OCT-based visualization has been previously used for realization of compression OCE [67] in which the tissue is deformed by applied mechanical loading, as well as for visualization of thermally produced strains [68], deformation caused by tissue drying [69], or relaxational strains caused by internal mechanical stresses [70]. In this way, high-resolution depth-resolved mechanical contrast map images are generated fast and non-invasively, providing detailed anatomical information about the morphology of biological objects in real time, which is valuable for medical/cosmetic research and diagnostics.
The introduced OCE method [61,71] for visualization of penetration is based on the fact that the overwhelming majority of substances are osmotically active, with exception of the rather rare cases of isotonic solutions. Consequently, application of osmotically active formulations to the examined biological objects induces an osmotic pressure that is proportional to the concentration of the penetrating solution or substance. This osmotic pressure induces deformations (strains) which can be visualized similarly to the above-mentioned mechanically or thermally produced strains. In addition, under certain conditions, the difference in the concentration of free and weakly bound water in the biological object and applied solution may form a diffusional outflow of water [72] co-existing with the diffusional inflow of the penetrating substance. As will be demonstrated below, both diffusional flows may be simultaneously visualized based on the estimation of the accompanying osmotic strains.
The spatial distribution of concentration of a substance penetrating from the applied solution into a half-space is known to initially have a stepwise form. With increasing time, this stepwise profile gets smoother, and at first glance, it looks that there are no evident featured/landmark points, which could be conveniently tracked. However, the OCE method can visualize differential strains extracted from pair-wise comparison of subsequent OCT scans. This peculiar feature of the OCE makes it possible to select such landmark points and track their positions for both substance inflow and water outflow.
2.1. Physical Principles of Visualizing Diffusion Using OCE Imaging of Accompanying Strains
Since the interface between the tissue and the applied solution can be approximated by a plane, a simple 1D description of the penetration from one semi-space (the applied solution) to the other semi-space (tissue) with the boundary plane position may be considered and mathematically described by the diffusivity equation for concentration of the solution [61]:
where is the diffusivity coefficient. Assuming that the tissue is located at , the solution concentrations far from the interface can be described by boundary conditions and . Bearing in mind that such an equation may be used to describe both the penetrating agent inflow and the induced water outflow, one may consider that at the initial moment the concentrations of the diffusing substance in the contacting half-spaces are and . The corresponding solution can be described as follows [73]:
where is the error function. If we consider that the initial concentration of the penetrating agent (solute) in the solution is and its initial concentration in the tissue is zero, then for a certain , its normalized concentration near the tissue-solution interface—is schematically shown in Figure 1a. This panel schematically shows a smoothed stepwise profile of an agent penetrating into the tissue through the interface with the applied solution.
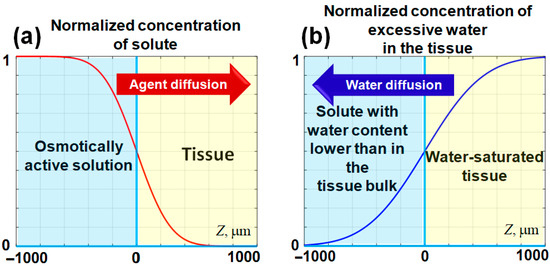
Figure 1.
Schematic representation of the evolution of diffusing agent concentrations near the interface located at . At the interface, the normalized concentration of the agent remains constant at , while the initial stepwise concentration profile gradually smooths over time. In panel (a), the penetration of the solute into the tissue bulk is depicted. Panel (b) illustrates the potential water outflow from the tissue, which may occur if the content of free and weakly bound water in the applied solute is lower than that within the tissue. The horizontal axis represents the spatial direction into the tissue bulk (). The spatial scale in this schematic is selected to approximate that of the experimental images. The figures are adapted with permission from Ref. [61].
It should be pointed out that if the concentration of a considered substance in the solution (e.g., water) is less than concentration , then the same Equation (2) can be applied to describe the diffusional outflow of water from the tissue to the applied solution, in which the concentration of water is sufficiently low. Certainly, this primarily affects the portion of free and weakly bound water in the tissue (e.g., skin [72]). In such a case the diffusional water outflow also forms a gradually smoothed stepwise profile as schematically illustrated in Figure 1b, which is similar to Figure 1a, but the profile slope has the opposite sign. The penetrating agent causes a local increase in the osmotic pressure, so the tissue tends to equilibrate this excessive pressure and exhibits expansion (positive strain). On the contrary, the outflow of free and weakly bound water reduces the osmotic pressure associated with water, so the resulting deficit in osmotic pressure should cause tissue shrinking (negative straining).
Now one should recall that these strains are estimated from the acquired sequence of OCT scans (usually with an inter-scan interval of fractions of a second), so the result of this comparison corresponds to the difference in the strain (and concentration) profiles with a certain time lag determined by the chosen interframe interval. In other words, the extracted interframe strain is proportional to the derivative of Equation (2) with respect to the time variable:
In contrast to the smooth monotonic profile given by Equation (2), the derivative given by Equation (3) has a bell-shaped profile with a clear extremum at a certain depth dependent on the elapsed time.
The bell-shaped derivatives corresponding to the smooth stepwise distributions shown in Figure 1 are schematically shown in Figure 2a,b.
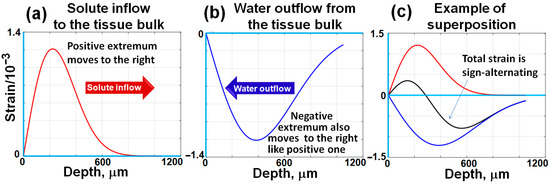
Figure 2.
A schematic illustration of bell-shaped interframe strain profiles induced by diffusing agents, corresponding to the concentration distributions shown in Figure 1. Unlike the stepwise, counter-propagating concentration gradients depicted in Figure 1, the positive and negative osmotically induced interframe strains exhibit bell-shaped distributions that propagate from the surface into the tissue bulk. The propagation rates of these strain profiles are determined by the respective diffusivity coefficients of the studied agents. Typically, the diffusivity coefficient for water is significantly higher than that of larger and heavier solute molecules. Consequently, the positive and negative strain extrema become increasingly separated over time during their propagation into the tissue bulk, as schematically demonstrated in this figure and as will be shown in real records below. The figures are adapted with permission from Ref. [61].
In contrast to the smooth monotonic concentration profiles shown in Figure 1, the bell-shaped distributions of interframe strains schematically shown in Figure 2 can be rather clearly observable, and their extrema can be readily trackable. The depth position of this extremum can readily be found by differentiating Equation (3) with respect to the spatial depth variable z:
If equating this expression to zero, one can readily find the depth at which the extremum of the bell-shaped function described by Equation (3) occurs, as a function of time:
Equation (5) demonstrates the proportionality of the extremum depth to the square root of time (notice that sometimes it is more convenient to plot the extremum depth squared, which is linearly proportional to time, ). Such a dependence is a hallmark of diffusional processes, and the diffusivity coefficient can be estimated from the slope of such experimentally obtained dependences.
In what follows, it will be demonstrated that the experimentally observed depth distributions of interframe osmotic strains produced in tissue samples by the application of water solutions (mostly glycerol solutions) indeed typically demonstrate peculiar alternating sign profiles. Furthermore, time evolution of the positions of the interframe strain extrema well corresponds to the dependences described by Equation (5), which is a peculiar feature of diffusional processes. In the next section we briefly outline how OCE imaging enables the possibility to visualize osmotically induced strains.
2.2. Phase-Resolved Strain Mapping in OCE
Most modern OCT systems enable acquisition of both amplitude and phase of the optical signal backscattered from the tissue bulk. In this section we briefly recall how interframe stains proportional to interframe variations in the concentrations of penetrating agents can be visualized using analysis of acquired sequences of OCT scans. The axial displacement of scatterers and the resulting phase variation in the received OCT signal are described by the following equation:
Here, denotes the central optical wavelength of the illuminating beam in vacuum, and represents the refractive index of the tissue. If scatterer displacements change with depth, as in the case of osmotically induced deformations, the dimensionless axial strain along the coordinate in the direction of the illuminating beam is given by:
Thus, if the scatterer displacements are sufficiently small, the inter-scan axial strains can be estimated without any time-consuming search operations typical of correlation-based approaches by performing pixel-to-pixel comparison of phases for sequentially acquired OCT scans of the deformed tissue. For operability of the phase-resolved approach, it is important that the inter-scan displacements should not significantly exceed the axial inter-pixel distance. Otherwise, the compared scans would experience too strong decorrelation, impeding their comparison. At the same time the inter-scan displacements should not necessarily have sub-wavelength magnitude [67].
It is also essential that the derivative in Equation (7) is estimated as a finite difference ratio for pixelated scans:
where is the inter-pixel distance along z-direction; is the difference in displacements of scatterers visualized in these pixels. The difference in the displacement in the considered pixels is related to the difference in interframe phase variations for these pixels; the displacements and phase variations are related via Equation (6), comprising the unknown refractive index . However, one should recall that in a tissue with refractive index , the wavelength in vacuum (air) is related to the wavelength in the tissue as . Similarly, the axial distance between pixels is related to its counterpart in the air as . Therefore, after inserting these relations into Equations (6) and (7), the refractive index cancels and does not appear in the resulting expression for the axial strain:
Therefore, the tissue strains can be accurately determined based on the measured phase changes and the OCT system parameters and assessed in the air.
For estimating the sample strains in OCT images using the axial dependence of interframe phase variations, the use of least-square regression for finding the slope of was initially proposed in [74]. Another variant of strain estimation using phase-sensitive OCT scans was described in [75]. In the latter approach termed “vector”, the estimation of interframe strains was performed by considering the phase-sensitive OCT signal as vectors in the complex-valued plane, and the phase was explicitly extracted at the very last stage of signal transformations. Among advantages of the vector method is its high tolerance to measurement noises [75] and high computational efficiency [76]. Additionally, the robustness of the vector method can be further enhanced using automatic adaptive choice of the gradient-estimation scale and preliminary averaging [77]. Such processing with adaptive choice of parameters is especially important for non-stationary and spatially inhomogeneous strains of osmotic origin.
A typical experimental configuration with an example of a noisy map of interframe phase variations is shown in Figure 3a. An example of structural OCT scans is shown in Figure 3b; Figure 3c represents an example of color-coded interframe phase variations (15 s after the solution application to the sample), and the reconstructed map depicting interframe strains is presented in Figure 3d.
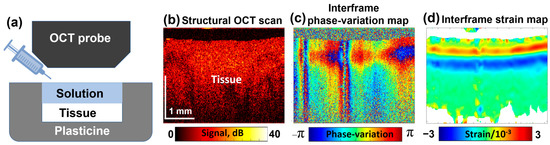
Figure 3.
Schematic illustration of the tissue sample placed inside a protective plasticine shell with one side open for OCE examination (a); a typical structural OCT scan (b); color-coded map showing interframe phase variations (c); and the reconstructed map of dimensionless interframe strains (d), induced by application of a 30% water solution of glycerol. Figure (a) is adapted with permission from Ref. [61].
In Figure 3d, the interframe osmotically induced strains look as a pair of horizontal stripes having opposite signs that correspond to bell-shaped extrema in the vertical profiles, the origin of which was discussed in Section 2.1. The depth positions of these extrema gradually increase with time. Simultaneously, the profiles of these extrema gradually get smoother. By performing summation of interframe osmotic strains, total cumulative strains over larger time intervals can be found; in such a way quite large cumulative-strain magnitudes reaching 20–30% and even larger can be estimated as demonstrated in [71].
The alternating-sign osmotically induced interframe strains in the form of two stripes shown in Figure 3d correspond to the tissue expansion in the near-surface region due to diffusional inflow and contraction in the deeper layers due to diffusional water outflow. With increasing time, these stripes gradually move deeper.
The experimental visualizations of osmotically induced strains were performed using a custom-built spectral domain OCT setup developed at the Institute of Applied Physics RAS (Nizhny Novgorod, Russia). The central wavelength of the system was 1300 nm (with ~90 nm spectral width), the spectral fringes rate was 20 kHz, and B-scans in the tissue depth were acquired at a rate of 20 Hz. The lateral size of B-scans was 4 mm, with an imaging depth of 2 mm (measured in air), providing an axial resolution of ~8 μm (in air) and a lateral resolution of ~15 μm. However, time variability of osmotically induced strains is fairly slow, so for improving the quality of their estimation and reducing the reception noises, the inter-B-scans intervals were intentionally chosen greater [69]. In the examples discussed below, the interval between B-scans was typically 0.5 to 1 s. The osmotic strains were observed in non-contact mode.
The samples were installed in an isolating plasticine coating, so the upper surface of the samples remained open (see Figure 3a). At the beginning of each OCE recording, a ~1 mm layer of the osmotically active solution was poured on the sample surface with a syringe. The observation time of passive penetration varied from a few to 10–15 min. The measurements discussed below were mostly performed using water-based glycerol solutions with various concentrations and a hydrophobic oil. The recorded sequences of interframe strains could be used to find cumulative (total for the observation time) strains as described in [78]. By considering the kinetics, i.e., time dependences of the depths of the interframe osmotic strains associated with the penetrating substance inflow and free and weakly bound water outflow, quantitative estimates of the diffusivity coefficient can be obtained, as discussed according to Equations (4) and (5). The magnitudes of the osmotically induced extrema are certainly greater for greater variations in the concentrations of the penetrating substance and outflowing water. However, those magnitudes depend on many factors (concentrations and molecular weights of the substances, elastic properties of the impregnated sample, elapsed time, etc.). Therefore, in contrast to quantitative characterization of osmotic-strain kinetics, the observed osmotic strain magnitudes provide qualitative (relative) information about the intensity of the observed diffusion processes.
3. Results and Discussion
In the following sections, experimental examples of the use of OCE for visualization of penetration will be presented. First, the results for biotissue-like polyacrylamide gel phantoms and cartilage samples are considered, and then some examples are presented for ex vivo porcine ear skin samples, demonstrating functionally very similar behavior for all three sample types.
3.1. OCE Monitoring of Penetration in Polyacrylamide Gel Phantoms
This section presents examples of osmotic-strain OCE visualization for penetration into fabricated polyacrylamide gel phantoms, which are known as artificial representatives of biotissues [79,80,81,82].
The gels of the phantoms are quite homogeneous, and their microstructure may be well controlled by the crosslinking degree. For the discussed studies, the samples were prepared by mixing acrylamide and bis-acrylamide in different proportions to obtain different crosslinking degrees. The bis-acrylamide/acrylamide ratios used were 1:4; 1:5; 1:6; and 1:7, corresponding to crosslinker weight percentages of 4.0, 3.3, 2.8, and 2.5% (see details in [83]). The samples containing the highest crosslinker content (1:4 ratio) exhibited the highest stiffness and demonstrated the highest scattering of the OCT signal, as can be seen from the results shown in Figure 4 for the four types of polyacrylamide phantom samples impregnated with a 50% water-based glycerol solution.
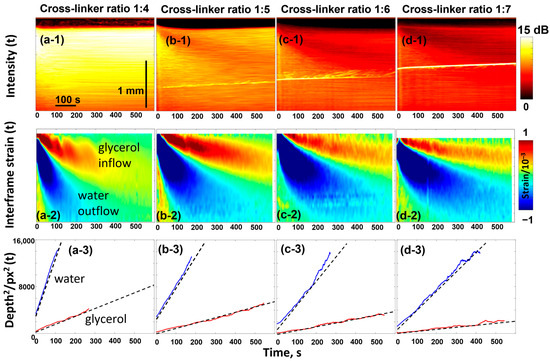
Figure 4.
OCT-based visualization of the penetration of 50% glycerol in water solution in the polyacrylamide gel samples with various degrees of crosslinking. The top panels ((a-1)–(d-1)) show the evolution of the backscattering signal intensity as a function of time (the bright inclined line is an artifact caused by parasite optical reflections). The intensity is laterally averaged over the width of individual scans so that each vertical line corresponds to a specific time. Similarly, panels ((a-2)–(d-2)) show the time dependence of the osmotic strains, in the structure of which two extrema with alternating signs are formed by inflow of glycerol and outflow of water. Panels ((a-3)–(d-3)) show the linear dependences for the squared depths of the two extrema in agreement with the discussion of Equations (4) and (5). The figures are reproduced with permission from Ref. [61].
The top row in Figure 4 illustrates the temporal variation in OCT signal intensity with impregnation—the intensity value is averaged in the lateral direction for each OCT scan taken with an interval of 1 s. The higher signal intensity corresponds to a stronger light scattering. The diffusion-induced inflow of glycerol and outflow of water affect the optical inhomogeneities, which are particularly evident for the softest sample with a 1:7 crosslinking ratio. The gradual decrease in the signal intensity in the upper layers means that the optical opacity decreases. This is the known effect of optical clearing [84] associated with glycerol penetration, which smoothes out heterogeneities in refractive index (minimizes the mismatch of refractive indices) so that scattering decreases.
Next, the diffusive inflow of glycerol and the associated water outflow are clearly visible in the second row of Figure 4. This row shows the evolution of the osmotically induced strains, the nature of which was discussed in Section 2.1. The strain distribution looks like a peculiar pattern with alternating signs, where the upper “tongue” corresponds to the material swelling caused by glycerol penetration and the lower one corresponds to the material shrinkage due to faster diffusional water outflow. The evolution of positions and magnitudes of these two extrema can easily be tracked as shown in the third row of Figure 4. The linear dependences observed between the squared positions of the extrema and time, , confirm that these extrema are associated with the diffusion front of glycerol inflow and water outflow. The slopes of these dependences are proportional to the diffusion coefficients (more specifically, correspond to ), as discussed for Equation (5).
3.2. OCE Monitoring of Penetration in Cartilaginous Samples
For comparison with the osmotically induced strains in biotissue-like polyacrylamide gels impregnated with glycerol solutions, we briefly consider some results obtained in studies [61,71,83,85] using the porcine and bovine cartilage ex vivo samples. Cartilage is a tissue well-suited for experimental studies: in particular, cartilage keeps rather stable structural features after freezing and subsequent thawing [86,87,88]. In the experiments described below we also used cartilage samples that were kept frozen at −15 °C and then were thawed in saline (0.9% NaCl solution) till room temperature.
Furthermore, cartilage structure can be modified to imitate various conditions, the understanding of which is important for solving many medical problems [89,90,91]. In view of this, it is instructive to demonstrate that cartilage samples exhibit similar behavior to gels in terms of penetration and diffusion properties. In Refs. [61,83] penetration of several active ingredients widely used in cosmetics, including glycerol, propylene glycol, polyethylene glycol, and iohexol (medically approved contrast agent), was studied using OCE. However, for easier comparison with the previous section, this section briefly outlines the results obtained only with glycerol, which was also used in the experiments with polyacrylamide gels.
We recall that it was shown in Section 3.1 that polyacrylamide gels with various degrees of crosslinking demonstrate pronounced quantitative differences in penetration rates with a qualitatively similar character. An example is shown in Figure 5 for a sample of porcine costal cartilage.
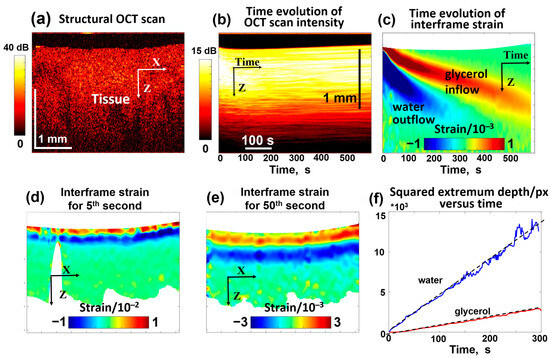
Figure 5.
OCT-based visualization of the penetration of 30% glycerol in water solution in a homogeneous cartilage sample ex vivo. (a) is an example of a structural OCT scan. (b) presents the temporal variation in the OCT signal intensity similar to the top row in Figure 4 (notice that each vertical line in (b) corresponds to the intensity averaged over the total width of the structural scan, so the dynamic range of intensity in (b) gets smaller than in the structural OCT scan (a). Panel (c) shows the temporal variation in interframe osmotic strains containing two declining positive and negative “tongues” corresponding to glycerol inflow and water outflow, like for the gel samples in Figure 4. Panels (d,e) show examples of the spatial distribution of interframe strains for the 5th and 50th seconds of the penetration. Panel (f) demonstrates the linear time dependences for the squared depths of the positive and negative strain extrema (see Equation (5)). The slopes of the depth dependences of the tracked extrema according to Equation (5) indicate that and . Figures (b–f) are reproduced/adapted with permission from Ref. [61].
In contrast to polyacrylamide gel samples with known differences in the crosslinking degree, cartilage samples may exhibit a priori natural variability in microstructural properties, although cartilage samples are usually quite homogeneous (see Figure 5a). Therefore, it was interesting to examine the cartilage samples with intentionally spatially inhomogeneous microstructural features, which could affect the penetration by analogy to the influence of the crosslinking degree in the gels. To modify the microstructural properties of cartilage composed of collagenous layer structures, pulsed periodic moderate heating by sample irradiation with an infrared laser may be used [92,93]. Such moderate laser heating may be used, in particular, to modify the geometric shape of cartilage samples [70,94]. Figure 6 demonstrates the results of OCE observations when a 30% glycerol solution was applied to a cartilage sample whose central part was earlier subjected to laser heating, so the labels 1, 2, and 3 in Figure 6 correspond to the region of the initial sample properties, the moderately heated region, and the region of maximum heating, respectively. Similarly to Figure 5d, the bottom row in Figure 6 demonstrates the deepening of diffusion for penetrating glycerol and outflowing water, where the differences between the non-irradiated region 1 and the laser-heated regions 2 and 3 are clearly seen. It can be pointed out that the differences in the diffusivity for outflowing water (small molecule size) are quite moderate, while the differences for glycerol, whose molecules are larger in size, are much more pronounced. Figure 6 shows that the maximal diffusivity coefficient for glycerol corresponds to the non-irradiated region 1. For the moderately irradiated region 2, the diffusivity coefficient for glycerol is ~3–4 times smaller, and for maximally irradiated region 3, the diffusivity additionally decreases by an order of magnitude compared to non-irradiated region 1. It can be estimated from Figure 6 that , , and . For comparison, the variation in diffusivity for water is much weaker, ; the decrease in the diffisivity of water in region 3 in comparison with region 1 is only ~1.5 times. At the same time , whereas , so the effects of variations in microstructure for differently heated regions 1, 2, and 3 are much stronger on the diffusivity for larger molecules of glycerol in comparison with smaller molecules of water.
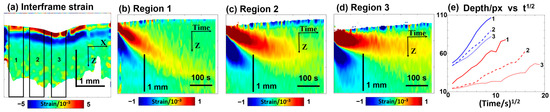
Figure 6.
Visualization based on OCE of the temporal variation in osmotically induced strains during the penetration of 30% glycerol in water solution in a cartilage sample modified by local laser heating in the center; the meaning of the labels is as follows: 1—non-heated region; 2—moderately heated region; and 3—overheated central region. Panel (a) shows interframe osmotic strains at the start of glycerol penetration at time t = 5 s. Panels (b–d)—the color-coded plots showing the time evolution of interframe osmotic strains in regions 1–3 (the upper “tongue” of the positive strain corresponds to penetrating glycerol, and the lower “tongue” of the negative strain is associated with diffusive water outflow). Panel (e) shows the depth positions in pixels (vertical pixel size is ~5.8 μm) for the tracked glycerol- and water-related extrema, shown as functions of the square root of time. The figures are reproduced/adapted with permission from Ref. [61].
It may also be noted that in the non-heated sample region 1, the depth profile of the glycerol-related extremum demonstrates a very clear linear dependence on the time square root, as anticipated for penetration into a homogeneous material. For the heated sample regions 2 and 3, however, the similar dependences demonstrate clearer deviations from the invariable slopes. In particular, at longer treatment times corresponding to greater penetration depths, where the temperature rise caused by the preliminary laser-heating of the sample was lower, the dependences become noticeably steeper than initially demonstrated a smaller difference from the diffusivity in the non-heated region 1. Thus, these results demonstrate that OCE visualization of osmotic strains is a quite sensitive technique allowing us to observe the influence of tissue properties on the penetration rate. It is also to be expected that the variations in the tissue microstructure may strongly manifest themselves in the penetration of substances of various molecular sizes rather than in the diffusivity of water.
3.3. OCE Monitoring of Penetration in Porcine Skin Samples
Functionally very similar results were also obtained for the ex vivo porcine ear skin samples. For better comparison with the results presented in Section 3.1 and Section 3.2, we also used glycerol solutions.
In a series of such experiments, the skin samples were placed in 0.9% saline solution, similar to the preparation of cartilage samples, to allow a direct comparison. Evidently, the water content of the saline solution-treated skin samples should be higher than in natural conditions. It is reasonable to assume that the saline solution primarily filled the skin microchannels, so the liquid in these channels contained over 99% of water, as in the saline solution itself. This explains the observation that the application of even quite dilute 5% glycerol solution to such skin samples induces quite visible negative strains, indicating the water outflow (see Figure 7e). As expected, at higher glycerol concentrations, this water outflow was stronger and significantly masked the positive-strain extremum associated with glycerol penetration. The penetration behavior of glycerol and the associated water outflow in the skin are consistent with previously reported data [95,96]. To illustrate the glycerol-associated extremum more clearly in Figure 7, we present the results for 5% glycerol concentration. Figure 7b,d demonstrate the appearance of strains with alternating signs that are qualitatively similar to those observed in polyacrylamide and cartilage samples. The squared depths of the two strain extrema in the skin demonstrate nearly linear dependences on time, similar to the gel and cartilage samples shown in Section 3.1 and Section 3.2. Here, too, the faster-decreasing extremum of the negative strain, which corresponds to the water outflow, can be clearly recognized, and after 5–10 s, the two extrema become well separated from each other. The qualitative similarity with polyacrylamide and cartilage samples is evident (see Figure 7a,b), although some quantitative differences can be pointed out. The difference in the slopes for the extrema associated with water and glycerol does not exceed 4–8-fold for the polyacrylamide and non-modified cartilage samples. This difference is significantly greater in the skin samples, indicating that times. In this context, it is interesting to note that in the thermally modified (partially coagulated) cartilage samples, a similar difference is observed in the heated regions 2 and 3 (Figure 6e). At the same time, the heated and non-heated regions for water demonstrate much weaker variations in the slopes for the water-associated extremum (the diffusivity parameters vary by only ~10–20%), while for larger glycerol molecules, the diffusivity decreases several times in the heated regions.
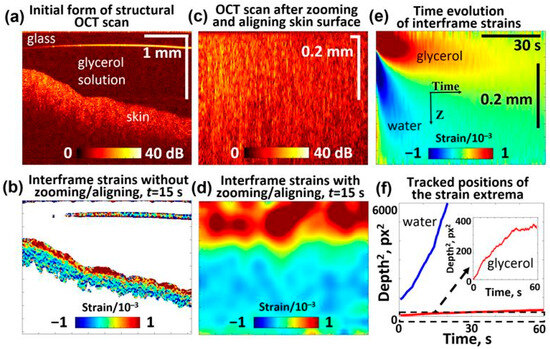
Figure 7.
OCE-visualized penetration of the 5% glycerol solution in the porcine ear skin sample and soaked in 0.9% saline solution prior to measurements (similar to the cartilage samples): (a) Structural OCT scan showing the skin sample and glycerol solution above it; (b) interframe strain map 15 s after application of the solution onto the sample surface; (c) rearraged OCT scan based on (a), where the liquid is eliminated and the sample surface is aligned at the upper boundary; (d) interframe strain distribution corresponding to structural scan (c) for 15 s after application of the solution; (e) time evolution of interframe osmotic strains (the upper “tongue” of the positive strain is for penetrating glycerol and the lower “tongue” of the negative strains is associated with diffusive water outflow); (f) shows the squared depth positions (in pixels with a vertical pixel size of ~2.9 μm) of the observed glycerol- and water-related extrema plotted as functions of time. The slopes of the dependences in panel (f) indicate that the diffusivity coefficient is cm2/s for water and cm2/s for glycerol.
It is also interesting to note that for gel samples with various crosslinking degrees (Section 3.1), the slopes for water and glycerol varied noticeably, although the proportions remained approximately the same. This proportional variation could therefore reasonably be attributed to the geometric factor, i.e., variations in the tortuosity of the microchannels through which the diffusing molecules move. This difference between the diffusivity of the same molecules in “free” solution and through the channels is even used to estimate the tortuosity of the channels [97]. However, the tortuosity itself should affect the diffusivity in a similar way regardless of the molecule size (e.g., water and glycerol in the present case). Another situation is when significantly stronger differences are observed among the samples for molecules with sizes much larger than the size of water molecules. Then it can be assumed that the diameter of a significant portion of microchannels is much larger than the size of water molecules (so that their diffusion is not yet affected), but that the same channels for glycerol molecules are already so small that they noticeably impede the diffusion movement of glycerol. In this context, the difference times for the data of the skin sample in Figure 7 is similar to the difference in the diffusivity of water and glycerol in the thermally altered regions of the cartilage discussed in Section 3.2. As for the absolute values of diffusivity for the data shown in Figure 7, their estimation yields cm2/s, which agrees quite well with cm2/s within the non-heated region 1 in the cartilage sample shown in Figure 6. Figure 6 also shows that in the heated regions 2 and 3, the diffusivity for water is only moderately reduced (only by ~25–30%).
For the skin sample shown in Figure 7, the diffusion coefficient of glycerol can be estimated as , which is comparable with cm2/s in the heated region 3 of cartilage. At the same time, the diffusivity of glycerol in the non-heated region 1 of the cartilage was an order of magnitude larger cm2/s (but ~3 times smaller than for water in this region).
The above-mentioned strong difference in the diffusivity of water and glycerol appears to be significantly greater than would be expected due to the different sizes and molecular weights of water and glycerol (18 g/mol and 92 g/mol, respectively). Compared to the only ~3-fold difference in the diffusivity of water and glycerol in non-modified cartilage, the additional 5- to 9-fold decrease in glycerol diffusivity in the heated cartilage and skin is particularly striking, although the diffusivity of water remained comparable in all these samples. These differences can be attributed to the fact that, in contrast to diffusion in free solutions, diffusing molecules in biotissues usually penetrate the tissue bulk through the microchannel system. The latter are characterized by certain cross-sections and tortuosity. For a given apparent depth, the channels’ tortuosity leads to a geometric increase in the lengths of trajectories covered by diffusing molecules. This geometric elongation of the trajectories does not depend on the molecule size and should lead to a decrease in diffusivity to the same extent for various molecules. This expectation agrees with the data shown in Figure 5 for polyacrylamide gels. However, if the diameters of the microchannels are narrow enough, it may be expected that these thinner channels would additionally impede penetration of diffusing molecules, especially the larger ones. This is because the channels may remain sufficiently wide for small water molecules without significantly affecting their diffusivity. In contrast, within the same channels, for larger molecules, such as glycerol, additional interactions with each other and with the walls may occur, leading to an increase in the effective local viscosity and a reduction in their penetration rate.
A much stronger influence of the microchannel diameter can be expected for even larger molecules, for example, for molecules of various oils that are widely used in cosmetics and medicine. The penetration of a number of such oils into the skin has been studied using confocal Raman microspectroscopy—the molecular-specific non-invasive optical method based on observation of Raman scattering of the respective molecules [98] and using other optical methods [99]. In these experiments, porcine ear skin samples were examined ex vivo and human skin in vivo, and the results indicated that the applied oils remained localized in the uppermost corneocyte layers of the stratum corneum (maximum penetration depth of approx. 11 μm) even after a long treatment time of ~30 min.
For comparison with the results of the discussed OCE-based visualization of diffusional penetration, similar experiments were repeated with jojoba oil and 5% glycerol in water solution using skin samples which, in contrast to the example in Figure 7, were not preliminary stored in saline solution to enable similar conditions as in the study [98] and to exclude possible distortions due to hydrophobic properties of oil. The results of these comparative experiments are shown in Figure 8.
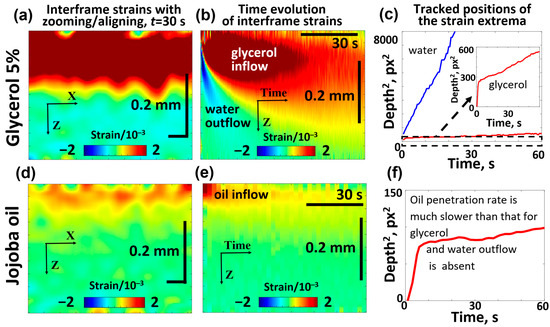
Figure 8.
Comparative OCE images showing the penetration of 5% glycerol (a–c) and jojoba oil (d–f) into the porcine ear skin samples and demonstrating the striking difference in the diffusivity of jojoba oil and glycerol. The interframe plots of osmotic strain for glycerol (a) and jojoba oil (d) correspond to the same time interval of 15 s after application of the substance. Panels (b,e) show the time evolution of osmotic strains associated with glycerol/water and jojoba oil, respectively. The depth position of the tracked osmotic strain extrema is shown for glycerol/water in panel (c) and for jojoba oil in panel (f). The inset in (c) shows the zoomed fragment of the dependence for penetrating glycerol, in which the initial faster penetration rate is clearly seen, similarly to the initial faster penetration rate for jojoba oil visible in panel (f).
It is seen from Figure 8b that glycerol penetrated to a depth of about 100 μm within 15 s, and the results of tracking the positive-strain maximum for glycerol yield the average estimate of the diffusion coefficient (which is of the same order of magnitude as the results for the saline-soaked skin samples in Figure 7). It is also visible that the diffusion front of glycerol penetrates faster in the superficial region and then demonstrates a marked slowing. A similar but smoother slowing can be seen in Figure 7 for the saline-soaked skin samples.
Figure 8d,e shows that the penetration depth of jojoba oil in the skin is limited to 20–40 μm. Furthermore, the results of the positive-extremum tracking in Figure 8f indicate that upon reaching a depth of 8–9 μm below the surface, further penetration becomes very slow, which is in agreement with the results of Choe et al. [98]. That study indicated that cosmetic oils remain localized in the stratum corneum and do not penetrate into the viable epidermis, consistent with findings from other studies on cosmetic oils [100,101,102]. It should be noted, however, that jojoba oil has been reported to act as a penetration enhancer, facilitating the transdermal delivery of active compounds alone [103] or in combination with other substances [104]. The results of tracking the positive-strain maximum for jojoba oil indicate a characteristic penetration depth of ~20–25 μm during the treatment time of ~60 s, from which one may estimate the diffusion coefficient for jojoba oil as , which is over 50 times smaller than for glycerol. In even deeper skin layers (several tens of micrometers and greater), the diffusion coefficient becomes even smaller. Figure 8e shows that the region of osmotic strains only shows a clear deepening during the first 10–15 s and then the osmotic strains assotiated with the penetrating oil remain virtually blocked in a narrow layer of less than 30–40 μm thickness.
It should also be noted that the plots for glycerol solution in Figure 7e and Figure 8b show descending regions of the negative strains associated with the water outflow from the deeper layers of both the saline-soaked and non-soaked skin. The diffusion coefficients obtained from the data shown in Figure 7 and Figure 8 have values cm2/s that are quite close to each other. From the examples of the spatial distribution of osmotic strains induced by penetrating glycerol, it is clear that the depth of the descending front of positive interframe strains within the 4 mm lateral OCT scans exhibits quite appreciable variations in several tens of percent. This means that the magnitude of the corresponding diffusion coefficient fluctuates by a factor of two within the OCT scan width, since the diffusion coefficient is proportional to the ratio of the squared depth of the osmotic strain front and the elapsed time (see Equation (5)).
Therefore, it can be emphasized that the OCE visualization of osmotic strains easily reveals the spatial variability of tissue diffusivity with a lateral resolution of about 100–200 μm. When the properties of the sample are depth-dependent, the penetration rate of the osmotic-strain front also becomes sufficiently pronouncedly dependent on depth (i.e., varies by tens of percent and greater); this depth dependence can also be recognized in the plots representing the diffusion front as a function of elapsed time. For example, in Figure 6e for the central, strongly heated region on the cartilage sample, it can be seen that the negative-strain “tongue” corresponding to the water outflow initially descended more slowly in the most heated near-surface regions and then began to descend faster in the deeper and less heated tissue layers in this region. In Figure 7 for the soaked skin, it can be seen that the positive-strain “tongue” corresponding to glycerol penetration initially descended faster (in the first 30–40 s) and then somewhat slower. It is especially clear that this slowing of the penetration rate is visible in Figure 8 for both glycerol and jojoba oil. This slowing indicates a lower permeability of the deeper tissue layers for glycerol and jojoba molecules. In contrast, for water in Figure 8, there is no similar slowing in the water-associated “tongue”, although the diffusion front of water reached ~3 times deeper layers. This fact agrees with the above-mentioned difference in tissue permeability for small water molecules and larger molecules of substances such as glycerol and oils.
4. Advantages, Limitations, and Future Prospects
4.1. OCE Method Does Not Provide Molecular Specificity
The OCE-based approach enables visualization of osmotic strains associated with substance penetration and accompanying water outflow in biological objects, such as skin. However, unlike advanced Raman-based and certain fluorescence-based methods, the OCE method lacks molecular specificity.
4.2. OCE Method Is Limited to Detecting the Penetration of Osmotically Active Substances Only
Since the OCE relies on the induction of osmotic strains, it is limited to the visualization of osmotically active substances and does not detect the penetration of osmotically inactive isotonic compounds. In general, most compounds are not isotonic, and their osmotic activity during tissue penetration induces strain fields that can be efficiently visualized using the OCE method, making the OCE method suitable for studying the penetration of most substances. In contrast, molecular-specific optical methods remain effective for imaging isotonic substances. However, these methods typically do not offer the same convenient capabilities for real-time observation of diffusion front dynamics as provided by OCE. Furthermore, the described OCE method enables simultaneous observation of the topically applied substances and the eventual water outflow that was initially present in the tissue, which is a unique feature of the method.
4.3. The OCE Method Provides Real-Time Visualization of Penetration Dynamics
It should also be understood that the OCE method performs visualization of transitional osmotically induced strains that gradually decay when the system approaches equilibrium. Consequently, diffusion fronts are most clearly observable with the OCE method during the highly non-equilibrium penetration phase, i.e., in real time during the first tens or hundreds of seconds, depending on the studied substance and tissue properties. While alternative optical methods are generally less suited for real-time monitoring of diffusion kinetics, they offer the advantage of detecting and quantifying penetrated substances even after extended periods (e.g., tens of minutes) once a new equilibrium state has been reached. In contrast, the OCE method is inherently capable of visualizing non-equilibrium diffusion processes, allowing real-time tracking of diffusion front progression and enabling estimation of diffusion coefficients.
4.4. The Imaging Depth of the OCE Method Is Comparable to That of OCT
For the described OCE method, the imaging depth is limited similarly to that of OCT, typically <2 mm, and is further reduced in highly scattering tissues. Nevertheless, this depth is sufficient to exceed the typical thickness of the epidermis, making it particularly suitable for monitoring drug and cosmetic penetration in the skin. In comparison, other optical methods, such as fluorescence/reflectance confocal laser scanning microscopy, multiphoton tomography, and Raman-based methods, often exhibit even more pronounced depth limitations [6].
4.5. The Quantitative Assessment of Penetrating Substances Remains a Significant Challenge
When osmotic processes reach equilibrium, osmotic interframe strains no longer exist and thus cannot be detected by the OCE method. However, the OCE-visualized interframe strains can be summed to characterize the overall penetration effect. The level of both transient interframe strains and cumulative strains depends on the intensity of penetration and the total amount of the penetrated substance. Therefore, comparison of these strains can be used to relatively characterize the penetration intensity of the same substance under various conditions. With further studies, including calibration with alternative quantitative methods, it is likely that the OCE method will also be able to quantitatively characterize the penetrating substance. In this context, combining it with a complementary Raman method for simultaneous measurements would be beneficial for calibration. Consequently, future work should focus on these calibration studies, which represent clear directions for the continued development of the described OCE method.
4.6. In Vivo Skin Measurements: Promising but Requiring Reliable Local Long-Term Stabilization
It is important to note that although individual OCT scans can be easily acquired during small fractions of a second (so that there is not much difference between ex vivo and in vivo imaging), the visualization of tiny osmotically induced motions of scatterers in the examined tissue requires comparison of sequentially acquired OCT scans. However, physiological motions such as respiration, cardiac pulsation, and other involuntary movements can significantly affect measurement accuracy and degrade the resulting OCE data. A similar challenge arises in OCT-based angiography, where microcirculatory blood flow is visualized by singling out tiny motions of blood cells within vessels. In both cases, tissue motion can mask or even completely corrupt the imaging signals. These interfering motions can be mitigated through a combination of physical stabilization and numerical motion compensation techniques. Crucially, the selection of an optimal time interval between sequential OCT scans (sufficiently short to limit motion artifacts but long enough to capture the relevant dynamic changes) is essential to minimize the impact of such disturbances. Recently, a suction cap has been proposed to achieve local stabilization of living tissue for OCT-based angiography [105]. Another viable approach involves the use of a metal coupling ring affixed to the skin with medical adhesive tape, similar to stabilization techniques employed in in vivo laser scanning microscopy and multiphoton tomography [106]. Comparable strategies may be adapted and optimized for suppressing motion artifacts in OCE-based in vivo visualization of osmotic strains in human skin. In contrast, living skin equivalents, which are widely utilized in biomedical research as an alternative to animal models, offer an ideal platform for the current form of the OCE method, as they provide a motion-free, biologically relevant environment for controlled experiments [107]. Consequently, future work should focus on adapting the OCE approach for application to patient skin by effectively suppressing physiological motion artifacts in living tissues. Preliminary results have confirmed the feasibility of the OCE method for non-invasive, short-term imaging of penetration in human skin in vivo; however, further work is required to stabilize the images and ensure better reproducible results. Accordingly, the effectiveness of in vivo OCE applications is expected to differ across various anatomical regions.
4.7. The OCE Method’s Sensitivity Is Restricted to Detecting Strain
The sensitivity of the OCE method depends on its ability to visualize strain so that penetration of substances exhibiting higher osmotic activity can be monitored more easily. For a given substance, sensitivity of osmotic-strain detection can be enhanced by increasing the time interval between subsequent scans. However, for future in vivo measurements, it is important to note that image quality is largely influenced by measurement stability, which decreases as the inter-scan interval increases. Therefore, the optimization of the inter-scan interval and masking of living tissue movements remain key challenges for future in vivo applications of OCE.
5. Conclusions
The utility of the OCE method for real-time monitoring of the penetration of osmotically active topically applied substances into the skin has been confirmed ex vivo for glycerol and jojoba oil, similarly to the previous results for biotissue-like polyacrylamide gel phantoms and cartilaginous samples. The OCE method for visualizing interframe osmotic strains principally expresses the time derivative of the penetrating substance (i.e., visualizes the front of the diffusing substance), which has a clear and easily tracked maximum, as opposed to the total distribution of the substance, which has a smooth and stepwise shape with no clear trackable features. The OCE method is not molecule-specific (unlike Raman-based and certain fluorescence-based methods), but enables simultaneous visualization of out-of-equilibrium opposing diffusion processes, such as the penetration of a solute into tissue and the outflow of water from tissue at depths of less than 2 mm, similar to other OCT techniques.
Thus, the diffusion rate and penetration depth of osmotically active substances into the skin and the resulting water outflow can be visualized with the OCE method in real time by measuring the osmotic strains—this opens up a variety of important possibilities unavailable for other optical techniques, so it may complement them and provide new information that is important for dermatology and cosmetology. The quantitative assessment of penetrating substances may be achieved through complementary measurement techniques and represents a significant challenge for the further advancement of the OCE method. Finally, it is important to note that the OCE procedure is non-invasive and relies solely on signal acquisition via OCT, a modality that meets the established safety standards and already holds the necessary regulatory approvals for biomedical applications. This includes its potential for future in vivo use, making the method well-suited for clinical translation. Preliminary tests are fairly promising and demonstrate that the OCE method can be adapted for non-invasive, short-term visualization of penetration processes in human skin in vivo. However, additional research is necessary to establish reliable local stabilization between the skin and the OCE device, aiming to improve image consistency and ensure reproducible results.
Author Contributions
Conceptualization, V.Y.Z. and M.E.D.; methodology, V.Y.Z. and Y.M.A.; software, A.A.S., D.V.S., and A.L.M.; validation, V.Y.Z. and Y.M.A.; investigation, Y.M.A., E.M.K., A.A.S., D.V.S., and V.Y.Z.; data curation, A.A.S.; writing—original draft preparation, V.Y.Z. and M.E.D.; writing—review and editing, V.Y.Z., Y.M.A., A.A.S., A.L.M., and M.E.D.; visualization, A.A.S.; supervision, V.Y.Z.; project administration, V.Y.Z. and M.E.D.; funding acquisition, V.Y.Z. All authors have read and agreed to the published version of the manuscript.
Funding
This research was funded by the Russian Science Foundation, grant No 22-12-00295-П.
Data Availability Statement
The data are available from the corresponding author upon reasonable request.
Conflicts of Interest
The authors declare no conflicts of interest. Author Y.M.A. was employed by the company Terra Quantum GmbH. The remaining authors declare that the research was conducted in the absence of any commercial or financial relationships that could be construed as a potential conflict of interest.
Abbreviations
The following abbreviations are used in this manuscript:
| OCE | Optical Coherence Elastography |
| OCT | Optical Coherence Tomography |
References
- Proksch, E.; Brandner, J.M.; Jensen, J.M. The Skin: An Indispensable Barrier. Exp. Dermatol. 2008, 17, 1063–1072. [Google Scholar] [CrossRef]
- van Smeden, J.; Janssens, M.; Gooris, G.S.; Bouwstra, J.A. The Important Role of Stratum Corneum Lipids for the Cutaneous Barrier Function. Biochim. Biophys. Acta (BBA) Mol. Cell Biol. Lipids 2014, 1841, 295–313. [Google Scholar] [CrossRef] [PubMed]
- Brandner, J.M.; Kief, S.; Grund, C.; Rendl, M.; Houdek, P.; Kuhn, C.; Tschachler, E.; Franke, W.W.; Moll, I. Organization and Formation of the Tight Junction System in Human Epidermis and Cultured Keratinocytes. Eur. J. Cell. Biol. 2002, 81, 253–263. [Google Scholar] [CrossRef] [PubMed]
- Tampucci, S.; Burgalassi, S.; Chetoni, P.; Monti, D. Cutaneous Permeation and Penetration of Sunscreens: Formulation Strategies and In Vitro Methods. Cosmetics 2018, 5, 1. [Google Scholar] [CrossRef]
- Pavlou, P.; Siamidi, A.; Vlachou, M.; Varvaresou, A. UV Filters and Their Distribution on the Skin through Safe, Non-Penetrating Vehicles. J. Cosmet. Sci. 2021, 72, 298–324. [Google Scholar]
- Darvin, M.E. Optical Methods for Non-Invasive Determination of Skin Penetration: Current Trends, Advances, Possibilities, Prospects, and Translation into In Vivo Human Studies. Pharmaceutics 2023, 15, 2272. [Google Scholar] [CrossRef]
- Baesso, M.L.; Snook, R.D.; Andrew, J.J. Fourier Transform Infrared Photoacoustic Spectroscopy to Study the Penetration of Substances through Skin. J. Phys. IV Proc. 1994, 4, C7-449–C7-451. [Google Scholar] [CrossRef]
- Hanh, B.D.; Neubert, R.H.H.; Wartewig, S.; Lasch, J. Penetration of Compounds through Human Stratum Corneum as Studied by Fourier Transform Infrared Photoacoustic Spectroscopy. J. Control. Release 2001, 70, 393–398. [Google Scholar] [CrossRef]
- Wan, B.; Ganier, C.; Du-Harpur, X.; Harun, N.; Watt, F.M.; Patalay, R.; Lynch, M.D. Applications and Future Directions for Optical Coherence Tomography in Dermatology. Br. J. Dermatol. 2021, 184, 1014–1022. [Google Scholar] [CrossRef]
- Liu, S.; Meng, X.; Wang, C.; Ma, J.; Fan, F.; Zhu, J. Handheld Optical Coherence Tomography for Tissue Imaging: Current Design and Medical Applications. Appl. Spectrosc. Rev. 2025, 60, 292–316. [Google Scholar] [CrossRef]
- Lane, M.E. Skin Penetration Enhancers. Int. J. Pharmaceut. 2013, 447, 12–21. [Google Scholar] [CrossRef] [PubMed]
- Tuchin, V.V.; Xu, X.; Wang, R.K. Dynamic Optical Coherence Tomography in Studies of Optical Clearing, Sedimentation, and Aggregation of Immersed Blood. Appl. Opt. 2002, 41, 258–271. [Google Scholar] [CrossRef]
- Guo, X.; Guo, Z.Y.; Wei, H.J.; Yang, H.Q.; He, Y.H.; Xie, S.S.; Wu, G.Y.; Zhong, H.Q.; Li, L.Q.; Zhao, Q.L. In Vivo Quantification of Propylene Glycol, Glucose and Glycerol Diffusion in Human Skin with Optical Coherence Tomography. Laser Phys. 2010, 20, 1849–1855. [Google Scholar] [CrossRef]
- Guo, X.; Guo, Z.; Wei, H.; Yang, H.; He, Y.; Xie, S.; Wu, G.; Deng, X.; Zhao, Q.; Li, L. In Vivo Comparison of the Optical Clearing Efficacy of Optical Clearing Agents in Human Skin by Quantifying Permeability Using Optical Coherence Tomography. Photochem. Photobiol. 2011, 87, 734–740. [Google Scholar] [CrossRef] [PubMed]
- Ghosn, M.G.; Tuchin, V.V.; Larin, K.V. Depth-Resolved Monitoring of Glucose Diffusion in Tissues by Using Optical Coherence Tomography. Opt. Lett. 2006, 31, 2314–2316. [Google Scholar] [CrossRef] [PubMed]
- Liba, O.; SoRelle, E.D.; Sen, D.; de la Zerda, A. Contrast-Enhanced Optical Coherence Tomography with Picomolar Sensitivity for Functional in Vivo Imaging. Sci. Rep. 2016, 6, 23337. [Google Scholar] [CrossRef]
- Feng, X.; Li, G.-Y.; Yun, S.-H. Ultra-Wideband Optical Coherence Elastography from Acoustic to Ultrasonic Frequencies. Nat. Commun. 2023, 14, 4949. [Google Scholar] [CrossRef]
- Bai, Y.; Zhang, Z.; He, Z.; Xie, S.; Dong, B. Dual-Convolutional Neural Network-Enhanced Strain Estimation Method for Optical Coherence Elastography. Opt. Lett. 2024, 49, 438–441. [Google Scholar] [CrossRef]
- Bai, Y.; Zhang, K.; Mo, R.; Ni, Z.; He, Z.; Xie, S.; Dong, B. Bayesian-Neural-Network-Based Strain Estimation Approach for Optical Coherence Elastography. Optica 2024, 11, 1334. [Google Scholar] [CrossRef]
- Wu, H.; Wang, J.; Zhu, Z.; Yu, H.; Xie, H.; Fang, R.; Li, Z. Impact of Multiplicative Noise Removal on Digital Volume Correlation-Based Optical Coherence Elastography. Opt. Lasers Eng. 2025, 193, 109097. [Google Scholar] [CrossRef]
- Lu, C.; Ren, J.; Wei, X.; Shen, K.; Zhou, X.; Huang, Q.; Shen, M.; Zhu, D. Ultra-Fast Line-Field Swept Source Scanning Optical Coherence Elastography. Biomed. Opt. Express 2025, 16, 3105–3115. [Google Scholar] [CrossRef] [PubMed]
- Singh, M.; Schill, A.W.; Nair, A.; Aglyamov, S.R.; Larina, I.V.; Larin, K.V. Ultra-Fast Dynamic Line-Field Optical Coherence Elastography. Opt. Lett. 2021, 46, 4742–4744. [Google Scholar] [CrossRef] [PubMed]
- Singh, M.; Zvietcovich, F.; Larin, K.V. Introduction to Optical Coherence Elastography: Tutorial. J. Opt. Soc. Am. A 2022, 39, 418. [Google Scholar] [CrossRef] [PubMed]
- Singh, M.; Nair, A.; Aglyamov, S.R.; Larin, K.V. Compressional Optical Coherence Elastography of the Cornea. Photonics 2021, 8, 111. [Google Scholar] [CrossRef]
- Kirby, M.A.; Pelivanov, I.; Song, S.; Ambrozinski, Ł.; Yoon, S.J.; Gao, L.; Li, D.; Shen, T.T.; Wang, R.K.; O’Donnell, M. Optical Coherence Elastography in Ophthalmology. J. Biomed. Opt. 2017, 22, 1. [Google Scholar] [CrossRef]
- Sun, M.G.; Son, T.; Crutison, J.; Guaiquil, V.; Lin, S.; Nammari, L.; Klatt, D.; Yao, X.; Rosenblatt, M.I.; Royston, T.J. Optical Coherence Elastography for Assessing the Influence of Intraocular Pressure on Elastic Wave Dispersion in the Cornea. J. Mech. Behav. Biomed. Mater. 2022, 128, 105100. [Google Scholar] [CrossRef]
- Feng, X.; Li, G.-Y.; Jiang, Y.; Shortt-Nguyen, O.; Yun, S.-H. Optical Coherence Elastography Measures Mechanical Tension in the Lens and Capsule. Acta Biomater. 2025, 199, 252–261. [Google Scholar] [CrossRef]
- Li, G.-Y.; Feng, X.; Yun, S.-H. Simultaneous Tensile and Shear Measurement of the Human Cornea in Vivo Using S0- and A0-Wave Optical Coherence Elastography. Acta Biomater. 2024, 175, 114–122. [Google Scholar] [CrossRef]
- Quince, Z.; Westerman, N.; Alonso-Caneiro, D.; Read, S.A.; Collins, M.J. Anterior Segment Applications of Optical Coherence Elastography in Ophthalmic and Vision Science: A Systematic Review of Intrinsic Measurement Techniques and Clinical Relevance. Prog. Biomed. Eng. 2025, 7, 032001. [Google Scholar] [CrossRef]
- Kennedy, B.F.; Kennedy, K.M.; Sampson, D.D. A Review of Optical Coherence Elastography: Fundamentals, Techniques and Prospects. IEEE J. Sel. Top. Quantum Electron. 2014, 20, 272–288. [Google Scholar] [CrossRef]
- Allen, W.M.; Chin, L.; Wijesinghe, P.; Kirk, R.W.; Latham, B.; Sampson, D.D.; Saunders, C.M.; Kennedy, B.F. Wide-Field Optical Coherence Micro-Elastography for Intraoperative Assessment of Human Breast Cancer Margins. Biomed. Opt. Express 2016, 7, 4139. [Google Scholar] [CrossRef] [PubMed]
- Kennedy, B.F.; McLaughlin, R.A.; Kennedy, K.M.; Chin, L.; Wijesinghe, P.; Curatolo, A.; Tien, A.; Ronald, M.; Latham, B.; Saunders, C.M.; et al. Investigation of Optical Coherence Microelastography as a Method to Visualize Cancers in Human Breast Tissue. Cancer Res. 2015, 75, 3236–3245. [Google Scholar] [CrossRef]
- Sanderson, R.W.; Kennedy, B.F. Imaging the Micro-Scale Mechanical Properties of Cancer Using Optical Coherence Elastography. Curr. Opin. Biomed. Eng. 2025, 35, 100614. [Google Scholar] [CrossRef]
- Huang, P.-C.; Chaney, E.J.; Aksamitiene, E.; Barkalifa, R.; Spillman, D.R.; Bogan, B.J.; Boppart, S.A. Biomechanical Sensing of in Vivo Magnetic Nanoparticle Hyperthermia-Treated Melanoma Using Magnetomotive Optical Coherence Elastography. Theranostics 2021, 11, 5620–5633. [Google Scholar] [CrossRef]
- Burhan, S.; Detrez, N.; Rewerts, K.; Strenge, P.; Buschschlüter, S.; Kren, J.; Hagel, C.; Bonsanto, M.M.; Brinkmann, R.; Huber, R. Phase Unwrapping for MHz Optical Coherence Elastography and Application to Brain Tumor Tissue. Biomed. Opt. Express 2024, 15, 1038–1058. [Google Scholar] [CrossRef] [PubMed]
- Yang, Y.; Tang, M.; Xiong, W.; Luo, H.; Li, Z.; Yang, X.; Chen, W.; Hu, X.; He, X.; Yang, J. Quantitative Assessment of Biomechanical Changes in Oral Lesions at Different Cancerous Stages Using Optical Coherence Elastography. Quant. Imaging Med. Surg. 2025, 15, 4592–4607. [Google Scholar] [CrossRef]
- Gubarkova, E.V.; Sovetsky, A.A.; Matveev, L.A.; Matveyev, A.L.; Vorontsov, D.A.; Plekhanov, A.A.; Kuznetsov, S.S.; Gamayunov, S.V.; Vorontsov, A.Y.; Sirotkina, M.A.; et al. Nonlinear Elasticity Assessment with Optical Coherence Elastography for High-Selectivity Differentiation of Breast Cancer Tissues. Materials 2022, 15, 3308. [Google Scholar] [CrossRef]
- Qi, W.; Chen, R.; Chou, L.; Liu, G.; Zhang, J.; Zhou, Q.; Chen, Z. Phase-Resolved Acoustic Radiation Force Optical Coherence Elastography. J. Biomed. Opt. 2012, 17, 110505. [Google Scholar] [CrossRef]
- Rogowska, J.; Patel, N.; Plummer, S.; Brezinski, M.E. Quantitative Optical Coherence Tomographic Elastography: Method for Assessing Arterial Mechanical Properties. Br. J. Radiol. 2006, 79, 707–711. [Google Scholar] [CrossRef]
- Rogowska, J.; Patel, N.A.; Fujimoto, J.G.; Brezinski, M.E. Optical Coherence Tomographic Elastography Technique for Measuring Deformation and Strain of Atherosclerotic Tissues. Heart 2004, 90, 556–562. [Google Scholar] [CrossRef]
- Wang, T.; Pfeiffer, T.; Akyildiz, A.; van Beusekom, H.M.M.; Huber, R.; van der Steen, A.F.W.; van Soest, G. Intravascular Optical Coherence Elastography. Biomed. Opt. Express 2022, 13, 5418–5433. [Google Scholar] [CrossRef]
- Wijesinghe, P.; Johansen, N.J.; Curatolo, A.; Sampson, D.D.; Ganss, R.; Kennedy, B.F. Ultrahigh-Resolution Optical Coherence Elastography Images Cellular-Scale Stiffness of Mouse Aorta. Biophys. J. 2017, 113, 2540–2551. [Google Scholar] [CrossRef]
- Wang, S.; Singh, M.; Tran, T.T.; Leach, J.; Aglyamov, S.R.; Larina, I.V.; Martin, J.F.; Larin, K.V. Biomechanical Assessment of Myocardial Infarction Using Optical Coherence Elastography. Biomed. Opt. Express 2018, 9, 728–742. [Google Scholar] [CrossRef]
- Kearney, S.P.; Khan, A.; Dai, Z.; Royston, T.J. Dynamic Viscoelastic Models of Human Skin Using Optical Elastography. Phys. Med. Biol. 2015, 60, 6975. [Google Scholar] [CrossRef]
- Bartolini, L.; Feroldi, F.; Slaman, M.; Weda, J.J.A.; de Boer, J.F.; van Zuijlen, P.; Iannuzzi, D. Toward Clinical Elastography of Dermal Tissues: A Medical Device to Probe Skin’s Elasticity through Suction, with Subsurface Imaging via Optical Coherence Tomography. Rev. Sci. Instrum. 2020, 91, 074101. [Google Scholar] [CrossRef]
- Xu, H.; Xia, Q.; Shu, C.; Lan, J.; Wang, X.; Gao, W.; Lv, S.; Lin, R.; Xie, Z.; Xiong, X.; et al. In Vivo Endoscopic Optical Coherence Elastography Based on a Miniature Probe. Biomed. Opt. Express 2024, 15, 4237–4252. [Google Scholar] [CrossRef]
- Neidhardt, M.; Latus, S.; Eixmann, T.; Hüttmann, G.; Schlaefer, A. Deep Learning for High Speed Optical Coherence Elastography With a Fiber Scanning Endoscope. IEEE Trans. Med. Imaging 2025, 44, 1445–1453. [Google Scholar] [CrossRef] [PubMed]
- Fang, Q.; Curatolo, A.; Wijesinghe, P.; Yeow, Y.L.; Hamzah, J.; Noble, P.B.; Karnowski, K.; Sampson, D.D.; Ganss, R.; Kim, J.K.; et al. Ultrahigh-Resolution Optical Coherence Elastography through a Micro-Endoscope: Towards in Vivo Imaging of Cellular-Scale Mechanics. Biomed. Opt. Express 2017, 8, 5127. [Google Scholar] [CrossRef] [PubMed]
- Liang, X.; Boppart, S.A. Biomechanical Properties of In Vivo Human Skin from Dynamic Optical Coherence Elastography. IEEE Trans. Biomed. Eng. 2010, 57, 953–959. [Google Scholar] [CrossRef] [PubMed]
- Feng, X.; Li, G.-Y.; Ramier, A.; Eltony, A.M.; Yun, S.-H. In Vivo Stiffness Measurement of Epidermis, Dermis, and Hypodermis Using Broadband Rayleigh-Wave Optical Coherence Elastography. Acta Biomater. 2022, 146, 295–305. [Google Scholar] [CrossRef]
- Larin, K.V.; Sampson, D.D. Optical Coherence Elastography—OCT at Work in Tissue Biomechanics [Invited]. Biomed. Opt. Express 2017, 8, 1172–1202. [Google Scholar] [CrossRef] [PubMed]
- Zhang, G.; Feng, Z.; Li, C.; Huang, Z. Quantitative Assessment of Human Anisotropic Skin Elasticity Using the Dispersion Curve of Surface Acoustic Wave Elastography. J. Biophotonics 2025, e202500299. [Google Scholar] [CrossRef] [PubMed]
- Chen, D.; Yin, S.; Lu, X.; Fu, H.; Gao, H.; Zhang, S. Research on the Correlation Between Skin Elasticity Evaluation Parameters and Age. Cosmetics 2024, 11, 205. [Google Scholar] [CrossRef]
- van Haasterecht, L.; Bartolini, L.; Louter, J.M.I.; González, P.J.; Niessen, F.B.; Iannuzzi, D.; Groot, M.L.; van Zuijlen, P.P.M. Suction-Based Optical Coherence Elastography for the Biomechanical Characterization of Pathological Skin Conditions: A Pilot Study. J. Biophotonics 2024, 17, e202300314. [Google Scholar] [CrossRef]
- Zhang, Y.; Liao, J.; Feng, Z.; Yang, W.; Perelli, A.; Wang, Z.; Li, C.; Huang, Z. VP-Net: An End-to-End Deep Learning Network for Elastic Wave Velocity Prediction in Human Skin in Vivo Using Optical Coherence Elastography. Front. Bioeng. Biotechnol. 2024, 12, 1465823. [Google Scholar] [CrossRef]
- Liu, H.; Yang, D.; Jia, R.; Wang, W.; Shang, J.; Liu, Q.; Liang, Y. Dynamic Optical Coherence Elastography for Skin Burn Assessment: A Preliminary Study on Mice Model. J. Biophotonics 2024, 17, e202400028. [Google Scholar] [CrossRef]
- Liu, H.; Yang, D.; Jia, R.; Wang, W.; Shao, L.; Liu, Q.; Liang, Y. Severity Assessment of Burned Skin Based on Anisotropy of Optical Coherence Elastography. J. Innov. Opt. Health Sci. 2025, e202500299. [Google Scholar] [CrossRef]
- Du, Y.; Liu, C.-H.; Lei, L.; Singh, M.; Li, J.; Hicks, M.J.; Larin, K.V.; Mohan, C. Rapid, Noninvasive Quantitation of Skin Disease in Systemic Sclerosis Using Optical Coherence Elastography. J. Biomed. Opt. 2016, 21, 1. [Google Scholar] [CrossRef]
- Wang, C.; Zhu, J.; Ma, J.; Meng, X.; Ma, Z.; Fan, F. Optical Coherence Elastography and Its Applications for the Biomechanical Characterization of Tissues. J. Biophotonics 2023, 16, e202300292. [Google Scholar] [CrossRef] [PubMed]
- Singh, M.; Hepburn, M.S.; Kennedy, B.F.; Larin, K.V. Optical Coherence Elastography. Nat. Rev. Methods Primers 2025, 5, 39. [Google Scholar] [CrossRef]
- Alexandrovskaya, Y.M.; Sovetsky, A.A.; Kasianenko, E.M.; Matveyev, A.L.; Matveev, L.A.; Baum, O.I.; Zaitsev, V.Y. Visualizing Kinetics of Diffusional Penetration in Tissues Using OCT-Based Strain Imaging. Adv. Drug Deliv. Rev. 2025, 217, 115484. [Google Scholar] [CrossRef] [PubMed]
- Acosta Santamaría, V.A.; García, M.F.; Molimard, J.; Avril, S. Characterization of Chemoelastic Effects in Arteries Using Digital Volume Correlation and Optical Coherence Tomography. Acta Biomater. 2020, 102, 127–137. [Google Scholar] [CrossRef] [PubMed]
- Lawman, S.; Madden, P.W.; Romano, V.; Dong, Y.; Mason, S.; Williams, B.M.; Kaye, S.B.; Willoughby, C.E.; Harding, S.P.; Shen, Y.-C.; et al. Deformation Velocity Imaging Using Optical Coherence Tomography and Its Applications to the Cornea. Biomed. Opt. Express 2017, 8, 5579–5593. [Google Scholar] [CrossRef]
- Liu, C.H.; Singh, M.; Li, J.; Han, Z.; Wu, C.; Wang, S.; Idugboe, R.; Raghunathan, R.; Sobol, E.N.; Tuchin, V.V.; et al. Quantitative Assessment of Hyaline Cartilage Elasticity during Optical Clearing Using Optical Coherence Elastography. Sovrem. Tehnol. Med. 2015, 7, 44–51. [Google Scholar] [CrossRef]
- Bernardo, R.; Domingues, J.P.; Bernardes, R.; Morgado, A.M.; Batista, A. Evaluation of Skin Care Products Using Optical Coherence Elastography. In Proceedings of the Optical Elastography and Tissue Biomechanics X, San Francisco, CA, USA, 28–29 January 2023; Larin, K.V., Scarcelli, G., Vanholsbeeck, F., Eds.; SPIE: San Francisco, CA, USA, 2023; p. 35. [Google Scholar]
- Wang, S.; Larin, K.V. Optical Coherence Elastography for Tissue Characterization: A Review. J. Biophotonics 2015, 8, 279–302. [Google Scholar] [CrossRef]
- Zaitsev, V.Y.; Matveyev, A.L.; Matveev, L.A.; Sovetsky, A.A.; Hepburn, M.S.; Mowla, A.; Kennedy, B.F. Strain and Elasticity Imaging in Compression Optical Coherence Elastography: The Two-Decade Perspective and Recent Advances. J. Biophotonics 2021, 14, e202000257. [Google Scholar] [CrossRef]
- Baum, O.I.; Zaitsev, V.Y.; Yuzhakov, A.V.; Sviridov, A.P.; Novikova, M.L.; Matveyev, A.L.; Matveev, L.A.; Sovetsky, A.A.; Sobol, E.N. Interplay of Temperature, Thermal-Stresses and Strains in Laser-Assisted Modification of Collagenous Tissues: Speckle-Contrast and OCT-Based Studies. J. Biophotonics 2020, 13, e201900199. [Google Scholar] [CrossRef]
- Zaitsev, V.Y.; Matveev, L.A.; Matveyev, A.L.; Sovetsky, A.A.; Shabanov, D.V.; Ksenofontov, S.Y.; Gelikonov, G.V.; Baum, O.I.; Omelchenko, A.I.; Yuzhakov, A.V.; et al. Optimization of Phase-Resolved Optical Coherence Elastography for Highly-Sensitive Monitoring of Slow-Rate Strains. Laser Phys. Lett. 2019, 16, 065601. [Google Scholar] [CrossRef]
- Alexandrovskaya, Y.M.; Baum, O.I.; Sovetsky, A.A.; Matveyev, A.L.; Matveev, L.A.; Sobol, E.N.; Zaitsev, V.Y. Observation of Internal Stress Relaxation in Laser-Reshaped Cartilaginous Implants Using OCT-Based Strain Mapping. Laser Phys. Lett. 2020, 17, 085603. [Google Scholar] [CrossRef]
- Alexandrovskaya, Y.M.; Kasianenko, E.M.; Sovetsky, A.A.; Matveyev, A.L.; Atyakshin, D.A.; Patsap, O.I.; Ignatiuk, M.A.; Volodkin, A.V.; Zaitsev, V.Y. Optical Coherence Elastography with Osmotically Induced Strains: Preliminary Demonstration for Express Detection of Cartilage Degradation. J. Biophotonics 2024, 17, e202400016. [Google Scholar] [CrossRef] [PubMed]
- Sdobnov, A.Y.; Darvin, M.E.; Schleusener, J.; Lademann, J.; Tuchin, V.V. Hydrogen Bound Water Profiles in the Skin Influenced by Optical Clearing Molecular Agents-Quantitative Analysis Using Confocal Raman Microscopy. J. Biophotonics 2019, 12, e201800283. [Google Scholar] [CrossRef]
- Tikhonov, A.N.; Samarskii, A.A. Equations of Mathematical Physics; Dover Books on Physics; Dover Publications: Minniora, NY, USA, 2013; ISBN 978-0-486-17336-8. [Google Scholar]
- Kennedy, B.F.; Koh, S.H.; McLaughlin, R.A.; Kennedy, K.M.; Munro, P.R.T.; Sampson, D.D. Strain Estimation in Phase-Sensitive Optical Coherence Elastography. Biomed. Opt. Express 2012, 3, 1865–1879. [Google Scholar] [CrossRef] [PubMed]
- Matveyev, A.L.; Matveev, L.A.; Sovetsky, A.A.; Gelikonov, G.V.; Moiseev, A.A.; Zaitsev, V.Y. Vector Method for Strain Estimation in Phase-Sensitive Optical Coherence Elastography. Laser Phys. Lett. 2018, 15, 065603. [Google Scholar] [CrossRef]
- Zaitsev, V.Y.; Ksenofontov, S.Y.; Sovetsky, A.A.; Matveyev, A.L.; Matveev, L.A.; Zykov, A.A.; Gelikonov, G.V. Real-Time Strain and Elasticity Imaging in Phase-Sensitive Optical Coherence Elastography Using a Computationally Efficient Realization of the Vector Method. Photonics 2021, 8, 527. [Google Scholar] [CrossRef]
- Zykov, A.A.; Matveyev, A.L.; Matveev, L.A.; Assaad, M.; Zaitsev, V.Y. Computationally Efficient Adaptive Optimization of Vector-Method Parameters for Phase-Sensitive Strain Estimation in Optical Coherence Elastography. Laser Phys. Lett. 2024, 21, 085601. [Google Scholar] [CrossRef]
- Sovetsky, A.A.; Matveyev, A.L.; Matveev, L.A.; Gelikonov, G.V.; Zaitsev, V.Y. Mapping Large Strains in Phase-Sensitive OCT: Key Role of Supra-Pixel Displacement Tracking in Incremental Strain Evaluation. J. Biomed. Photonics Eng. 2022, 8, 030304. [Google Scholar] [CrossRef]
- De Luca, F.; Maraviglia, B.; Mercurio, A. Biological Tissue Simulation and Standard Testing Material for MRI. Magn. Reson. Med. 1987, 4, 189–192. [Google Scholar] [CrossRef]
- Choi, M.J.; Guntur, S.R.; Lee, K.I.; Paeng, D.G.; Coleman, A. A Tissue Mimicking Polyacrylamide Hydrogel Phantom for Visualizing Thermal Lesions Generated by High Intensity Focused Ultrasound. Ultrasound Med. Biol. 2013, 39, 439–448. [Google Scholar] [CrossRef]
- Datla, N.V.; Konh, B.; Koo, J.J.Y.; Choi, D.J.W.; Yu, Y.; Dicker, A.P.; Podder, T.K.; Darvish, K.; Hutapea, P. Polyacrylamide Phantom for Self-Actuating Needle-Tissue Interaction Studies. Med. Eng. Phys. 2014, 36, 140–145. [Google Scholar] [CrossRef]
- Zhong, X.; Cao, Y.; Zhou, P. Thermochromic Tissue-Mimicking Phantoms for Thermal Ablation Based on Polyacrylamide Gel. Ultrasound Med. Biol. 2022, 48, 1361–1372. [Google Scholar] [CrossRef] [PubMed]
- Alexandrovskaya, Y.M.; Kasianenko, E.M.; Sovetsky, A.A.; Matveyev, A.L.; Zaitsev, V.Y. Spatio-Temporal Dynamics of Diffusion-Associated Deformations of Biological Tissues and Polyacrylamide Gels Observed with Optical Coherence Elastography. Materials 2023, 16, 2036. [Google Scholar] [CrossRef]
- Tuchin, V.V.; Zhu, D.; Genina, E.A. (Eds.) Handbook of Tissue Optical Clearing: New Prospects in Optical Imaging; CRC Press: Boca Raton, FL, USA, 2022; ISBN 978-1-00-302525-2. [Google Scholar]
- Alexandrovskaya, Y.; Baum, O.; Sovetsky, A.; Matveyev, A.; Matveev, L.; Sobol, E.; Zaitsev, V. Optical Coherence Elastography as a Tool for Studying Deformations in Biomaterials: Spatially-Resolved Osmotic Strain Dynamics in Cartilaginous Samples. Materials 2022, 15, 904. [Google Scholar] [CrossRef]
- Szarko, M.; Muldrew, K.; Bertram, J.E. Freeze-Thaw Treatment Effects on the Dynamic Mechanical Properties of Articular Cartilage. BMC Musculoskelet. Disord. 2010, 11, 231. [Google Scholar] [CrossRef] [PubMed]
- Changoor, A.; Fereydoonzad, L.; Yaroshinsky, A.; Buschmann, M.D. Effects of Refrigeration and Freezing on the Electromechanical and Biomechanical Properties of Articular Cartilage. J. Biomech. Eng. 2010, 132, 064502. [Google Scholar] [CrossRef] [PubMed]
- Qu, C.; Hirviniemi, M.; Tiitu, V.; Jurvelin, J.S.; Töyräs, J.; Lammi, M.J. Effects of Freeze-Thaw Cycle with and without Proteolysis Inhibitors and Cryopreservant on the Biochemical and Biomechanical Properties of Articular Cartilage. Cartilage 2014, 5, 97–106. [Google Scholar] [CrossRef]
- Wen, L.; Grad, S.; Creemers, L.B.; Stoddart, M.J. Establishment of an Ex Vivo Cartilage Damage Model by Combined Collagenase Treatment and Mechanical Loading. Arthritis Res. Ther. 2025, 27, 30. [Google Scholar] [CrossRef] [PubMed]
- Wardale, J.; Mullen, L.; Howard, D.; Ghose, S.; Rushton, N. An Ex Vivo Model Using Human Osteoarthritic Cartilage Demonstrates the Release of Bioactive Insulin-like Growth Factor-1 from a Collagen-Glycosaminoglycan Scaffold. Cell Biochem. Funct. 2015, 33, 277–284. [Google Scholar] [CrossRef]
- Anderson, J.R.; Phelan, M.M.; Foddy, L.; Clegg, P.D.; Peffers, M.J. Ex Vivo Equine Cartilage Explant Osteoarthritis Model: A Metabolomics and Proteomics Study. J. Proteome Res. 2020, 19, 3652–3667. [Google Scholar] [CrossRef]
- Zaitsev, V.Y.; Matveyev, A.L.; Matveev, L.A.; Gelikonov, G.V.; Baum, O.I.; Omelchenko, A.I.; Shabanov, D.V.; Sovetsky, A.A.; Yuzhakov, A.V.; Fedorov, A.A.; et al. Revealing Structural Modifications in Thermomechanical Reshaping of Collagenous Tissues Using Optical Coherence Elastography. J. Biophotonics 2019, 12, e201800250. [Google Scholar] [CrossRef]
- Sobol, E.N.; Baum, O.I.; Shekhter, A.B.; Guller, A.; Baskov, A.V. Laser-Induced Regeneration of Cartilage. J. Biomed. Opt. 2011, 16, 080902. [Google Scholar] [CrossRef]
- Sobol, E.N.; Milner, T.E.; Shekhter, A.B.; Baum, O.I.; Guller, A.E.; Ignatieva, N.Y.; Omelchenko, A.I.; Zakharkina, O.L. Laser Reshaping and Regeneration of Cartilage. Laser Phys. Lett. 2007, 4, 488. [Google Scholar] [CrossRef]
- Genina, E.A.; Bashkatov, A.N.; Korobko, A.A.; Zubkova, E.A.; Tuchin, V.V.; Yaroslavsky, I.; Altshuler, G.B. Optical Clearing of Human Skin: Comparative Study of Permeability and Dehydration of Intact and Photothermally Perforated Skin. J. Biomed. Opt. 2008, 13, 021102. [Google Scholar] [CrossRef][Green Version]
- Sarri, B.; Chen, X.; Canonge, R.; Grégoire, S.; Formanek, F.; Galey, J.-B.; Potter, A.; Bornschlögl, T.; Rigneault, H. In Vivo Quantitative Molecular Absorption of Glycerol in Human Skin Using Coherent Anti-Stokes Raman Scattering (CARS) and Two-Photon Auto-Fluorescence. J. Control. Release 2019, 308, 190–196. [Google Scholar] [CrossRef] [PubMed]
- Oliveira, L.R.; Pinheiro, M.R.; Tuchina, D.K.; Timoshina, P.A.; Carvalho, M.I.; Oliveira, L.M. Light in Evaluation of Molecular Diffusion in Tissues: Discrimination of Pathologies. Adv. Drug Deliv. Rev. 2024, 212, 115420. [Google Scholar] [CrossRef]
- Choe, C.; Lademann, J.; Darvin, M.E. Analysis of Human and Porcine Skin in Vivo/Ex Vivo for Penetration of Selected Oils by Confocal Raman Microscopy. Ski. Pharmacol. Physiol. 2015, 28, 318–330. [Google Scholar] [CrossRef]
- Lademann, J.; Meinke, M.C.; Schanzer, S.; Richter, H.; Darvin, M.E.; Haag, S.F.; Fluhr, J.W.; Weigmann, H.J.; Sterry, W.; Patzelt, A. In Vivo Methods for the Analysis of the Penetration of Topically Applied Substances in and through the Skin Barrier. Int. J. Cosmet. Sci. 2012, 34, 551–559. [Google Scholar] [CrossRef]
- Petry, T.; Bury, D.; Fautz, R.; Hauser, M.; Huber, B.; Markowetz, A.; Mishra, S.; Rettinger, K.; Schuh, W.; Teichert, T. Review of Data on the Dermal Penetration of Mineral Oils and Waxes Used in Cosmetic Applications. Toxicol. Lett. 2017, 280, 70–78. [Google Scholar] [CrossRef] [PubMed]
- van Logtestijn, M.D.; Dominguez-Huttinger, E.; Stamatas, G.N.; Tanaka, R.J. Resistance to Water Diffusion in the Stratum Corneum Is Depth-Dependent. PLoS ONE 2015, 10, e0117292. [Google Scholar] [CrossRef]
- Stamatas, G.N.; de Sterke, J.; Hauser, M.; von Stetten, O.; van der Pol, A. Lipid Uptake and Skin Occlusion Following Topical Application of Oils on Adult and Infant Skin. J. Dermatol. Sci. 2008, 50, 135–142. [Google Scholar] [CrossRef]
- Gruber, J.V.; Terpak, N.; Massard, S.; Schwartz, A.; Bojanowski, K. Passive Enhancement of Retinol Skin Penetration by Jojoba Oil Measured Using the Skin Parallel Artificial Membrane Permeation Assay (Skin-PAMPA): A Pilot Study. Clin. Cosmet. Investig. Dermatol. 2023, 16, 317–324. [Google Scholar] [CrossRef]
- Alhasso, B.; Ghori, M.U.; Conway, B.R. Systematic Review on the Effectiveness of Essential and Carrier Oils as Skin Penetration Enhancers in Pharmaceutical Formulations. Sci. Pharm. 2022, 90, 14. [Google Scholar] [CrossRef]
- Ryabkov, M.; Sizov, M.; Bederina, E.; Zarubenko, P.; Peretyagin, P.; Moiseev, A.; Vorobiev, A.; Gladkova, N.; Zaitsev, V.; Kiseleva, E. Optical Coherence Tomography Angiography of the Intestine: How to Prevent Motion Artifacts in Open and Laparoscopic Surgery? Life 2023, 13, 705. [Google Scholar] [CrossRef]
- König, K.; König, A. Multiphoton Tomography in Cosmetic Research. Cosmetics 2025, 12, 44. [Google Scholar] [CrossRef]
- Zöller, N.N.; Kippenberger, S.; Thaçi, D.; Mewes, K.; Spiegel, M.; Sättler, A.; Schultz, M.; Bereiter-Hahn, J.; Kaufmann, R.; Bernd, A. Evaluation of Beneficial and Adverse Effects of Glucocorticoids on a Newly Developed Full-Thickness Skin Model. Toxicol. Vitr. 2008, 22, 747–759. [Google Scholar] [CrossRef] [PubMed]


Disclaimer/Publisher’s Note: The statements, opinions and data contained in all publications are solely those of the individual author(s) and contributor(s) and not of MDPI and/or the editor(s). MDPI and/or the editor(s) disclaim responsibility for any injury to people or property resulting from any ideas, methods, instructions or products referred to in the content. |
© 2025 by the authors. Licensee MDPI, Basel, Switzerland. This article is an open access article distributed under the terms and conditions of the Creative Commons Attribution (CC BY) license (https://creativecommons.org/licenses/by/4.0/).