Abstract
Several standards exist for testing the radiated “over the air” (OTA) performance of 5G User Equipment (UE) devices. All these standards are limited to a Single-Input Single-Output (SISO) evaluation of the 5G device. With 5G networks and devices already deployed and in operation, it becomes necessary to develop realistic Multiple-Input Multiple-Output (MIMO) and beamforming performance metrics for 5G UEs. Since the most important feature of 5G is beamforming, this paper reviews the main challenges to realistically evaluate 5G device performance and proposes several novel key performance indicators (KPIs). The results obtained by some measurements show that it is possible to derive figures of merit that address the complexity of beamforming and MIMO-based 5G performance of devices in a much better way compared with the existing SISO KPIs, and that academia should provide advanced future research on these more realistic KPIs for the industry to face the challenges ahead with a better analysis of the problem in hand.
Keywords:
new radio; beamforming MIMO; antennas; key performance indicators; device; over the air; testing 1. Introduction
New radio (NR) is eagerly being deployed to foster mobile communications around the globe. The millimeter-wave portion of the spectrum selected for early use (frequency range 2 or FR2) is also being installed, aiming to provide unheard-of throughputs and extremely low latencies, with a significant improvement in user’s perception of quality of service (QoS) and quality of experience (QoE). NR is also expected to handle an enormous number of devices connected to IP networks, some three times as high as the global population in 2021. To add complexity, a perceived availability of 99.999% and ultra-reliability are also envisioned as key features of 5G. Beamforming and massive MIMO (mMIMO) emerge as the miracle candidate technologies for providing such breakthroughs.
Using MIMO aims to exploit the different eigenvalues existing on the channel to obtain enhanced throughput values for the same signal-to-noise ratios. In multipath propagation conditions, each received antenna experiences a different fading environment. In consequence, multiple diversity dimensions can be exploited in receivers, and this is in fact a commonly used technique in current commercial user equipment- (UE-) integrated antenna MIMO arrays. In the race towards satisfying the expected growth, connectivity, availability and reliability, however, little attention is paid to effectively test how different beamforming techniques will actually develop what has been promised. Beyond the standardized single-input single-output (SISO) spherical coverage, no key performance indicator (KPI) has been clearly set to target a realistic evaluation of beamforming capabilities and performance, but rather to the simple possibility of existing and providing specific device pointing capabilities through Tx and Rx beam peak search algorithms. In practice, either the moving position of the device or its variable orientation makes it impossible to keep the device at beam peaks.
In this paper, the challenges that pose a threat to obtaining the desired performances in terms of spectral efficiencies (bits/s/Hz) with optimum spatial (mMIMO) and frequency (mm-wave) use will be described. In addition, some novel non-standardized performance metrics will be evaluated and described. Ultimately, the aim of this paper is to bring the attention to the need for new key performance indicators that can more realistically put overall 5G device performance into context. There is a clear gap between standardization-driven KPIs, based on beam-peaks and SISO parameters, and the ones that should be needed to properly characterize a device performance in the field, for which academia has an important role to play.
2. Challenges for 5G OTA Testing
2.1. Fully-Integrated Antenna Arrays
In addition to a densely antenna-populated layout within handsets, a progression of which is artistically illustrated in Figure 1, and unlike previous generations, 5G user-equipment (UE) antenna arrays do not provide access to their RF ports due to the small form factor and higher frequencies for some bands. Testing connectorless antenna arrays is an obvious challenge, which forces RF tests and calibrations to be performed “over the air” in a well-controlled environment. Phase calibration between the chains is typically required in addition to signalling performance and power measurements. The fact that coupling may occur, and due to the limitations of the testing enclosure, the coherent calibration of each RF chain may not necessarily lead to optimal beams. The presence of up or down conversion when operating at mm-wave frequencies further complicates the testing equipment.
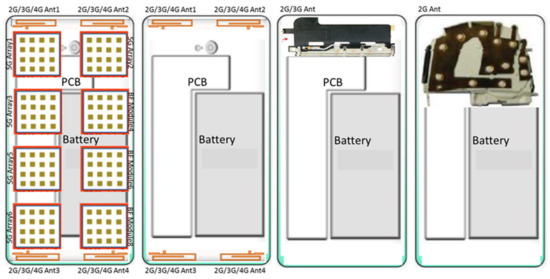
Figure 1.
The antenna layout evolution on UEs.
2.2. DUT Form Factors
Each device under test (DUT) form factor type has specific requirements and restrictions. Chipset 5G OTA measurements can be defined as the test that provides the chipset radio-frequency (RF) performance evaluation in the real standalone environment. It is good that chipsets are small since the mm-wave wavelengths of some 5G frequencies are also small, and therefore the issues with large far-field distances are minimized. The problem arises due to the fact that the chipsets usually do not have RF connectors and are also very fragile. Two other chipset-specific challenges for 5G OTA testing are the need to accurately control temperature and humidity cycling within the chamber due to the chipset being extremely sensitive to environmental conditions, something that is not at all a trivial task, and the fact that, for mass production, chipsets may need to be measured in the form of panels. With each panel containing a lot of similar types of chipsets, their accurate and individual 5G OTA testing becomes a very challenging task. Controlling the temperature and the humidity within any OTA test environment is also an extremely challenging task.
5G OTA UE testing is thought to be, at least initially, compatible with legacy 4G technologies. While it has been proposed that, in consequence, 4G OTA methods should be first attempted for the new 5G devices, it is also clear that 5G OTA testing will further complicate if we also have to support 4G OTA testing in a simultaneous manner. 5G Base Station (BS) testing, also referred to as next generation Node B testing or gNodeB (gNB) testing, in addition to their associated larger size, also requires phase coherency calibration, which is currently a concern due to the large number of channels. The specific OTA measurement challenges of high directivity beam performance, not only for the gNB end but also for the 5G UE end, would deserve their own manuscript, as would the specific antenna configuration or angular reuse in diversity [1]; this is because one side cannot be fully evaluated without the other side, and the role of each side is neither identical nor do they have the same maneuvering capabilities to search for better performances.
2.3. Spatial Agility
Spatial intelligence is considered the key performance aspect of 5G. The 3rd Generation Partnership Project (3GPP) has defined centered and off-center KPIs for static beams [2], but the beam dynamics are an inherent part of 5G. Processes such as beam searching [3], beam matching, beam tracking, beam forming or beam scheduling, among others, become essential when the UE moves dynamically. When the gNB incorporates massive MIMO (mMIMO), the spatial non-stationary property, the angular spreads and the 3D spatial properties cannot be ignored, and since the number of probe antennas is large, the channel between different probe antennas has a strong correlation, and removing the impact of the channel correlation across gNB antennas and probes remains an issue of concern. Finally, the addition of multiuser bidirectional channels introduces yet additional challenges to the OTA test. All these smart-beam-related factors can be condensed into the concept of beamforming performance. Beamforming leverages MIMO by dynamically transmitting data as highly focused beams. By beam steering such a highly focused beam, a stronger radio signal with higher data throughput is delivered over a greater distance using less energy, significantly increasing the network capacity and coverage while reducing interference. The algorithm used for beamforming, consequently, plays an important role in how effectively the target can be achieved.
Interestingly enough, the whole 5G gNB-UE end to end (E2E) set should have been considered to realistically characterize performance, but instead, all standardization bodies have set either UE or gNB performance metrics in an isolated manner. Getting accurate and realistic KPI evaluation versus range when using power-fix connectorless gNBs in one end and a moving UE on the other end should indeed be part of the work standards. For NR beam steering, beamforming or baseband beam-tracking algorithm performance testing, real-time throughput, latency and mobility tests can be identified as the base metric over which more complex KPIs could be derived.
2.4. Channel Modelling
Realistic channel modelling represents yet another key aspect of 5G OTA testing. Several studies have found some extensibility of the existing 3GPP channel models to be somehow applicable at higher frequency bands up to 100 GHz [4]. The measurements indicate that the smaller wavelengths introduce an increased sensitivity of the propagation models to the scale of the environment, which is to be expected, and show some frequency dependence of the path loss as well as increased occurrence of blockage. Furthermore, the penetration loss is highly dependent on the material and increases with increasing frequency of operation. The shadow fading and angular spread parameters are larger and the boundary between line of sight (LOS) and non-line of sight (NLOS) depends not only on antenna heights but also on the local environment. This has simplified some initial proposals, but the main drawback remains, that is, how to model a signal that is divided into several carriers and MIMO paths, which can extend from very different frequency bands. It is already verified that FR1 (Sub-6GHz) + FR2 (mm-wave) bands can be successfully combined, providing total user throughputs in excess of tenths of gigabits per second and new channel modelling challenges.
3. Novel Performance Metrics
For 4G, some novel throughput-based figures of merit were presented in [5] to respond to CTIA MOSG query for a global evaluation metric. 3GPP/CTIA LTE MIMO OTA Round Robin data were then used for validation of MIMO throughput effectiveness (MTE), which demonstrated a great potential for solving the operators’ top priorities regarding MIMO OTA compliance testing and performance evaluation. Both reverberation chamber (RC) based and anechoic chamber (AC) based methods were shown to be able to differentiate good from bad MIMO devices using MIMO throughput effectiveness (MTE).
Similarly, in this section, we propose several novel performance metrics for 5G OTA testing. The rationale behind the proposed new metrics and some initial test results are also illustrated for some of the metrics.
3.1. Averaged Spectral Efficiency (ASE)
This efficiency is defined as total data rate per unit bandwidth per unit area of a cellular system for a given maximum block error rate (BER). The ASE thus quantifies the tradeoff between the increased channel efficiency induced by a small frequency reuse and the decreased capacity of these channels resulting from the corresponding increase in co-channel interference. Closed-form analytical expressions of the average spectral efficiency for cellular systems are given in [6], when averaging over Rayleigh fading, and in [7], when assuming a Nakagami fading model. It seems clear that field ASE measurements are required to evaluate realistic cellular systems, and finding a realistic evaluation of ASE in the lab can certainly help its deployment.
3.2. Beamforming SNR Increase (BSNRI)
Using beamforming (BF) is a way of improving gain, as transmitter/receiver beam turns narrower (see Figure 2). In main beam direction, making use of BF offers an obtained gain, which is much better than obtained gain without BF. This bigger gain implies the obtainment of a better useful signal, but noise does not rise as consequence. Therefore, using this technique, the signal-to-noise-ratio (SNR) is enhanced. Using BF has consequences such as temperature increase or alignment losses. To evaluate if a communication is improved or not using BF the new KPI can be very useful as it can determine whether a better communication SNR condition is obtained or not.
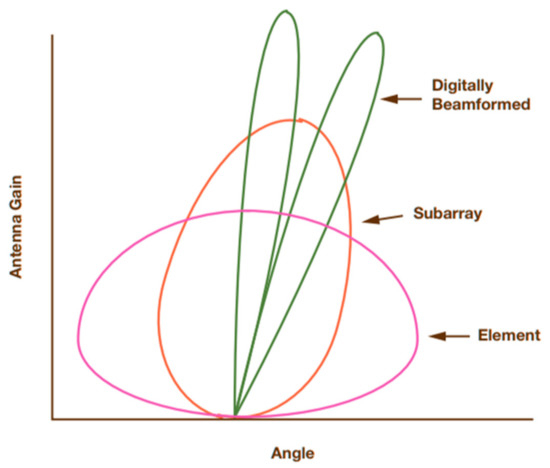
Figure 2.
Digital beamforming antenna patterns.
3.3. Beamforming Battery Consumption (BBC)
The need for different beamforming (BF) modules and their associated power amplifiers (PA) for the active antenna array make the UE effective isotropic radiated power (EIRP) increase compared with designs without BF. This has a clear impact on battery consumption, and with battery resources already scarce for cellular UEs, the capability of evaluating how the UE architecture and BF algorithm reduce the battery level is another important key performance indicator for 5G performance. OTA testing provides different values at different battery levels, and several test plans already impose the condition of testing with 70% battery level or more. With BBC, the user can make an estimation of power consumption (P), and with an estimation of the total harmonic distortion (THD), the measured BF signal-to-noise-ratio increase (BSNRI), the signal-to-noise-and-distortion (SINAD or SNDR) can be calculated, which in turn can lead to an estimation of the Schreier figure of merit (FOMs) for the 5G UE data converters by
where B is the analog bandwidth. Thus, reporting BBC can also be added as a valuable figure of merit for particular devices as it introduces a time limit for when that device can be effectively running its beamforming algorithm.
FOMs = SNDR + 10 log (B/P)
3.4. Beamforming Temperature Increase (BTI)
From the wireless hardware design point, the distributed phase array architecture at the 5G UE can help heat dissipation, mainly produced by the power amplifiers (PAs). The power-added efficiency (PAE) of the PAs is typically low (around 20%) and, consequently, the majority of the direct current (DC) power will be converted into thermal energy, which in turn increases the inner temperature of the 5G UE and potentially leads to a critical failure of the entire UE. This issue is more pronounced when multiple mmWave PAs are integrated in the BF modules, and the design distribution of these BF modules can help mitigate this self-heating issue. Some designs even require a self-cooling device, and being capable of testing the UE temperature increase for a particular test duration represents a good KPI for evaluating the 5G UE self-cooling capability. In order to use KPIs to compare or rank devices, their associated BTI should be similar.
3.5. Beamforming Capacity Gain (BCG)
To assess the capacity gain in 5G due to the inclusion of the beamforming technique, we can define a beamforming capacity gain as the gain that a 5G UE can experience due to beamforming when compared with the case when the 5G UE beamforming configuration is disabled or when 5G UE beamforming is simply not supported. BCG represents the spectral efficiency per channel bandwidth gain in dB due to beamforming. For 4G UEs, MIMO capacity (Bits/s/Hz) has been extensively studied and used as a way to compare RF-antenna designs, so an application for 5G could be straightforward.
BGC can therefore be very useful for MIMO design, development and compliance testing and has to be tested following a procedure. Testing a 5G device is clearly not the same as testing 4G devices since the 5G UE includes beamforming capabilities supporting, among others:
- -
- Automatic changes to the UE beamforming configuration, when in NR_RRC_CONNECTED state, in function of the MIMO channel state (i.e., the UE shall automatically change its beam state in function of the MIMO channel state in order to optimize its capacity when communicating to the base station).
- -
- A UE beam lock function (UBF) such that it can disable changes to the UE beamforming configuration when in NR_RRC_CONNECTED state (i.e., keeping the UE at its current beam state).
In an RC the use of several stirring states can be very useful to test BCG. Stepped mode-stirring samples can be used to change the MIMO channel state. The test procedure for BCG can be as follows:
- (1)
- Position the UE inside the RC and switch the downlink and/or the chamber to the first mode-stirring state.
- (2)
- Establish a connection between the 5G UE and the gNB through the chamber measurement antenna. The 5GUE beam will automatically be formed towards the RC measurement antenna in the UE RX beam peak direction for the first mode-stirring state (i.e., the initial MIMO channel state).
- (3)
- Determine the UE sensitivity S1 with 5G UE beamforming for this first mode-stirring state, i.e., the power level at which the throughput exceeds the requirements for the specified reference measurement channel and this initial MIMO channel state.
- (4)
- Switch the downlink and/or the RC to the next (i-th) mode-stirring state.
- (5)
- Determine the 5G UE sensitivity Si with UE beamforming for this i-th mode-stirring state, i.e., the power level at which the throughput exceeds the requirements for the specified reference measurement channel and this i-th MIMO channel state.
- (6)
- Repeat steps (4) and (5) for N mode-stirring states.
- (7)
- Calculate the resulting MIMO throughput sensitivity (MTS) with 5G UE beamforming (MTSWUEB) for the equivalent fading MIMO channel as:MTSWUEB = [1/S1 + 1/S2 + … + 1/SN]−1
- (8)
- Switch the downlink and/or the RC to the first mode-stirring state again. Thus, the UE beam will again be formed towards the measurement antenna in the UE RX beam peak direction for the initial MIMO channel state.
- (9)
- Lock the beam toward that direction for the entire duration of the test.
- (10)
- Determine the 5G UE sensitivity Ŝ1 without UE beamforming for this first mode-stirring state, i.e., the power level at which the throughput exceeds the requirements for the specified reference measurement channel and this initial MIMO channel state.
- (11)
- Switch the downlink and/or the RC to the next (i-th) mode-stirring state.
- (12)
- Determine the 5G UE sensitivity Ŝi without UE beamforming for this i-th mode-stirring state, i.e., the power level at which the throughput exceeds the requirements for the specified reference measurement channel and this i-th MIMO channel state.
- (13)
- Repeat steps (11) and (12) for N mode-stirring states.
- (14)
- Calculate the resulting MIMO Throughput Sensitivity without 5G UE beamforming (MTSWOUEB) for the equivalent fading MIMO channel as:MTSWOUEB = [1/Ŝ1 + 1/Ŝ2 + … + 1/ŜN]−1
Beamforming capacity gain (BCG) will therefore be calculated as:
Beamforming Capacity Gain (dB) = MTSWOUEB (dBm) MTSWUEB (dBm)
The picture below shows a BCG of 19.04 dB for a PC1 5G device, measured using an EMITE F200 RC.
The corresponding data statistics are shown in Table 1.

Table 1.
5G beamforming capacity gain statistics measured using an EMITE F200 reverberation chamber.
In an AC, the procedure can be similar, using different orientations of the DUT positioner instead of the stirring states. The figure below depicts BCG for the same PC1 device of Figure 3 measured using an EMITE H300 compact antenna test range (CATR) with θ limited to the range 0–60°, achieving a very similar BCG = 18.84 dB.
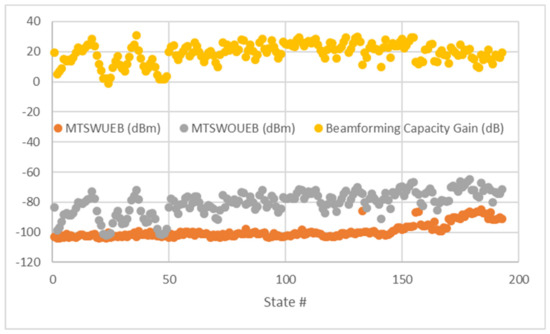
Figure 3.
5G beamforming capacity gain measured using an EMITE F200 reverberation chamber.
The BGC measured in AC, depicted in Figure 4, can be observed to follow either a Weibull or a Nakagami-m distribution, both being equivalent for certain parameters, as depicted in Figure 5.
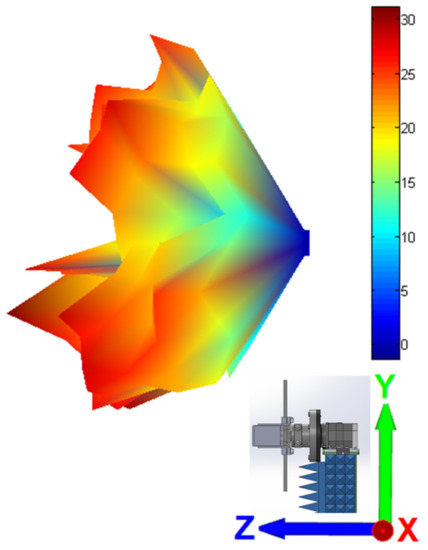
Figure 4.
5G beamforming capacity gain measured using an EMITE H300 anechoic chamber.
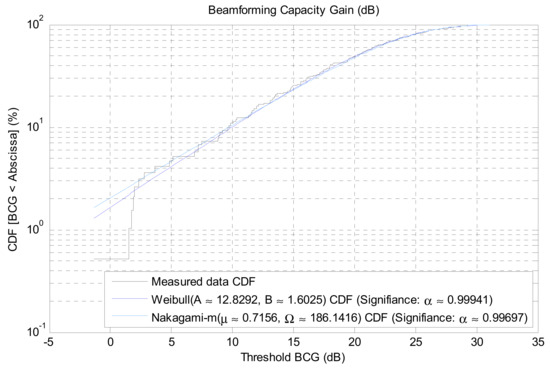
Figure 5.
Cumulative distribution function (CDF) of the 5G beamforming capacity gain measured using an EMITE H300 anechoic chamber.
3.6. Beamforming Averaged Latency (BAL)
The number of BF arrays and the effectiveness of the BF adaptive tracking algorithms for the gNB-UE link is another important KPI for 5G OTA. The two beams, one at the UE and one at the gNB, have to be precisely aligned with acceptable latency, and being capable of testing this performance is essential for 5G UEs. BAL can be tested for a pre-determined sequence of stirring states in an RC. Each specific stirring-state provides for an individual latency with respect to the previous state, and the average of all the measured latencies provide for the BAL KPI.
3.7. E2E Latency (E2EL)
Latency measurements are carried out by sending “ICMP echo request” (internet control message protocol, IMCP) packets from a PC connected to the gNB through an Ethernet bridge connection, and analyzing the “ICMP Echo Replay” packets received at a PC connected to the user equipment (UE) through another Ethernet bridge connection, which is the UE connected to the network created by the BS. In this way we obtain the end-to-end latency measurement in real time.
Figure 6 depicts some 5G FR1 gNB E2EL OTA tests using an EMITE F200 RC.
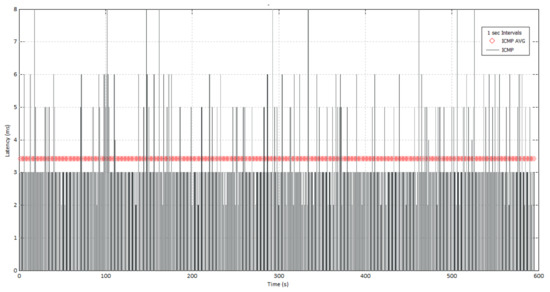
Figure 6.
5G gNB FR1 OTA E2E latency measured using an EMITE F200 reverberation chamber.
The corresponding data statistics are shown in Table 2.
Table 2.
G gNB FR1 OTA E2E latency statistics measured using an EMITE F200 reverberation chamber.
3.8. RF Latency (RFL)
By having a network protocol analyzer equipped on the PC connected to the UE described in the E2E latency KPI, the ICMP packets arriving from the PC connected to the BS can be filtered and analyzed, and thus, the base-band unit (BBU) latency can be measured, that is, the RF latency.
Figure 7 depicts some 5G FR1 gNB RFL OTA tests using an EMITE F200 RC. It is very interesting to observe that, unlike what is generally accepted, a big portion of the E2E latency cannot be attributed to the RF latency, which accounts for barely 0.13 ms out of 3.5 ms, (3.7%). Clearly, more research is called for in this matter.
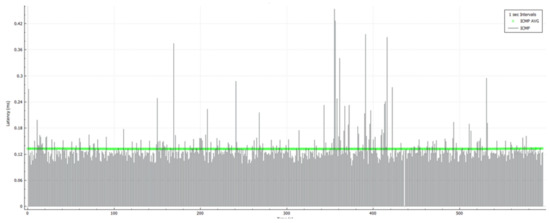
Figure 7.
5G gNB FR1 OTA RF latency measured using an EMITE F200 reverberation chamber.
3.9. DL/UL FTP/TCP/UDP Throughput
Throughput measurements are carried out by performing end-to-end measurements between the PCs described in the previous sections, at the corresponding protocol layer. For this purpose, a traffic generator has to be used in both PCs. Both downlink (DL) and uplink (UL) measurements can be carried out. Measuring IP (internet protocol) TPUT provides a set of curves depending on the specific protocol employed, so setting a simple metric over which evaluations can be performed is important. As an example of these curves, the final averaged DL and UL IP throughput measurements versus time for several conditions using an EMITE F200 RC are depicted in Figure 8. The measurements were performed using the transmission control protocol (TCP). Other possible protocols include file transfer protocol (FTP) and user datagram protocol (UDP). For 4G, CTIA set the MIMO throughput sensitivity (MTS) as a simple metric extracted from IP TPUT curves, representing the power loss value at a particular % of the maximum possible IP TPUT. This also seems to be a good idea to be applied for 5G.
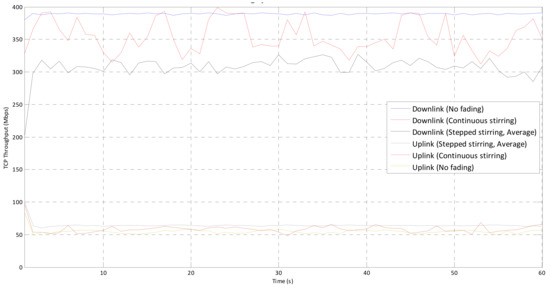
Figure 8.
5G gNB FR1 OTA average TCP throughput measured with an EMITE F200 reverberation chamber.
It has to be noted that the employed test method has an impact on the measured results. The introduction of an outdoor-to-indoor channel fading inherent to a reverberation chamber (RC), for example, clearly reduces static maximum throughput values [8]. The results using continuous stirring are also slightly different from those obtained using stepwise stirring, and the definition of a measurement uncertainty (MU) term becomes important.
It seems clear from Figure 8 that fading has an effect on IP TPUT. The effect of beamforming is not completely identified on averaged throughput metrics, but these can certainly help in understanding beamforming performance evaluation when in combination with other metrics. In particular, the maximum achievable downlink and uplink throughput values can be used against the theoretical ones to rank devices, something quite useful for defining pass/fail criteria.
3.10. True Throughput (TTPUT)
ACK stands for a signal showing that data have been received successfully, for example, with an acceptable pre-defined number of errors. NACK is typically sent by the recipient of a message (destination) back to the sender (source) after the receipt of an unrecognizable block of data. These ACK/NACK packets replied by the received are usually reported and can be used to conform more complex metrics since the ACK packets vary with time.
For 4G, throughput is typically derived using maximum theoretical throughput times received ACK ratio, that is, received ACKs divided by maximum possible ACK when receiving. This way does not offer the true transmitted throughput because it only depends on ACKs in spite of the receiver sending other packets such as NACKs. True transmitted throughput can be calculated using both ACKs and NACKs in order to account not only for the effective throughput, the packets received correctly and signaled by the receiver by returning ACK packets, but also the throughput associated with the packets received with some detected incorrectness, identified by the receiver by returning NACK packets.
Thus, the number of received packets can be calculated as all packets that had an ACK or a NACK as reply. These packets can be used to calculate this so-defined true throughput as:
3.11. Peak Downlink Throughput (PDLT)
A main characteristic of 5G technology is a very high throughput. As explained before in this paper, this is achieved by means of diverse techniques such as MIMO, beamforming, modulation schemes, and so on. Knowing the maximum or peak downlink throughput that a device can provide under a specific scenario can offer an approximation of how much information can be sent within a time interval. This simple KPI can therefore provide information about what type of services could correctly work for a downlink communication link. DL services may require specific throughput thresholds and a service may not operate correctly if a throughput bigger than PDLT is required. When in combination to latencies, this KPI can help determine the available quality of service.
3.12. Peak Uplink Throughput (PULT)
The maximum number of bits that the gNB can process within a time interval defines the maximum or peak uplink throughput. The gNB acts as the receiver, and PULT only depends upon data process velocity. This KPI is similar to PDLT but for uplink scenarios. With some already-informed uplink bottlenecks in massive events, setting PULT per device may help asymmetric beam and channel bandwidth assignments.
4. Conclusions
5G is expected to bring unheard-of benefits for the wireless communications industry when it becomes massively used, but it also carries the need for drastic changes in the way 5G devices are OTA tested today. Performance metrics and cost-efficient ways to measure 5G devices in a lab to provide results much closer to what the operation is in real networks in the field are urgently required. This will necessarily include testing in the main beam, testing in the presence of other radios in the same channel and testing the communication performance against interference from different directions; also evaluating the dynamic adaptation performance of both ends, the UE and the gNB sides, none of which were considered in this manuscript, while advanced KPIs such as the ones described in this paper are utterly needed for them.
While quite some progress has been made on 5G OTA testing, consensus-based 3GPP or CTIA standardization is far from reaching the goal. In fact, simple standardized SISO-based metrics are currently limiting the scope of what could be achieved in terms of solving the existing real 5G challenges. Failure to meet the expectations is unthinkable at this stage of the process, and developing accurate and realistic OTA test metrics is also the responsibility of the scientific community, who should provide the wireless communications industry with non-profit-oriented technically-based optimal solutions; solutions that can really provide what is being looked for. We still have time, but it is rapidly running out.
In this sense, several novel OTA performance metrics for 5G were proposed in this contribution, and some preliminary results were presented for some of them. Some preliminary results show that latency cannot be vastly associated with the RF portion of the path and that more dynamic UE-specific resources can be allocated when better metrics are used to determine communication link properties.
Future research shall cover the full development of these novel metrics and their comparisons, in order to develop broader scope 5G cellular systems evaluation methods. This would permit us to efficiently detect the root cause of possible defective performance elements in 5G cellular systems, beyond classifying “good” or “bad” user equipment or base stations. There is a clear need for academia to fill the gap between standardization-driven key performance indicators, based on beam-peaks and SISO parameters, and more realistic figures of merit for the overall evaluation of complex beamforming and mMIMO 5G devices and base station antennas. In particular, future research is needed to identify cell load situations in which 5G usage becomes commonplace and the new 5G beamforming, mMIMO and frequency exploitation techniques will be put to their limits.
Author Contributions
Conceptualization, M.Á.G.-F. and D.A.S.-H.; methodology, M.Á.G.-F. and D.A.S.-H.; software, M.Á.G.-F.; validation, M.Á.G.-F. and D.A.S.-H.; formal analysis, M.Á.G.-F. and D.A.S.-H.; investigation, M.Á.G.-F. and D.A.S.-H.; resources, D.A.S.-H.; data curation, M.Á.G.-F.; writing—original draft preparation, D.A.S.-H.; writing—review and editing, M.Á.G.-F. and D.A.S.-H.; visualization, M.Á.G.-F.; supervision, D.A.S.-H.; project administration, D.A.S.-H.; funding acquisition, D.A.S.-H. All authors have read and agreed to the published version of the manuscript.
Funding
This research was partially funded by the Spanish Ministry of Science and Innovation through research project EQC2018-005089-P.
Data Availability Statement
Data supporting reported results can be found at EMITE Ingeniería, S.L.
Conflicts of Interest
The authors declare no conflict of interest.
References
- Mora-Andreu, M.; Sánchez-Hernández, D.A. Novel Base Station MIMO Antennas with Enhanced Spectral Efficiencies Using Angular Reuse. Int. J. Antennas Propag. 2015, 2015, 150301. [Google Scholar] [CrossRef]
- 3GPP TR 38.810. NR; Study on Test Methods; v16.6.1, November 2020. Available online: https://portal.3gpp.org/desktopmodules/Specifications/SpecificationDetails.aspx?specificationId=3218 (accessed on 1 May 2021).
- 3GPP TS 38.521-2. NR; User Equipment (UE) Conformance Specification; Radio Transmission and Reception; Part 2: Range 2 Standalone; v16.7.0, April 2021. Available online: https://portal.3gpp.org/desktopmodules/Specifications/SpecificationDetails.aspx?specificationId=3385 (accessed on 1 May 2021).
- 3GPP TR 38.901. Study on Channel Model for Frequencies from 0.5 to 100 GH; v16.1.0, January. 2020. Available online: https://portal.3gpp.org/desktopmodules/Specifications/SpecificationDetails.aspx?specificationId=3173 (accessed on 1 May 2021).
- Marín-Soler, A.; Ypiña-García, G.; Belda-Sanchiz, Á.; Martínez-González, A.M. MIMO Throughput Effectiveness for Basic MIMO OTA compliance testing. Int. J. Antennas Propag. 2012, 2012, 495329. [Google Scholar] [CrossRef][Green Version]
- Wu, J.; Mehta, N.B.; Molisch, A.F.; Zhang, J. Unified Spectral Efficiency Analysis of Cellular Systems with Channel-Aware Schedulers. IEEE Trans. Commun. 2011, 59, 3463–3474. [Google Scholar] [CrossRef][Green Version]
- Dabhadkar, K.; Bhargava, A.; Bitragunta, S. Fading-Averaged Spectral Efficiency Analysis of Millimeter Wave Communication Links over Nakagami Fading Channels. In Proceedings of the 2019 IEEE International Conference on Electronics, Computing and Communication Technologies (CONECCT), Bangalore, India, 26–27 July 2019. [Google Scholar]
- Becker, M.G.; Horansky, R.D.; Senic, D.; Neylon, V.; Remley, K.A. Spatial channels for wireless over-the-air measurements in reverberation chambers. In Proceedings of the 12th European Conference on Antennas and Propagation (EuCAP 2018), London, UK, 9–13 April 2018. [Google Scholar]


Publisher’s Note: MDPI stays neutral with regard to jurisdictional claims in published maps and institutional affiliations. |
© 2021 by the authors. Licensee MDPI, Basel, Switzerland. This article is an open access article distributed under the terms and conditions of the Creative Commons Attribution (CC BY) license (https://creativecommons.org/licenses/by/4.0/).