1. Introduction
Power connectors installed in medium- and high-voltage power lines are usually placed in critical points of the power grid, being critical elements to ensure a reliable power dispatch. Probably because of their abundance, low cost and simplicity, they often are not being paid the attention they deserve, despite their key role in the reliability and availability of the power grid. Sudden power connector failure could induce important power outages with expensive and damaging consequences [
1]. It is difficult to find continuity of supply data because there are differences in the type of interruptions monitored, indicators used and data collection procedures applied in different countries. According to the Council of European Energy Regulators, the minutes lost per year in European countries due to planned interruptions range from 10 min to 500 min, whereas for unplanned interruptions, they range from 10 min to 1100 min [
2]. Operators of power systems work hard to offer a continuous, safe and reliable power delivery to their customers, thus trying to minimize the number and the effects of service outages [
3]. The application of predictive maintenance strategies based on the prediction or diagnosis of the state of health (SoH) allows achieving this goal.
The electrical resistance has been effectively used as an indicator of the SoH of electrical connectors [
4,
5]. It is known that the natural ageing process of the connector increases the electrical resistance along its lifetime [
6], thus increasing its operating temperature and tending to overheat the connector. This temperature increment, in turn, raises the electrical resistance, thus affecting the electrical and thermal behaviors of the connector [
7].
It is known that electrical resistance is characterized by two components, i.e., contact and bulk resistance [
8]. The bulk resistance component is almost defined by the geometry of the connector and the electrical resistivity of the constitutive materials. The contact resistance component includes two terms, the film and constriction resistance [
9]. It depends upon several inner factors (structure, connection material or surface topology), environment conditions (temperature, humidity or vibration), and working load (supply frequency or current) [
10]. Two predominant ageing processes affect the long-term performance of power connectors, i.e., contact pressure and chemical reactions generated at the matting interfaces. The contact resistance tends to increase with the cyclic pressure variations due to the daily peak and off-peak load patterns, as well as due to poor installation practices. Chemical reactions at the contact interface generate non-conductive compounds, which negatively affect the contact resistance [
11]. Due to its complexity, an exhaustive analysis of the time evolution of the contact resistance is a difficult task [
12].
Diagnosis of electrical and electronic systems has received much attention over the last few decades [
13]. Power lines and electrical substations are inspected periodically to determine their condition. However, due to the lack of online data, at present, the most applied inspection systems include manual, robot and unmanned aerial vehicle inspection [
14].
Condition monitoring is directly related to different methods for identifying changes occurring in a system due to the development of faults or the degradation of the SoH, thus generating an alarm to indicate a possible failure or degradation of the SoH [
15]. On-line condition monitoring is an active field of research in power systems [
16,
17,
18,
19]. To apply effective predictive maintenance strategies and to reduce maintenance and unexpected outages and shutdown costs, there is an imperious need to detect anomalous or degraded behavior modes in the early stage, when the degraded behavior is still developing. However, detecting abnormal behaviors at the early stage is not an easy subject, as slight changes are often difficult to diagnose, so great care has to be taken to minimize false alarm events [
20].
Real-time data acquisition and the associated deployment of distributed sensors is a key point for the expansion of intelligent power systems. Such systems allow a more stable and controllable power delivery since real-time data allow applying different condition monitoring strategies [
21]. Therefore, the online measurement of the electrical resistance using electronic devices is a key point for continuous monitoring of the electrical resistance of the connectors in order to develop effective SoH prediction tools. Voltage, current and temperature sensors can be used for nondestructive detection, location and diagnosis of faults in power systems. Traditionally, these sensors have been applied to diagnose the faults after their occurrence. Despite improvements in the system’s robustness, failures cannot be completely eliminated, and they are somewhat unpredictable, so maintenance operations are required before failure [
22]. There is a growing demand to develop prognostic methods to predict the faults in advance, i.e., when the system is fully operational, before major faults occurrence. This strategy allows operators to estimate the residual lifetime and to schedule predictive maintenance operations [
22]. In addition, suitable real-time analysis algorithms are key elements for this purpose [
23].
Although statistical methods have been widely used, they are not the best choice to tackle fault diagnosis problems because such methods estimate probability distributions based on large numbers of training samples [
24], which often are not available; thus, this strategy is costly and time-consuming. Different strategies can be applied to determine the SoH, including approaches based on physical-mathematical models, data-driven algorithms or hybrid approaches combining mathematical models and data-driven methods [
25,
26]. These last methods can perform better since they potentially combine the benefits of the two other approaches [
5]. Physical-mathematical models rely on a mathematical description of the physics or phenomena determining the degradation process, thus requiring little historical data. Contrarily, data-driven approaches predict the behavior of the system under analysis from historical data [
26] collected using different sensors and applying appropriate signal processing algorithms [
20]. Data-driven methods include different strategies, which can be based on statistics, time-series or artificial intelligence algorithms.
SoH and RUL estimation are currently hot research topics. A review of lithium-ion batteries prognosis methods is presented in [
27], where two main groups of models are described, i.e., model-based methods (they establish a degradation model based on a physicochemical description of the problem or on empirical correlations in large amounts of data) and data-driven methods (they do not use a physics model) approaches. In [
28], a data-driven approach based on machine learning was proposed to predict battery cycle life because it is suitable to predict the dynamic behavior of complex systems. In [
29], the finite element method was applied to estimate the fatigue life of the gas turbine blade.
There is an imperious need to develop effective SoH strategies. However, there is a lack of research works dealing with this topic for power connectors. It could be attributed to the fact that power connectors are considered simple elements, despite the critical role they play in power applications, and because they are still not instrumented, i.e., there is no electrical data available to monitor connectors’ performance.
This paper proposes predicting the SoH of power connectors by studying the degradation trajectory of the electrical resistance because it is a reliable indicator of power connectors’ performance [
30,
31]. Approaches based on the study of the degradation trajectory are gaining consideration [
32], but much work remains to be carried out in this area.
There is a scarcity of works related to the online SoH diagnosis of power connectors, this work presenting and assessing three simple alternatives with a reduced computational burden. The first method (linear fitting SoH or LF-SoH) predicts the SoH of each individual connector by comparing the last measured values of the resistance against the predictions determined by a least-squares linear regression model. The remaining two methods evaluated in this work are based on a non-linear model of the degradation trajectory of the contact resistance based on the Braunovic equation [
33], instead of assuming a linear degradation model. The second method (non-linear fitting SoH or NLF-SoH) directly determines the SoH by comparing the last measured values of the resistance against the predictions determined by a least-squares fitting of the Braunovic model [
33], while the third one applies the Markov chain Monte Carlo (MCMC) method [
34] for this purpose, so it is called MCMC-NLF-SoH. It is worth noting that the three methods compared in this work focus on each specific connector, being adapted to the particular characteristics of each power device, only requiring the past and current values of the electrical resistance to determine its SoH. The behavior of the analyzed methods is assessed by means of experimental data obtained from accelerated degradation tests (ADTs) since they are designed to analyze the long-term performance of power connectors by minimizing the testing time [
35] because due to their long lifetimes, it is not practical to acquire degradation data in an acceptable time. By measuring the voltage drop between the connectors’ terminals, the electrical current and the operating temperature, the degradation trajectory of the electrical resistance is continuously monitored, which is the base to predict the SoH.
Recently, different projects in line with the Internet of Things (IoT) are being developed for high-voltage equipment. They include different functions such as self-diagnosis, wireless communications [
36], the use of different sensors [
4,
37] and energy harvesting units.
Electrical substations are usually inspected visually or using thermal and/or ultraviolet cameras, thus applying preventive maintenance strategies. These tasks require specialized technicians and scheduled inspections, thus resulting in expensive and difficult to apply under adverse weather conditions. Smart connects will allow shifting from preventive to predictive maintenance. However, the implementation of smart connectors in a real high-voltage environment is not fully developed, being a challenging task due to the complex systems involved, including energy harvesting, sensing systems and wireless communications.
The contributions of this paper are as follows. First, it contributes to develop and test methods with low computational requirements for an online SoH prediction of electrical connectors from experimental data. This is an area with a clear lack of research works. Second, the methods here analyzed are appealing because of their simplicity and fast response, thus being compatible with low-cost microcontrollers that soon will integrate the new generations of smart connectors.
Third, the solution proposed in this paper is in line with the development of smart grids, digital substations and the Internet of Things (IoT), where predictive maintenance, prediction of the remaining useful life and the SoH are trending topics. However, installed power connectors do not include these developments, this paper making a clear development in this field. Fourth, the strategy exposed in this work adapts to the particular behavior and evolution of each connector since it is known that there is huge variability among connectors. This approach is able to anticipate severe faults, thus allowing to control and limit connectors’ degradation process while enabling to apply predictive maintenance plans. Finally, the methods described in this paper present reduced computational requirements, being possible to be applied in real-time and can be easily adapted to determine the SoH of many other power devices.
4. The Applied Heat Cycle Tests (HCTs) and the Equipment Involved
As explained, ADTs are commonly applied to obtain degradation data defining the behavior of the studied system in a fast manner. To this end, HCTs were performed in the high-current laboratory of the Universitat Politècnica de Catalunya according to the requirements of the IEC 61238-1-3:2018 standard [
11]. It is noted that data acquired from the HCTs are used to simulate the online acquired data from a real application.
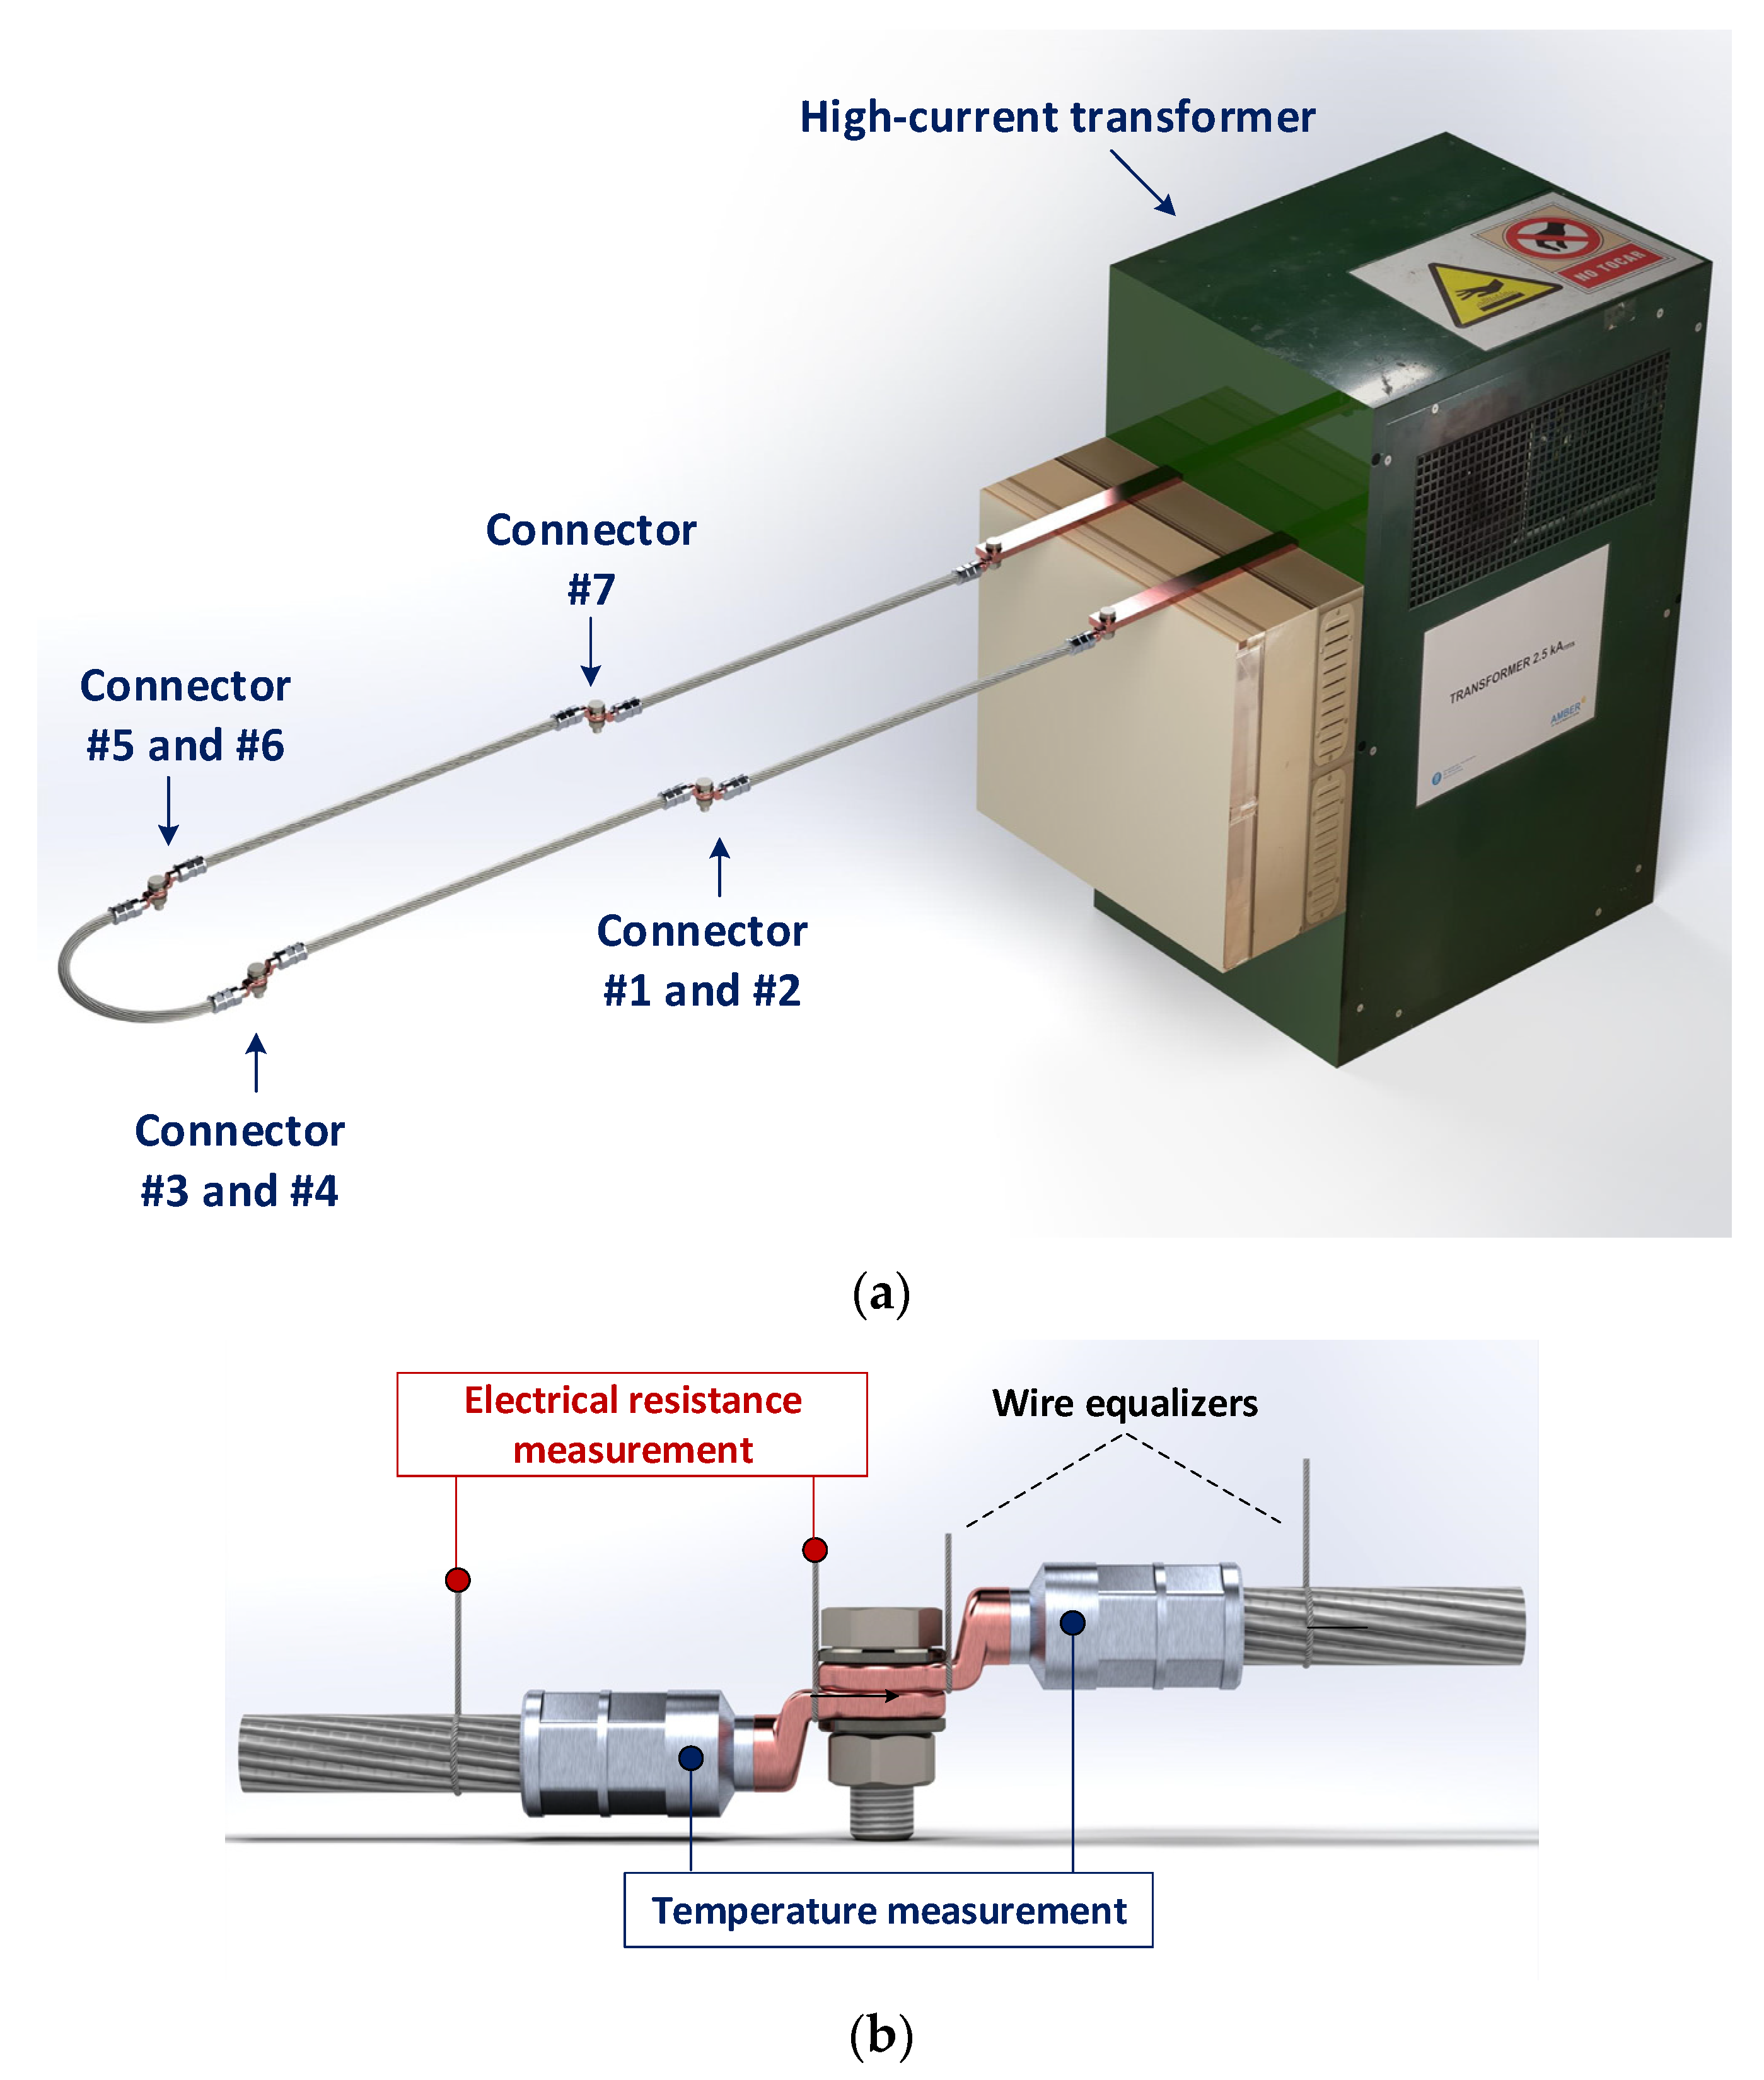
HCTs were performed using an electrical loop consisting of seven ICAU120 bimetallic connectors joined to a 120 mm
2 aluminum conductor.
Figure 1a shows the experimental loop and the connectors. The voltage drop across the terminal points of the seven connectors using wire equalizers (see
Figure 1b), the current in the loop and the temperature of each connector were measured to determine the electrical resistance of all connectors.
To accelerate the natural ageing of the connectors, around 140 HCTs were run for about 92 h. Heat cycles consist of two phases, namely heating and cooling phases. The consecutive heating and cooling cycles induce thermal expansion and contraction cycles, which affect the contact interface and thus the contact resistance of the connectors, which in turn alter their electrical and thermal performances.
During the heating phase, an alternating electrical current is injected into the loop until the reference aluminum conductor reaches the thermal equilibrium at a temperature of 120 °C, the condition attained when injecting an electrical current of about 370 ARMS. This temperature is superior to 90 °C, the temperature recommended by the conductor’ manufacturer, thus accelerating the thermal degradation process.
According to the IEC 61238-1-3:2018 [
11], this electrical current must be maintained for 15 min after attaining the thermal equilibrium. After this time, the current is switched off so that it cools down to ambient temperature with the help of forced ventilation fans, and next, a new heat cycle can start.
HCTs were performed using a high-current 400 V/6 V variable transformer, supplying the electrical loop as shown in
Figure 1a. The rated output of this transformer is 6 V
RMS and 2.5 kA
RMS. A Rogowski coil with a sensitivity of 0.06 mV/A (500LFxB from PEM, Nottingham, UK) was used to measure the electrical current flowing in the loop. The voltage drop waveforms between the external terminals of the connectors were acquired using a USB-6210 DAQ instrument (National Instruments, Austin, TX, USA) with 8 differential inputs. To transform the resistance of the connectors to 20 °C, T-type thermocouples were used, jointly with a USB TC-08 thermocouple data acquisition module (Omega, Bienne, Switzerland).
6. The Proposed SoH Approach
This section describes the methods applied to predict the SoH of the power connectors. As explained, three methods are compared to determine the SoH of the connector. They are named linear fitting model (LF-SoH), non-linear fitting model (NLF-SoH) and Markov chain Monte Carlo non-linear model (MCMC-NLF-SoH), and are described in the following subsections. The three methods predict the value of the resistance based on measured past values, as shown in
Figure 2.
As shown in
Figure 2, the algorithm predicts the SoH of the connector at the present time
t0, based on the model generated considering the degradation path of the resistance within some pre-established time intervals (fitting interval; blue area in
Figure 2). Centered at the present time
t0, the algorithm takes the past values of the resistance (blue area in
Figure 2) and fits the measured values of the resistance to a given equation, which corresponds to a straight line in the LF-SoH approach or to Equation (2) in the NLF-SoH and MCMC-NLF-SoH approaches. Next, the confidence intervals of the regression coefficients are determined, and the resulting regressions are plotted (gray areas in
Figure 2). The difference between the NLF-SoH and MCMC-NLF-SoH lies in how the regression coefficients and their confidence intervals are determined. This is detailed in the next subsections. Next, based on the predictions of the model at points
t0, t-1, t-2, t-3 and
t-4, the SoH is predicted according to the strategy proposed in
Figure 3.
Figure 3 summarizes the steps of the proposed approach. The first step consists of measuring the present value of the electrical resistance. This is carried out by measuring online the temperature of the connector and the current and voltage drop to determine the resistance by applying Equation (1). Next, the best fitting of the linear degradation model (LF-SoH) or non-linear degradation model given by Equation (2) (NLF-SoH and MCMC-NLF-SoH) is found based on the least-squares algorithm (LF-SoH and NLF-SoH) or the Markov chain Monte Carlo (MCMC) algorithm (MCMC-NLF-SoH), respectively. At this stage, the coefficients of the linear and non-linear models, as well as their confidence intervals, are estimated. Next, a short-term extrapolation based on the obtained regression curves (see the brown curve and the gray areas in
Figure 2) is made at points
t0,
t-1,
t-2,
t-3 and
t-4. The measured values of the resistance at points
t0,
t-1,
t-2, t-3 and
t-4 and those predicted by the regression models are compared to determine the SoH of the connector, as detailed in the next subsection.
6.1. Resistance Comparison to Determine the SoH
Figure 3 summarizes the method proposed in this paper to predict the SoH of the connectors. The LF, NLF and MCMC-NF models are fitted using the measurements obtained during the last 10 h (fitting interval; blue area in
Figure 2) and the mean values of the resistance at points
t0, t-1, t-2, t-3 and
t-4 and the lower and upper bounds,
lb and
ub, respectively, are extrapolated by the regression models based on the least-squares values of the model coefficients and their confidence intervals. These are compared against the measured values. The SoH of the connector is predicted from this comparison, which is based on the end-of-life (EOL) and near-EOL (nEOL) of each specific connector. The EOL is defined as 1.4
R0 [
5], whereas the nEOL is taken as 1.3
R0. The nEOL condition is used to define a warning condition before reaching the
EOL condition since, at this point, the connector must be replaced by a new one to prevent sudden failures and system malfunctioning. This approach allows predicting the SoH of the connectors according to three states, namely healthy, warning and faulty condition, thus facilitating the application of predictive maintenance plans and allowing to schedule maintenance actions.
To categorize the current state of the connector as healthy, warning or faulty, a score is given to each state (
hcount, wcount and
fcount are the healthy, warning and faulty state counters that provide the final scores) based on the current value of the measured resistance
R, as detailed in
Figure 3, so that the predicted SoH of the connector is attributed to the most scored state (healthy, warning or faulty).
6.2. SoH Prediction According to the LF-SoH, NLF-SoH and MCMC-NLF-SoH Methods
The LF-SoH method predicts the values of the resistance by linearly fitting the past measured values to a straight line. It assumes that the resistance degradation trajectory follows a straight line. By applying the least-squares algorithm, both the coefficients of the linear regression and the confidence intervals of such coefficients are found. The confidence intervals allow confining the predicted values of the resistance within the lower and upper boundaries they define.
Similarly, the NLF-SoH method predicts the values of the resistance by fitting the past measured values to Equation (2), describing the degradation trajectory of the resistance according to Braunovic’s model. The coefficients in Equation (2) and their confidence intervals are also found by applying the least-squares algorithm.
The MCMC-NLF-SoH applies the Markov chain Monte Carlo (MCMC) method [
34] to find both the values of the coefficients
R0 and
τ in Equation (2) and their confidence intervals based on the past experimental data. MCMC generates
n random samples (3000 samples in this paper [
38,
39]) of the coefficients
R0 and
τ for each simulated time
t (
t correspond to time points of the last 10 h), thus obtaining a matrix of resistances with
n rows and
t columns. Next, each column is sorted from highest to lowest resistance, and the 99.5th and 0.5th percentiles are calculated (99% confidence interval). Finally, these values are plotted versus time, as shown in
Figure 2. More information about this process can be found in [
34].
All codes were programmed by the authors of this work in the MATLAB® environment.
9. Conclusions
Power connectors are critical elements in power lines and networks, so their failure can lead to important consequences, including power outages, safety-related issues and economic losses. Thus, there is an increasing need to continuously monitor their performance in order to ensure high reliability by anticipating the fault condition before occurrence. With the development of low-cost sensors and wireless communications systems compatible with the Internet of Things, this topic is receiving much attention and interest because these developments facilitate the application of predictive maintenance approaches. Despite the enormous implications of future developments in this area, there is a scarcity of works dealing with this topic applied to power connectors, this paper contributing to this field.
This work has presented, analyzed and compared the behavior of three methods for an online determination of the SoH of power connectors, namely LF-SoH, NLF-SoH and MCMC-NLF-SoH. These methods were selected based on simplicity, low computational requirements and adaptation to the particular characteristics and behavior of each connector. They rely on monitoring the degradation trajectory of the electrical resistance of the connectors, thus detecting changes that allow anticipating the fault before occurrence so that predictive maintenance actions can be applied. The resistance is used as an indicator of their SoH because it is known that degradation of the connectors’ thermal end electrical behavior is associated with changes of this magnitude. To obtain reliable and realistic data, seven medium voltage connectors were subjected to accelerated heat cycle tests. The electrical resistance of the seven connectors was monitored by measuring the temperature, electrical current and voltage drop across the terminal points of the connectors.
From the experimental validation carried out in this research work, it is concluded that although the three methods show comparable results, the LF-SoH method is the fastest one due to its simplicity, whereas the MCMC-NLF-SoH algorithm is the one requiring more computational resources.
The results presented show the fast and accurate response and reduced computational burden of the three assessed methods and their potential to predict the SoH of power connectors. This approach can also be applied to many other power devices and components.
The results presented in this work are intended to assess the feasibility and potential to apply the proposed method to predict the SoH of substation connectors instead of medium voltage connectors. For future work, this requires including an energy harvesting unit, several sensors (temperature, voltage drop and current) and wireless communications [
4].


