
Longitudinal Control for Connected and Automated Vehicles in Contested Environments


Abstract
:1. Introduction
- Level 0: drivers perform entire dynamic driving tasks;
- Level 1: driver assistance systems execute either longitudinal or lateral vehicle motion control subtask, and drivers perform all remaining dynamic driving tasks;
- Level 2: driver assistance systems execute both longitudinal and lateral vehicle motion control subtasks, and drivers perform all remaining dynamic driving tasks;
- Levels 3–5: automated driving systems perform entire dynamic driving tasks [1].
- Verification scale: Vehicle dynamics simulation tools cannot simulate many vehicles in each scenario.
- Verification resolution: Conventional traffic microsimulation tools cannot estimate microscopic (e.g., reduction in distance gaps and time gaps) or macroscopic (e.g., increase in road capacity) benefits associated with driving automation or cooperative driving automation with reasonable accuracy;
- Vehicle powertrain (i.e., engine, transmission, and driveline): Conventional traffic microsimulation tools do not simulate vehicle powertrain;
- Maximum acceleration and maximum deceleration: Conventional traffic microsimulation tools estimate or use constant maximum accelerations and maximum decelerations. Aimsun considers maximum acceleration of 8.2 ft/s and maximum deceleration of 6.6 ft/s as default [5]. Vissim estimates maximum acceleration as and maximum deceleration as , where is maximum acceleration (m/s), v is speed (m/s), and is maximum deceleration (m/s) [5]—since all units in Vissim User Manual are metric, metric units are preferred to report these regression models with full precision. However, maximum acceleration and maximum deceleration are sensitive to vehicle model, grade, pavement conditions, and traffic conditions;
- Longitudinal control variables: Conventional longitudinal control functions (e.g., Adaptive Cruise Control (ACC), Cooperative Adaptive Cruise Control (CACC)) rely on constant distance gaps, time gaps, and controller coefficients, potentially sacrificing safety (i.e., when short gaps are set) or reducing road capacity (i.e., when long gaps are set). Conventional traffic microsimulation tools rely on user inputs for distance gap, time gap, and longitudinal controller coefficients (e.g., proportional, integral, and derivative) to simulate vehicles in a platoon or string. However, distance gap, time gap, and longitudinal controller coefficients are sensitive to driver characteristics, vehicle model, grade, pavement conditions, operating mode, malicious fault magnitude, and traffic conditions.
- Contested environments: Onboard sensor measurements and transmitted messages are inherently prone to noise, natural fault, and malicious fault. Minor faults may lead to malfunction or even failure if not responded promptly. A single cyberattack can cost an average original equipment manufacturer $1.6 billion a year, assuming one individual recall costs $800 [6]. From 2010 to 2021, 367 cyberattacks on connected vehicles have been reported [6].A cyberattack can exploit one user application’s vulnerabilities (e.g., spoofing, data falsification, and replay attacks) or multiple user application vulnerabilities (e.g., denial-of-service attack), leading to severe consequences for vehicle and potentially its operating environment [7]. Spoofing, data falsification, replay, and denial-of-service attacks are common cyberattacks on connected vehicles [8]. Spoofing attack is when hackers steal authentication credentials or use a legitimate vehicle’s identity to send unchanged or manipulated messages to other vehicles; data falsification attack is when hackers read, insert, or modify transmitted messages; replay attack is when hackers copy a message stream between two vehicles and repeat that stream to other vehicles; denial-of-service attack is when hackers prevent or interfere with target vehicles from receiving specific messages.Conventional fault detection methods are broadly classified into model-driven and data-driven methods [9]. Model-driven methods (e.g., unknown input observer and Kalman filter) require partial plant model; data-driven methods (e.g., neural network) require measured inputs and outputs under normal and faulty conditions to derive plant model. Model-driven methods are more computationally intensive but more accurate than data-driven methods [10].Conventional traffic microsimulation tools do not simulate contested environments. A simple strategy is to rely on onboard sensor measurements when there is a significant discrepancy between onboard sensor measurements and transmitted messages [11].
- Verification scale: simulate many vehicles in each scenario;
- Vehicle powertrain: simulate vehicle powertrain;
- Maximum acceleration and maximum deceleration: estimate maximum acceleration and maximum deceleration with reasonable accuracy at each simulation time step, considering vehicle model, grade, pavement conditions, and traffic conditions;
- Distance gap and time gap: estimate minimum safe distance gap and minimum safe time gap with reasonable accuracy at each simulation time step for vehicles dedicated to automated driving systems or equipped with cooperative automated driving systems, considering vehicle model, grade, pavement conditions, operating mode, vehicle-to-vehicle communication vulnerabilities, and traffic conditions;
- Longitudinal controller coefficients: estimate longitudinal controller coefficients (i.e., proportional, integral, and derivative gains) with reasonable accuracy at each simulation time step for vehicles dedicated to automated driving systems, considering vehicle model, grade, pavement conditions, and traffic conditions;
- Contested environments: employ a reduced-order Kalman filter unknown input observer to estimate distance gap, speed, and acceleration with reasonable accuracy at each simulation time step for vehicles dedicated to automated driving systems or equipped with cooperative automated driving systems under noise (e.g., measurement noise and process noise) and unknown inputs (e.g., noise with unknown statistics, natural fault, and malicious fault).
2. Literature Review
3. Proposed Traffic Microsimulation Tool
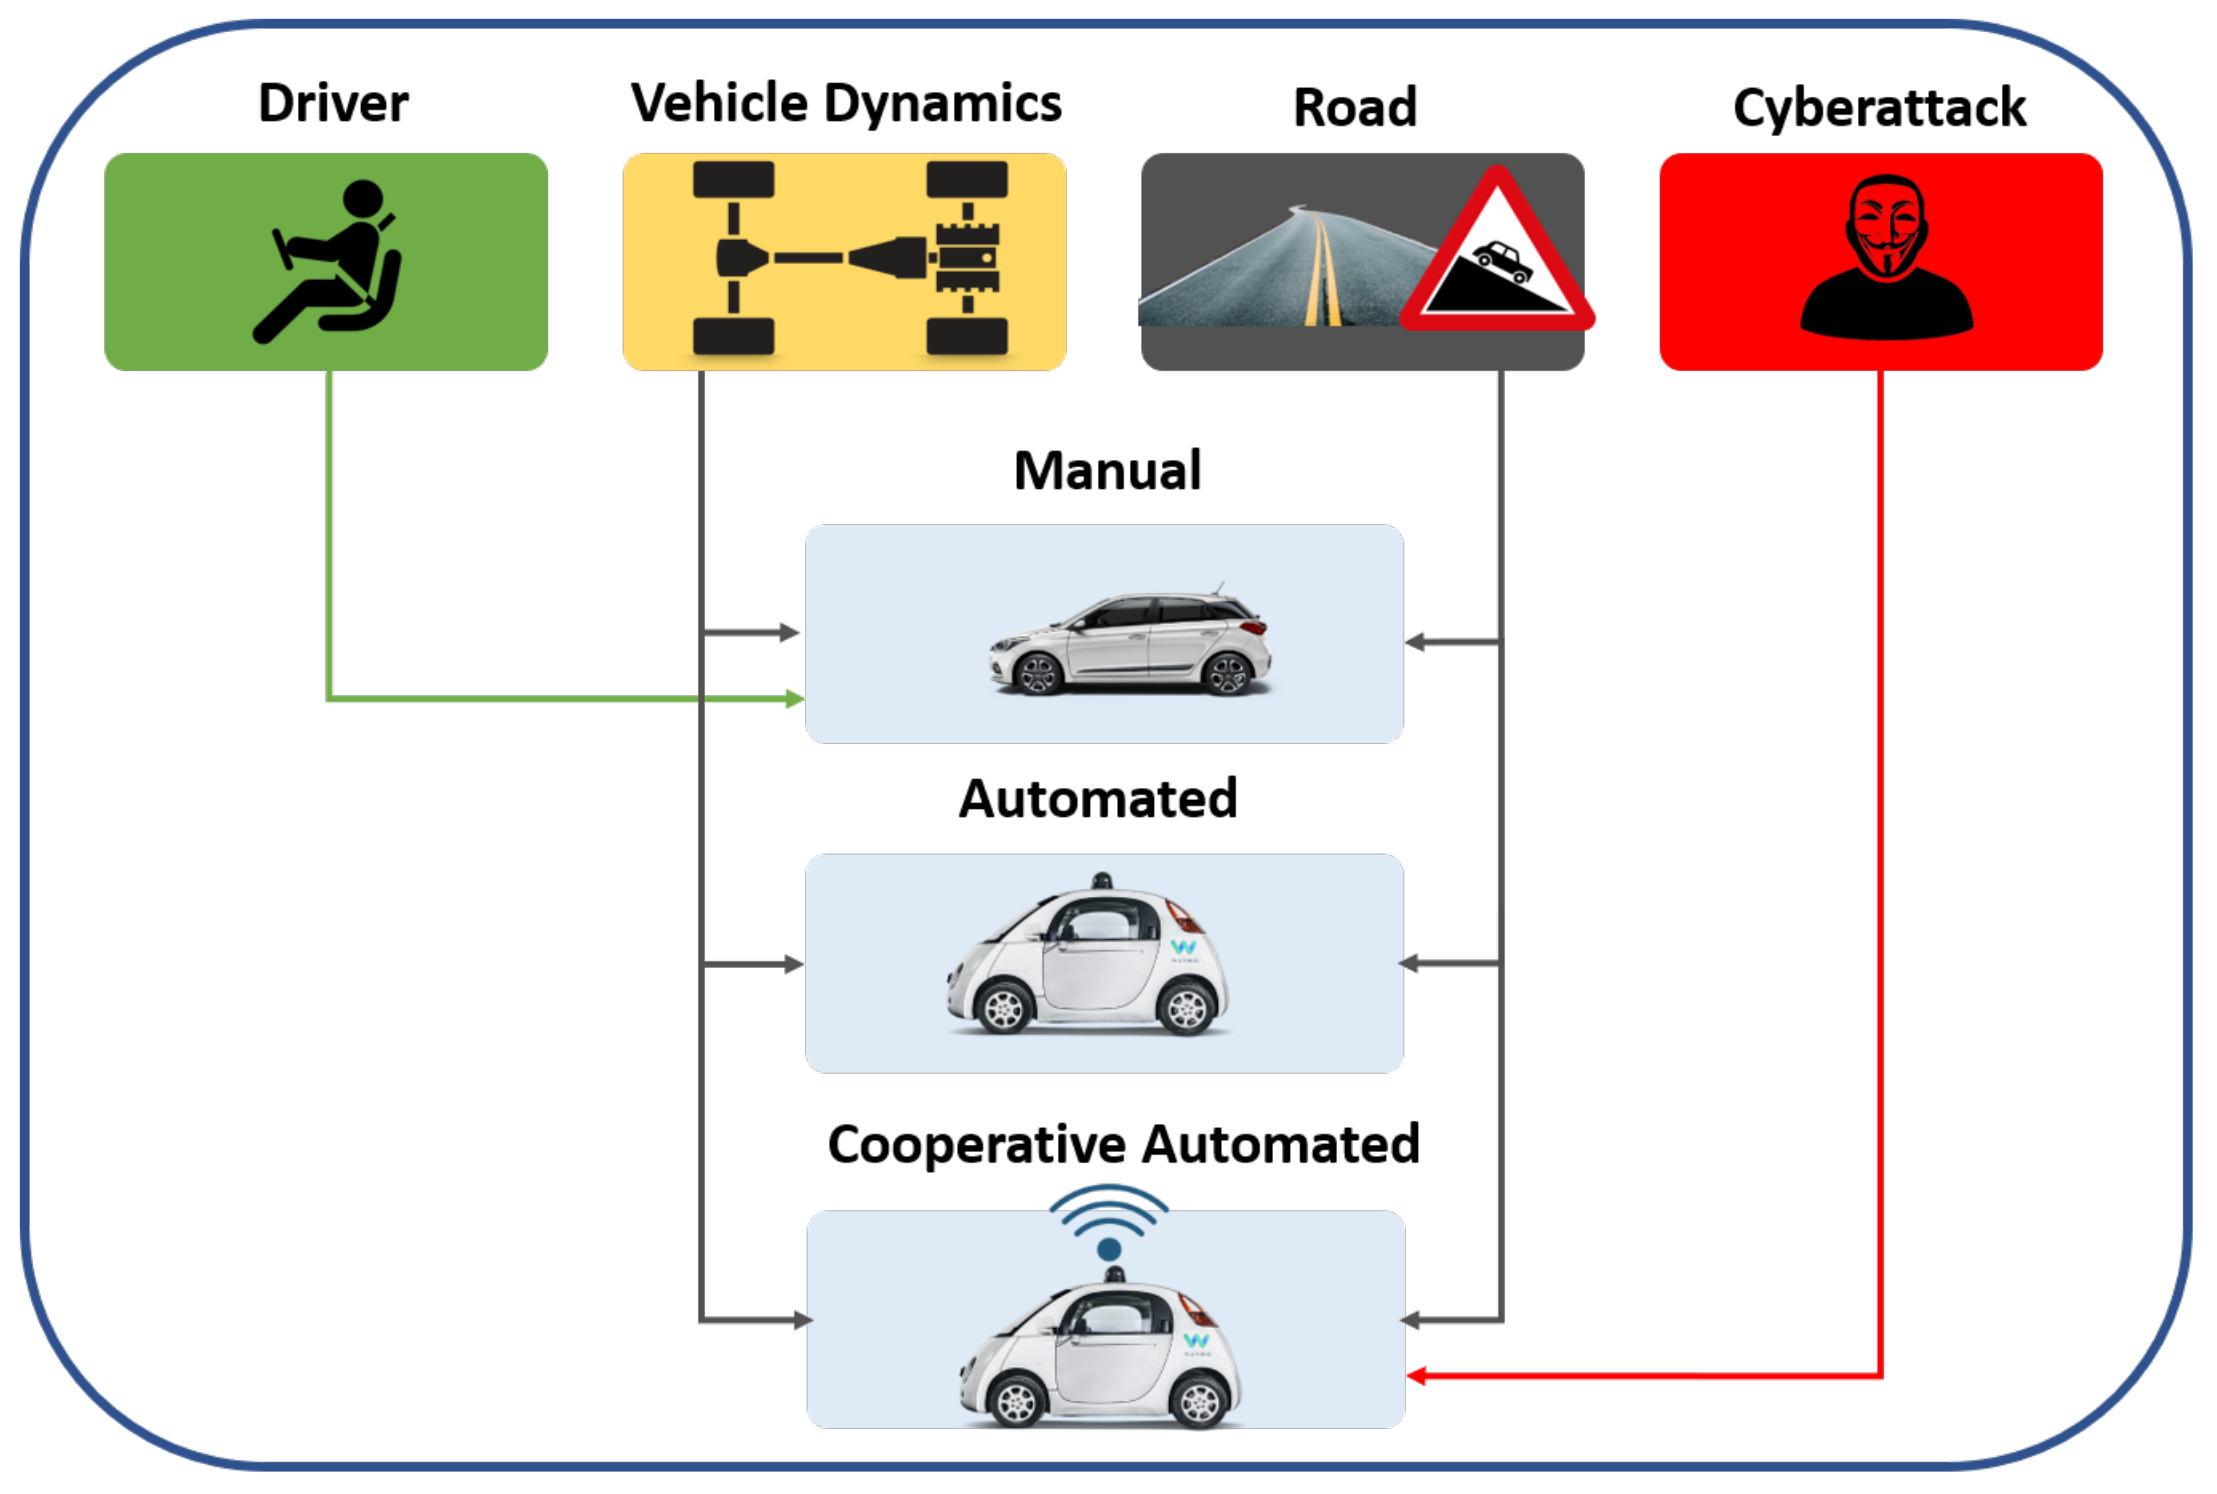
3.1. Driver Module
3.2. Vehicle Module
3.2.1. Vehicle Generation
3.2.2. Reference Speed Profiles
3.2.3. Vehicle Dynamics
3.3. Road Module
3.4. Cyberattack Module
3.5. Operating Mode Module
3.5.1. Manual Mode
3.5.2. Automated Mode
3.5.3. Cooperative Automated Mode
4. State and Unknown Input Estimation
5. Test Scenario
6. Results
7. Discussion
- model motivation for mandatory, active, and discretionary lane-change maneuvers;
- model mandatory, active, and discretionary lane-change gap acceptance;
- model before lane-change, after lane-change, receiving, and yielding vehicle-following for each facility type (e.g., on-ramp and off-ramp);
- model lateral control for autonomous vehicles;
- model string operations (e.g., maximum platoon size, inter-platoon time gap, and cut-in and cut-out maneuvers).
Author Contributions
Funding
Conflicts of Interest
References
- On-Road Automated Driving Committee. Taxonomy and Definitions for Terms Related to Driving Automation Systems for On-Road Motor Vehicles; Technical Report J3016; Society of Automotive Engineers: Warrendale, PA, USA, 2021. [Google Scholar]
- National Center for Statistics and Analysis. Critical Reasons for Crashes Investigated in the National Motor Vehicle Crash Causation Survey (Traffic Safety Facts); Technical Report DOT HS 812 506; National Highway Traffic Safety Administration: Washington, DC, USA, 2018.
- National Highway Traffic Safety Administration. Federal Motor Vehicle Safety Standards; V2V Communications; Technical Report NHTSA-2016-0126; US Department of Transportation: Washington, DC, USA, 2017.
- On-Road Automated Driving Committee. Taxonomy and Definitions for Terms Related to Cooperative Driving Automation for On-Road Motor Vehicles; Technical Report J3216; Society of Automotive Engineers: Warrendale, PA, USA, 2021. [Google Scholar]
- Olstam, J.J.; Tapani, A. Comparison of Car-Following Models; Volume 960 A; Swedish National Road and Transport Research Institute: Linköping, Sweden, 2004. [Google Scholar]
- Upstream Security Ltd. Global Automotive Cybersecurity Report; Technical Report; Upstream Security Ltd.: Detroit, MI, USA, 2020. [Google Scholar]
- Amoozadeh, M.; Raghuramu, A.; Chuah, C.N.; Ghosal, D.; Zhang, H.M.; Rowe, J.; Levitt, K. Security Vulnerabilities of Connected Vehicle Streams and Their Impact on Cooperative Driving. IEEE Commun. Mag. 2015, 53, 126–132. [Google Scholar] [CrossRef] [Green Version]
- Sargolzaei, A.; Abbaspour, A.; Al Faruque, M.A.; Eddin, A.S.; Yen, K. Security Challenges of Networked Control Systems. In Sustainable Interdependent Networks; Springer: Cham, Switzerland, 2018; pp. 77–95. [Google Scholar]
- Mouzakitis, A. Classification of Fault Diagnosis Methods for Control Systems. Meas. Control 2013, 46, 303–308. [Google Scholar] [CrossRef]
- Abbaspour, A.; Mokhtari, S.; Sargolzaei, A.; Yen, K. A survey on active fault-tolerant control systems. Electronics 2020, 9, 1513. [Google Scholar] [CrossRef]
- Nowakowski, C.; Shladover, S.E.; Lu, X.Y.; Thompson, D.; Kailas, A. Cooperative Adaptive Cruise Control (CACC) for Truck Platooning: Operational Concept Alternatives; Technical Report DTFH61-13-H-00012 Task 1.2; UC Berkeley: Berkeley, CA, USA, 2015. [Google Scholar]
- Zambrano-Martinez, J.L.; Calafate, C.T.; Soler, D.; Cano, J.C. Towards realistic urban traffic experiments using DFROUTER: Heuristic, validation and extensions. Sensors 2017, 17, 2921. [Google Scholar] [CrossRef] [Green Version]
- Krajzewicz, D.; Hertkorn, G.; Rössel, C.; Wagner, P. SUMO (Simulation of Urban MObility)–An open-source traffic simulation. In Proceedings of the 4th Middle East Symposium on Simulation and Modelling (MESM), Sharjah, United Arab Emirates, 28–30 October 2002; pp. 183–187. [Google Scholar]
- Akçelik, R.; Besley, M. Acceleration and deceleration models. In Proceedings of the 23rd Conference of Australian Institutes of Transport Research (CAITR), Melbourne, Australia, 10–12 December 2001; p. 12. [Google Scholar]
- Ahn, K.; Rakha, H.; Trani, A.; Van Aerde, M. Estimating vehicle fuel consumption and emissions based on instantaneous speed and acceleration levels. J. Transp. Eng. 2002, 128, 182–190. [Google Scholar] [CrossRef]
- Fang, F.C.; Elefteriadou, L. Some guidelines for selecting microsimulation models for interchange traffic operational analysis. J. Transp. Eng. 2005, 131, 535–543. [Google Scholar] [CrossRef] [Green Version]
- Kuriyama, M.; Yamamoto, S.; Miyatake, M. Theoretical study on eco-driving technique for an electric vehicle with dynamic programming. In Proceedings of the International Conference on Electrical Machines and Systems (ICEMS), Incheon, Korea, 10–13 October 2010; pp. 2026–2030. [Google Scholar]
- Maurya, A.K.; Bokare, P.S. Study of deceleration behavior of different vehicle types. Int. J. Traffic Transp. Eng. 2012, 2, 253–270. [Google Scholar] [CrossRef] [Green Version]
- Lee, J.; Park, B.B.; Malakorn, K.; So, J.J. Sustainability assessments of cooperative vehicle intersection control at an urban corridor. Transp. Res. Part C: Emerg. Technol. 2013, 32, 193–206. [Google Scholar] [CrossRef]
- Anya, A.R.; Rouphail, N.M.; Frey, H.C.; Schroeder, B. Application of AIMSUN microsimulation model to estimate emissions on signalized arterial corridors. Transp. Res. Rec. 2014, 2428, 75–86. [Google Scholar] [CrossRef]
- Song, G.; Yu, L.; Geng, Z. Optimization of Wiedemann and Fritzsche car-following models for emission estimation. Transp. Res. Part D Transp. Environ. 2015, 34, 318–329. [Google Scholar] [CrossRef]
- Bokare, P.S.; Maurya, A.K. Acceleration-deceleration behaviour of various vehicle types. Transp. Res. Procedia 2017, 25, 4733–4749. [Google Scholar] [CrossRef]
- Ramezani, H.; Shladover, S.E.; Lu, X.Y.; Altan, O.D. Micro-simulation of truck platooning with cooperative adaptive cruise control: Model development and a case study. Transp. Res. Rec. 2018, 2672, 55–65. [Google Scholar] [CrossRef]
- Shladover, S.E.; Nowakowski, C.; O’Connell, J.; Cody, D. Cooperative adaptive cruise control: Driver selection of car-following gaps. In Proceedings of the 17th ITS World Congress, Pusan, Korea, 25–29 October 2010; p. 8. [Google Scholar]
- Van Willigen, W.H.; Schut, M.C.; Kester, L.J. Approximating safe spacing policies for adaptive cruise control strategies. In Proceedings of the Vehicular Networking Conference (VNC), Amsterdam, The Netherlands, 14–16 November 2011; pp. 9–16. [Google Scholar]
- Horiguchi, R.; Oguchi, T. A study on car following models simulating various adaptive cruise control behaviors. Int. J. Intell. Transp. Syst. Res. 2014, 12, 127–134. [Google Scholar] [CrossRef]
- Flores, C.; Milanés, V.; Nashashibi, F. A time gap-based spacing policy for full-range car-following. In Proceedings of the 20th International Conference on Intelligent Transportation Systems (ITSC), Yokohama, Japan, 16–19 October 2017; pp. 1–6. [Google Scholar]
- Askari, A.; Farias, D.A.; Kurzhanskiy, A.A.; Varaiya, P. Effect of adaptive and cooperative adaptive cruise control on throughput of signalized arterials. In Proceedings of the Intelligent Vehicles Symposium (IV), Los Angeles, CA, USA, 11–14 June 2017; pp. 1287–1292. [Google Scholar]
- Flores, C.; Milanés, V. Fractional-order-based ACC/CACC algorithm for improving string stability. Transp. Res. Part C Emerg. Technol. 2018, 95, 381–393. [Google Scholar] [CrossRef] [Green Version]
- Chen, J.; Zhou, Y.; Liang, H. Effects of ACC and CACC vehicles on traffic flow based on an improved variable time headway spacing strategy. Intell. Transp. Syst. 2019, 13, 1365–1373. [Google Scholar] [CrossRef]
- Bian, Y.; Zheng, Y.; Ren, W.; Li, S.E.; Wang, J.; Li, K. Reducing time headway for platooning of connected vehicles via V2V communication. Transp. Res. Part C: Emerg. Technol. 2019, 102, 87–105. [Google Scholar] [CrossRef]
- PTV. Virtual Testing of Autonomous Vehicles with PTV Vissim. Available online: https://www.ptvgroup.com/en/solutions/products/ptv-vissim/areas-of-application/autonomous-vehicles-and-new-mobility/ (accessed on 16 August 2021).
- Aimsun. Aimsun Unveils New Platform for Simulating a Driverless Future. Available online: https://www.aimsun.com/aimsun-auto-launch/ (accessed on 1 August 2020).
- Bu, F.; Tan, H.S.; Huang, J. Design and field testing of a cooperative adaptive cruise control system. In Proceedings of the American Control Conference (ACC), Baltimore, MD, USA, 30 June–2 July 2010; pp. 4616–4621. [Google Scholar]
- Naus, G.J.; Vugts, R.P.; Ploeg, J.; van De Molengraft, M.J.; Steinbuch, M. String-stable CACC design and experimental validation: A frequency-domain approach. IEEE Trans. Veh. Technol. 2010, 59, 4268–4279. [Google Scholar] [CrossRef]
- Liu, H. Using Cooperative Adaptive Cruise Control (CACC) to Form High-Performance Vehicle Streams. Microscopic Traffic Modeling; Technical Report DTFH61-13-H-00013; UC Berkeley: Berkeley, CA, USA, 2018. [Google Scholar]
- Ploeg, J.; Scheepers, B.T.; Van Nunen, E.; Van de Wouw, N.; Nijmeijer, H. Design and experimental evaluation of cooperative adaptive cruise control. In Proceedings of the 14th International Conference on Intelligent Transportation Systems (ITSC), Washington, DC, USA, 5–7 October 2011; pp. 260–265. [Google Scholar]
- Shladover, S.E.; Su, D.; Lu, X.Y. Impacts of cooperative adaptive cruise control on freeway traffic flow. Transp. Res. Rec. 2012, 2324, 63–70. [Google Scholar] [CrossRef] [Green Version]
- Zhao, L.; Sun, J. Simulation framework for vehicle platooning and car-following behaviors under connected-vehicle environment. Procedia-Soc. Behav. Sci. 2013, 96, 914–924. [Google Scholar] [CrossRef] [Green Version]
- Segata, M.; Joerer, S.; Bloessl, B.; Sommer, C.; Dressler, F.; Cigno, R.L. Plexe: A platooning extension for Veins. In Proceedings of the Vehicular Networking Conference (VNC), Paderborn, Germany, 3–5 December 2014; pp. 53–60. [Google Scholar]
- Milanés, V.; Shladover, S.E. Modeling cooperative and autonomous adaptive cruise control dynamic responses using experimental data. Transp. Res. Part C Emerg. Technol. 2014, 48, 285–300. [Google Scholar] [CrossRef] [Green Version]
- Nikolos, I.K.; Delis, A.I.; Papageorgiou, M. Macroscopic modelling and simulation of ACC and CACC traffic. In Proceedings of the 18th International Conference on Intelligent Transportation Systems (ITSC), Gran Canaria, Spain, 15–18 September 2015; pp. 2129–2134. [Google Scholar]
- Delis, A.I.; Nikolos, I.K.; Papageorgiou, M. Simulation of the penetration rate effects of ACC and CACC on macroscopic traffic dynamics. In Proceedings of the 19th International Conference on Intelligent Transportation Systems (ITSC), Rio de Janeiro, Brazil, 1–4 November 2016; pp. 336–341. [Google Scholar]
- Wang, Z.; Wu, G.; Barth, M.J. Developing a distributed consensus-based cooperative adaptive cruise control system for heterogeneous vehicles with predecessor following topology. J. Adv. Transp. 2017, 2017, 1–16. [Google Scholar] [CrossRef]
- Terruzzi, L.; Colombo, R.; Segata, M. On the effects of cooperative platooning on traffic shock waves. In Proceedings of the Vehicular Networking Conference (VNC), Turin, Italy, 27–29 November 2017; pp. 37–38. [Google Scholar]
- Zhou, Y.; Ahn, S.; Chitturi, M.; Noyce, D.A. Rolling horizon stochastic optimal control strategy for ACC and CACC under uncertainty. Transp. Res. Part C Emerg. Technol. 2017, 83, 61–76. [Google Scholar] [CrossRef]
- Lemessi, M. An slx-based microsimulation model for a two-lane road section. In Proceedings of the Winter Simulation Conference (Cat. No. 01CH37304), Arlington, VA, USA, 9–12 December 2001; pp. 1064–1071. [Google Scholar]
- Rakha, H.; Ding, Y. Impact of stops on vehicle fuel consumption and emissions. J. Transp. Eng. 2003, 129, 23–32. [Google Scholar] [CrossRef]
- Wang, X.Y.; Liu, J.S. Research of the lane utilization with microsimulation. In Proceedings of the International Conference on Machine Learning and Cybernetics (ICMLC), Guangzhou, China, 18–21 August 2005; pp. 2681–2687. [Google Scholar]
- Ossen, S.; Hoogendoorn, S.P.; Gorte, B.G. Interdriver differences in car-following: A vehicle trajectory-based study. Transp. Res. Rec. 2006, 1965, 121–129. [Google Scholar] [CrossRef]
- Kesting, A.; Treiber, M.; Helbing, D. General lane-changing model MOBIL for car-following models. Transp. Res. Rec. 2007, 1999, 86–94. [Google Scholar] [CrossRef] [Green Version]
- Kesting, A.; Treiber, M. Calibrating car-following models by using trajectory data: Methodological study. Transp. Res. Rec. 2008, 2088, 148–156. [Google Scholar] [CrossRef] [Green Version]
- Talebpour, A.; Mahmassani, H.S.; Hamdar, S.H. Multiregime sequential risk-taking model of car-following behavior: Specification, calibration, and sensitivity analysis. Transp. Res. Rec. 2011, 2260, 60–66. [Google Scholar] [CrossRef]
- Song, G.; Yu, L.; Zhang, Y. Applicability of traffic microsimulation models in vehicle emissions estimates: Case study of VISSIM. Transp. Res. Rec. 2012, 2270, 132–141. [Google Scholar] [CrossRef] [Green Version]
- Lee, J.; Park, B. Development and evaluation of a cooperative vehicle intersection control algorithm under the connected vehicles environment. IEEE Trans. Intell. Transp. Syst. 2012, 13, 81–90. [Google Scholar] [CrossRef]
- Treiber, M.; Kesting, A. Microscopic calibration and validation of car-following models–a systematic approach. Procedia-Soc. Behav. Sci. 2013, 80, 922–939. [Google Scholar] [CrossRef] [Green Version]
- Li, Z.; Elefteriadou, L.; Ranka, S. Signal control optimization for automated vehicles at isolated signalized intersections. Transp. Res. Part C Emerg. Technol. 2014, 49, 1–18. [Google Scholar] [CrossRef]
- Tang, T.Q.; He, J.; Yang, S.C.; Shang, H.Y. A car-following model accounting for the driver’s attribution. Phys. A Stat. Mech. Its Appl. 2014, 413, 583–591. [Google Scholar] [CrossRef]
- Desiraju, D.; Chantem, T.; Heaslip, K. Minimizing the disruption of traffic flow of automated vehicles during lane changes. IEEE Trans. Intell. Transp. Syst. 2014, 16, 1249–1258. [Google Scholar] [CrossRef] [Green Version]
- Liu, H.; Kan, X.D.; Shladover, S.E.; Lu, X.Y.; Ferlis, R.E. Modeling impacts of cooperative adaptive cruise control on mixed traffic flow in multi-lane freeway facilities. Transp. Res. Part C Emerg. Technol. 2018, 95, 261–279. [Google Scholar] [CrossRef]
- Amoozadeh, M.; Deng, H.; Chuah, C.N.; Zhang, H.M.; Ghosal, D. Platoon management with cooperative adaptive cruise control enabled by VANET. Veh. Commun. 2015, 2, 110–123. [Google Scholar] [CrossRef] [Green Version]
- Li, Y.; Wang, H.; Wang, W.; Xing, L.; Liu, S.; Wei, X. Evaluation of the impacts of cooperative adaptive cruise control on reducing rear-end collision risks on freeways. Accid. Anal. Prev. 2017, 98, 87–95. [Google Scholar] [CrossRef]
- Noei, S.; Zhao, X.; Crane, C.D. Longitudinal control of vehicles in traffic microsimulation. arXiv 2020, arXiv:2003.07861. [Google Scholar]
- Mannering, F.L.; Washburn, S.S. Principles of Highway Engineering and Traffic Analysis; John Wiley & Sons: Hoboken, NJ, USA, 2020. [Google Scholar]
- Ozkul, S. Advanced Vehicle Dynamics Modeling Approach in Traffic Microsimulation with Emphasis on Commercial Truck Performance and On-Board-Diagnostics Data; University of Florida: Gainesville, FL, USA, 2014. [Google Scholar]
- Washburn, S.S.; Ozkul, S. Heavy Vehicle Effects on Florida Freeways and Multilane Highways; Technical Report BDK-77 977-15; Florida Department of Transportation: Tallahassee, FL, USA, 2013.
- Washburn, S.; Noei, S. Interchange Design to Accommodate Ramp Metering System; Technical Report BDV-31 977-92; Florida Department of Transportation: Tallahassee, FL, USA, 2020.
- Zhu, M.; Wang, X.; Tarko, A. Modeling car-following behavior on urban expressways in Shanghai: A naturalistic driving study. Transp. Res. Part C Emerg. Technol. 2018, 93, 425–445. [Google Scholar] [CrossRef] [Green Version]
- Noei, S.; Santana, H.; Sargolzaei, A.; Noei, M. Reducing traffic congestion using geo-fence technology: Application for emergency car. In Proceedings of the 1st International Workshop on Emerging Multimedia Applications and Services for Smart Cities (EMASC), Orlando, FL, USA, 7 November 2014; pp. 15–20. [Google Scholar]
- Washburn, S.S. Drivers. Available online: https://swashsim.miraheze.org/wiki/Drivers (accessed on 16 August 2021).
- Washbun, S.S. Vehicles. Available online: https://swashsim.miraheze.org/wiki/Vehicles (accessed on 16 August 2021).
- Khalghani, M.R.; Khushalani-Solanki, S.; Solanki, J.; Sargolzaei, A. Cyber disruption detection in linear power systems. In Proceedings of the North American Power Symposium (NAPS), Morgantown, WV, USA, 17–19 September 2017; pp. 1–6. [Google Scholar]
- Mokhtari, S.; Abbaspour, A.; Yen, K.K.; Sargolzaei, A. A machine learning approach for anomaly detection in industrial control systems based on measurement data. Electronics 2021, 10, 407. [Google Scholar] [CrossRef]
- Sargolzaei, A.; Crane, C.; Abbaspour, A.; Noei, S. A machine learning approach for fault detection in vehicular cyber-physical systems. In Proceedings of the 15th International Conference on Machine Learning and Applications (ICMLA), Anaheim, CA, USA, 18–20 December 2016; pp. 636–640. [Google Scholar]
- Sargolzaei, A.; Yazdani, K.; Abbaspour, A.; Crane III, C.D.; Dixon, W.E. Detection and mitigation of false data injection attacks in networked control systems. IEEE Trans. Ind. Inform. 2019, 16, 4281–4292. [Google Scholar] [CrossRef]
- Noei, M.; Abadeh, M.S. A genetic asexual reproduction optimization algorithm for imputing missing values. In Proceedings of the 9th International Conference on Computer and Knowledge Engineering (ICCKE), Mashhad, Iran, 24–25 October 2019; pp. 214–218. [Google Scholar]
- Parvizimosaed, M.; Noei, M.; Yalpanian, M.; Bahrami, J. A containerized integrated fast IoT platform for low energy power management. In Proceedings of the 7th International Conference on Web Research (ICWR), Tehran, Iran, 19–20 May 2021; pp. 318–322. [Google Scholar]


| Time Gap (s) | |||
|---|---|---|---|
| Author | Distance Gap (ft) | ACC | CACC |
| Bu et al. (2010) [34] | - | [1.1–2.2] | [0.6–1.1] |
| Naus et al. (2010) [35] | - | 2.6 * | 0.8 * |
| Shladover et al. (2010); Liu (2018) [24,36] | - | 1.1, 1.6, 2.2 | 0.7, 0.9, 1.1 |
| Ploeg et al. (2011) [37] | - | - | 0.7 * |
| Willigen et al. (2011) [25] | 15.8 *, 25.2 *, 26.0 *, | 0.5 *, 0.6 * | 0.2 *, 0.3 *, 0.4 * |
| 34.5 *, 39.9 *, 57.2 * | |||
| Shladover et al. (2012) [38] | - | - | 0.5 |
| Zhao and Sun (2013) [39] | - | 1.4 | 0.5 |
| Horiguchi and Oguchi (2014) [26] | - | 2.0, 2.0 * | - |
| Segata et al. (2014) [40] | 16.4 | 0.3 *, 1.2 * | - |
| Milanés and Shladover (2014) [41] | - | 1.1 | 0.6 |
| Nikolos et al. (2015); Delis et al. (2016) [42,43] | - | 1.2 | 1.0 |
| Wang et al. (2017) [44] | 42.7, 46.9, 68.2 | - | 0.4, 0.5, 0.6 *, 0.7, 0.9 * |
| Terruzzi et al. (2017) [45] | 16.4 * | 1.4 * | 1.0 * |
| Zhou et al. (2017) [46] | 16.4 | 0.5, 1.0, 1.5, 2.0 | 0.5, 1.0, 1.5, 2.0 |
| Askari et al. (2017) [28] | 9.8, 13.1 | 1.1 | 0.8 |
| Flores and Milanés (2018) [29] | - | 0.5, 0.6 | 0.3 |
| Chen et al. (2019) [30] | - | [0.2–2.2] | - |
| Bian et al. (2019) [31] | - | - | 0.0 *, 0.1 *, 0.2 *, 0.3 *, 0.4 *, |
| 0.6 *, 0.9 *, 1.0 *, 1.1 * | |||
| Max. Acceleration | Max. Deceleration | |
|---|---|---|
| Author | (ft/s) | (ft/s) |
| Akçelik and Besley (2001) [14] | 8.8 | 10.1 |
| Lemessi (2001) [47] | 8.2 | 8.2 |
| Ahn et al. (2002) [15] | 3.4, 3.9, 4.8, 5.0, 5.4, 5.5, 7.3, | - |
| 7.4, 7.7, 8.3, 8.5, 8.7, 9.3, 10.1 | ||
| Rakha and Ding (2003) [48] | 4.9 | 8.2 |
| Wang and Liu (2005) [49] | 8.2 | 11.5 |
| Fang and Elefteriadou (2005) [16] | 4.9, 6.9, 8.2, 9.2, 11.5, 15.1 | 9.8, 12.1, 15.1 |
| Ossen et al. (2006) [50] | 26.2 | 26.2 |
| Kesting et al. (2007) [51] | 4.9 | 13.1 |
| Kesting and Treiber (2008) [52] | 19.7 | 19.7 |
| Kuriyama et al. (2010) [17] | 8.8 | 9.8 |
| Talebpour et al. (2011) [53] | 13.1 | 26.2 |
| Song et al. (2012) [54] | 11.5 | 13.1 |
| Shladover et al. (2012) [38] | 6.6 | 6.6 |
| Lee and Park (2012); Lee et al. (2013) [19,55] | 13.1 | 9.8 |
| Maurya and Bokare (2012) [18] | - | 2.4, 2.5, 2.9, 5.0, 5.1, 5.3 |
| Treiber and Kesting (2013) [56] | 1.7, 4.6, 4.8 | 2.1, 4.8 |
| Anya et al. (2014) [20] | 0.7, 1.5, 8.5, 9.8, 11.2, 19.1, 22.0, 25.0 | 1.6, 3.7, 16.4, 19.7, 23.0, 36.7, 44.0, 51.5 |
| Li et al. (2014) [57] | 4.5 | 11.0 |
| Tang et al. (2014) [58] | - | 19.7 |
| Desiraju et al. (2014); Liu et al. (2018) [59,60] | 6.6 | - |
| Horiguchi and Oguchi (2014) [26] | 5.2 | - |
| Song et al. (2015) [21] | 8.8 | - |
| Amoozadeh et al. (2015); Zhou et al. (2017) [46,61] | 9.8 | 16.4 |
| Bokare and Maurya (2017) [22] | 2.5, 2.9, 3.1, 3.3, 6.2, 6.5, 7.3, 8.1, 9.4 | 2.4, 2.5, 2.9, 11.0, 13.0, 14.1, 14.2, 14.8, 16.4 |
| Askari et al. (2017) [28] | 2.6, 4.9, 8.2 | 6.6 |
| Li et al. (2017) [62] | 3.3 | - |
| Ramezani et al. (2018) [23] | 0.4, 0.5, 0.8, 1.3, 1.6, 1.8, 8.2 | 9.8 |
| Max. Acceleration | |
|---|---|
| Driving Schedule | (ft/s) |
| Freeway, High Speed | 3.9 |
| Freeway, LOS * A–C | 5.0 |
| Freeway, LOS * D | 3.4 |
| Freeway, LOS * E | 7.7 |
| Freeway, LOS * F & LA92 | 10.1 |
| Freeway, LOS * G | 5.5 |
| Freeway Ramps & Arterial/Collectors LOS * C–D | 8.3 |
| Arterial/Collectors LOS * A–B | 7.3 |
| Arterial/Collectors LOS * E–F | 8.5 |
| Local Roadways | 5.4 |
| Non-Freeway Area-Wide Urban Travel | 9.3 |
| LA4 & Running 505 | 4.8 |
| ST01 | 7.4 |
| New York City Cycle | 8.7 |
| Max. Acceleration | Max. Deceleration | |
|---|---|---|
| Specification | (ft/s) | (ft/s) |
| Passenger Car, SPUI, Vissim | 11.5 | - |
| Passenger Car, Diamond, Vissim & Aimsun | 6.9 | - |
| Truck, SPUI, Vissim | 8.2 | - |
| Truck, Diamond, Vissim | 4.9 | - |
| Passenger Car, SPUI, Aimsun | 9.2 | - |
| SPUI, CORSIM | 15.1 | 9.8 |
| Diamond, CORSIM | 6.9 | 15.1 |
| Speed Range | Max. Deceleration | |
|---|---|---|
| Vehicle Classification | (ft/s) | (ft/s) |
| Passenger Car | [83.8–85.7) | 5.0 |
| Passenger Car | [85.7–87.5) | 5.1 |
| Passenger Car | [87.5–91.1] | 5.3 |
| Truck | [18.2–27.3) | 2.4 |
| Truck | [27.3–36.5) | 2.5 |
| Truck | [36.5–54.7] | 2.9 |
| Speed Range | Max. Acceleration | Max. Deceleration | |
|---|---|---|---|
| Vehicle Classification | (ft/s) | (ft/s) | (ft/s) |
| Diesel Car | [62.0–69.3) | 6.2 | - |
| Diesel Car | [69.3–76.6) | 7.3 | - |
| Diesel Car | [76.6–83.8) | 6.5 | - |
| Diesel Car | [83.8–85.7) | - | 14.1 |
| Diesel Car | [85.7–87.5) | - | 14.2 |
| Diesel Car | [87.5–89.3) | - | 16.4 |
| Diesel Car | [89.3–91.1] | - | 14.8 |
| Petrol Car | [55.6–65.6) | - | 11.0 |
| Petrol Car | [65.6–75.6) | - | 13.0 |
| Petrol Car | [72.9–76.6) | 7.3 | - |
| Petrol Car | [75.6–82.9] | - | 14.2 |
| Petrol Car | [76.6–80.2) | 8.1 | - |
| Petrol Car | [80.2–83.8] | 9.4 | - |
| Truck | [18.2–27.3) | 2.5 | 2.4 |
| Truck | [27.3–36.5) | 3.3 | 2.5 |
| Truck | [36.5–45.6) | 3.1 | 2.9 |
| Truck | [45.6–54.7] | 2.9 | 2.9 |
| Speed Range | Max. Acceleration |
|---|---|
| (ft/s) | (ft/s) |
| [0–14.7) | 1.8 |
| [29.3–44.0) | 1.3 |
| [44.0–58.7) | 0.8 |
| [58.7–73.3) | 0.5 |
| Above 73.3 | 0.4 |
| Distance Headway | Time Headway | |
|---|---|---|
| Specification | (ft) | (s) |
| 20, ACC | 34.5 | 0.5 |
| 20, CACC with Transmitted Accelerations | 26.0 | 0.4 |
| 20, CACC with Estimated Accelerations | 15.8 | 0.2 |
| 30, ACC | 57.2 | 0.6 |
| 30, CACC with Transmitted Accelerations | 39.9 | 0.4 |
| 30, CACC with Estimated Accelerations | 25.2 | 0.3 |
| Time Gap | |
|---|---|
| Specification | (s) |
| Fractional-Order Proportional Derivative, ACC | 0.5 |
| Integer-Order Proportional Derivative, Loop Bandwidth and Phase Margin, ACC | 0.6 |
| Integer-Order Proportional Derivative, Loop Bandwidth and String Stability, ACC | 0.5 |
| CACC | 0.3 |
| Time Headway | |
|---|---|
| Specification | (s) |
| 1, Linear | 0.3, 0.4, 0.6 |
| 3, Linear | 0.1, 0.2 |
| 1, Nonlinear | 0.6 |
| 3, Nonlinear | 0.2 |
| 10, Nonlinear | 0.1 |
| 20 & 30, Nonlinear | 0.0 |
| 1, Nonlinear Subject to Communication Delay | 0.9, 1.0, 1.1 |
| 3, Nonlinear Subject to Communication Delay | 0.6, 0.7, 0.9, 1.1 |
| Parameter | Value | Unit | Parameter | Value | Unit |
|---|---|---|---|---|---|
| 0.1 | s | 5 | ft | ||
| 0.002377 * | slug/ft | 2 | - | ||
| 0 | - | 4 | - | ||
| Drivetrain Type | Front-Wheel-Drive | - | 1 | s | |
| 1 ** | - | −1 | s | ||
| - | 1 | s | |||
| 0.95 | - | 1 | s | ||
| 1.04 | - | −1 | s | ||
| 1.0, 0.6, 0.0 | s | 1 | - | ||
| 0.0, 0.1 | s | 110 | ft/s | ||
| Driver Type | 5 | - | 2 | s | |
| 100 , 0 | ft | q | 1800 | veh/h | |
| 0 | ft/s | Warm-Up Period | 900 | s | |
| 0 | ft/s | Replications | 20 | - | |
| 1.1,0.6 | s |
| US06 | Cycle D | |||||
|---|---|---|---|---|---|---|
| Malicious Fault (ft/s) | 1 | 3 | 5 | 1 | 3 | 5 |
| 2011 Ford F150 | 0.8 | 2.2 | 3.3 | 0.8 | 2.2 | 3.3 |
| 2004 Pontiac Grand Am | 0.8 | 2.2 | 3.4 | 0.8 | 2.2 | 3.3 |
| 2006 Honda Civic Si | 0.8 | 2.2 | 3.3 | 0.8 | 2.2 | 3.3 |
| 2009 Honda Civic | 0.8 | 2.2 | 3.3 | 0.8 | 2.2 | 3.3 |
| 2005 Mazda 6 | 0.8 | 2.2 | 3.3 | 0.8 | 2.2 | 3.3 |
| 2008 Chevy Impala | 0.8 | 2.2 | 3.2 | 0.8 | 2.2 | 3.2 |
| 2002 Chevy Silverado | 0.8 | 2.2 | 3.2 | 0.8 | 2.2 | 3.2 |
| 2004 Chevy Tahoe | 0.8 | 2.1 | 3.1 | 0.8 | 2.1 | 3.1 |
| 1998 Buick Century | 0.9 | 2.2 | 3.3 | 0.8 | 2.1 | 3.2 |
| 1998 Chevy S10 Blazer | 0.9 | 2.2 | 3.3 | 0.8 | 2.1 | 3.1 |
| Intermediate Semi-Trailer | 0.9 | 2.2 | 3.2 | 0.8 | 2.1 | 3.1 |
| Single-Unit Truck | 1.0 | 2.1 | 3.1 | 0.8 | 2.0 | 3.0 |
| Interstate Semi-Trailer | 0.9 | 2.2 | 3.2 | 0.8 | 2.1 | 3.0 |
| Double Semi-Trailer | 1.0 | 2.2 | 3.2 | 0.8 | 2.0 | 3.1 |
| US06 | Cycle D | |||||
|---|---|---|---|---|---|---|
| Malicious Fault (ft/s) | 1 | 3 | 5 | 1 | 3 | 5 |
| 2011 Ford F150 | −0.2 | −1.1 | −2.1 | −0.3 | −1.1 | −2.1 |
| 2004 Pontiac Grand Am | −0.2 | −1.0 | −1.9 | −0.2 | −1.0 | −2.0 |
| 2006 Honda Civic Si | −0.2 | −1.0 | −2.0 | −0.3 | −1.0 | −2.0 |
| 2009 Honda Civic | −0.2 | −1.1 | −2.1 | −0.3 | −1.1 | −2.1 |
| 2005 Mazda 6 | −0.2 | −1.0 | −2.0 | −0.3 | −1.1 | −2.0 |
| 2008 Chevy Impala | −0.2 | −1.1 | −2.1 | −0.3 | −1.1 | −2.1 |
| 2002 Chevy Silverado | −0.2 | −1.1 | −2.2 | −0.3 | −1.1 | −2.2 |
| 2004 Chevy Tahoe | −0.2 | −1.2 | −2.4 | −0.3 | −1.3 | −2.4 |
| 1998 Buick Century | −0.2 | −1.1 | −2.1 | −0.3 | −1.1 | −2.2 |
| 1998 Chevy S10 Blazer | −0.2 | −1.1 | −2.2 | −0.3 | −1.2 | −2.3 |
| Intermediate Semi-Trailer | −0.1 | −1.1 | −2.2 | −0.3 | −1.2 | −2.2 |
| Single-Unit Truck | 0.1 | −0.8 | −2.5 | −0.3 | −1.3 | −2.6 |
| Interstate Semi-Trailer | 0.0 | −1.1 | −2.2 | −0.3 | −1.2 | −2.3 |
| Double Semi-Trailer | 0.0 | −1.1 | −2.2 | −0.3 | −1.2 | −2.3 |
| US06 | Cycle D | |||||
|---|---|---|---|---|---|---|
| Malicious Fault (ft/s) | 1 | 3 | 5 | 1 | 3 | 5 |
| 2011 Ford F150 | −0.1 | −0.4 | −0.6 | −0.1 | −0.4 | −0.6 |
| 2004 Pontiac Grand Am | −0.1 | −0.3 | −0.5 | −0.1 | −0.3 | −0.5 |
| 2006 Honda Civic Si | −0.1 | −0.4 | −0.6 | −0.1 | −0.4 | −0.6 |
| 2009 Honda Civic | −0.1 | −0.4 | −0.6 | −0.1 | −0.4 | −0.6 |
| 2005 Mazda 6 | −0.1 | −0.4 | −0.6 | −0.1 | −0.4 | −0.6 |
| 2008 Chevy Impala | −0.1 | −0.4 | −0.6 | −0.1 | −0.4 | −0.6 |
| 2002 Chevy Silverado | −0.1 | −0.4 | −0.6 | −0.1 | −0.4 | −0.6 |
| 2004 Chevy Tahoe | −0.1 | −0.5 | −0.8 | −0.1 | −0.5 | −0.8 |
| 1998 Buick Century | −0.1 | −0.4 | −0.6 | −0.1 | −0.4 | −0.6 |
| 1998 Chevy S10 Blazer | −0.1 | −0.4 | −0.7 | −0.1 | −0.4 | −0.6 |
| Intermediate Semi-Trailer | 0.0 | −0.4 | −0.6 | −0.1 | −0.4 | −0.5 |
| Single-Unit Truck | −0.1 | −0.5 | −0.8 | −0.1 | −0.5 | −0.8 |
| Interstate Semi-Trailer | 0.0 | −0.4 | −0.6 | −0.1 | −0.4 | −0.5 |
| Double Semi-Trailer | −0.1 | −0.1 | −0.6 | −0.1 | −0.4 | −0.6 |
| US06 | Cycle D | |||||
|---|---|---|---|---|---|---|
| Malicious Fault (ft/s) | 1 | 3 | 5 | 1 | 3 | 5 |
| 2011 Ford F150 | 7.5 | 6.9 | 6.6 | 7.4 | 6.9 | 6.6 |
| 2004 Pontiac Grand Am | 7.5 | 6.8 | 6.6 | 7.4 | 6.8 | 6.5 |
| 2006 Honda Civic Si | 7.6 | 7.0 | 6.7 | 7.5 | 7.0 | 6.7 |
| 2009 Honda Civic | 8.1 | 7.4 | 7.1 | 7.9 | 7.4 | 7.1 |
| 2005 Mazda 6 | 8.1 | 7.4 | 7.1 | 7.9 | 7.3 | 7.1 |
| 2008 Chevy Impala | 8.5 | 7.7 | 7.4 | 8.2 | 7.7 | 7.4 |
| 2002 Chevy Silverado | 8.5 | 7.7 | 7.4 | 8.2 | 7.7 | 7.4 |
| 2004 Chevy Tahoe | 9.0 | 8.2 | 7.9 | 8.6 | 8.1 | 7.9 |
| 1998 Buick Century | 9.3 | 8.3 | 8.0 | 8.7 | 8.2 | 7.9 |
| 1998 Chevy S10 Blazer | 9.3 | 8.3 | 8.0 | 8.7 | 8.2 | 7.9 |
| Intermediate Semi-Trailer | 42.5 | 9.1 | 8.7 | 9.4 | 8.9 | 8.6 |
| Single-Unit Truck | 42.8 | 9.1 | 8.8 | 9.4 | 8.9 | 8.7 |
| Interstate Semi-Trailer | 44.8 | 9.3 | 9.0 | 9.6 | 9.1 | 8.8 |
| Double Semi-Trailer | 45.2 | 9.4 | 9.0 | 9.7 | 9.1 | 8.9 |
| Cyberattack | Future Work | Description |
|---|---|---|
| Formulation | Fault and Delay | Most common cyberattacks can be modeled as fault (e.g., data falsification and spoofing attacks) or delay (e.g., denial-of-service attack). |
| Detection | Kalman Filter & Neural Network | Conventional fault-resilient longitudinal controllers are model-driven or data-driven, but not combined, potentially sacrificing accuracy or simulation speed. |
| Compensation | Adaptive Controller | Estimated distance gaps can be increased in proportion to cyberattack magnitude. |
Publisher’s Note: MDPI stays neutral with regard to jurisdictional claims in published maps and institutional affiliations. |
© 2021 by the authors. Licensee MDPI, Basel, Switzerland. This article is an open access article distributed under the terms and conditions of the Creative Commons Attribution (CC BY) license (https://creativecommons.org/licenses/by/4.0/).
Share and Cite
Noei, S.; Parvizimosaed, M.; Noei, M. Longitudinal Control for Connected and Automated Vehicles in Contested Environments. Electronics 2021, 10, 1994. https://doi.org/10.3390/electronics10161994
Noei S, Parvizimosaed M, Noei M. Longitudinal Control for Connected and Automated Vehicles in Contested Environments. Electronics. 2021; 10(16):1994. https://doi.org/10.3390/electronics10161994
Chicago/Turabian StyleNoei, Shirin, Mohammadreza Parvizimosaed, and Mohammadreza Noei. 2021. "Longitudinal Control for Connected and Automated Vehicles in Contested Environments" Electronics 10, no. 16: 1994. https://doi.org/10.3390/electronics10161994
APA StyleNoei, S., Parvizimosaed, M., & Noei, M. (2021). Longitudinal Control for Connected and Automated Vehicles in Contested Environments. Electronics, 10(16), 1994. https://doi.org/10.3390/electronics10161994