3.1. Operation Principle
The workflow and operation principle for
Streaming
Outlier
Analysis and
Attack
Pattern
Recognition, denoted as
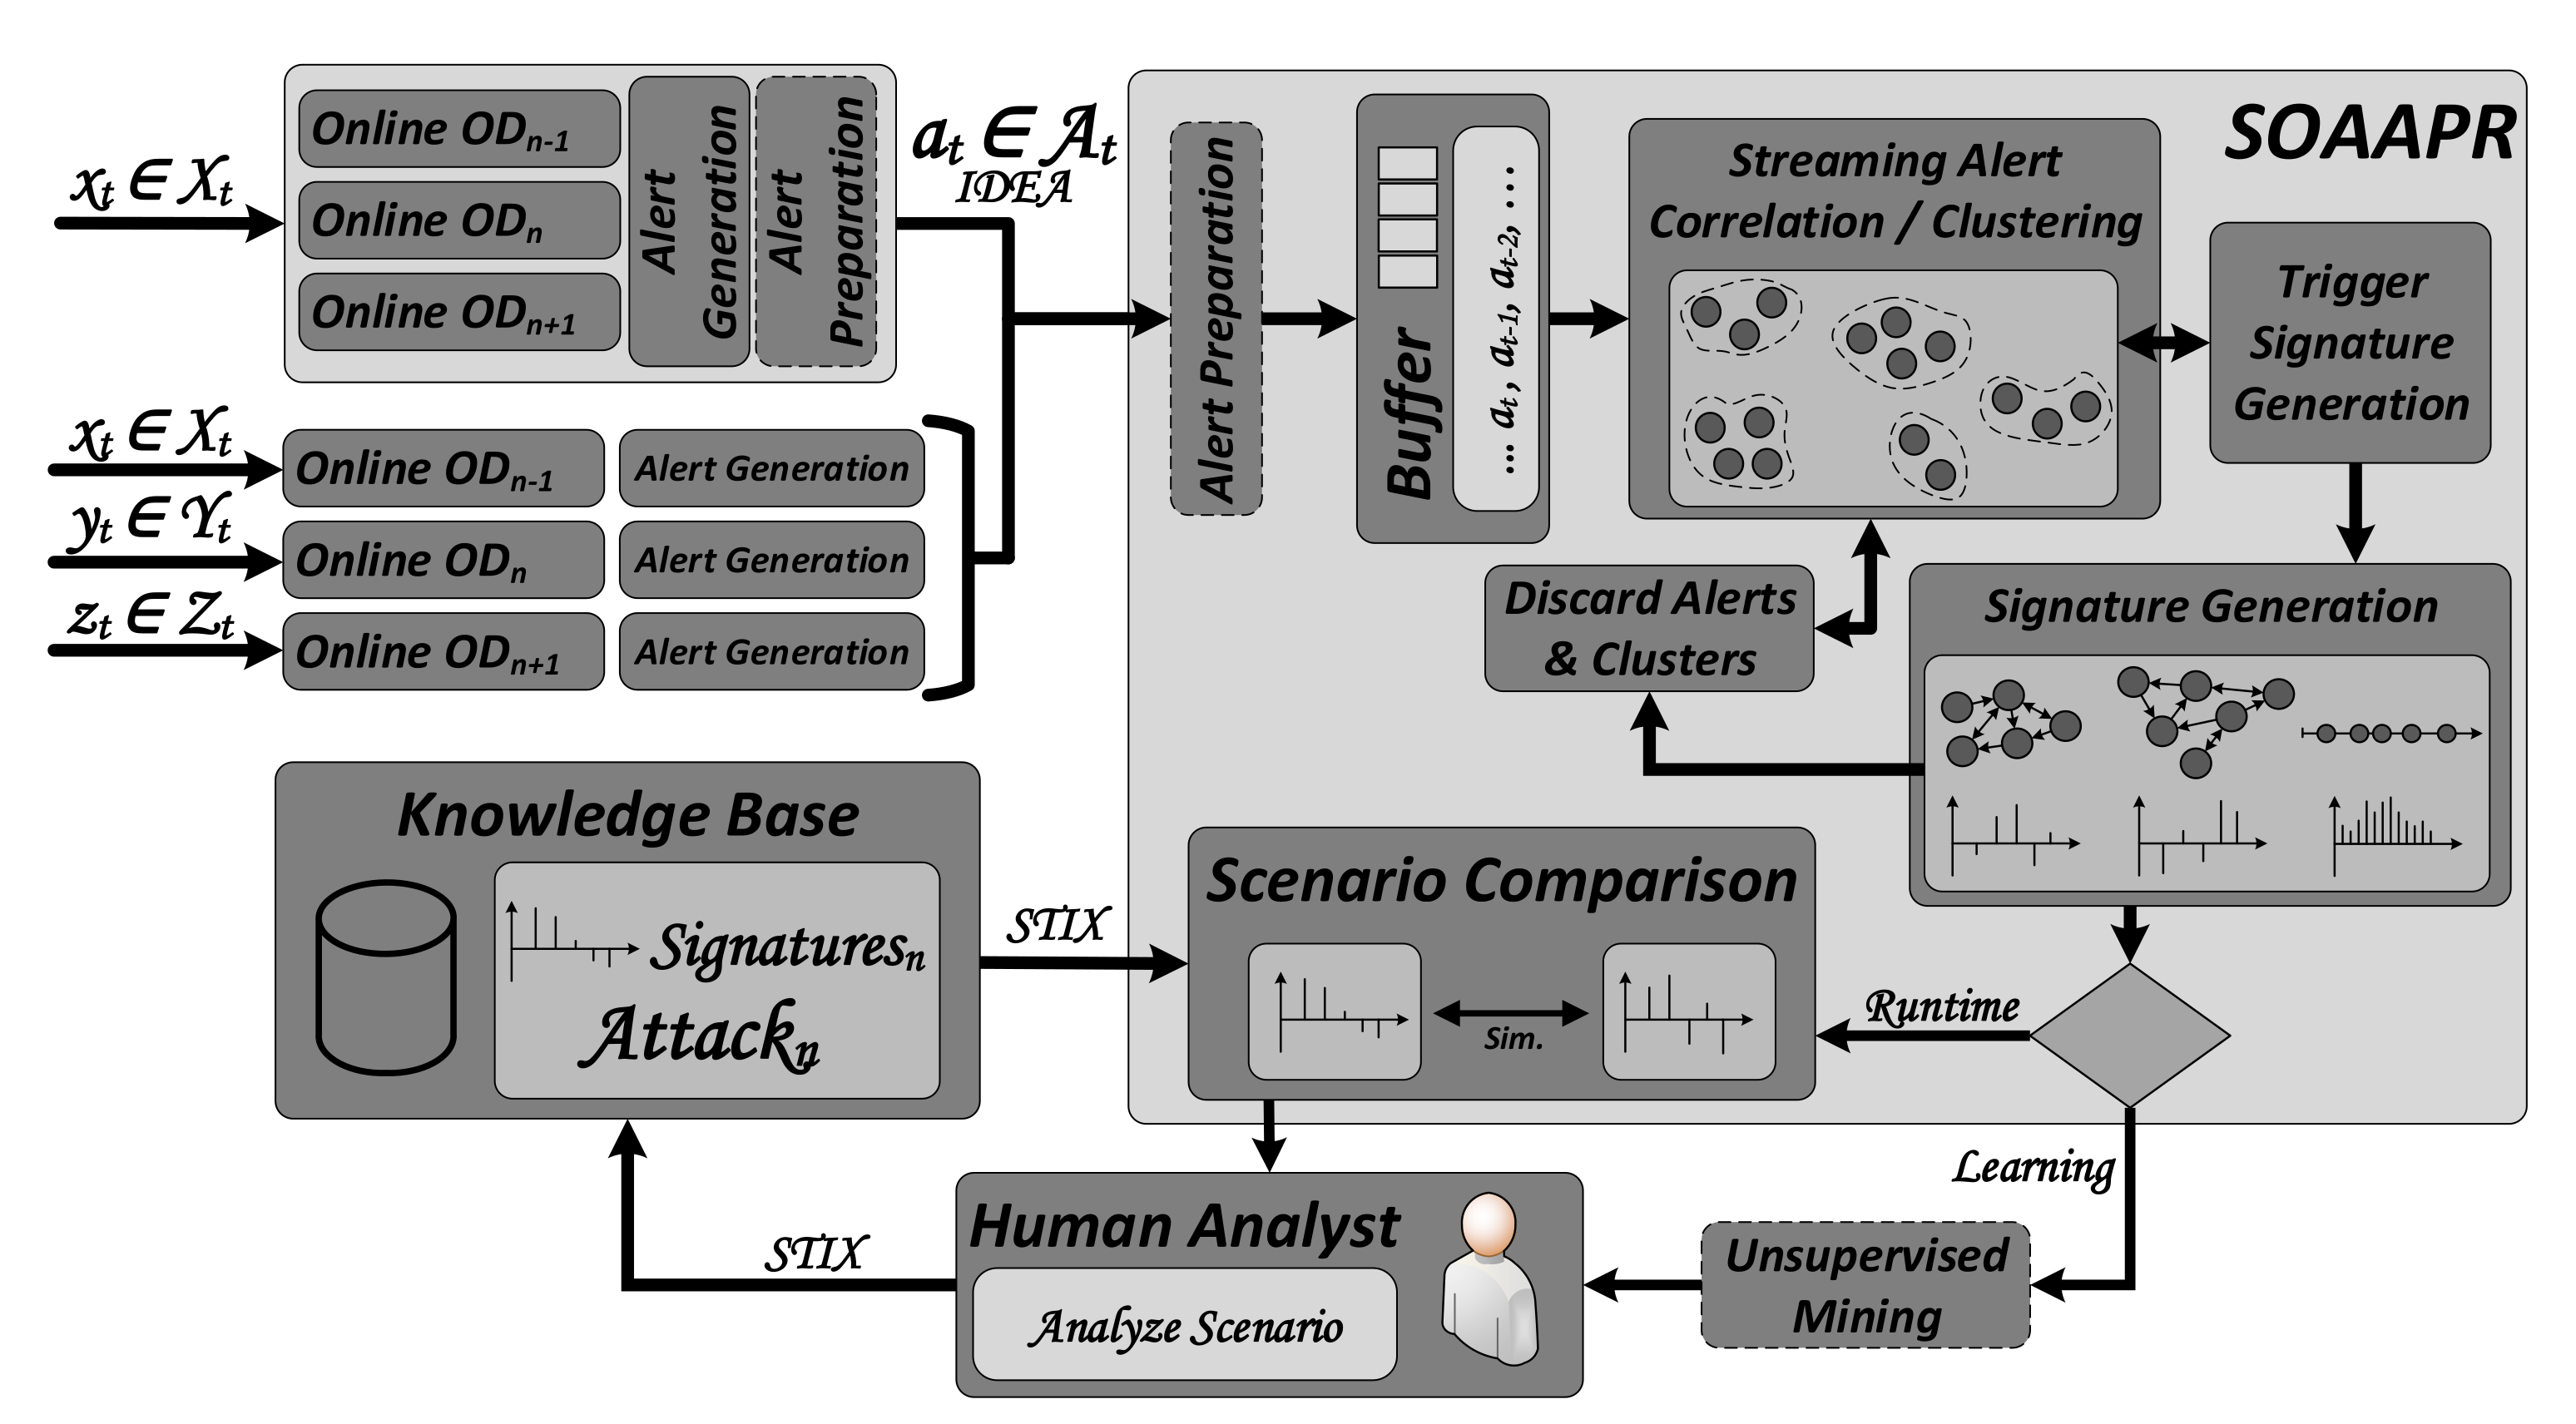
SOAAPR, is shown in
Figure 1. One may utilize SOAAPR in conjunction with online OD algorithms in two different interaction modes depending on the network infrastructure and the available resources. On the one hand, online OD can be performed self-sufficiently on a single system applying multiple OD algorithms in parallel, denoted as
single system—multiple algorithms. The amount of algorithms in parallel depends on the available resources of the single system. All algorithms perform OD on the same data instances (data points)
with dimension
d of the data stream
. The continuous transmission of data records arrives sequentially at each time step
t in which the count of features is denoted as
d (dimension) and
the
-th
d-dimensional most recent incoming data instance at time
t. The feature set of
is denoted as
.
Alert Generation and
Alert Preparation can be performed locally on the single system after each classifier yields its result, either a TP or a FP. For a greater extent of visibility across larger network infrastructures, collaboratively operating IDS sensors have found their way into alert detection or alert correlation. Therefore, on the other hand, SOAAPR is able to deal with multiple self-sufficiently working online OD algorithms, denoted as
multiple systems—single algorithms. Each distributively or decentrally applied algorithm in the network infrastructure operates on data instances
,
or
from different data streams
,
and
.
Alert Preparation in this interaction mode is performed by SOAAPR. A combination of both interaction modes, denoted as
multiple systems—multiple algorithms, is also possible. Thus,
Alert Preparation must be performed on both the multiple single systems utilizing multiple online OD algorithms and within SOAAPR processing the streaming alerts.
Alert instances from the stream , generated by either a TP or a FP, are streaming into SOAAPR at each time step t, in which the count of attributes of is denoted as l and the -th l-dimensional most recent incoming alert at time t. Within SOAAPR, a Buffer is used to temporarily store alerts for the Streaming Alert Correlation / Clustering. No longer required alerts, e.g., from unusable clusters, will be flushed by the Discard Alerts and Clusters module. The Trigger Signature Generation component monitors the evolving clusters from the set and triggers the Signature Generation from suitable clusters, ideally representing an attack or step of an attack, denoted as the attack scenario from the set , in order to create three types of signatures denoted as .
Further processing of the generated signatures depends on two operation modes—Runtime and Learning—based on whether an existing knowledge base is available or not. In the Learning phase, generated signatures can—if desired—be clustered according to their similarity and are presented to a human analyst. Instead of a massive amount of alerts generated without applying SOAAPR, the expert must only analyze a reduced amount of alerts already preprocessed in a set clustered as and ideally corresponding to the attack scenario . In the case of a true attack scenario, the expert condenses information about the attack scenario using STIX and attaches the respective signature to it. Since the resulting knowledge of the attack scenario only consists of fingerprint-like attack-characteristic information, free of privacy-relevant or confidential data, such as in-house IP-addresses. Thus, it can be shared in a cross-company manner. Having a knowledge base established, in the Runtime phase, generated signatures can be compared within the Scenario Comparison module by calculating similarity values. This way, one can take advantage of the strengths of misuse-based signatures with their fast, efficient and reliable attack identification capability but surpasses it via its ability to identify completely new, yet unknown, attack scenarios by being similar to known scenarios (from the same attack category) with a similar pattern. In the following, the core components of SOAAPR are discussed in more detail.
3.2. Alert Generation and Preparation
An OD algorithm assigns either a class label as given by or a score value , describing the strengths of anomalousness, for each data object in . Score values carry more information and aid the Alert Preparation, for instance, by dealing with FN. Thus, Alert Generation creates alarms utilizing the IDEA format for instance by enriching the intrinsic alert properties such as timestamp, IP-address and port source and destination information with (i) a normalized value of the outlier score and (ii) the respective top--features mainly causing the outlierness as the subset .
We deem (i) crucial when combining multiple OD algorithms with different scoring functions since, for instance, algorithms such as Kitsune [
18] or Loda [
23] score instances higher the more abnormal they are within their model,
. This impedes setting a unified threshold value across all applied OD algorithms, in particular, when they operate on different hyperparameter sets. As an example, Loda utilizing two alternating sets of histograms with different window sizes will yield different averaged score values due to the different state of knowledge about normal data. With increasing window sizes, the models become more accurate while incorporating larger amounts of normal data instances, which, in turn, are then scored less compared to models obtained from smaller window sizes. We suggest normalizing the outlier scores using an improved version of the
Gaussian Scaling proposed by [
52], in which the mean
and the standard deviation
are used to encounter the aforementioned problems. Since
and
work well for normally distributed values, i.e., assuming a normal distribution of the outlier scores, we replace them by the median
and the median absolute deviation
because they are a better option for distributions with skewness.
Figure 2 depicts an exemplary distribution showing non-negative (positive) skewness of the Loda online algorithm utilized on the fourth CSV file of the security-related UNSW-NB15 [
53] dataset. It clearly points out the difference between the mean and median caused by the unequal ratio of outliers. Thus, the normalization formula leads to Equation (
1), where
is the monotone and ranking stable Gaussian Error Function, and
and
are moving or rolling variants of the median and median absolute deviation to be applied in a streaming fashion.
Applying this formula will translate the arbitrary outlier score values in the range into interpretable values describing the probability of a data instance being an outlier. Using domain expertise, a reasonable threshold can be determined over runtime, yielding a decent classification performance that assigns a binary value from the set for each .
In terms of Alert Preparation, it must be distinguished between the modes single system—multiple algorithms and multiple systems—single algorithms. In general, Alert Preparation helps to reduce FP as well as FN by exploiting the strengths of multiple classifiers sending their alerts. For single system—multiple algorithms, the classifier processes the same data instance from the stream in parallel; thus, feature interpretability (additional alarm attribute (ii)) is not mandatory since it can strongly be assumed that resulting outliers from the same data instance are caused by the same feature deviating too much from normal behavior.
However, having multiple systems—single algorithms, with the feature information causing the outlierness, alerts can be assigned to the same event but from different stream perspectives, e.g., or , considering the timestamp information as well. Even in the distributed case, an attack might cause outliers close in time to be detected by the classifiers, which subsequently generate alerts. If the classifiers are able to determine the features causing the outlierness, those alerts can be mapped to the same event with high confidentiality whose most contributing features have high similarity. Independent of the interaction mode, alerts generated from detected outliers of the same event (data instance) by multiple classifiers can be fused together to reduce the amount of alerts that SOAAPR needs to process (alert filtering). We suggest deriving meta-alerts that summarize the multiple alerts generated by the classifiers for the same event. Having the same alert attributes in terms of IP-address and port source and destination information with timestamps close in time (and highly similar respective features causing the outlierness for the multiple systems—single algorithms option) but with different normalized outlier score values, those alerts can be mapped to a single meta-alert. The normalized outlier score values (additional alarm attribute (i)) are combined by into a meta-outlier score depending on potentially additional weights for each classifier, where and applies. For the sake of simplicity, we assume equal weights in the following.
Table 1 shows an example of five online OD algorithms classifying five data instances with ground truth
. Further, we assume an anomaly threshold of >0.5, which triggers the generation of alerts by each classifier. A normal data instance can either be a True Negative (TN) or an FP and an abnormal data point can be either a True Positive (TP) or an FN. Having ground truth information available, even for misclassification of individual classifiers, meta-alerts would be generated with high confidence referring to the meta-outlier score value, denoted as
. Since alerts are only generated from TPs and FPs,
can lead to falsely generated meta-alerts without incorporating information on how many classifiers generated alerts. Thus, the meta-alert outlier score can be penalized by some measure, e.g., utilizing majority voting or the ratio of alerts generated to the number of classifiers. Taking advantage of the latter leads to a penalized meta-alert outlier score, denoted as
. Setting a dedicated threshold for meta-alert generation based on the penalized outlier scores, for instance, 0.3 in
Table 1, significantly reduces FPs and potentially alleviates the number of FNs that limit the alert generation by obscuring the actual TPs.
It is noted that this measure only works for single system—multiple algorithms since those algorithms definitely operate on the same input data and the total number of classifiers processing the same event can be determined. In contrast, the number of classifiers that operate distributively in the multiple systems—single algorithms case, processing the same event, cannot be reliably determined.
3.3. Streaming Alert Correlation and Clustering
The core component of SOAAPR in order to group incoming alerts into clusters, potentially representing attack scenarios, is the
Streaming Alert Correlation/Clustering component. It is again noted that we are not yet interested in uncovering attack campaigns or multi-stage attacks but attack scenarios or attack steps that are rooted in timely correlated outliers. Although so-called Advanced Persistent Threats are characterized by intelligent adversaries that might exploit the notion of time by stealthily prolonging their attack campaign, we are focusing on the preliminary steps adversaries have to undertake that are of a reasonable finite length of time. For multi-stage attack uncovering, we refer to other work such as [
38,
54].
Table 2 shows the 14 different attack scenarios of the CICIDS2017 datasets together with their respective characteristics in terms of number of (anomalous) records associated for each attack and their duration. Furthermore, the outlier percentage of each attack within the dataset is given. Since OD is tailored for highly imbalanced data, it will not work well for the
DoS Hulk,
Portscan and
DDoS attack. However, especially for DoS-like attacks, plenty of work exists for detection and prevention [
55,
56,
57]. It can clearly be seen from the table that, on average, if we exclude the DoS type, attacks are typically not longer than 4 h. Furthermore, we assume that attacks are rooted in a reasonable amount of outliers such that—if clustered—meaningful signatures of those potential attack scenarios can be derived. The number of instances in
Table 2 confirms this assumption by showing the average amount of (anomalous) instances per attack scenario and attack category (excluding the three above mentioned) is 2830 with a minimum of 11 for
Heartbleed. However, we want to note that each attack category has its unique characteristics in terms of the average number of instances per attack scenario and their duration. Thus, it might be reasonable to apply multiple instances of SOAAPR, each adjusted for a dedicated attack category. This would also allow applying SOAAPR with other detection mechanisms, except OD ones, which might also be tailored for DoS-like attacks.
Furthermore, we deem it more reasonable that each incoming alert is only assigned to one cluster. This stands in contrast to approaches, such as [
40], whose community clustering might assign alerts to several clusters under the assumption of dealing with uncertainty in clustering, and, although clusters might contain alerts of unrelated attacks, they might include all TP alerts. This assumption can be seen as critical since alerts of unrelated attack scenarios, denoted in this work as “noisy”, might lead to blurred signatures, and similar attack scenarios in the future may lead to completely different signatures without those additional noisy alerts. SOAAPR operates on alerts with high confidentiality of TPs due to the
Alert Preparation mechanism.
The
Buffer component serves as a FIFO (First In, First Out) data queue that helps to cope with potential bursts of alert floods while relaxing the processing time of the
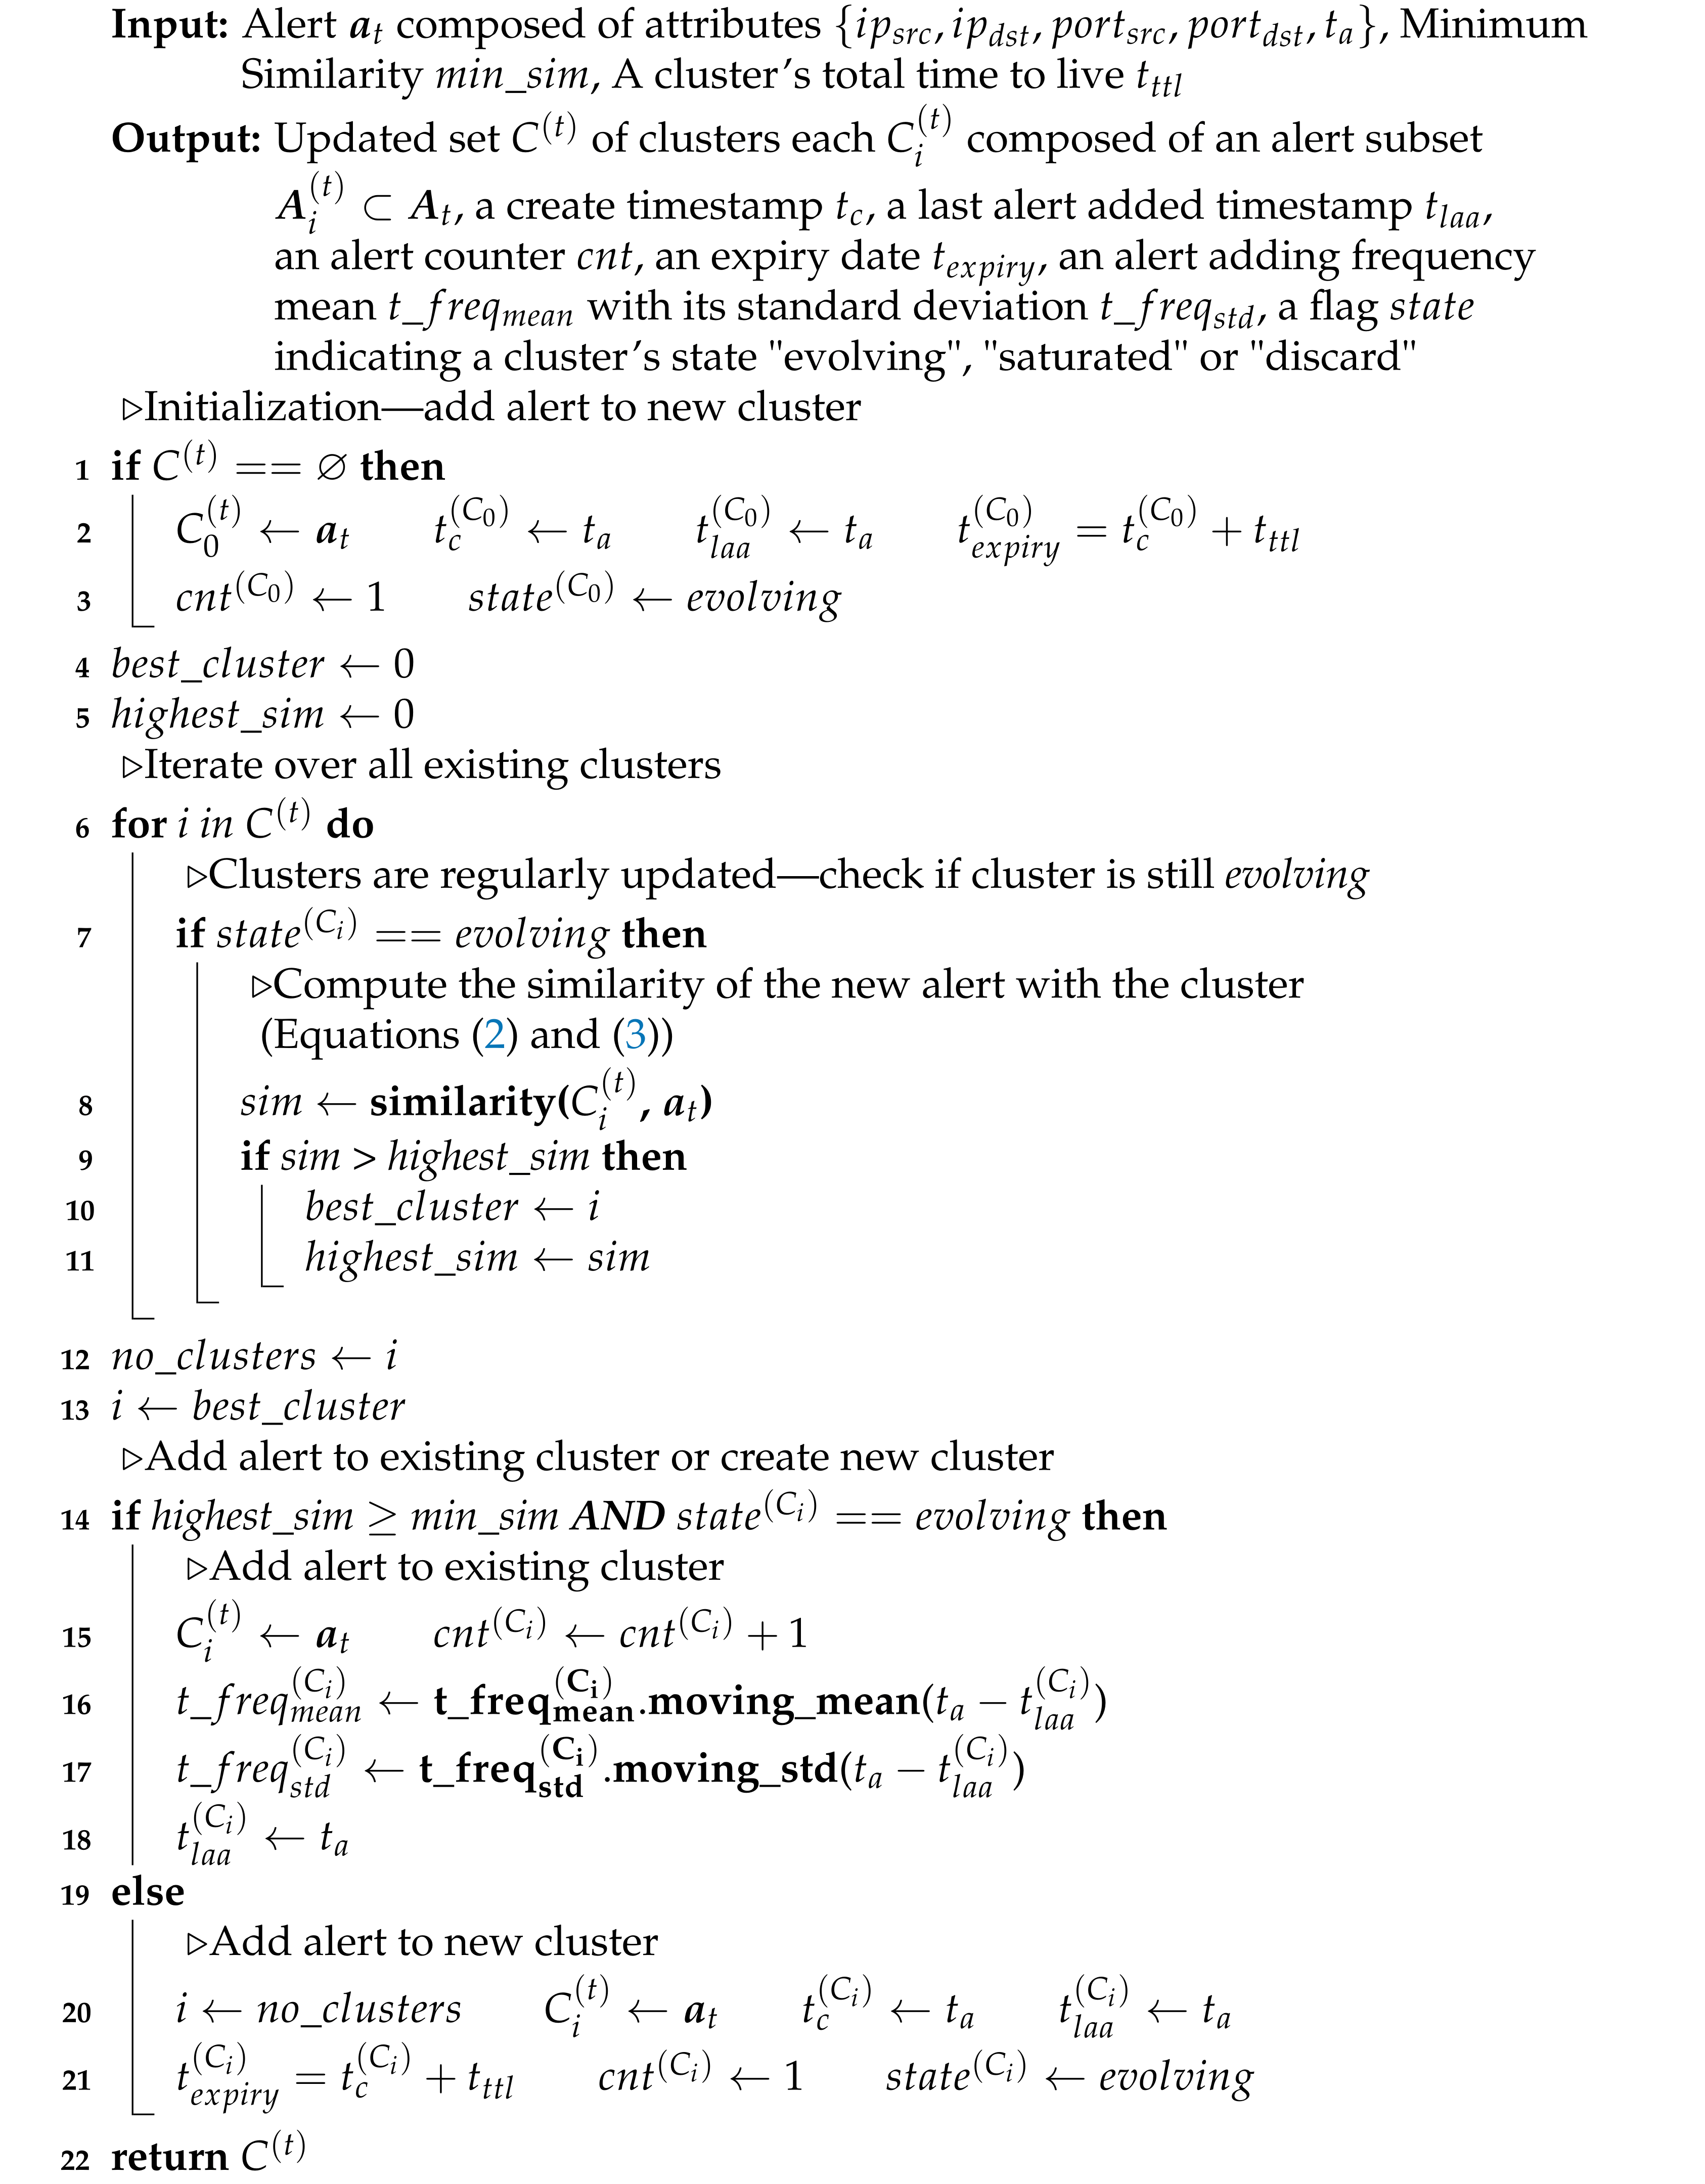
Streaming Alert Correlation/Clustering module. The streaming alert processing is performed as provided with Algorithm 1 for each oldest (first) alert
in the
Buffer. The timely order of alerts is assumed and to be given by the
Alert Preparation component. As of now, we limit ourselves to five alert attributes for streaming clustering: IP-address (source, destination—
), port information (source, destination—
) and the timestamp indicating the time when the outlier was detected, denoted as
Moreover, one is able to weight alert attributes, for instance, to give less weight to the source IP-address or source port as an adversary might spoof it during its attack scenario [
48].
| Algorithm 1: The Operation Principle of Streaming Alert Correlation/Clustering. |
![Electronics 10 02160 i001]() |
In order to achieve streaming clustering for our purposes, we extend each cluster
with additional properties beyond the simple subset of alerts, which we deem mandatory to answer the following fundamental questions: Firstly, when is a cluster saturated, i.e., when is it ready for the process of signature generation? Secondly, when is a cluster with its alerts considered outdated and should be discarded? To answer those two questions, we refer to
Table 2 and define two significant user-definable parameters: a maximum total time to live for a cluster, denoted as
, and a minimum number of alerts that should be clustered in order to reasonably represent an attack scenario for signature derivation, denoted as
. Based on those parameters, clusters are assigned the additional information of its create timestamp
, a last alert added timestamp
, an alert counter
, an expiry date
, a flag
indicating a cluster’s state
evolving,
saturated or
discard and an alert adding frequency mean
and its standard deviation
. The latter two characteristics are used to determine whether a cluster could be seen as completed in a timely fashion without stressing the very latest expiry date. Thus, as long as the minimum number of alerts per cluster is not reached, the time difference between each alert is computed, and their moving mean and standard deviation are computed by, e.g., the well-known Welford’s algorithm [
58]. If the minimum number of alerts per cluster is reached, alerts can still continuously be added to a correlated cluster as long as this process happens frequently. However, if no more alerts have been added to a specific cluster for some time, it is considered
saturated and ready for signature generation. A trivial but effective method is a one-dimensional (time) OD method based on the assumption that, if a value is a certain number of standard deviations away from the mean, that data point is identified as an outlier. The specified number of standard deviations is called the threshold whose value is user-definable, denoted as the frequency exceeding threshold
k.
With this set of information, we are able to answer the above questions. Therefore, a cluster is considered
saturated and ready to
Trigger Signature Generation when it has reached a minimum number of alerts and (from a time perspective) either the expiry date (
) has been exceeded or, for a certain amount of time, no more alerts have been added to it. Both time constraints are given by
, in which
is the current time. Both options are mandatory since the expiry date prevents, apart from the circumstance that falsely triggered alarms continuously keep clusters alive, an adversary from unceasingly triggering alerts on purpose such that a cluster is not considered saturated for the duration of the attack concealing its actual one. The second part of the time constraint prevents an adversary from leveraging its attack until the expiry date is met, allowing a maximum attack time period of
. SOAAPR is also robust to attack scenarios that can be performed on sliding window-based approaches, as discussed in [
42], in which an attacker can prevent two attack steps from falling into one window. In order to further lower the determinism for an attacker to not exploit either time boundary, a certain amount of jitter might be introduced. Thus, similar to the mechanism in [
59], the attacker might not exactly guess both timing constraints.
Algorithm 2 is proposed to monitor the clusters in a regular time-triggered manner (each time step t) to check their conditions. This is necessary since, if no alert is streaming in SOAAPR for a longer time span, clusters for the event-triggered case might already be considered saturated or to be discarded.
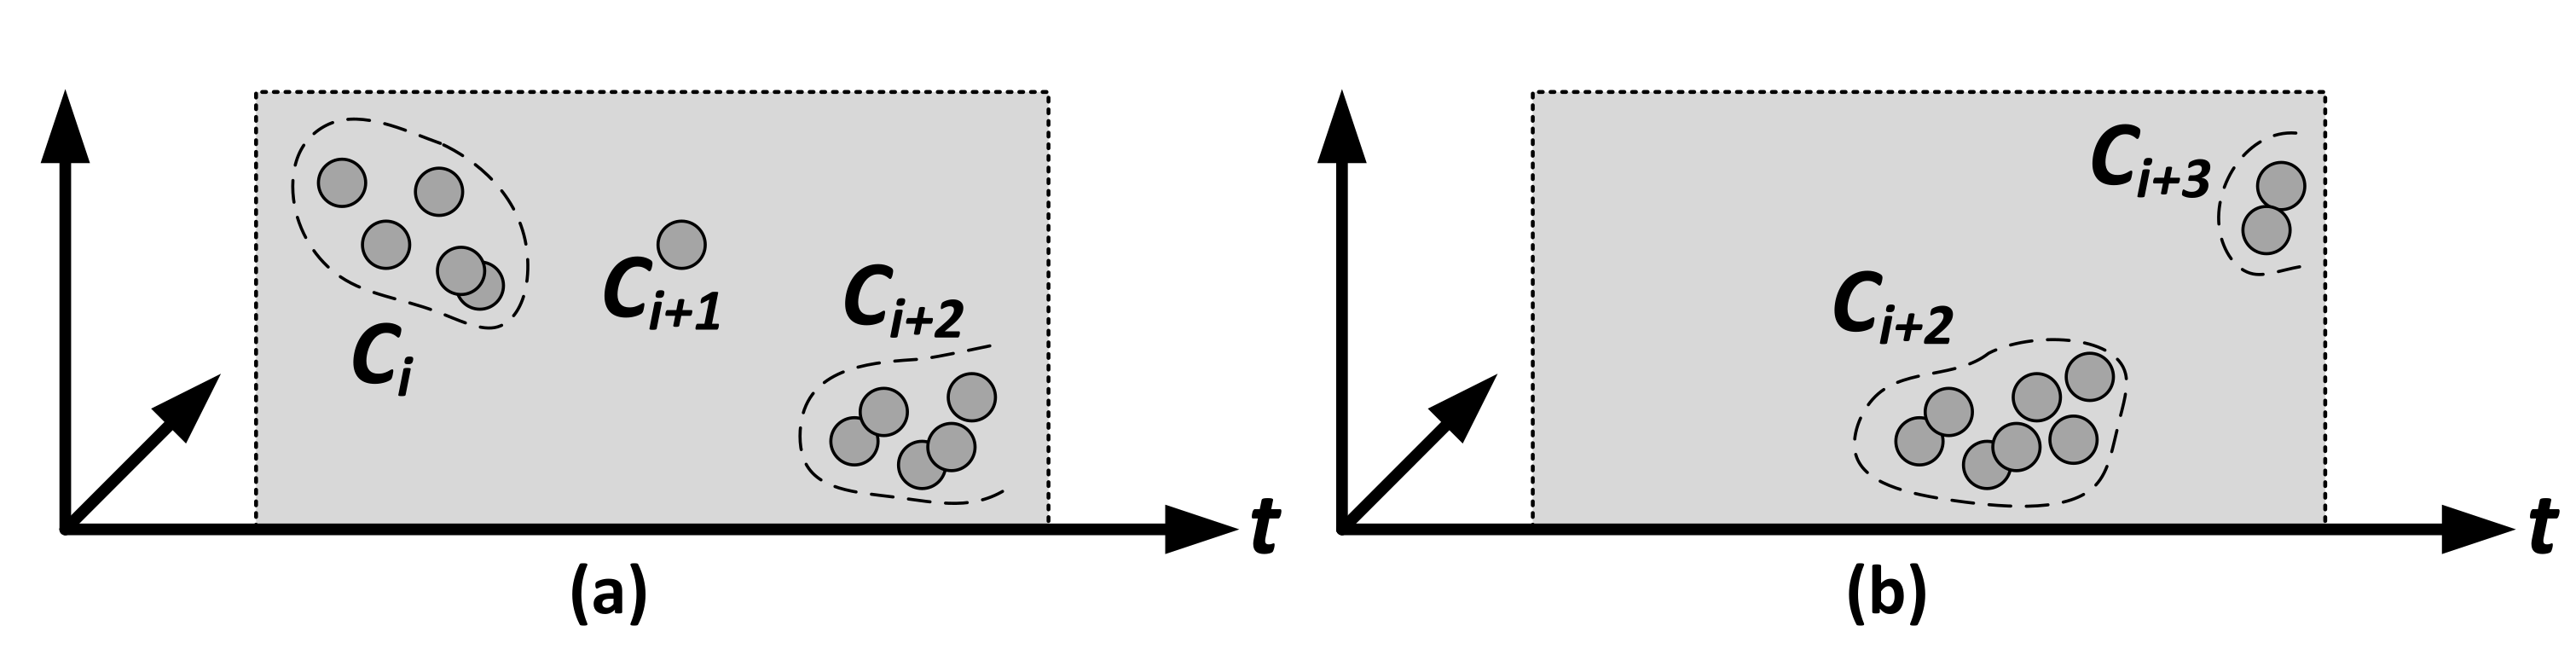
For better comprehensibility,
Figure 3 shows an exemplary scenario for two observation times (a) and (b) of (timely) evolving clusters in three dimensions—two hypothetical alert attributes and the dimension of time. Although
in (a) might have attribute correlation with
,
is already considered
saturated since the alert within
is outdated due to the frequency constraint. A third cluster
is currently in the
evolving state. Since
was ready for signature generation and
could not reach a minimum number of alerts till the expiry date, which was assigned the state
discard, both have been removed, as shown in state (b). Cluster
is assigned the state
saturated in (b) since it reached the minimum number of alerts, and no more alerts have been added for a certain amount of time. A fourth cluster
recently added two alerts and thus is in the
evolving state. Furthermore, a cluster with its corresponding set of alerts can be discarded by the
Discard Alerts and Clusters module when a signature of a cluster has been computed (assuming that the above conditions are met) or if the minimum number of alerts per cluster could not be reached before the cluster is considered to be expired.
| Algorithm 2: Monitoring of Trigger Signature Generation and Discard Alerts and Clusters. |
![Electronics 10 02160 i002]() |
Many algorithms for data stream clustering exist that operate on some similarity measure such as the partition-based approaches incremental k-means, HPStream or CluStream, which has already been used for alert correlation in [
6], or DenStream, I-DBSCAN or LDBSCAN as density-based cluster methods [
60]. For instance, established clusters feature a cluster centroid each in
l dimensions, and a new alert, characterized as a
l-dimensional data point, could be added to the cluster whose distance to the data point is the lowest. Adding the time
t as an additional dimension, one could obtain moving (evolving) clusters in
t, which gets completed as time passes, as illustrated in
Figure 3. When a new alert is very far away in time from the ones within the cluster, even if the other alert attributes are highly similar, it might not be added to it if the time dimension’s weight lets the similarity fall below the minimum similarity. However, we have deliberately decided against this approach for two reasons. Firstly, alert attributes are coordinates in the
l-dimensional space, and similarity is only a measure for each coordinate. If one is additionally interested in the similarity between two different coordinates, such as the similarity of the source IP from one alert with the destination IP of another alert, this procedure cannot be utilized. Secondly, the setting of a minimum similarity value
as a criterion, whether to add an alert to an existing cluster or not, depends on
t which significantly decreases its interpretability. The graph-based approach in GAC allows arbitrary similarity functions, although the authors limited the attributes to only compare
between any two alerts. It is not able to incorporate timing information, and an edge in the graph between two nodes (alerts) is only added if a minimum similarity value is reached. This fine-granular setting significantly influences the resulting alert similarity graph and the final alert clusters obtained from it. Thus, we have chosen a more general approach by adding an alert to a cluster in a streaming fashion by measuring the similarity of a new alert
with the whole
i-th cluster
by utilizing Equation (
2), where
is the
j-th alert
of
. The notion of time is, contrary to [
40], included by the time constraints of the expiry date and frequency transgression while not blurring
in a timely manner.
The similarity in between the new alert
and the
j-th alert
of
can be computed by Equation (
3), utilizing attribute-specific comparison functions, denoted as
, which might be individually weighted by
(typically
) for a total amount of
K comparison functions and
x,
y not necessarily the same attributes of
and
.
For network-related alerts, the attributes
are the most important and common ones [
40]. However, contrary to GAC with
, whether the compared attributes are unequal (0) or equal (1), and
for each
k, we utilize comparison functions shown in
Table 3. In addition, with regard to
, we check whether the source IP-address of the new alarm compares to the destination IP-address of an existing alert, which might be an indicator that a host was already compromised, taking into account that the victim communicates with the attacker. The same applies for the identity check of the source port of
with the destination port of
.
For iterating over all existing clusters of the current set with each new alert and calculating the similarity of it with the subset of alerts in each , one might assume high complexity in terms of time and space. However, the number of comparison functions K is fixed, and the number of clusters in the current set can be seen as fixed as well since it only fluctuates when new clusters occur, but expired or saturated clusters disappear over time. Thus, with respect to streaming alerts , the Streaming Alert Correlation/Clustering module has only linear time and space complexity since only the number of alerts in an existing cluster can increase until it is expired, which demands space and time by computing the overall similarity of the new alert with all alerts of each existing cluster. As already mentioned, an attacker might take advantage of producing as many “decoy” alerts as possible to keep alive and fill a cluster until is satisfied to stress out the time and space complexity. However, the attacker might only be able to trigger a limited amount of decoy alerts since the alerts are generated by the online OD algorithms, and too many “outliers” would represent a concept drift in . Thus, malicious data might be seen as normal after a certain amount of time, and no more alerts that stress SOAAPR are generated. SOAAPR achieves a decent tradeoff between a “real-time” detection by ideally analyzing each individual alert generated by online OD in order to immediately react to an attack (which is impossible in real-world scenarios by the massive amount of streaming alerts afflicted with FP and FN) and a “near real-time” detection with a certain delay by the clustering process to obtain a decent amount and human-manageable set of alerts representing potential attack scenarios.
3.4. Signature Generation and Sharing
Inspired by the idea in [
9] to derive privacy-preserving signatures and fingerprint-like characteristics of novel attack patterns by only utilizing the alert information commonly available with IP and port information, we extend it in SOAAPR. Clusters containing a huge number of alerts representing an attack scenario can be significantly reduced to a fixed-sized characteristic by transforming the communication relation of hosts that were involved in an attack into a directed graph-based structure to derive so-called motif signatures initially proposed in [
41]. This enables a more fine-grained characterization of attacks compared to other work discussed in
Section 2.5, such as [
40], only differing between four types of communication patterns. However, with the ever-increasing complexity of novel attacks, we deem that (i) not only the communication relation is a mandatory attack characteristic but also (ii) the data’s attributes or features of the data
, which are mainly responsible for shaping an attack and, thus, causing outliers, as well as (iii) the temporal pattern between the alerts. Considering these three metrics for fingerprinting clusters by deriving three signatures denoted as
(i),
(ii) and
(iii), we can achieve a more comprehensive and even more fine-grained characterization and comparison of attack scenarios while still satisfying the privacy-preservation benefit.
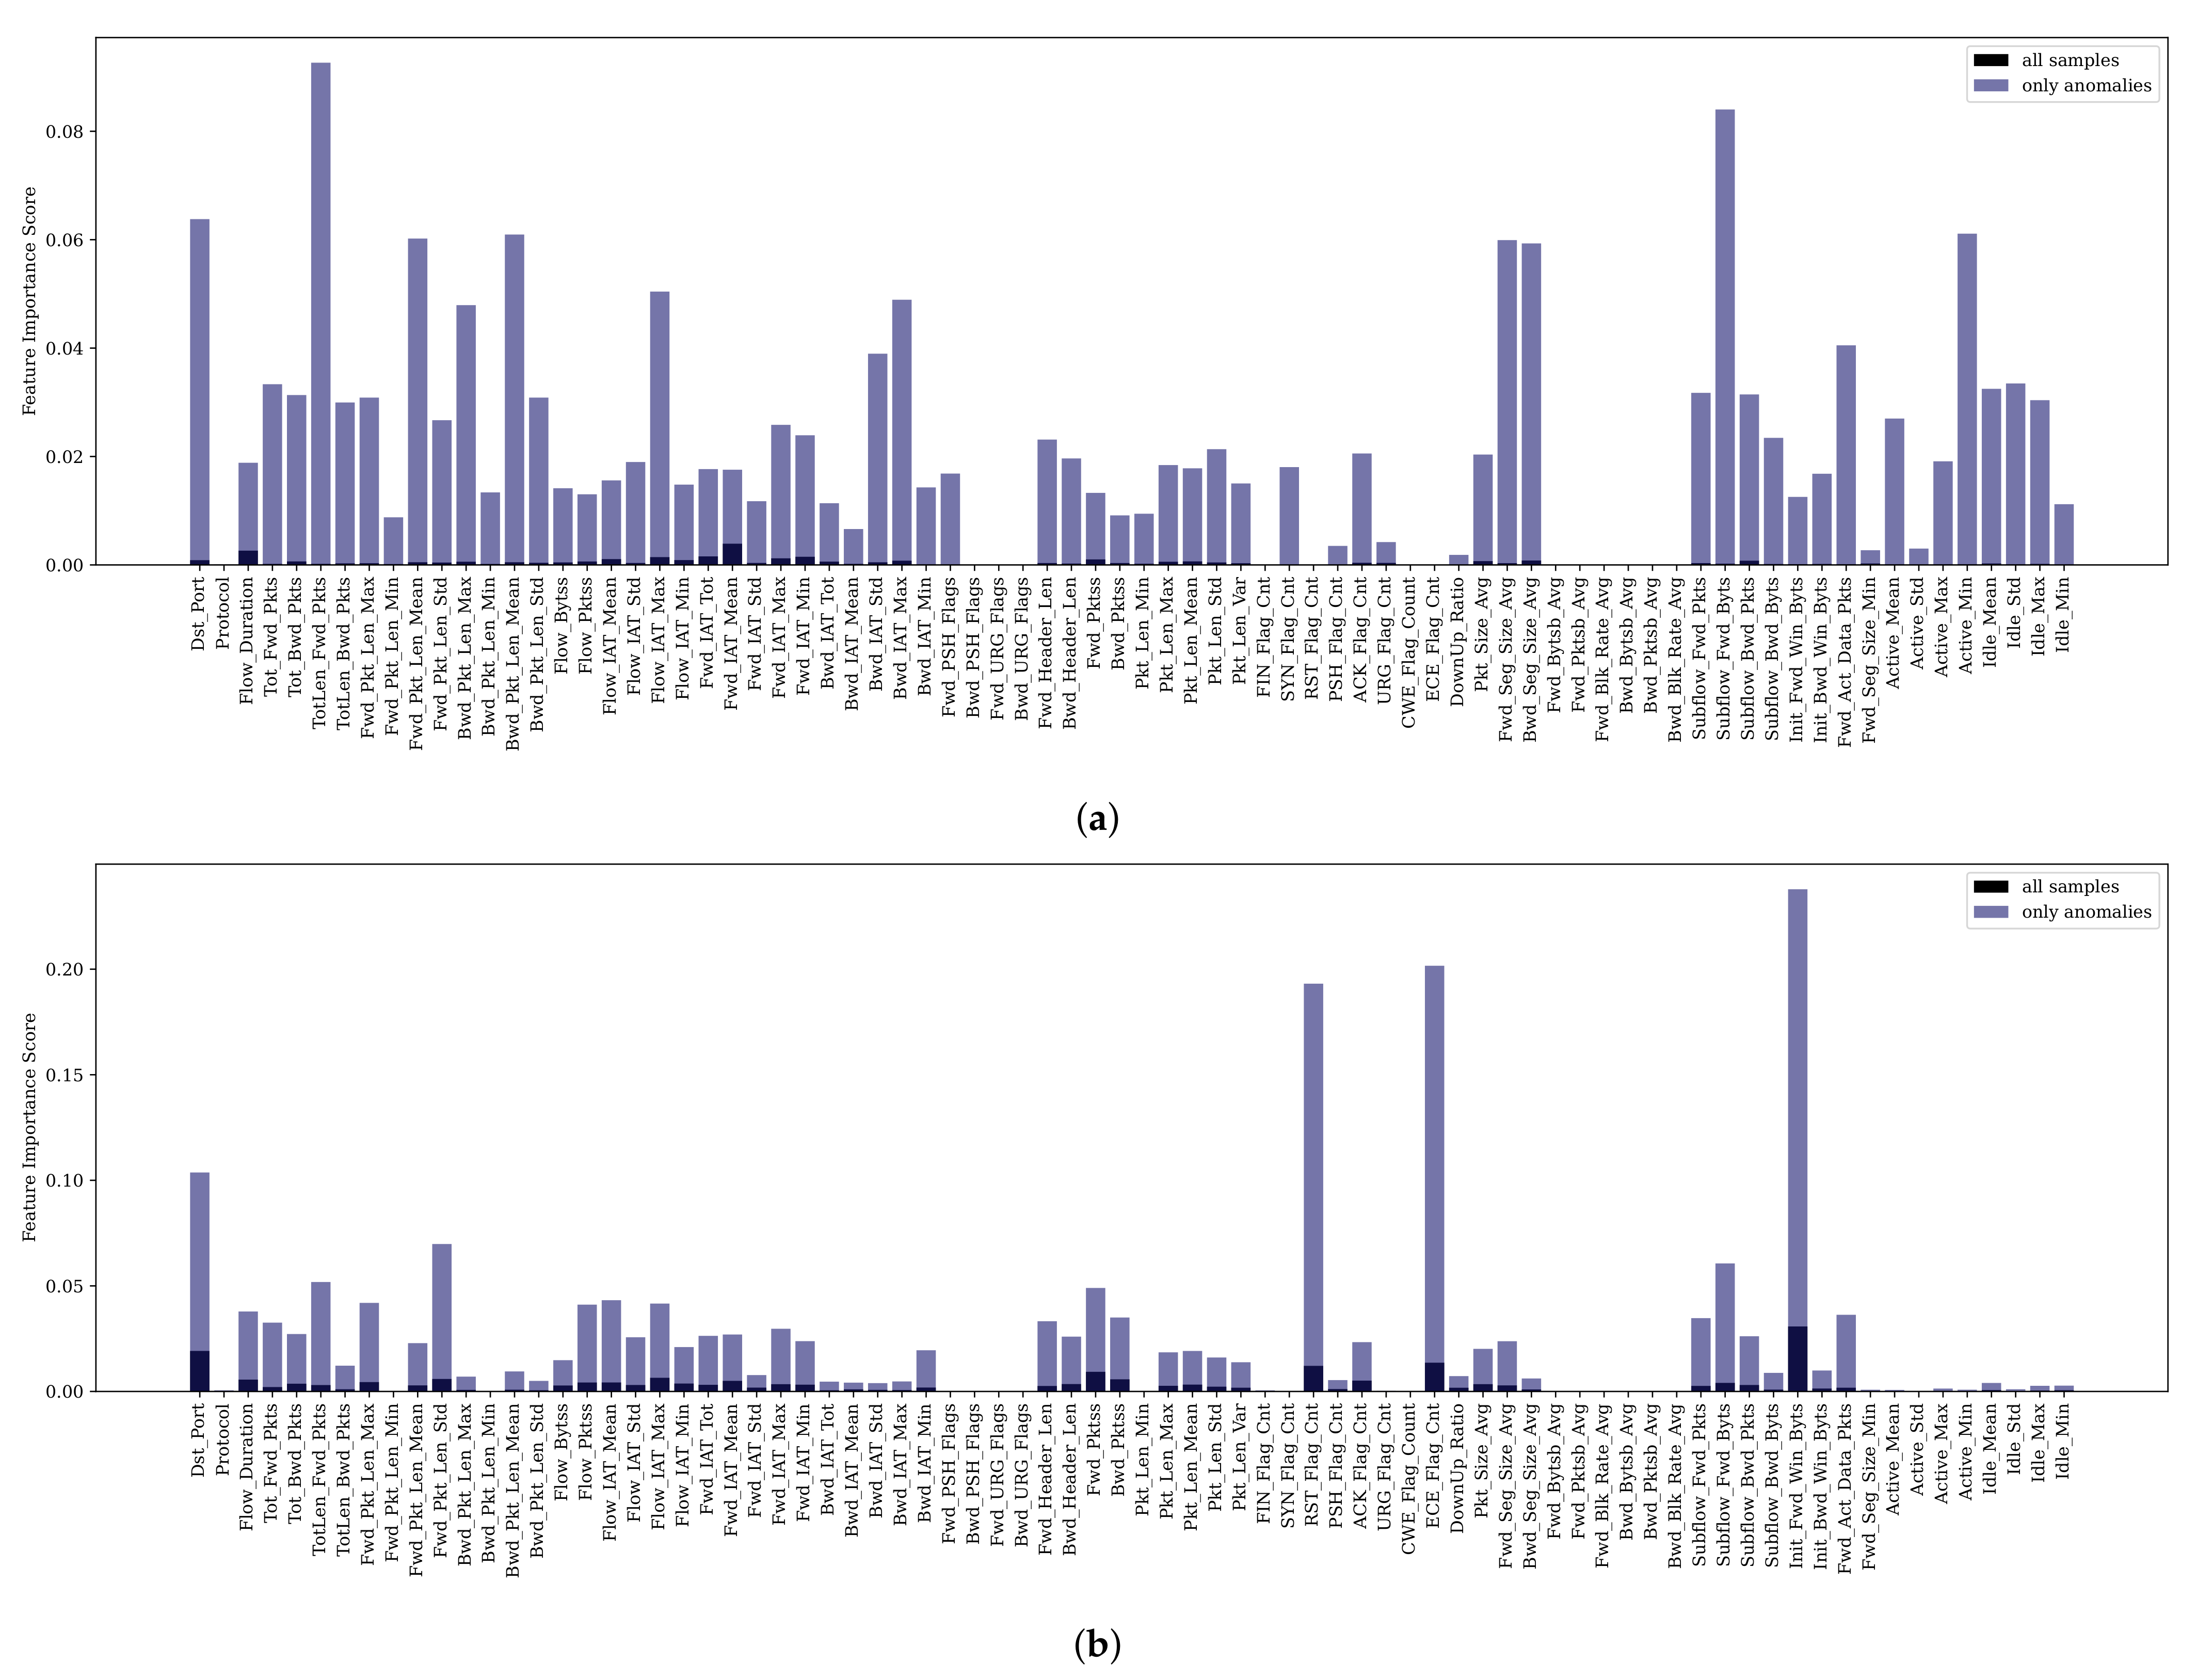
We see ourselves encouraged in our assumption of introducing the additional signature
since certain types of attacks and their affected outliers are predominantly caused by the same features. As could be shown in [
61], some features have been more significant over multiple attack scenarios, e.g.,
B.Packet Len Std,
Flow Duration or
Flow IAT Std, and certain types of attacks are more reflected by dedicated features referring to Table 3 in [
61]. For instance,
Subflow Fwd Bytes and
Total Length Fwd Package are most influential for Infiltration and Bot attack types, or the
Bwd Packet Length Std is a typical feature whose outlierness indicates DoS-like attacks [
61,
62].
Likewise, our assumption proposing that
is strengthened by the statement in [
48] that a series of intrusion actions performed by an attacker is more concentrated in the temporal domain than random FPs. As similarly stated in [
48],
will likely not characterize a real attack with precision since an attacker might try to manipulate the timing of its attack steps forging the time interval between triggered alerts, or
might be blurred by FP alerts. It is nevertheless a reasonable approach for capturing the temporal behavior of attacks. In particular, it is easier for an attacker to manipulate the timing of a multi-stage attack than for a single step (focus of SOAAPR) since some tools, e.g., Metasploit, are often used, whose execution, resulting in potential alerts, might not be tampered in a timely way.
Although each signature might not fully characterize an attack on its own, such as
proposed in [
9], the combination of the signature triplet, potentially weighted as well, better allows characterizing attacks and finding novel patterns that somehow share similarities with other signatures. Thus, deviations of one of the signatures from similar attack scenarios can be better compensated by the others. It must be noted that meaningful signatures can be derived when a cluster contains all relevant instances of an attack, ideally free from FPs and FNs, which is an especially ambitious intention of utilizing OD. Having the knowledge about the communication relation of hosts, whose features are the most important for a certain attack scenario and the timing behavior of a potential attack scenario, significantly provides a more intuitive root cause analysis process for a human expert than analyzing correlated alerts on its own.
3.4.1. Generation and Comparison of
Since it is described in detail in [
9], we only provide the most important steps to perform signature generation for
and comparison but strongly recommend the original work. In order to derive
, we take advantage of the alert attributes
representing the communication structure of two hosts communicating over a port (
). Those attributes are contained in each alert
of the
i-th cluster
, as shown in
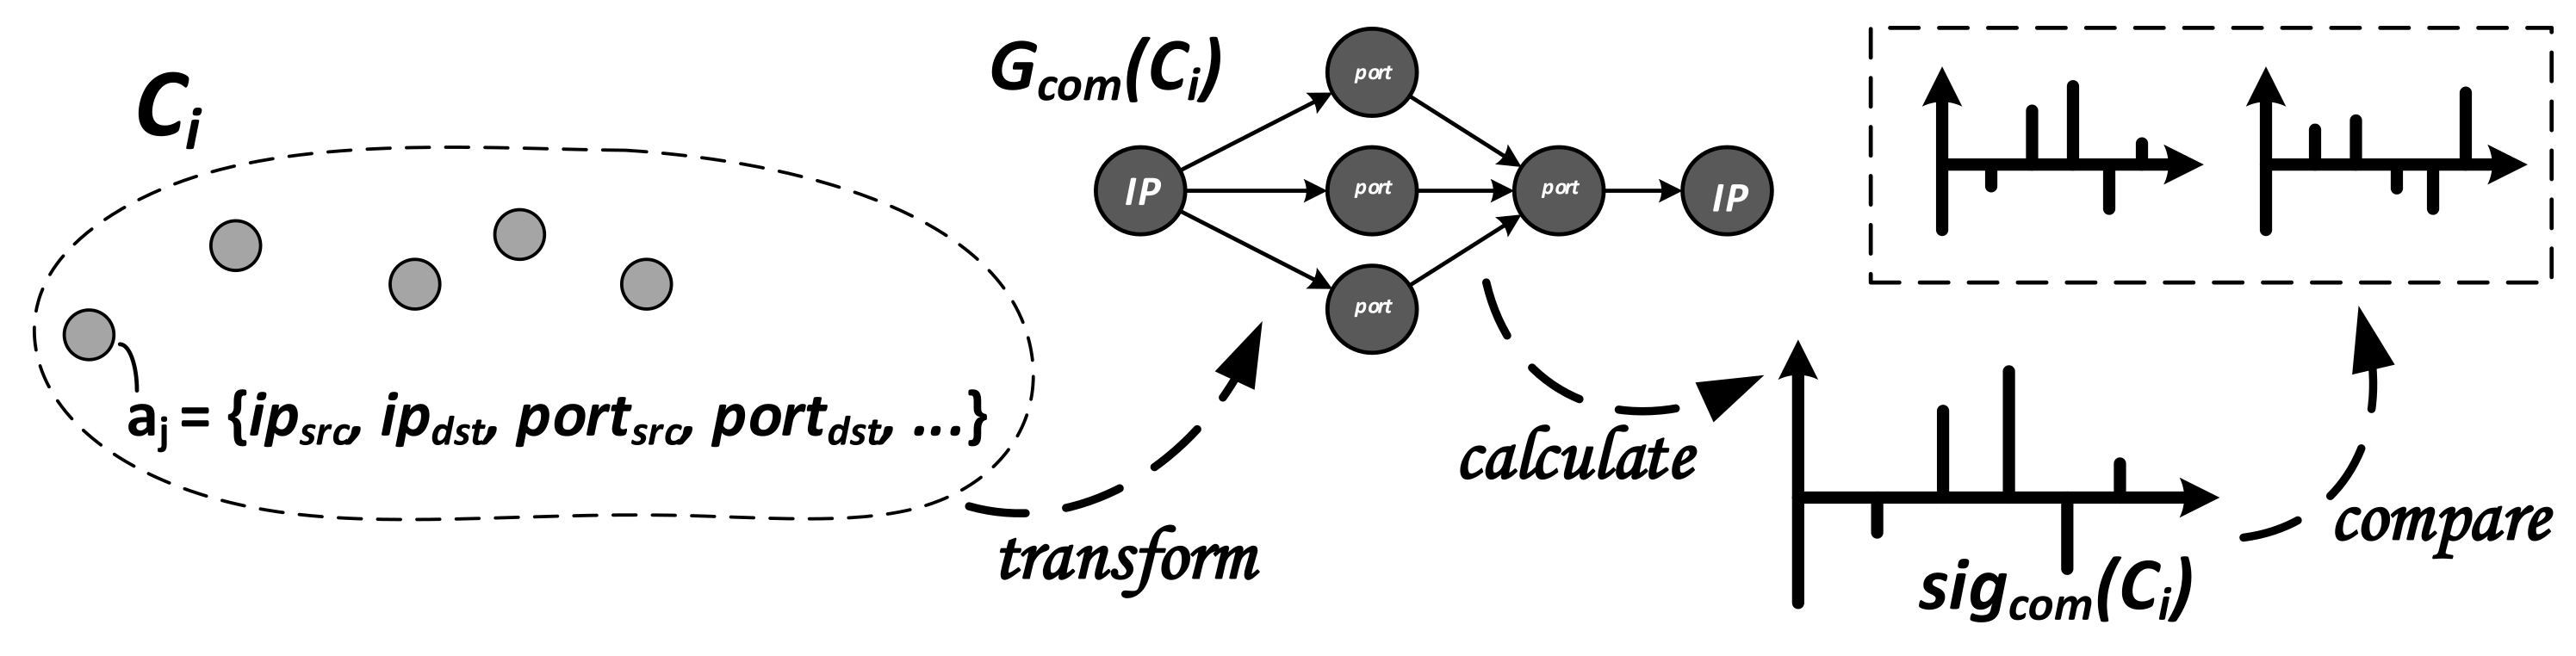
Figure 4. To
transform all alerts into a network graph
, nodes of the graph either represent hosts via the IP-address
or ports that are bound to the respective IP-address
. The edges of the graph are reflected by information on who attacked whom:
.
With this intuitive communication direction, a directed graph structure is obtained. In order to
calculate the signature, all sub-graphs
are enumerated, which are assigned to motif patterns
. The accumulated number of occurrences of every
will yield an absolute signature
. Since
depends on the graph size, a comparison can be achieved by utilizing the so-called Z-Score [
41]. Briefly summarized, a random graph structure with the same size and the same number of edges as
is derived and utilized to generate a “relative” signature denoted as
, which represents
with respect to
Figure 4. In order to
compare two such signatures,
and
, they are interpreted as two vectors of a fixed length in a multi-dimensional space. The similarity between
and
, independent of their length, can then be derived by calculating the angle
between the two vectors, as shown in Equation (
4), in which
is the inner product and
the Euclidean norms.
3.4.2. Generation and Comparison of
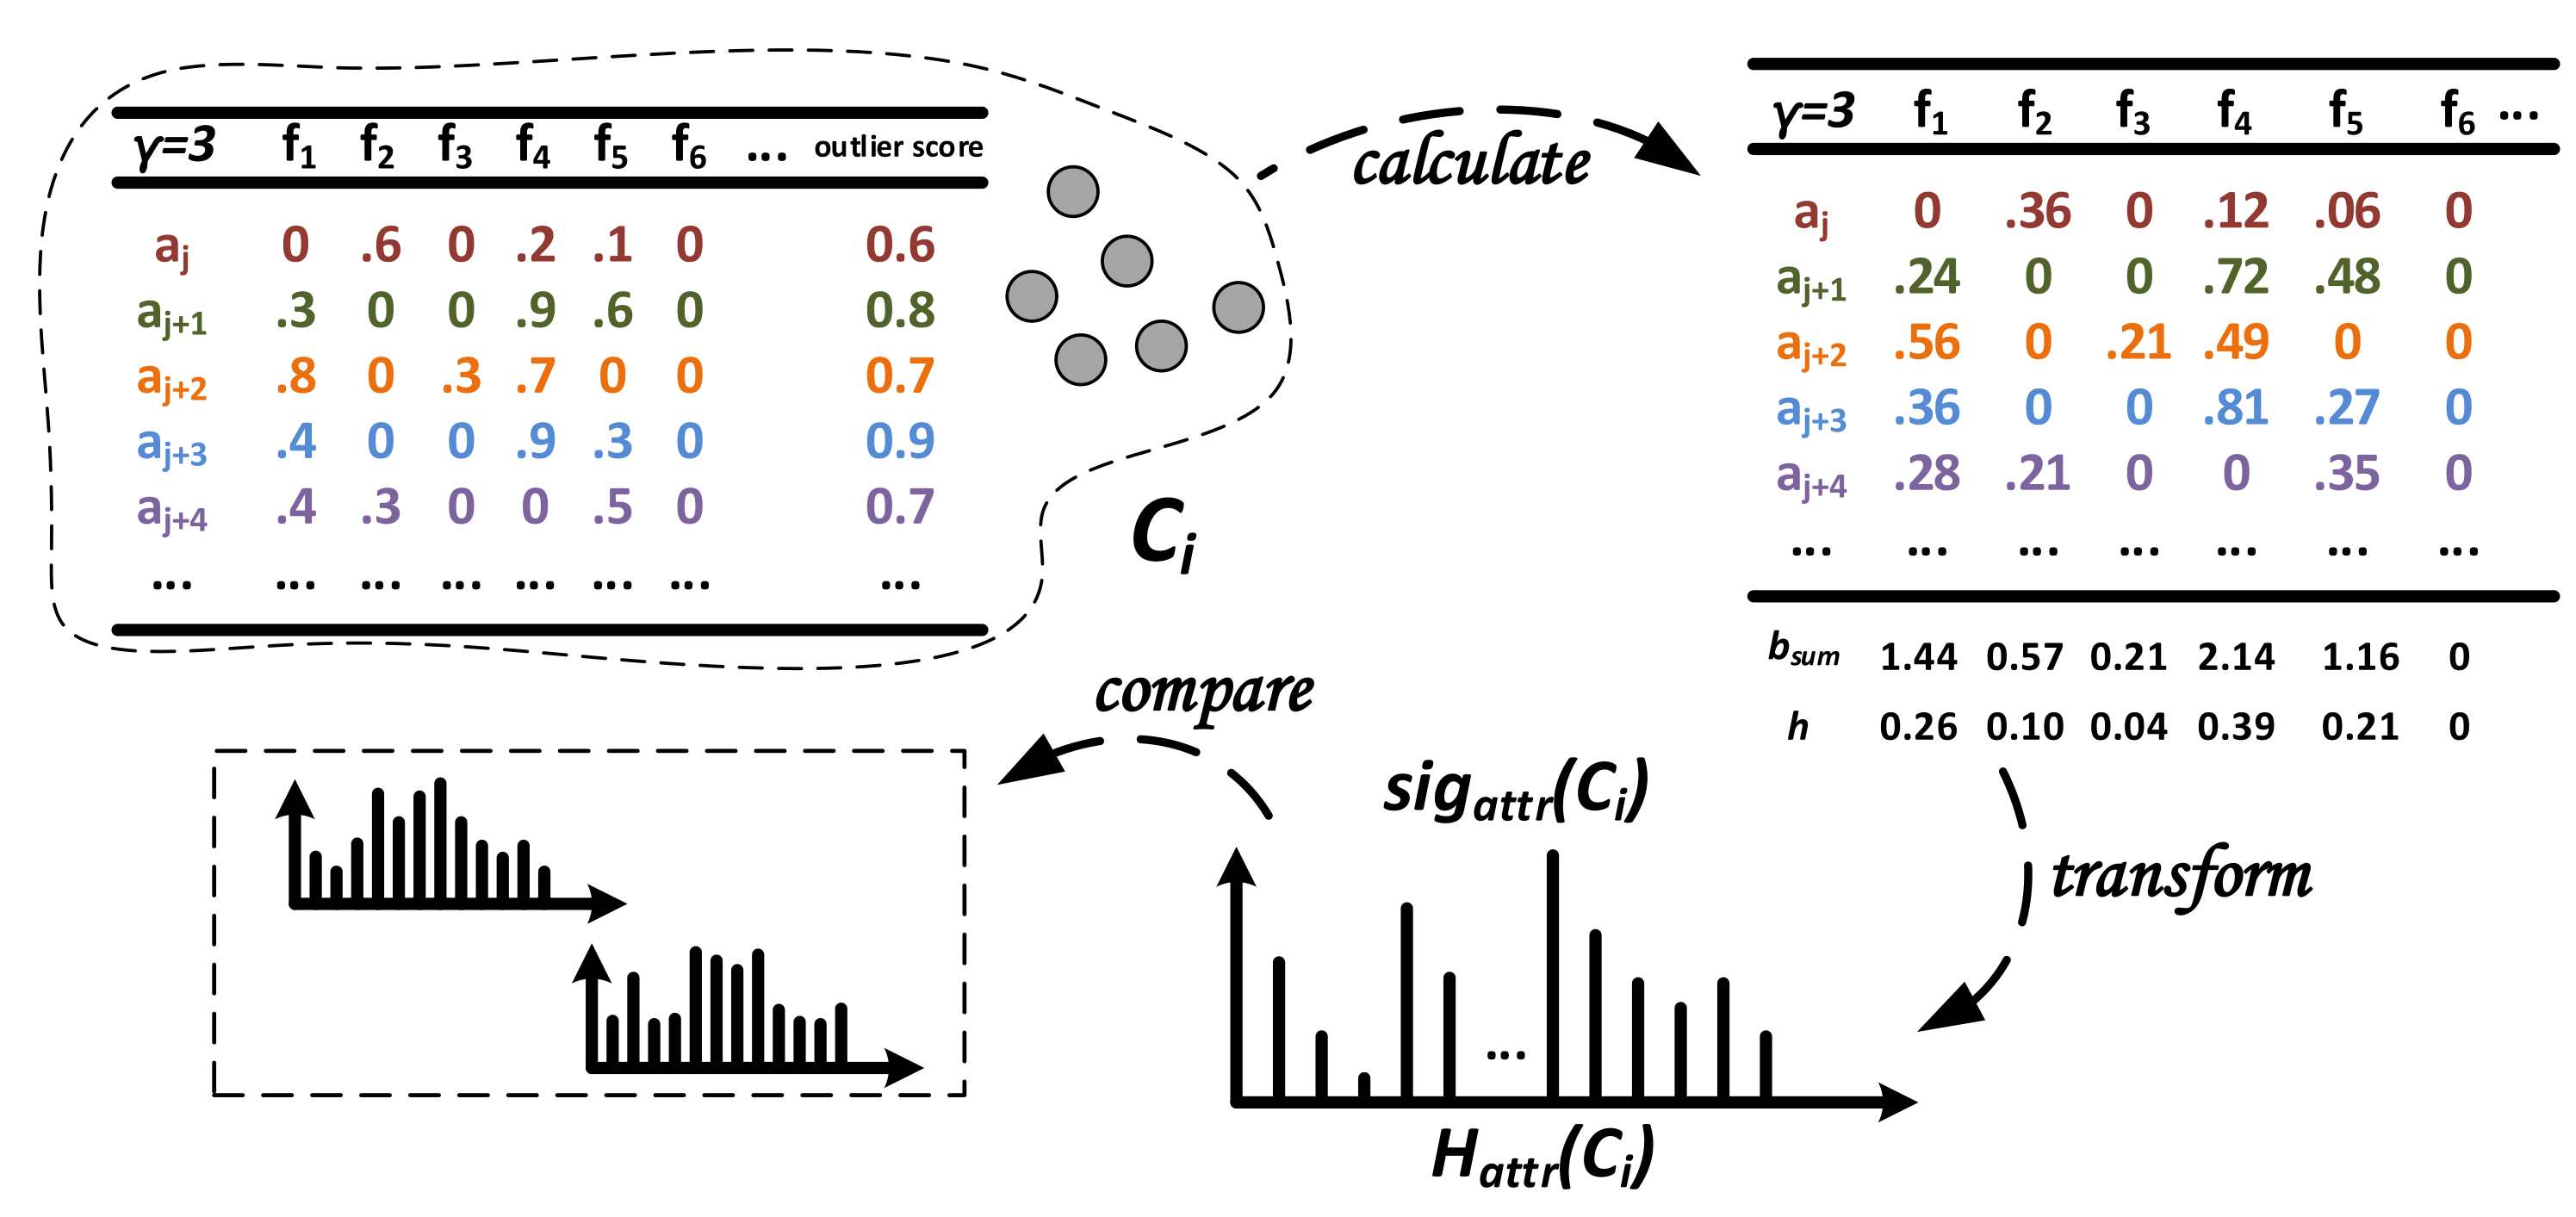
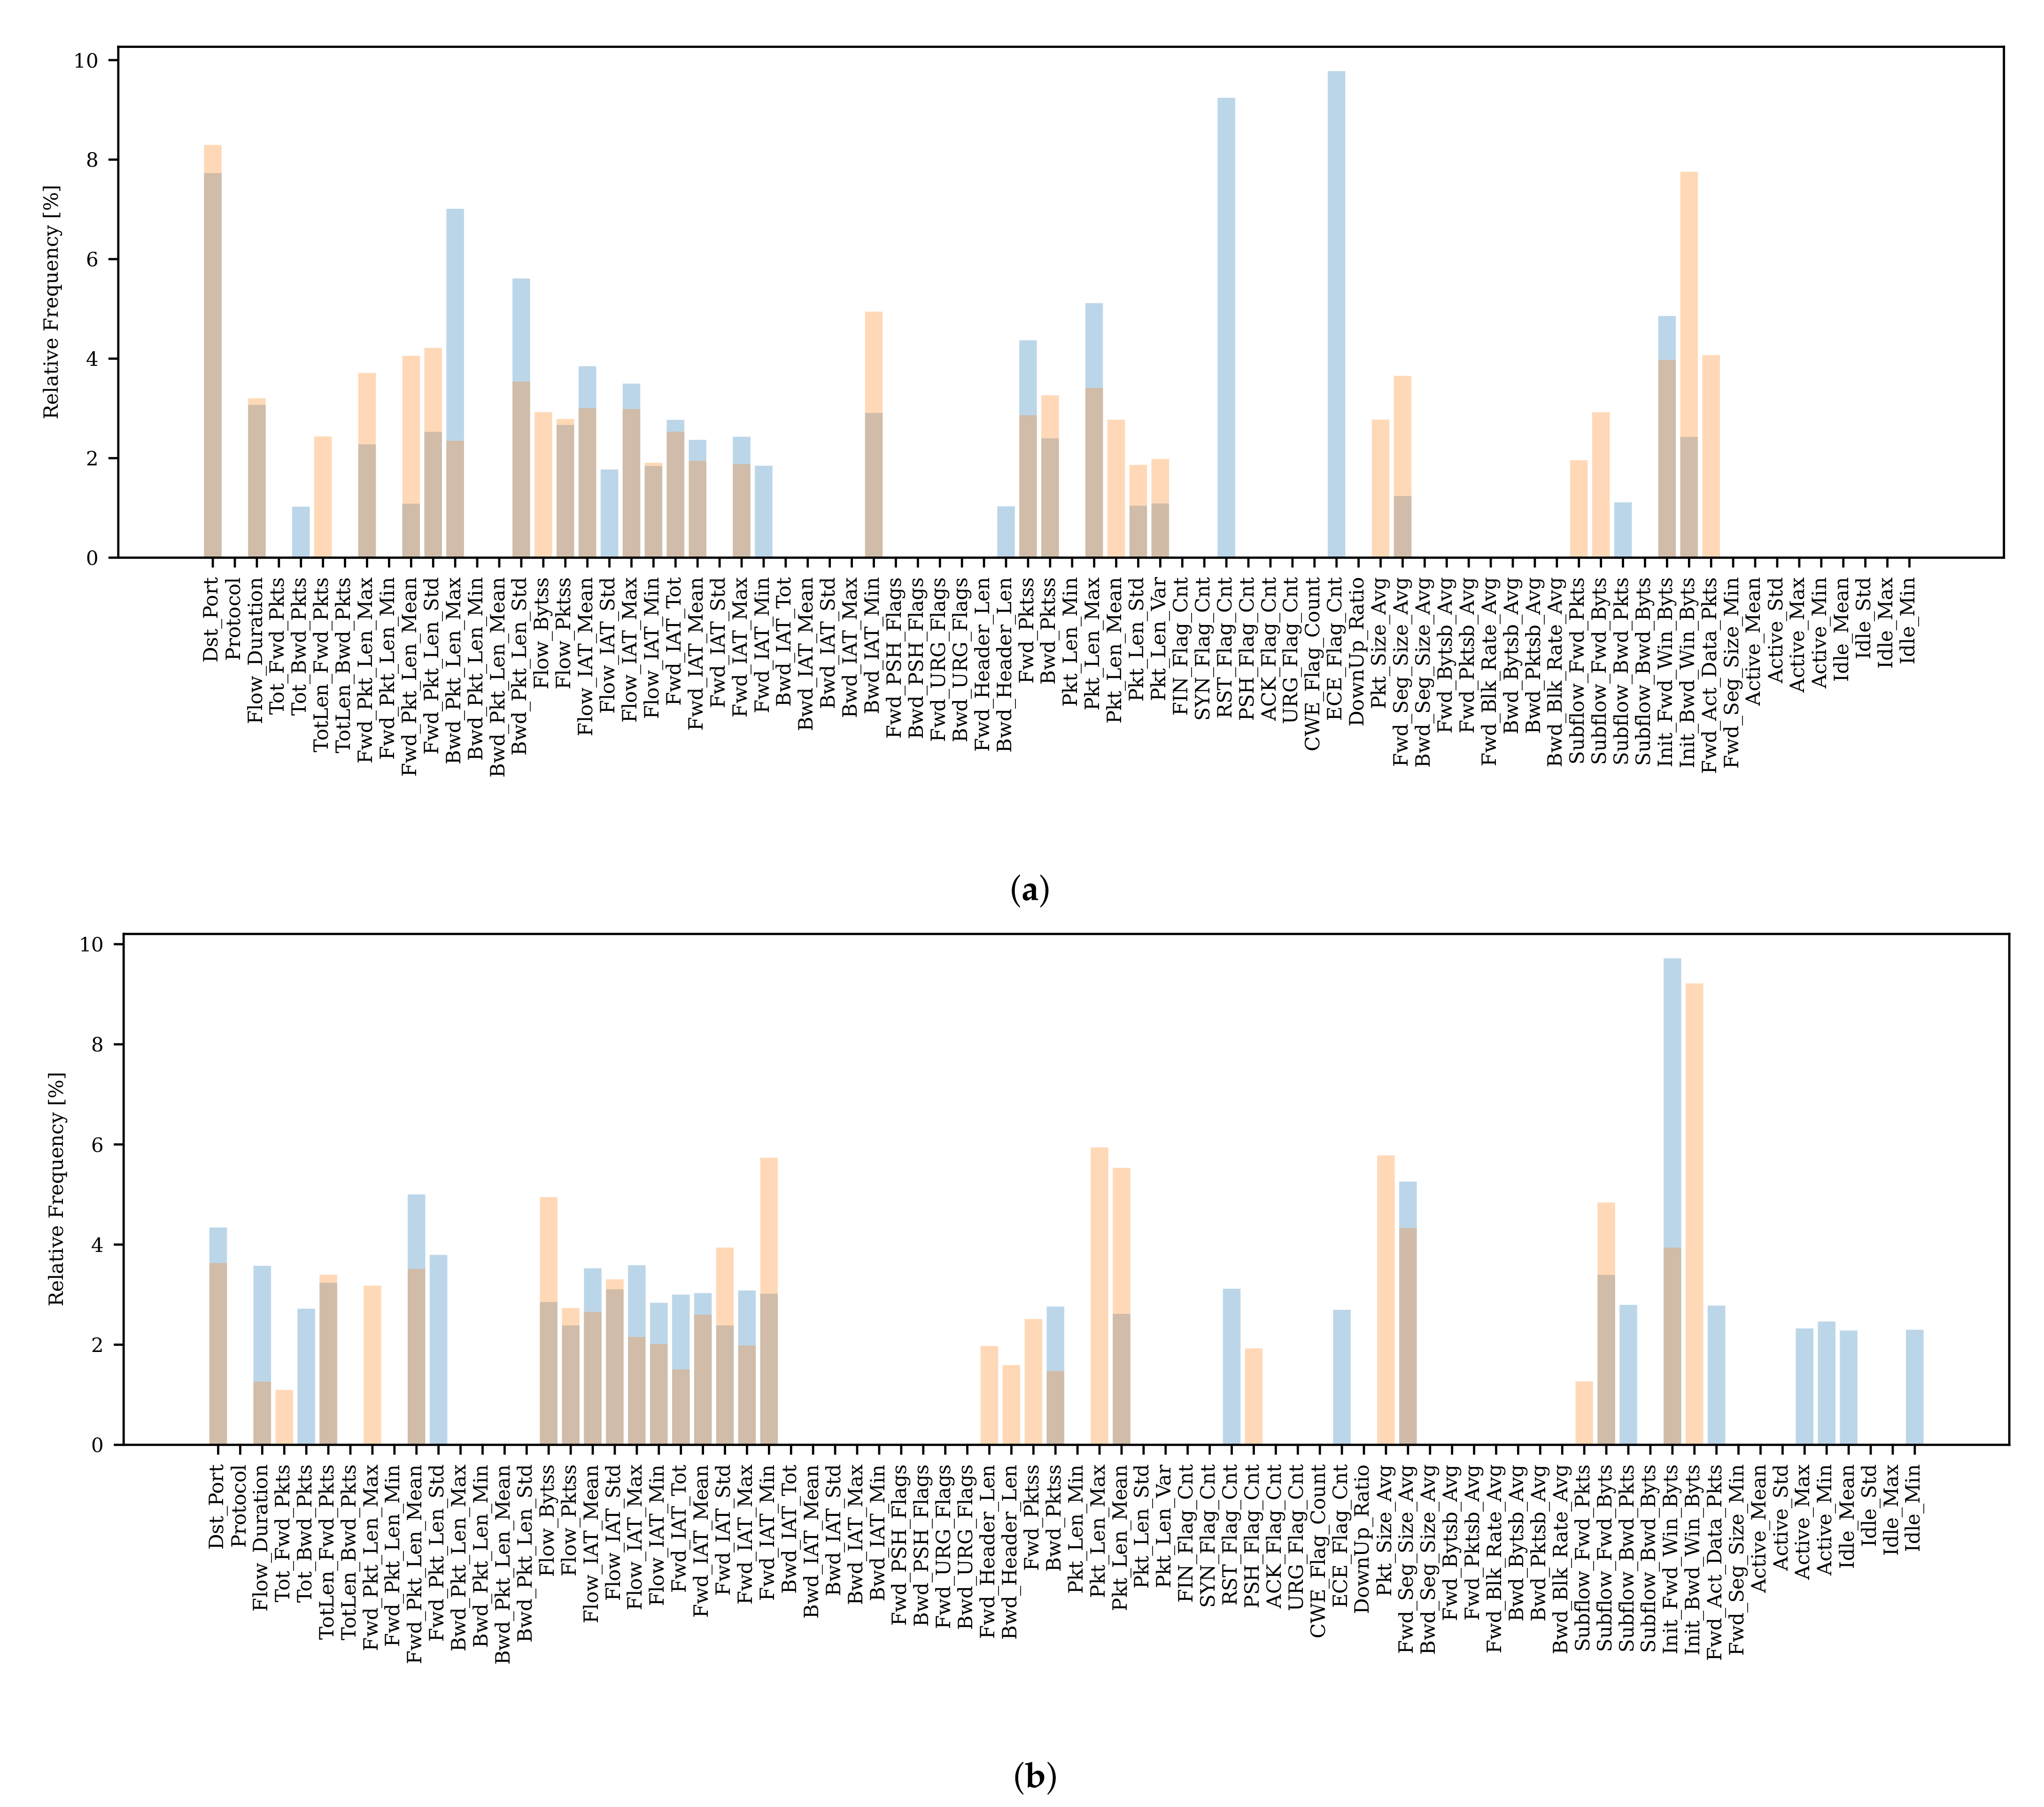
Considering that for different attack scenarios, certain features are more distinctive, we take advantage of a different approach than the graph-based one for in order to calculate and compare signatures . In general, we transform feature importance information into a histogram describing that characterizes the potential attack scenario clustered in .
In the example in
Figure 5, each alert
of the cluster
provides the feature importance score values for the top-
-features of the set
consisting of
d features (score values of other features are set to zero) and the corresponding penalized meta-alert outlier score
. Each feature
of
represents a histogram bin (bucket), and the count (frequency) of this bin is computed by adding up each score per feature
weighted with the outlier score provided by each alert in the cluster. In the example, this leads to
. Finally, we compute the relative frequency
h of each bin by
.
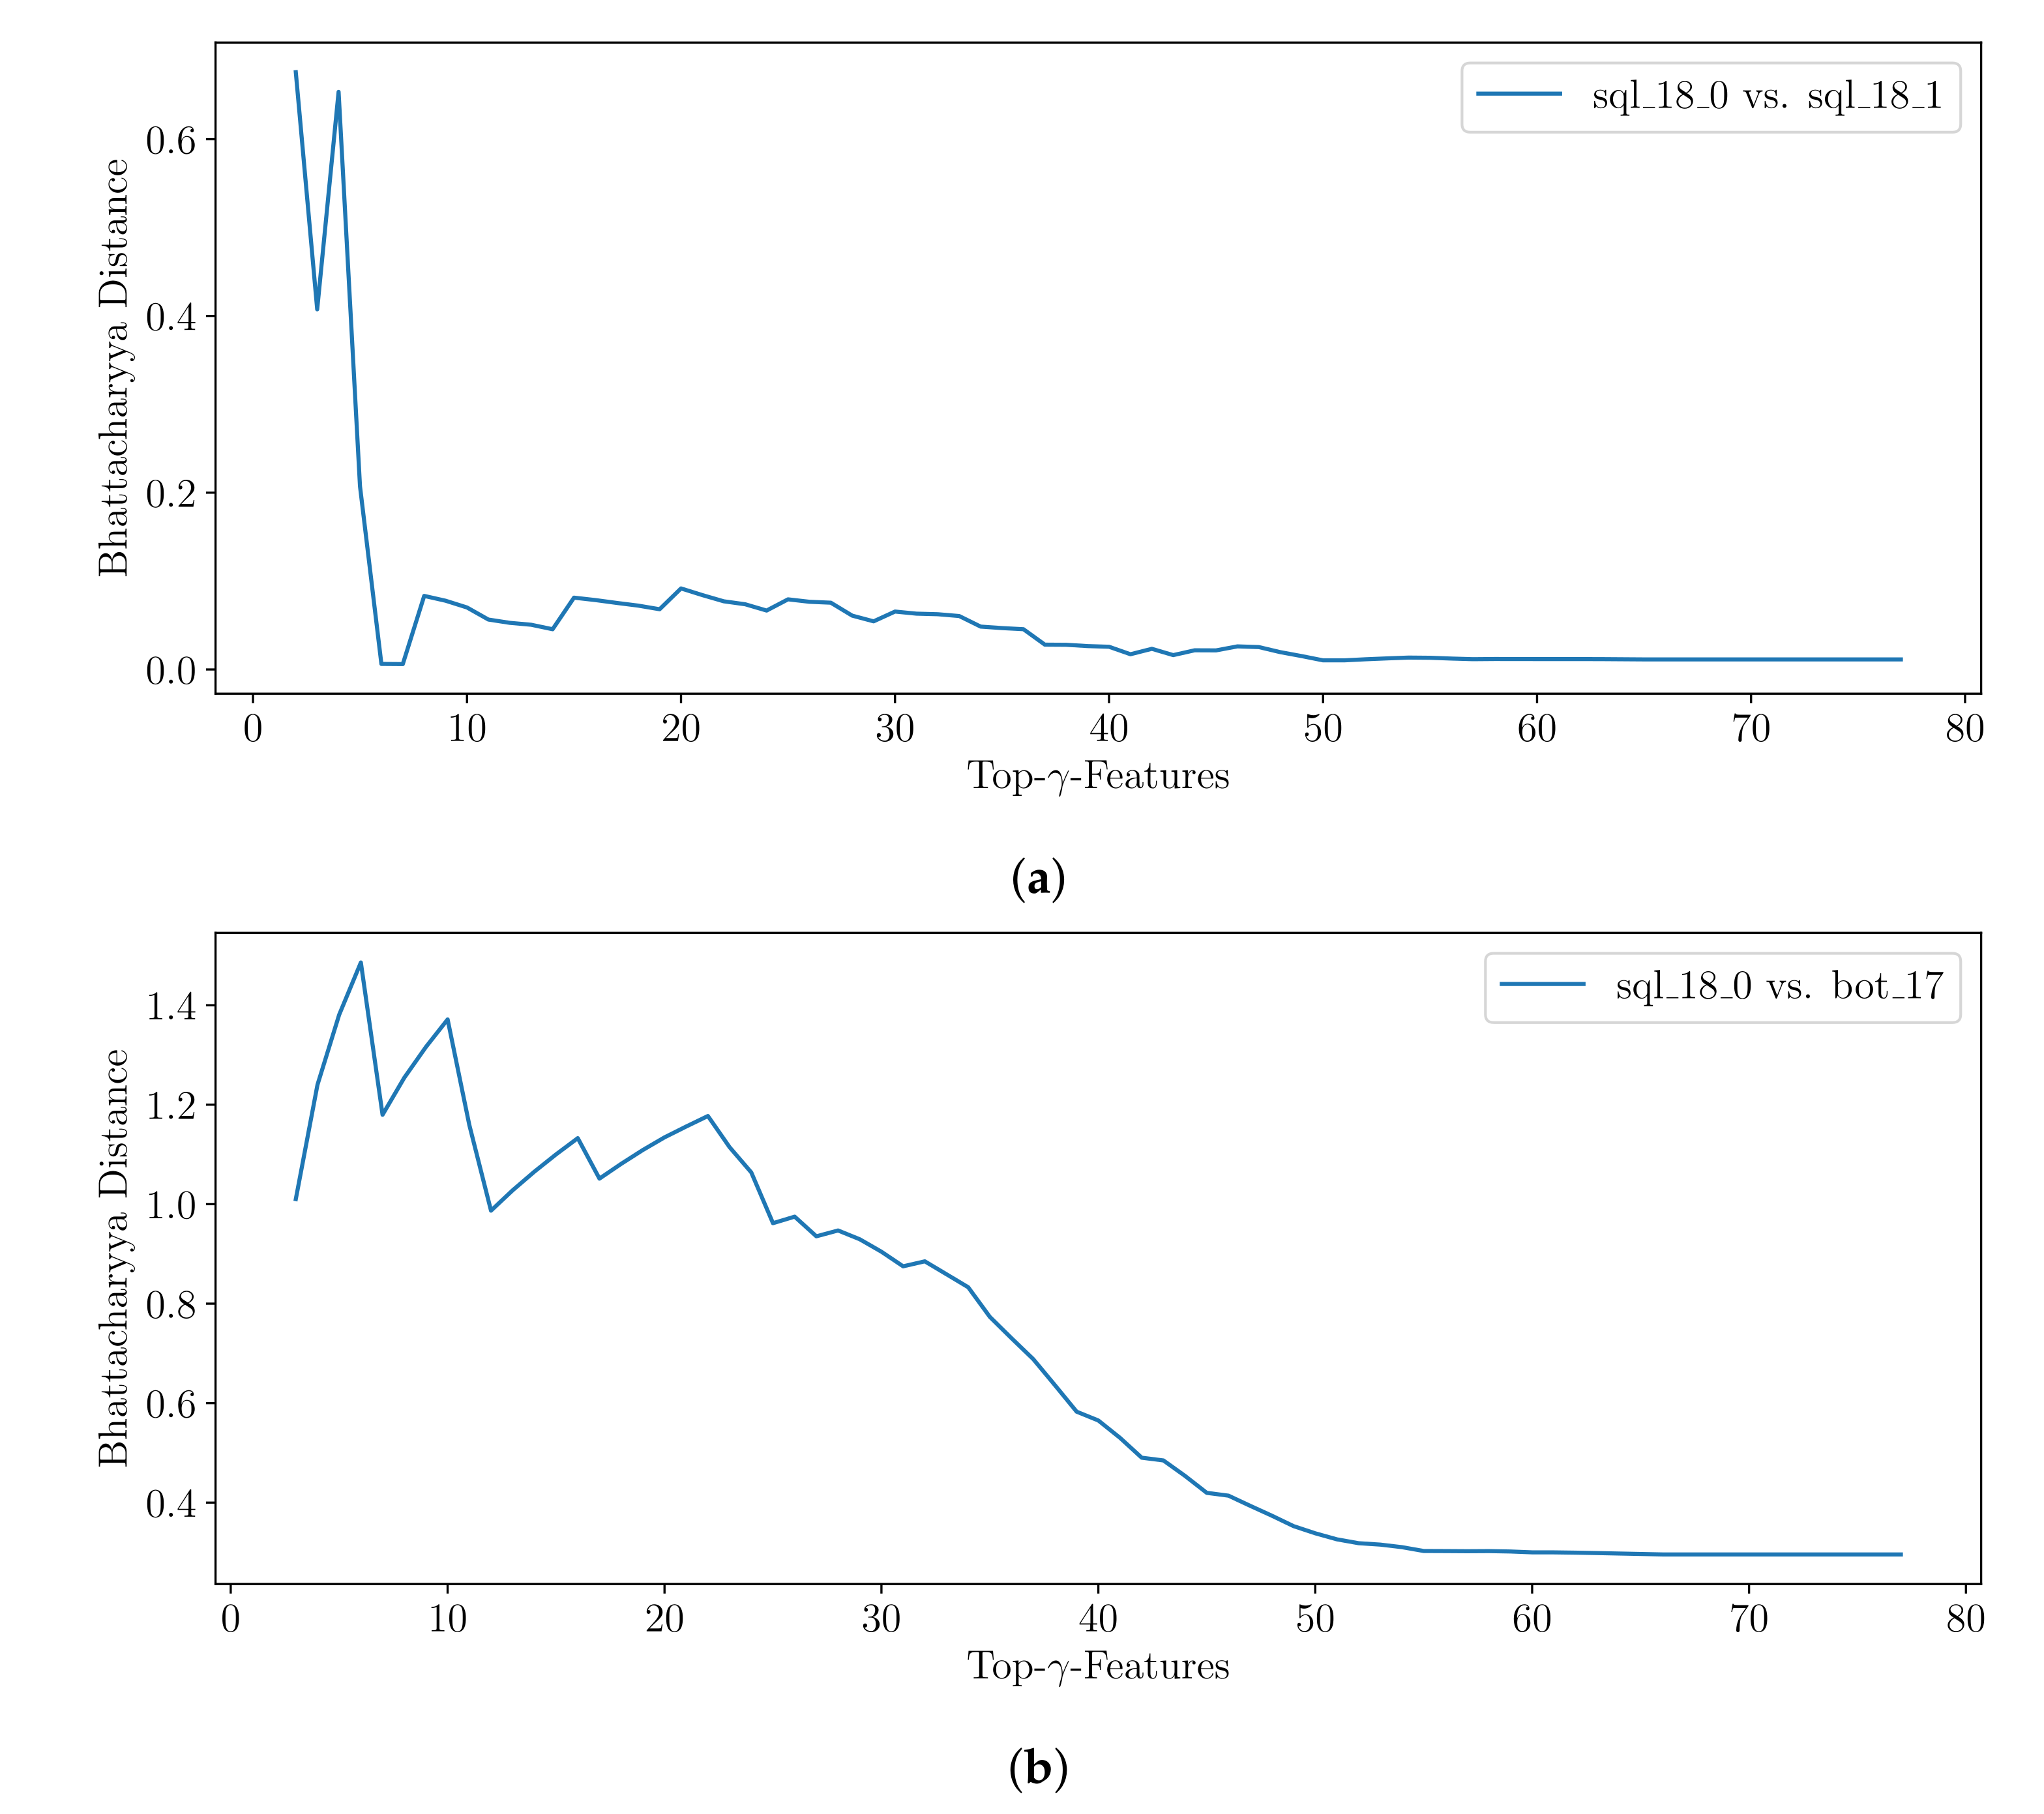
In order to
compare two signatures, one can take advantage of methods computing the similarity between two statistical distributions, which are represented by any two histograms
and
obtained from clusters
and
. Although the two-sampled Kolmogorov–Smirnov test can be modified to function on discrete data, as it applies for binned values in the histogram, it is normally used for continuous data [
63]. Two of the standard choices in the discrete case are the well-known chi-squared test and the Bhattacharyya distance measure [
64]. Here, we apply the Bhattacharyya distance
between the histograms
and
for
B equi-width bins
b with the (relative) frequency
h, which is defined as given in Equation (
5). It takes values in the range of
.
is the Bhattacharyya Coefficient (Equation (
5)) for which
applies. We obtain identical histograms and thus identical signatures
between two attack scenarios if
applies. The higher the
, the more different the signatures are.
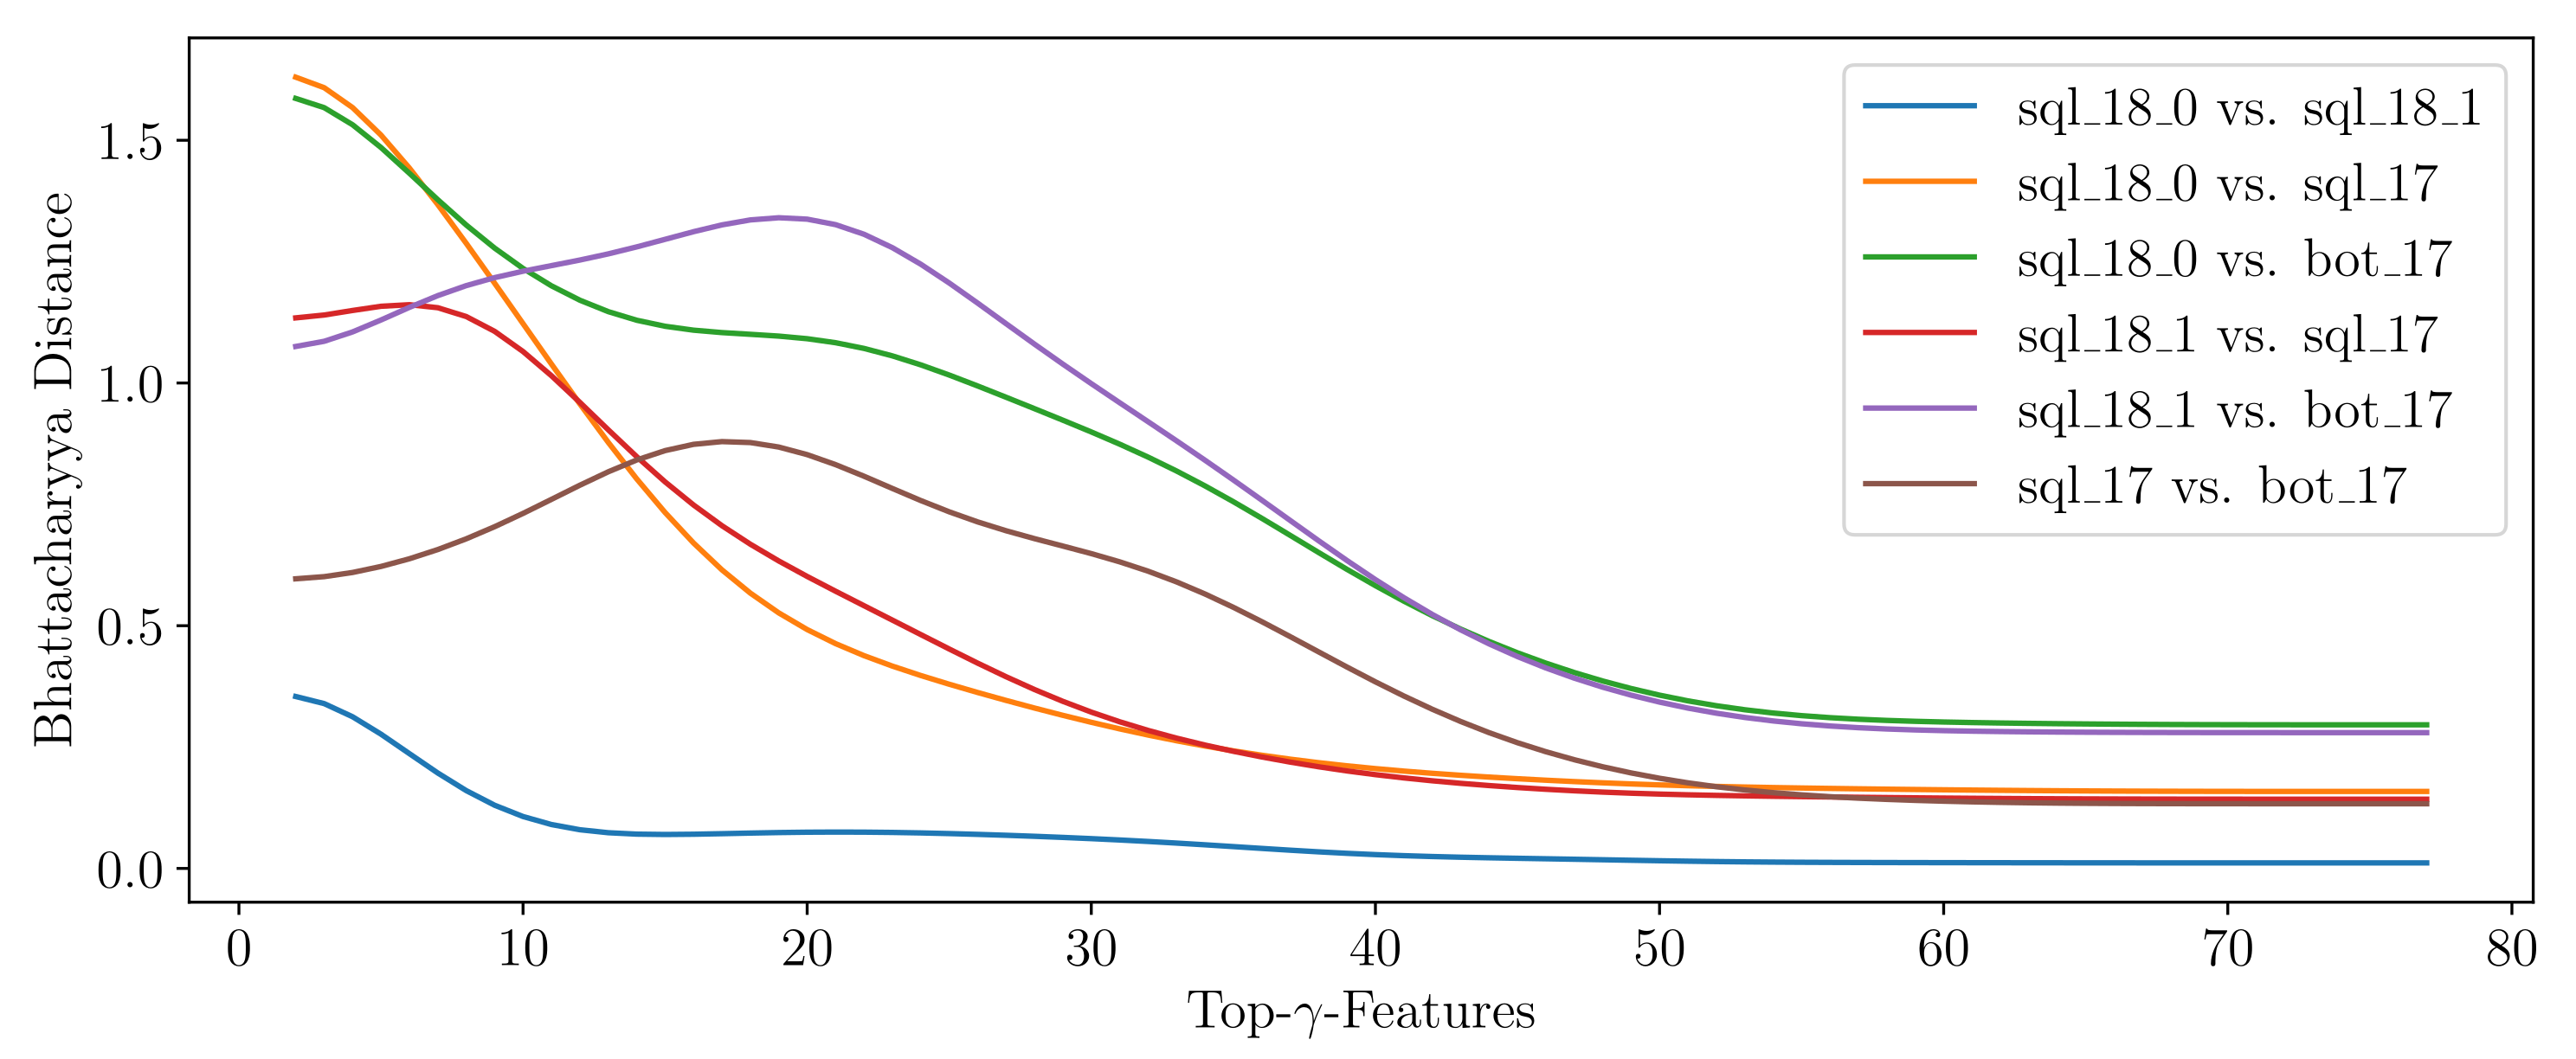
It is noted that the applied OD algorithms must be capable of providing the top-
-features. Although only a limited amount of work is able to satisfy this requirement, it is an important functionality for the design of future anomaly-based IDS [
13]. The higher the value for
, the more information must be transmitted with each alert increasing the communication overhead. Therefore, a decent value for
could provide a tradeoff between a meaningful signature and a reasonable communication overhead not stressing resources. Furthermore, in order to be able to accumulate a knowledge base of signatures
, they all must have been created by the same feature set
, such that each feature within
represents the exact same bin in
. However, in many applications, OD algorithms are utilized on the same pre-processed data by systems such as Argus or Bro-IDS, as utilized in [
53], or CICFlowMeter-V3, as used in [
61]. Nevertheless, a knowledge base should be built up providing signatures for a multitude of commonly applied feature sets such that the user can choose the set, which suits the application best. To what extent signatures obtained from a different amount of
features but from the same feature set
can be compared must be evaluated in future work.
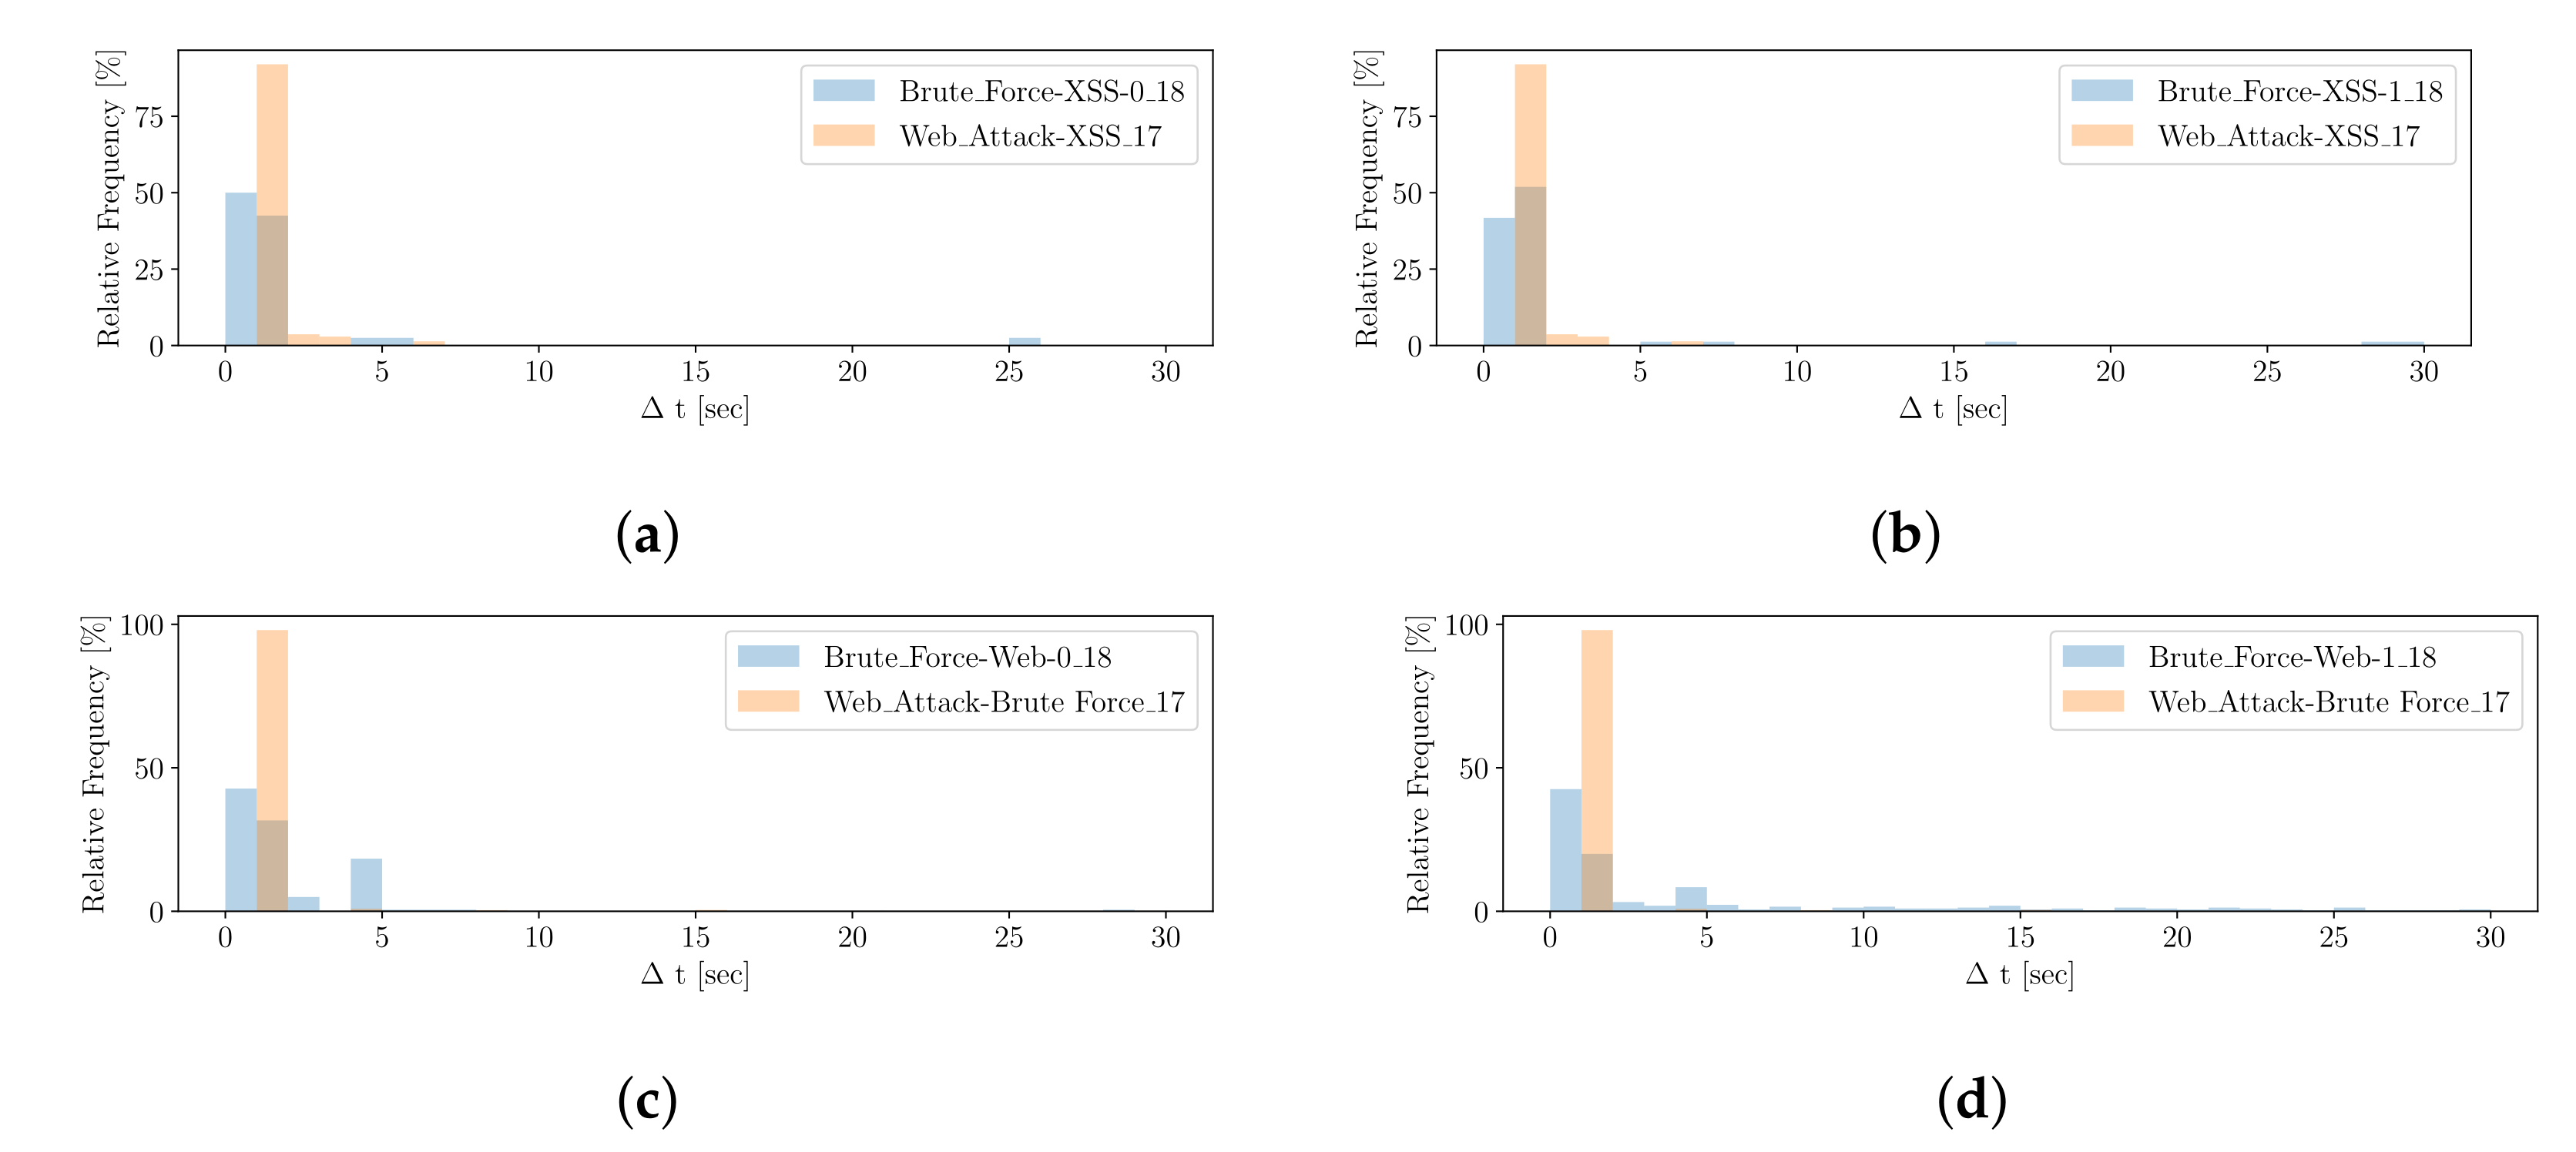
3.4.3. Generation and Comparison of
For generating a signature that represents the temporal (timing) characteristic of an attack, called
, we take advantage of the same procedure as for
. The two metrics, the duration of an attack and its number of respective alerts (with respect to
Table 2), extracted from a saturated cluster could be utilized to compare a potential novel attack with a knowledge base consisting of signatures for different attack scenarios with an averaged duration per attack and number of events. However, averaged values do not ideally represent the ground truth. Therefore, a more fine-grained way is to characterize an attack by computing the difference in time, Δ
t, in between the temporally ordered alerts (events).
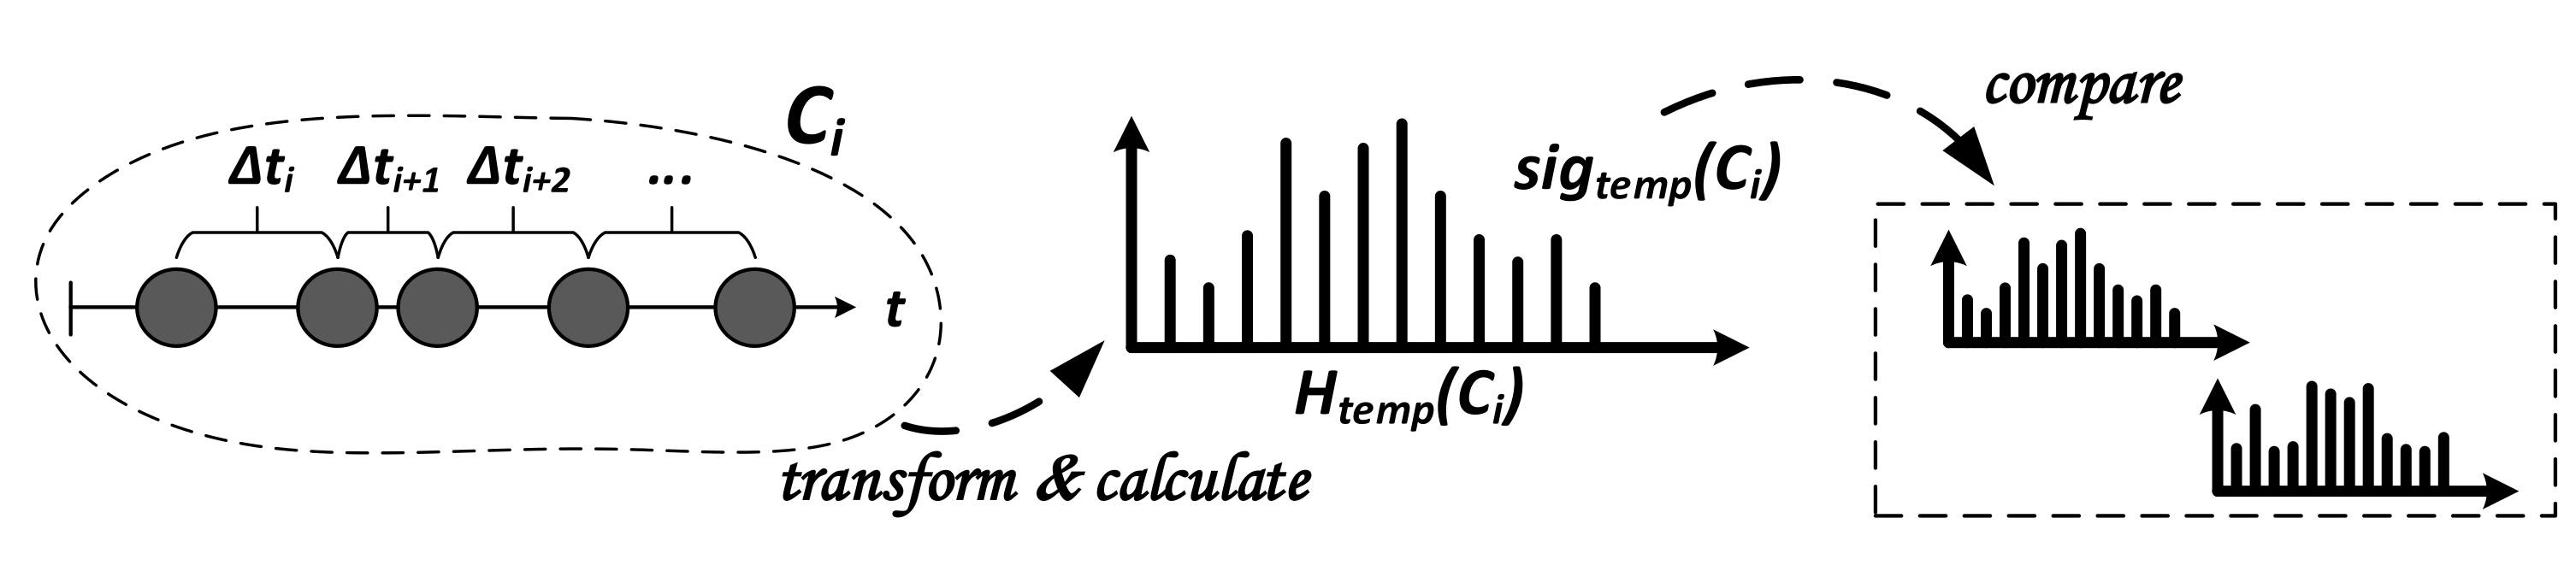
With respect to
Figure 6, we
transform the Δ
t information of alerts from cluster
into a histogram with a fixed amount
of equal-width bins
b, denoted as
, which describes the signature
. The histogram ranges from 0 to a subtle maximum value, mostly representing the attack scenarios’ best, and the bin-width can be computed dividing the maximum value by the number of bins. If some outlying Δ
ts occur, they are added to the last bin. In order to preserve information about the number of instances, a frequency histogram is proposed; otherwise, one might
calculate a relative frequency histogram. One might further differentiate between histogram types, such as
short,
mid or
long, to adjust the number and width of the bins, depending on the order of magnitude of Δ
ts. To
compare two signatures (histograms) of the same type, we again leverage the Bhattacharyya distance measure, as discussed with
.
It is noted that the correctness of critically depends on the correct order of alerts and assumes no strong variation in delays of alerts or a high number of FPs or FNs. However, if the notion of time of IDS sensors is not correctly loosely synchronized or an adversary may tamper with the time, imprecise temporal characteristics of alerts may cause incorrect or confusing results for . We leave the discussion of this phenomenon for future work.
3.4.4. Handling of the Signatures
Having a certain set of reference scenarios, denoted in this work as the
Knowledge Base, one can identify novel attack scenarios in the
Runtime phase by comparing the obtained signatures,
,
and
, with existing ones utilizing the
Scenario Comparison module. Signatures known from misuse-based IDS, anti-virus software or anti-malware systems are either one- or two-dimensional, as Blacklists or Whitelists are examples of the former and regular-expression functions is an example for the latter. A more recent method where multi-dimensional signatures can be seen as ML models that create a multi-dimensional model of input data applying mathematical techniques and score or classify observations. However, formats such as STIX are not compatible with those technologies as each class of threat classification may be founded on completely different trained models [
65]. Thus, similar to the idea of conventional signatures, we transfer the idea of having such one-dimensional characteristics to anomaly-based ML systems. What is more, the signatures proposed,
,
and
, must not necessarily match the exact signatures from the reference scenarios since the comparison measures can help to identify the similarity of novel patterns to existing ones from the
Knowledge Base. Over time, the set of reference scenarios might grow very strongly. Thus, it might be time consuming to compare a novel attack pattern composed of the three signatures with each one in the
Knowledge Base. Thus, the
Unsupervised Mining module makes it possible to apply hierarchical clustering in the
Learning phase, which clusters similar unknown attack pattern before presenting them to the
Human Analyst. Hierarchical clustering was also proposed by [
9] but only for similar
. Having a tree-like structure within the
Knowledge Base, attack scenarios characterized by the three-tuple of signatures can be structured into clusters according to their similarities. For each of the hierarchical clusters, the signatures that represent the most of each sub-cluster can be determined to compare the novel attack pattern much faster by only comparing it with the representing signatures
,
and
. The overall best signature match can be obtained by
. Since none of the signatures contain privacy-relevant information, they can be enriched with additional attack information and, e.g., shared among companies using STIX in an automated manner [
66].


