Abstract
This paper introduces a comprehensive analysis of the dynamic performance of an electric vehicle system using different control algorithms. The complete mathematical models of the electric vehicle and its motor drive system are described in a systematic manner. Furthermore, the vehicle dynamics are tested with several control topologies to investigate the most appropriate one. The adopted control topologies were the direct torque control (DTC), the model predictive direct torque control (MP DTC), and the predictive voltage control (PVC). The obtained results showed that the dynamics of the electric drive system of the vehicle under the PVC system were enhanced compared to the other control schemes.
1. Introduction
Over the last decade, the rapid increase in global car ownership, global warming issues, environmental pollutions, and many other issues are significantly expanding the development of these cars in terms of lower exhaust emissions, intelligence, and safety. Electric vehicles (EVs) seem to be a promising solution to these problems [1].
A typical electric vehicle system consists mainly of four components: an electric motor, controller, battery stack, and charger. The developed electric vehicles are based on direct current (DC) motors, induction motors, and/or permanent magnet motors. The demerits of DC motors have led electric vehicle designers to look for other alternative types of AC motors. The high cost of permanent magnet synchronous machines (PMSMs) in addition to their moderate power density make them less attractive for use in EV applications. On the contrary, the low maintenance cost, low price, and small size and weight of induction motors make them an attractive choice for many developers. Three-phase asynchronous squirrel cage motors are suitable for electric vehicle power plants due to the fact of their well-known benefits (such as ease design, low cost, and reliability).
In the literature, various advanced control techniques are proposed to improve the dynamic performance of induction motors (IMs) used in electric vehicles. For high impact automotive applications, vector control strategies, such as direct torque control (DTC) and field-oriented control (FOC), have frequently been applied [2]. However, vector control requires complicated coordinate transformation to allow flux and torque interaction to be separated to obtain fast torque control of an IM [3]. The FOC was designed to control the transient response of IM torque so as to behave in a manner comparable to that of the separately excited DC machine [4]. Reference [5] presents a new FOC method for IMs in EVs by applying slip frequency control which eliminates the speed oscillation generated due to the parameter variation. Reference [6] presents an FOC scheme to an embedded IM drive in an EV through a fuzzy logic controller. An Indirect FOC for an IM drive system was also utilized in [7] to obtain better dynamic and steady-state performance.
In 1986, DTC was presented by Isao Takashi to control both the flux and torque directly [8]. Both the torque and flux controls are achieved directly by modifying the applied voltage vector to the stator terminals according to the flux and torque errors [9]. In [2], DTC appeared to control the IM drives used in electric vehicle applications. The study in [10] presented different switching techniques for DTC for IMs used in EVs in order to minimize the torque pulsation and speed ripples. A family of variable structure controllers based on DTC for high-performance IM drives was presented in [11]. An improved DTC scheme for IMs in EVs was introduced in [12] to suppress the flux and torque ripples and improve the transient performance of IMs. In [13], FOC and DTC techniques of IMs for EV propulsion are presented in order to achieve a high EV efficiency. Reference [14] presents a DTC strategy based on an improved switching table for an IM drive fed by an eight switch three phase inverter (ESTPI) with post-fault reconfigured topology. DTC for IMs based on minimum voltage vector error is illustrated in [15] which optimizes the duty ratio of the fundamental voltage vector to minimize the error between the reference voltage vector and final voltage vector applied to the motor terminal.
In the 1960s, the model predictive control (MPC) was developed as an optimal control application. The MPC principles for IM drives are represented in [16]. The concept of MPC is based on the calculations of the future behavior of the controlled system to calculate the optimal operation state. Application of the predictive algorithm can be divided into three main steps: estimating the variables that cannot be sensed, predicting the future behavior of the system, and optimizing the outputs based on the pre-designed cost function [17]. MPC is the most outstanding control technique due to the fact its advantages of fast dynamic response, multi-variable control, and the ability to handle various nonlinear constrains. Recently, MPC became an effective control method to obtain high dynamic performance for electric machine drives. Compared to classic vector control methods, such as FOC and DTC, predictive control presents several merits, such as implementation simplicity, because of the absence of proportional integrator (PI) controllers and the ability to eliminate the pulse width modulation (PWM) from machine drives [18].
The MPC has been used in a wide range of IM drives. For high-performance IM drives, both the stator flux and the developed torque are employed control variables. In the MPC of an IM drive, a cost function, related to both the flux and torque errors, is evaluated for each of the voltage sectors and the optimum one which minimizes the cost function [19]. The study in [16] presents the conventional MPC of the IM and proposes a new method to minimize the switching frequency of the two-level voltage source inverter (VSI). A model predictive control based on a field weakening algorithm for IMs used in EVs is presented in [20]. Model predictive direct torque control (MP DTC) for IM drives with duty cycle control by optimizing the voltage vector selection when minimizing the torque and flux errors is presented in [21]. The study in [22] introduces an effective model predictive phase angle control for IM drives. The study in [23] presents the MP DTC of an IM in a wide speed range. In [24], the model predictive current control (MP CC) is presented in order to reduce the use of the weighting factor in the cost function design.
In the previous predictive control techniques, the cost function was based on control variables, such as torque, flux, and current, which means that the control action depends entirely on the precision of the estimation and prediction of these estimated or measured controlled variables, which can be affected under specific operating conditions due to the fact of measurement noise. Furthermore, the high computational burden of MP DTC, which cannot be realized by all microprocessors in addition to ripples which have not yet been totally suppressed, motivated the research community to search for a better control solution. Thus, to overcome the shortcomings of MP DTC, another predictive control technique is presented in [25,26] entitled predictive voltage control (PVC). In PVC, the optimum voltage vector is selected based on the deadbeat control method, and the feasible voltages are examined in the cost function directly. A finite control set-based PVC is used to control the matrix converter-fed PMSM drives [26]. In [27], a PVC approach is introduced to control the IM drive directly by selecting the appropriate voltage vector based on the deadbeat method. The study in [28] implemented a PVC for IM drives based on back-stepping observer. Moreover, a deadbeat-based PVC was used to control a five-phase IM drive in [29]. The study in [30] presents a PVC for a doubly fed induction generator (DFIG) based on the finite control set.
From previous studies, predictive voltage has been used to control the matrix converter, the DFIG, three-phase IM drive, and five-phase IM drive as well but not yet applied to control the EV drive system. Therefore, this paper intends to apply the PVC to the EV system and study the dynamic performance of the system in comparison with the DTC and MP DTC techniques.
In summary, the current paper’s contributions can be itemized as follows:
- The paper analyzes the EV electric dynamics under different control techniques, mainly direct torque control (DTC), model predictive direct torque control (MP DTC), and predictive voltage control (PVC) techniques;
- The theoretical base of each control technique applied to the EV system is presented and discussed in detail to facilitate the complete system study;
- The presented performance analysis outlines the strength and weakness of each applied control technique;
- A detailed comparative study between different control approaches is performed to identify the best IM drive control technique for better EV dynamic behavior.
This paper is categorized into five sections such that: Section 2 presents the modeling of the complete EV system including modeling of the EV, modeling of the IM, and modeling of voltage source inverter. Section 3 includes designing of the proposed control schemes. Section 4 presents the test results for the studied model under the DTC, MP DTC, and PVC methods. Lastly, Section 5 concludes the findings of the study.
2. Dynamic Model of EV System
The system, which emulates EV dynamic performance, consists mainly of four units: the vehicle model, the three-phase induction motor, the two-level voltage source inverter, and the battery. In the following subsections, the mathematical models for the electric vehicle, induction motor, voltage source inverter, and the dynamic model of the battery are introduced.
2.1. Mathematical Model of Electric Vehicle
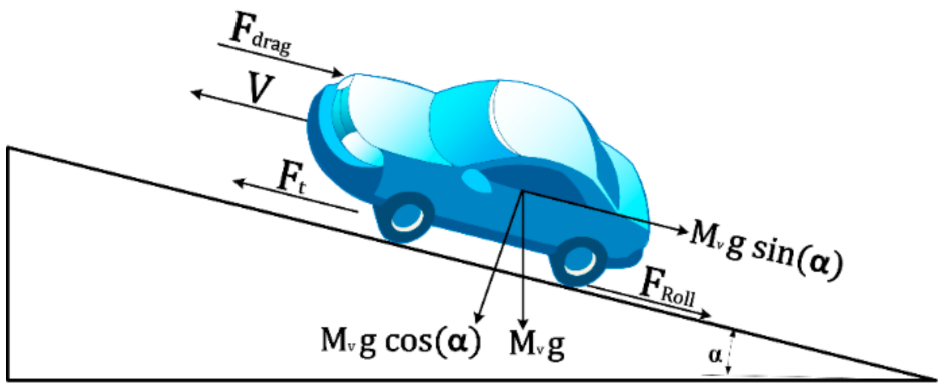
Modeling of an electric vehicle starts with analyzing the basic dynamics of a general vehicle [31]. The first step in vehicle modeling is the determination of force components which affect the vehicle’s dynamics [32]. The forces which affect a moving vehicle include aerodynamics’ drag force (), rolling resistance force (), force due to the slope (), force due to the bearing friction (), and, finally, the acceleration force () [33]. For a vehicle of a mass () moving with a velocity of () up a slope that has an angle () as shown in Figure 1, the tractive force () has to accomplish the following [34].
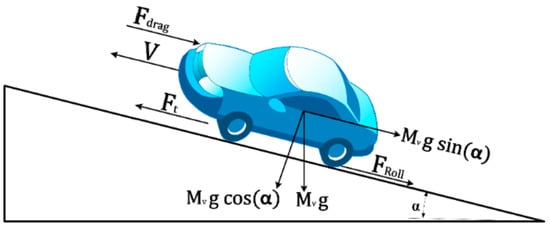
Figure 1.
Typical driving force components of a vehicle.
2.1.1. The Aerodynamic Drag Force
This force is caused by the friction of the body of the vehicle moving through the air and wind speed. It is a function of the vehicle frontal area, shape, and the direction of the wind [34]. The drag force is expressed in [35] as follows:
2.1.2. The Rolling Resistance Force
When the vehicle tires rotate, there is a part of each tire that is continuously depressed at the bottom and released back after it leaves the contact region. These depressing and releasing processes of the vehicle’s tires consume energy. The consumed energy in the tires is referred to as a rolling resistance that opposes the vehicle’s motion. Rolling resistance is modeled to be a normal force that is proportional to the vehicle’s weight. The rolling resistance force is expressed as [32,34]:
2.1.3. The Slope Force
The slope force is the part of the tractive force that is required to drive the vehicle up a gradient with an angle () [34]. This force is produced by the vehicle weight when it moves up/down a hill. The slope force is expressed as [31]:
2.1.4. The Bearing Friction Force
The force due to the bearing friction of the vehicle can be expressed by [33]:
2.1.5. The Acceleration Force
The force needed to overcome the inertia force of the vehicle’s mass to accelerate. The acceleration force is given by Newton’s second law as follows [34]:
The equivalent vehicle’s inertia can be analytically calculated in terms of the kinetic energy of the vehicle. The total kinetic energy stored in the vehicle is divided into two parts: translational energy and rotational energy [35].
The equivalent mass of the vehicle increases due to the angular movement. It can be defined in terms of the rotational inertia factor (δ) as follows [36]:
where is given by:
where is the total angular inertia, is the total rotating inertia, are the gear ratios of the transmission and final drive, respectively. The rotational inertia factor can be approximated in terms of the gear box ratio as follows [36]:
After calculating the equivalent mass of the vehicle, the equivalent rotational inertia of the vehicle at the wheel can be calculated by the following equation:
From Equation (12), the equivalent rotational inertia on the motor will be:
where is the gear box efficiency, and is the gear box ratio. The acceleration force is finally given by:
2.1.6. The Tractive Force
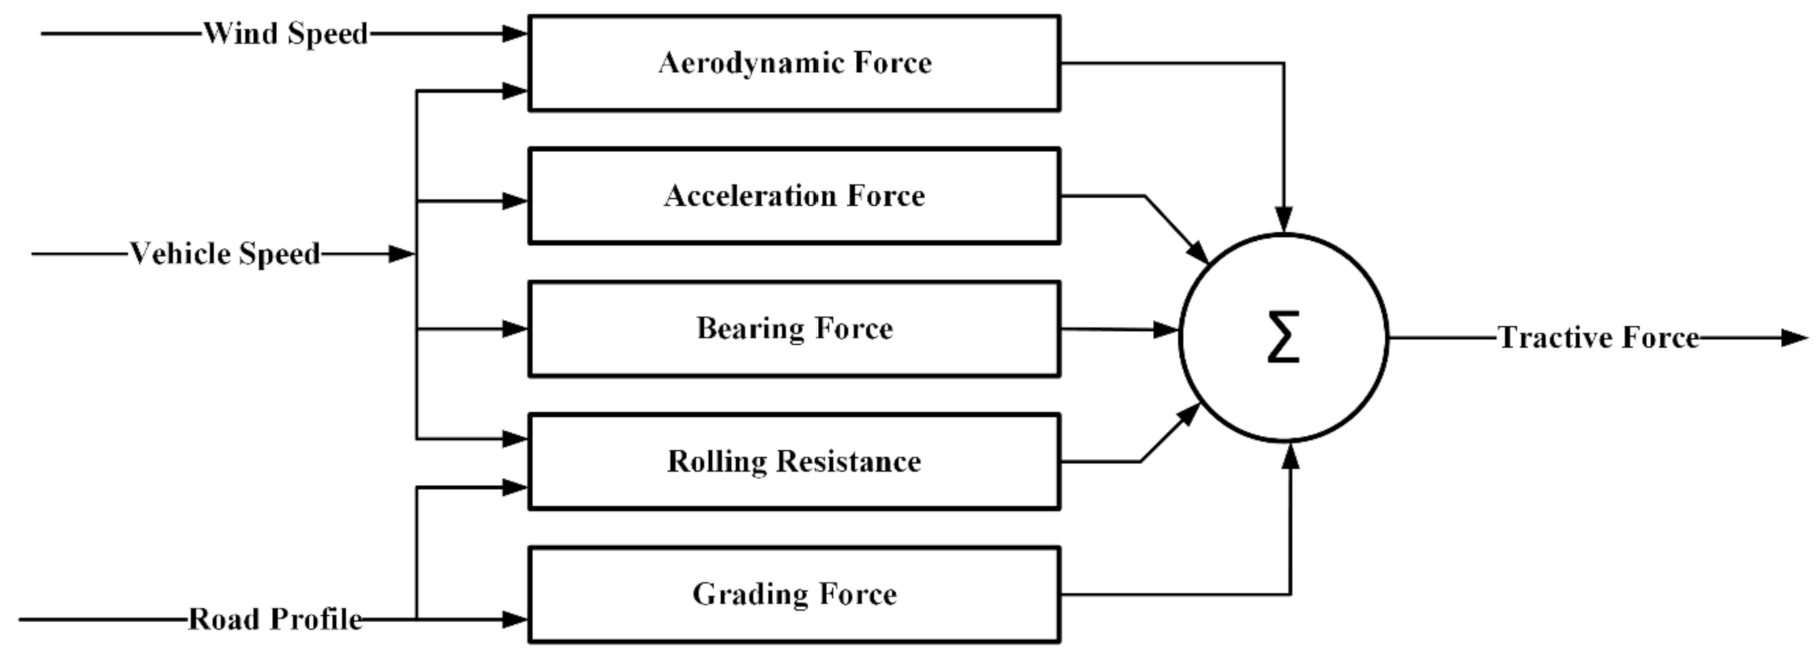
The total tractive force is the force produced by the power plant and transferred to the wheels through a transmission system in order to make the vehicle moves. It is the sum of aerodynamic, rolling resistance, slope, bearing friction and acceleration forces as shown in Figure 2. The tractive force can be represented by:
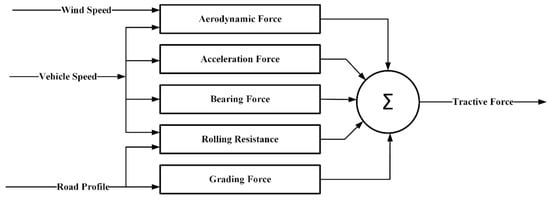
Figure 2.
The tractive force of an EV.
The tractive torque needed to move the vehicle is calculated by:
Meanwhile, the tractive torque produced by the traction motor of the vehicle is [37]:
Then, the vehicle rotational speed can be represented by:
2.2. Mathematical Model of Induction Motor
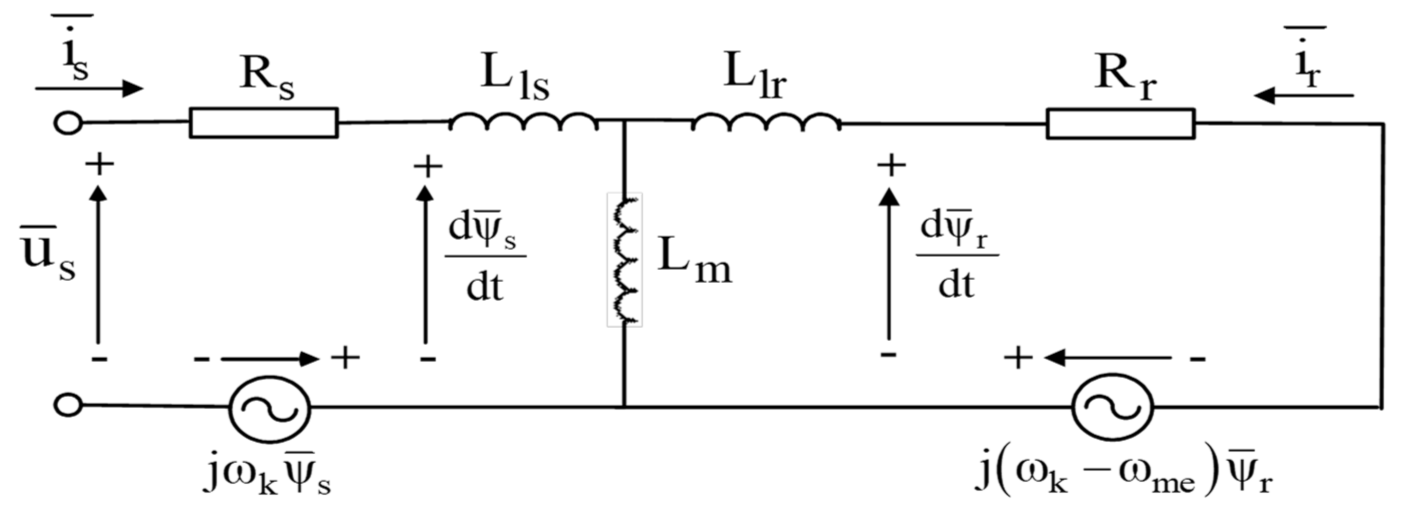
A per phase equivalent circuit of a squirrel cage IM is as shown in Figure 3. The mathematical model of the induction motor in an arbitrary reference frame () at instant kTs is expressed as follows [16]:
where the sign refers to the cross product.
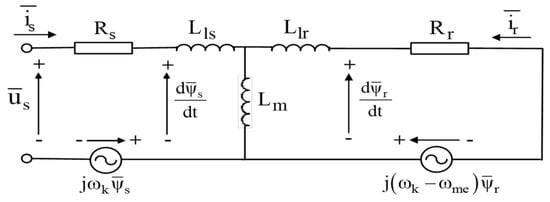
Figure 3.
Per phase equivalent circuit of an IM.
2.3. Voltage Source Inverter Model
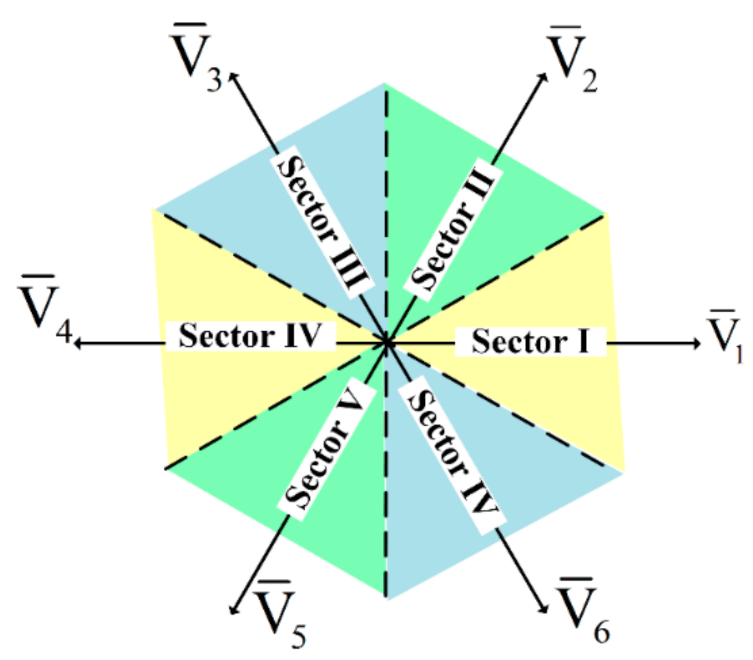
The two-level voltage source inverter (VSI) has six switches. Therefore, there are eight possible switching states as given in Table 1 and Figure 4. The output phase voltages, which will be applied across the stator terminals, are defined in terms of both the switching signals and the DC voltage level as presented in (22) [19].

Table 1.
Switching states of the two-level VSI.
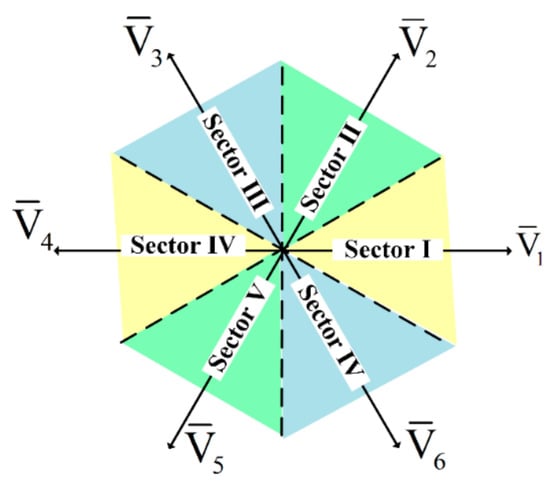
Figure 4.
Voltage sectors of the two-level VSI.
2.4. Dynamic Model of the Battery Stack
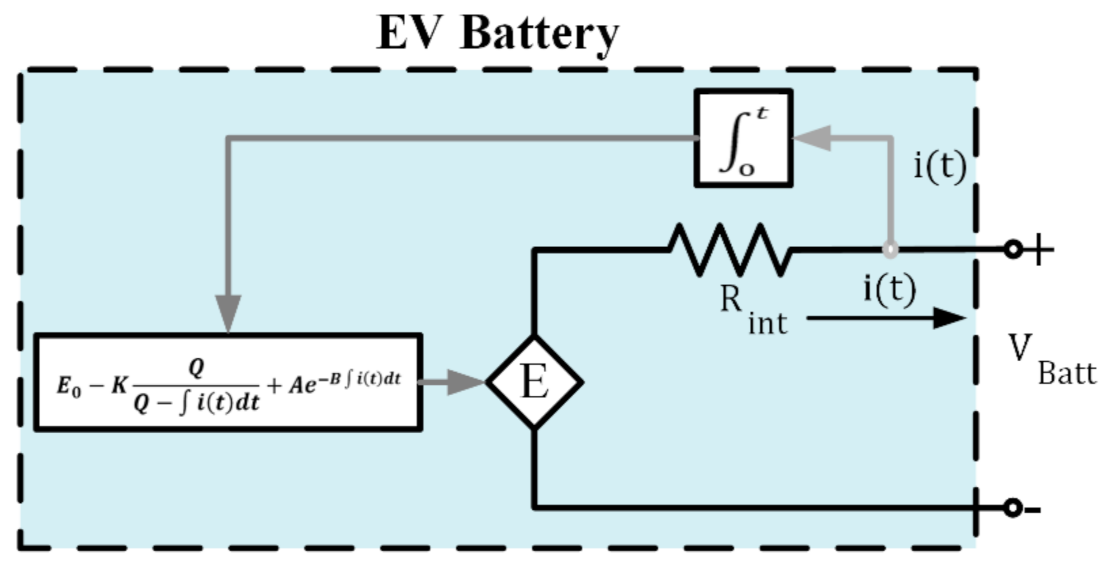
The dynamic model of the battery during the discharge can be represented by a dependent voltage source connected in series with an internal resistance as shown in Figure 5. The dependent source voltage is a function of both the state of charge (SOC) and the polarization voltage. The battery open circuit voltage (OCV) can be expressed as the following [38,39]:
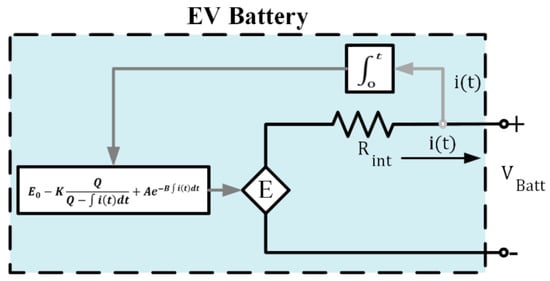
Figure 5.
Model of a nonlinear equivalent circuit battery.
The terminal voltage of the battery is represented by:
Substituting from Equation (23) into Equation (24), the terminal voltage is:
3. Control Topologies
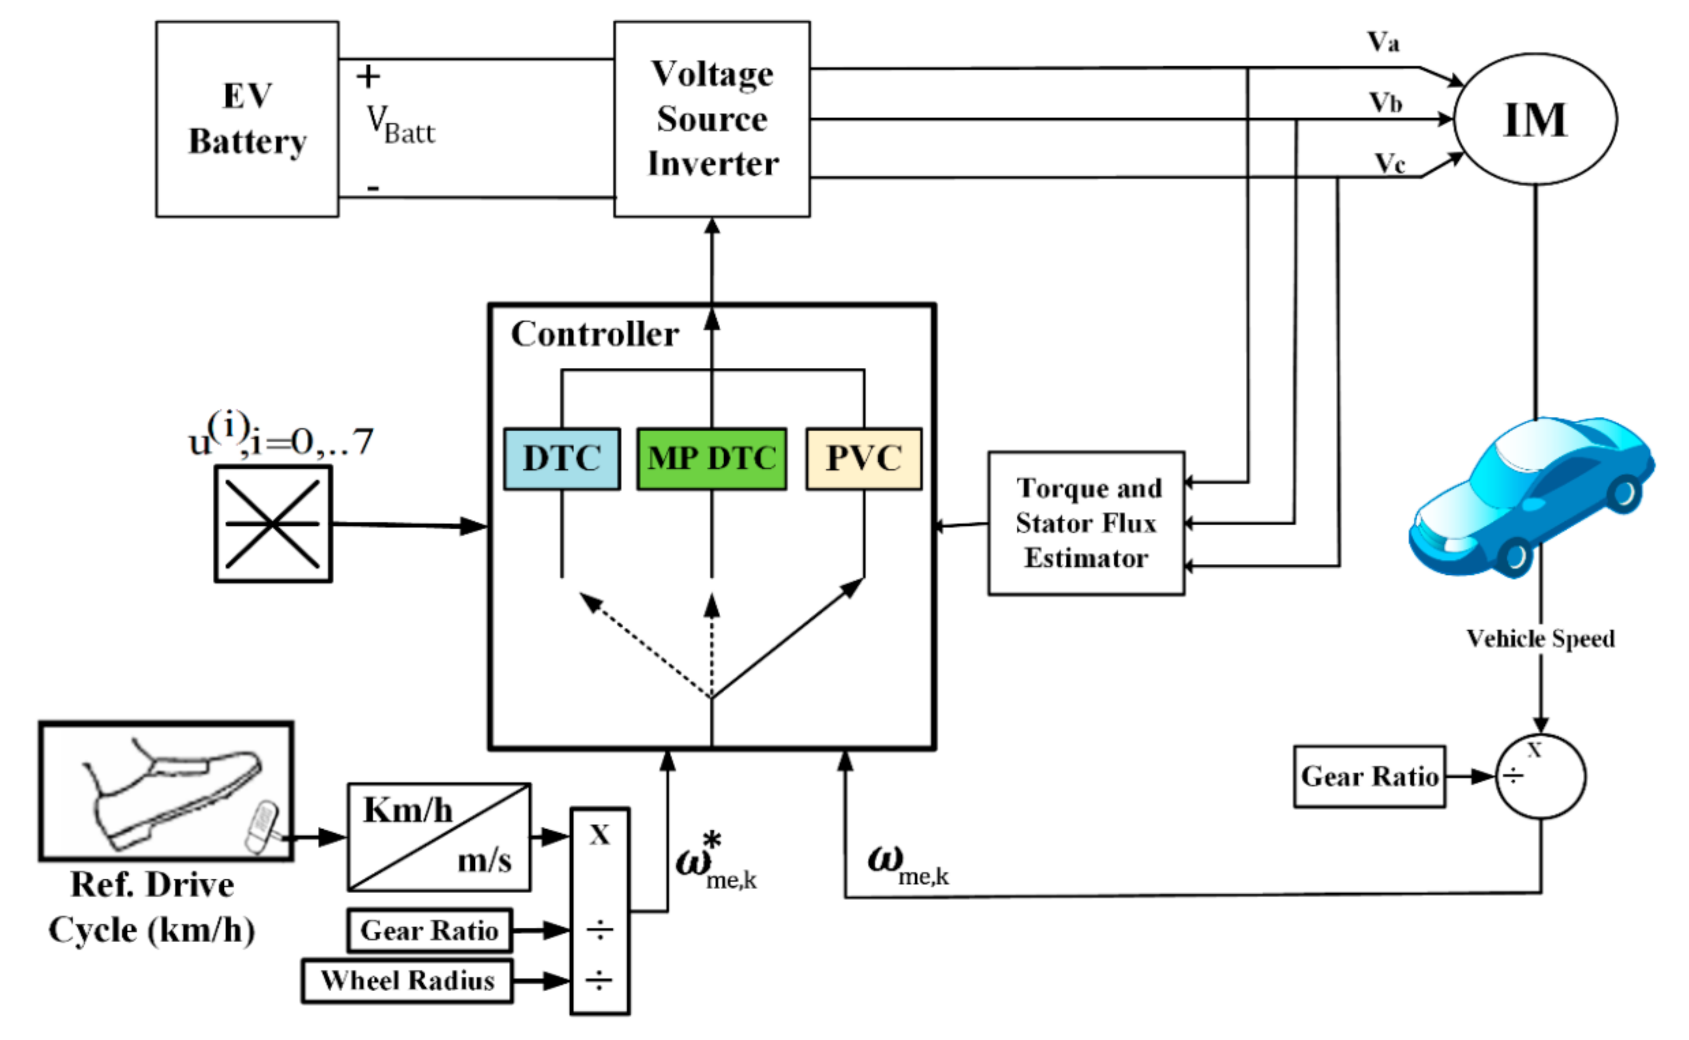
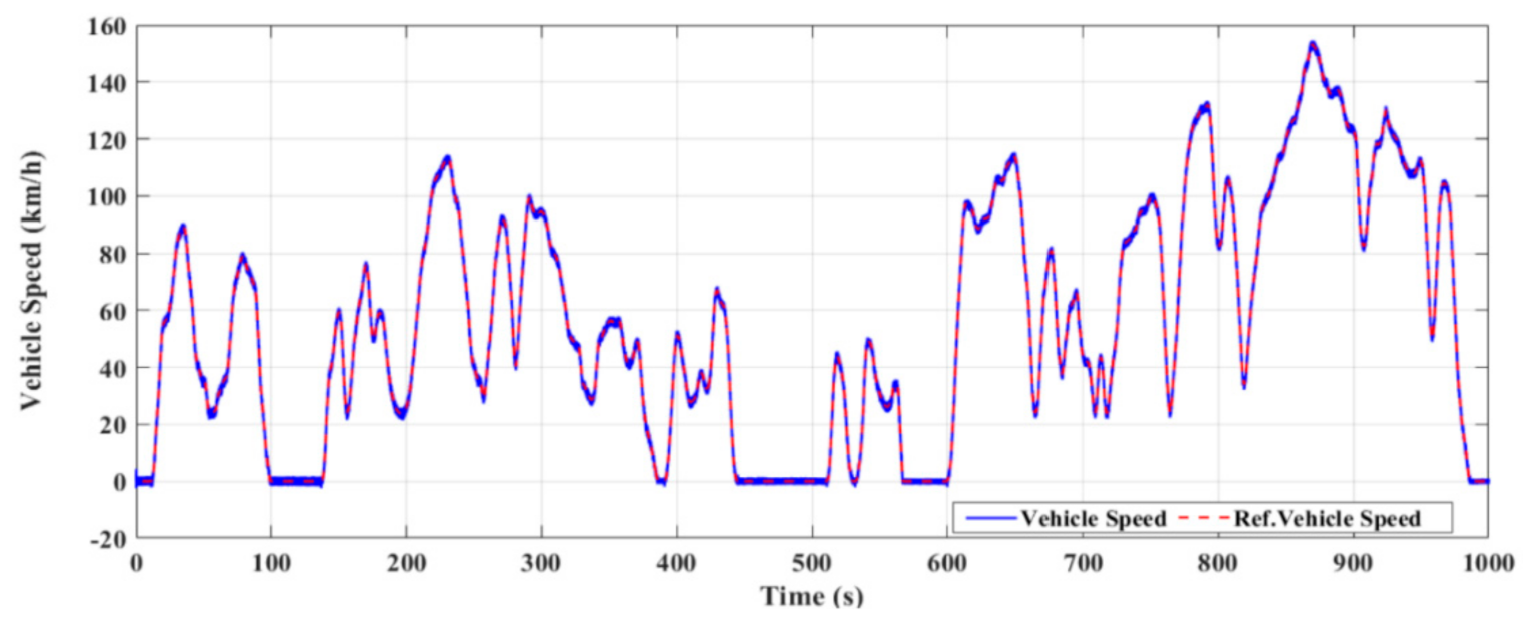
In this paper, the incorporation of the EV system is proposed and the electric dynamic performance of the system is evaluated for three control techniques. The IM control techniques are the direct torque control (DTC), the model predictive direct torque control (MP DTC), and the predictive voltage control (PVC). In this section these control techniques are developed for an EV system. For all control strategies, the EV system is regulated along a wide speed range. Then a comparison between the IM performance under these different control methods is applied to obtain the best control technique. The EV is tested with the same reference of a practical WLTP (class 3) driving cycle [40].
The complete electric vehicle layout system is as shown in Figure 6. The measured signals are the vehicle speed and the stator voltages and currents. The measured quantities are used to approximate the flux and torque of the IM. The reference torque is obtained through a PI speed closed loop. Using the reference torque, the q-axis component of stator current () can be calculated.
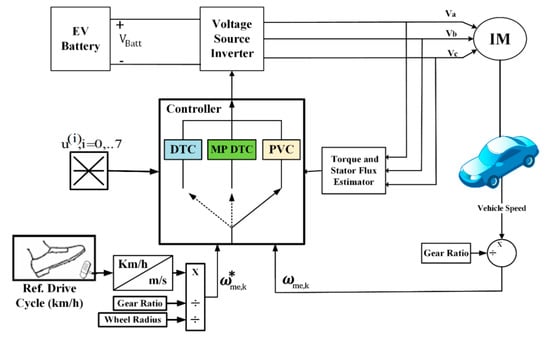
Figure 6.
The electric vehicle system layout.
3.1. Direct Torque Control (DTC)
The direct torque-controlled induction motor drive supplied by a VSI can directly control the stator linkage flux and the electromagnetic torque by selecting the optimum stator voltage space vectors in the inverter [41]. In the DTC method, the flux and the electromagnetic torque are either measured or estimated and used as feedback signals for the controller. The direct torque controller inputs are the flux and the torque errors restricted within the respective flux and torque hysteresis bands for selecting the most appropriate voltage vector with fast torque response and low inverter switching frequency [41,42].
3.1.1. Implementation of DTC
The DTC advantageously does not require coordinates transformation and, thus, can be implemented on an IM model represented in the stator reference frame as follows:
After some manipulations, the torque equation in (21) can be replaced with the following equation:
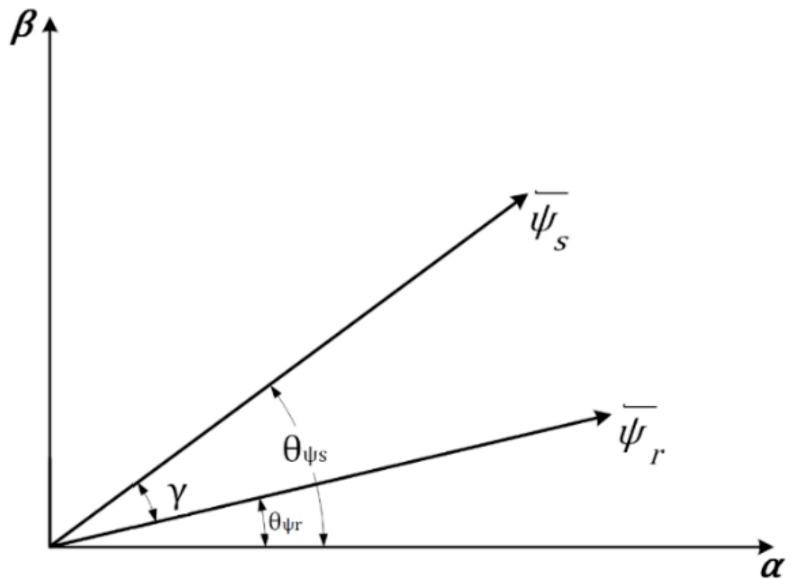
The angle, is the angle between the rotor and stator fluxes, as shown in Figure 7, and known as the torque angle [41,42,43].
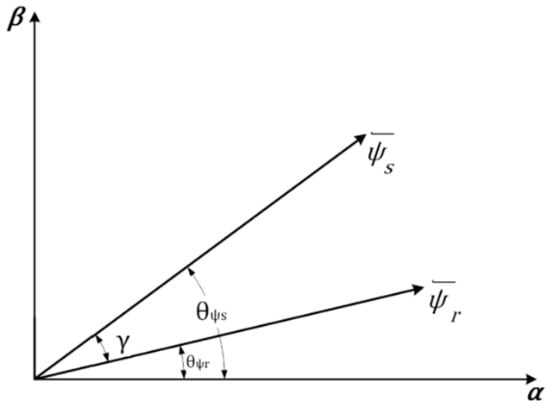
Figure 7.
The angle between stator and rotor fluxes.
Rotor flux varies slowly because its rate of change is dependent on the large rotor time constant compared to the stator flux. Suppose that the rotor flux is conflating quickly and that the stator flux is kept constant. In this case, both vectors in Equation (28) have constant amplitudes. The electromagnetic torque can be controlled rapidly employing changing the angle, , by applying an appropriate voltage space vector during control sampling interval . The sampling time interval, l , is smaller than the rotor time constant to verify the assumption that the rotor flux is constant [41,44].
The stator flux is controlled by changing the applied stator voltage [42]:
If the stator voltage drop is neglected [41], the stator voltage equation can be written as:
3.1.2. DTC Scheme
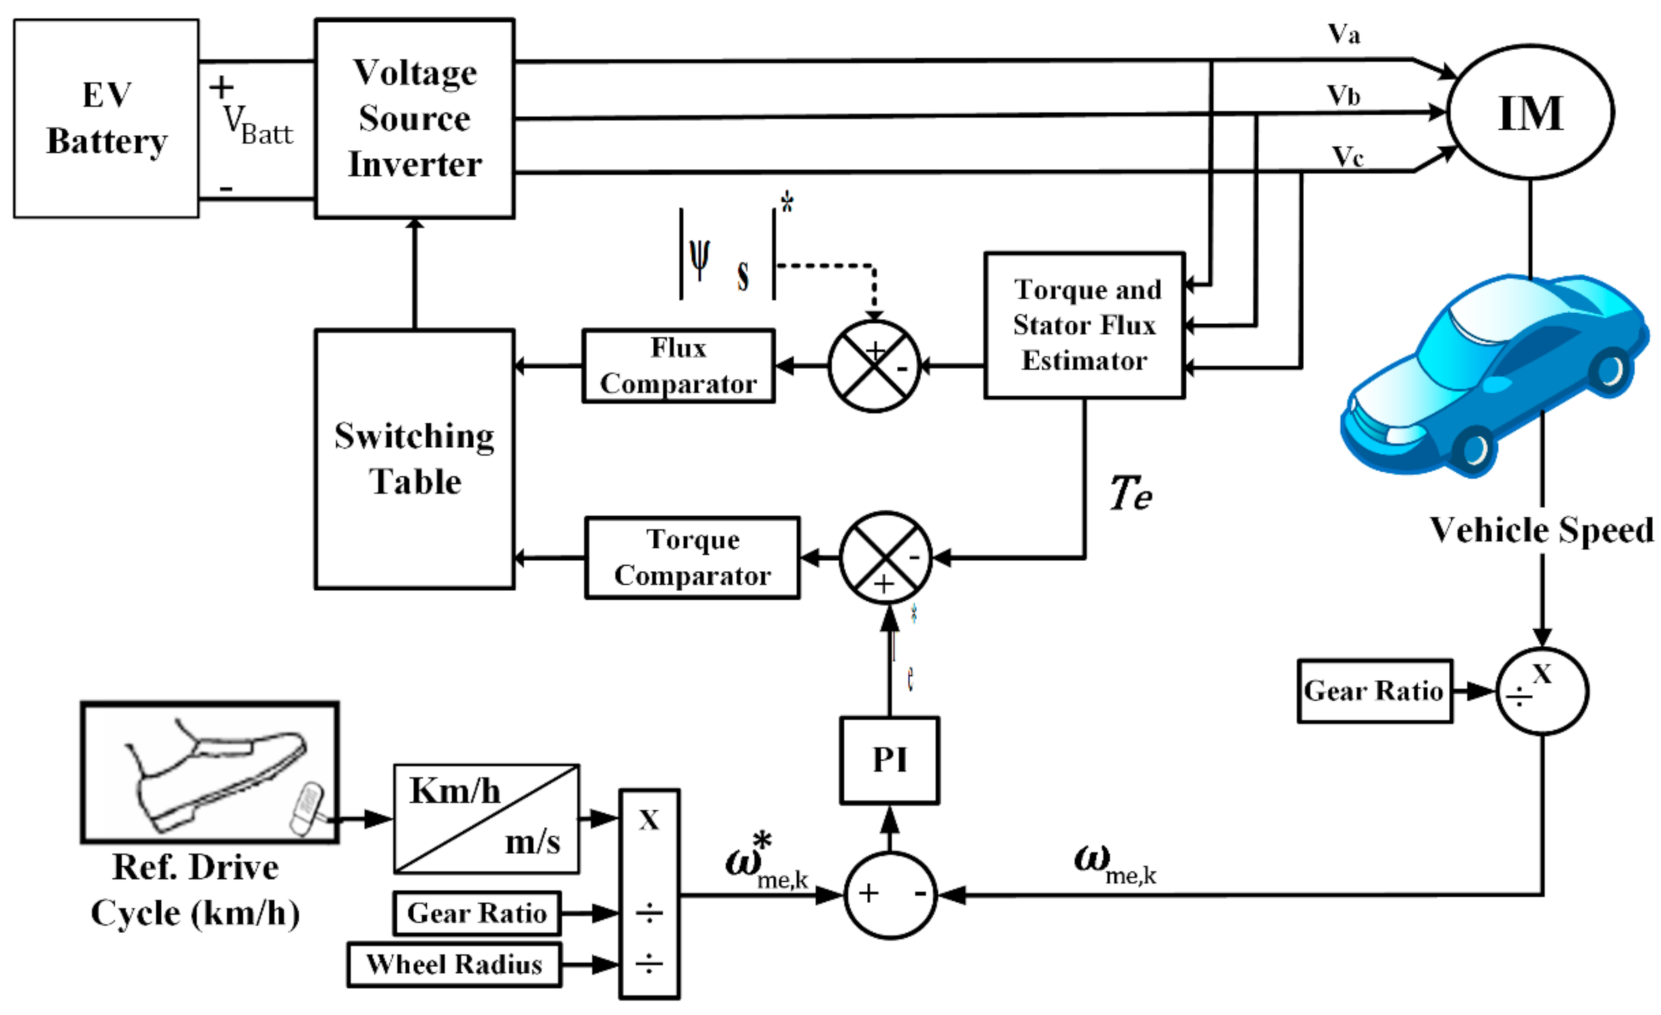
The scheme of the DTC of an IM in an EV system based on direct modification of the stator voltage according to the torque and flux errors is shown in Figure 8. DTC is used to control both the vehicle speed and the IM torque. The stator voltages and currents in addition to vehicle speed are measured by the measuring instruments. The estimated flux and torque are used to calculate the flux and torque errors. The reference stator flux () is the same as the rated stator flux. However, the reference torque () is obtained from the vehicle speed error passing through a PI controller.
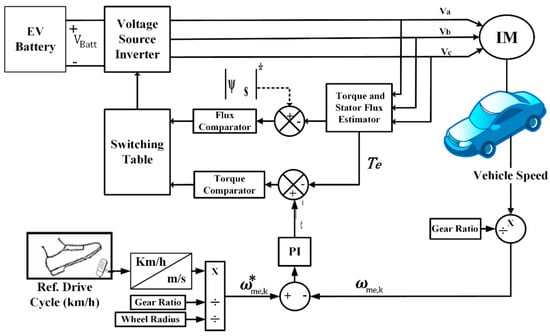
Figure 8.
Block diagram of the DTC technique for an IM in an EV system.
The torque and flux estimator block uses the measured voltage, current, and stator resistances in order to estimate the torque and flux. The flux is estimated using the stator voltage equation of an IM as given by Equations (32)–(34). The IM torque is estimated using the current and flux components as expressed by Equation (35).
The torque and flux errors pass through a two-level hysteresis flux comparator and three-level hysteresis torque comparator. According to the torque and flux controllers’ outputs and switching lookup table, the two-level VSI switching signals are determined. Both the switching table and voltage sectors are illustrated in Figure 4 and Table 1.
3.2. Model Predictive Direct Torque Control (MP DTC)
In this subsection, the model predictive direct torque control (MP DTC) is used to control both the torque and flux of the IM in the EV system. The model predictive control principle is used to predict the behavior of the controlled variables over time based on the IM model. The predictions are implemented based on a so-called cost function. The result of the predictions is based on the objective of minimizing the cost function for future control actions by selecting the appreciate voltage vector. MPC has several advantages such as easy inclusion of nonlinearities and flexibility in choosing the control objectives [45].
3.2.1. Implementing MP DTC on IMs in EV Systems
For implementing the MP DTC, the IM model described by Equations (19)–(21) is represented in a stationary α–β reference frame (). The dynamic model of the IM can be arranged in a discrete time form as follows, where kTs is the sampling time index [46]:
where .
After some manipulations, (36) can be replaced with the following equation:
Equations (36) and (38) state the model that describes the dynamics of the IM.
The motor torque dynamic is given by:
where accent ˇ is for complex conjugate, and Im denotes the imaginary part.
Similarly, from (36), the derivative for the stator flux can be expressed in terms of the spatial voltage vectors as follows:
3.2.2. Digital Implementation of MP DTC
The digital implementation of the MP DTC for the IM in the EV is based on a discrete time model so that the predictive control algorithm preforms its calculations during the system running. The calculation results are used for the next control cycle. In addition, the feature of MPC allows future sampled variables to be predicted every time they are required during numerical computation of currents/voltages that will applied for the next sample of time [47]. The digital implementation can be divided into two steps. The first step is the prediction of the controlled variables, and second step is the selection of the voltage vector to be applied in the next sampling time.
Let us suppose that the IM drive is operating in interval kth from sampling time kTs to time (k + 1)Ts, then the stator flux and current values of the motor can be predicted at instant (k + 1)Ts using first order Euler method and applying Equations (36) and (38) resulting in:
Consequently, the IM electromagnetic torque can be predicted at instant (k + 1)Ts by:
The predictive stator flux and torque from Equations (41) and (43) are used to evaluate a cost function which is a combination of the torque and flux errors as expressed by [47]:
where is a weighting factor, is the reference electromagnetic torque, and is the reference stator flux. Finally, the controller selects the optimum voltage sector which produces the minimum value for the cost function.
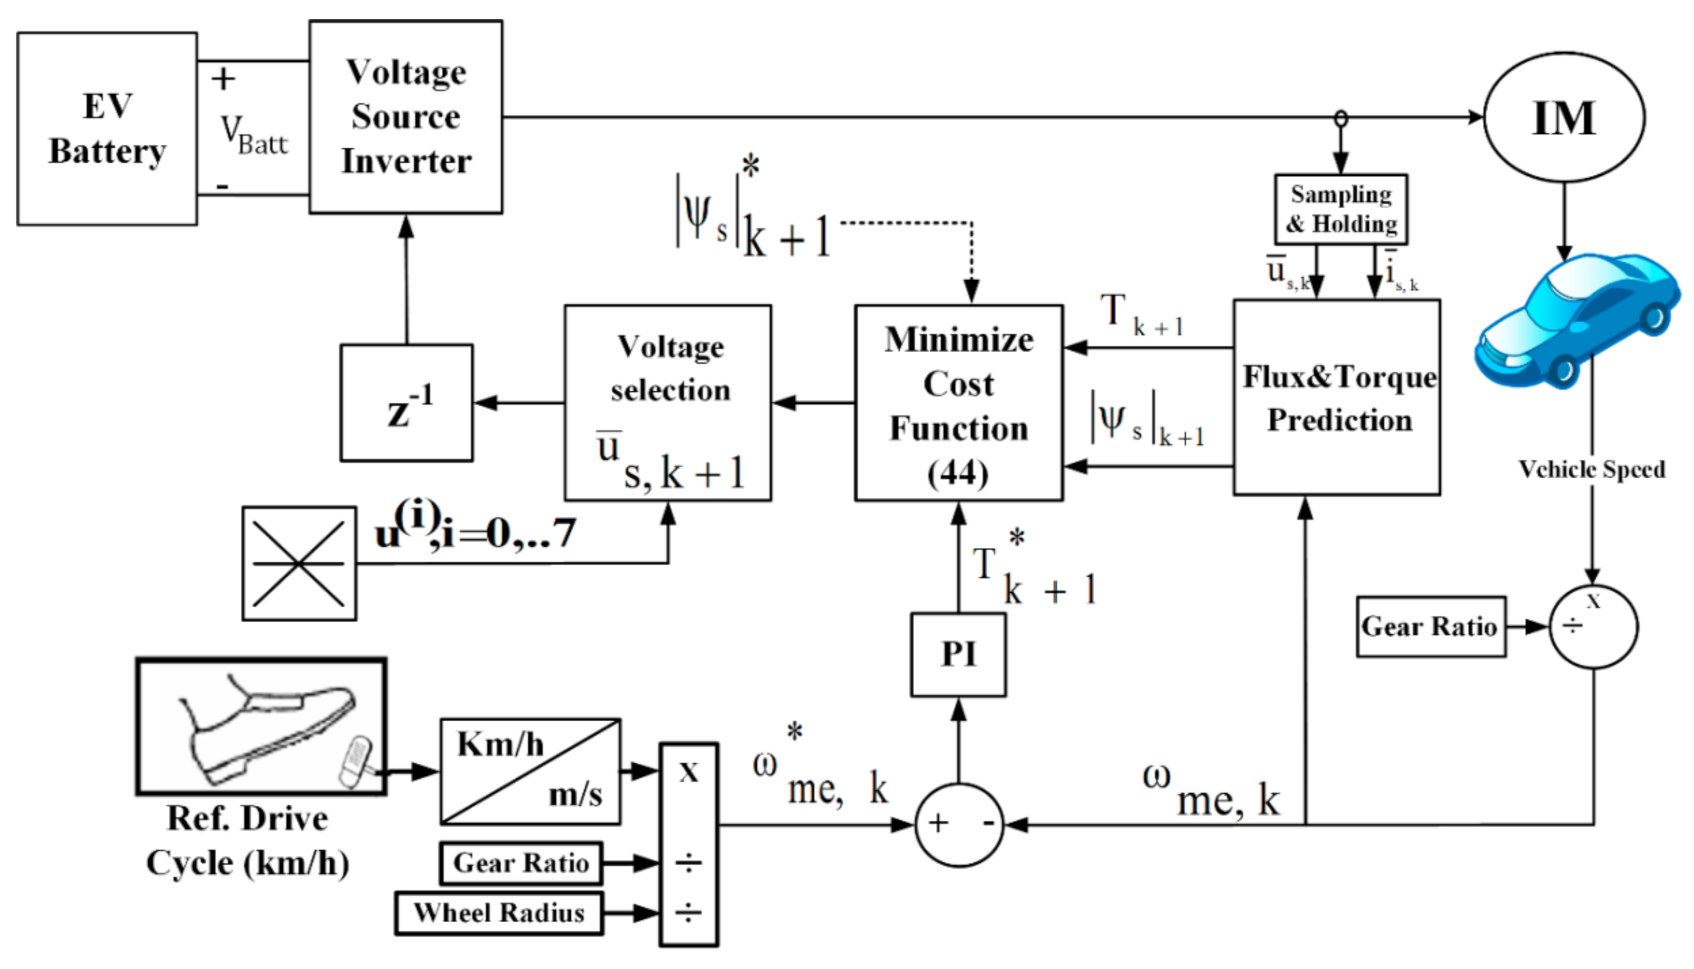
The overall MP DTC control scheme is thus that which is shown in Figure 9. The three-phase IM in the electric vehicle is supplied through a two-level voltage source inverter that is used to convert the discrete time signals to continuous time signals required by the drive. The sampling and holding (S/H) block refer to the sampling of the continuously varying signal, such as the stator voltage, and hold its value at a constant level for a certain period. The measured vehicle speed is used in the speed loop and the prediction block. The reference torque is obtained through a speed loop controller (PI) while the reference flux is maintained as a constant value.
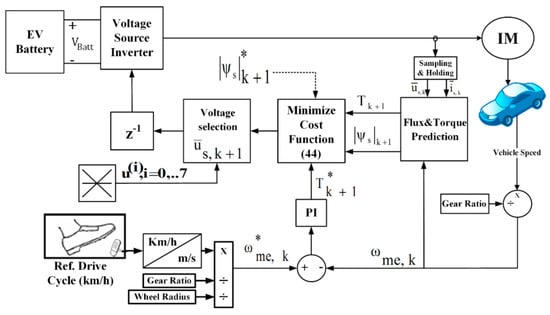
Figure 9.
Block diagram of MP DTC technique for an IM in an EV system.
3.3. Predictive Voltage Control (PVC)
In this subsection, the predictive voltage control (PVC) is applied to control both the torque and flux of the IM in EV system. The PVC based on the deadbeat control method is used. The PVC operating mechanism is used to minimize the error function which included two similar terms without the need to use a weighting factor or estimated variables.
3.3.1. Implementation of PVC
The PVC requires the representation of an IM dynamic model in a discrete form, while all variables are expressed in a synchronous reference frame rotated with the stator flux vector angular speed (). Then, the relationships in Equation (19) can be reformulated as follows:
From Equations (45) and (46), the induction motor dynamic model can be expressed using the following equations:
where is the total leakage inductance factor. The IM torque can be calculated through the following equation:
where and refer to the direct and quadrature components of the stator flux in a synchronous reference frame, while and refer to the direct and quadrature components of the rotor current in a synchronous reference frame.
3.3.2. Implementation of PVC
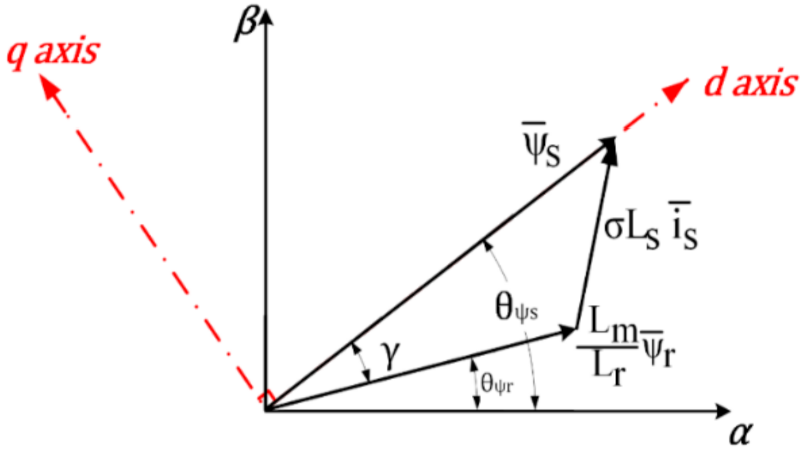
The implemented PVC is based on the principal stator field-oriented control (SFOC). The SFOC is achieved by aligning the total stator flux with the direct axis of the synchronous reference frame as shown in Figure 10. The angle , between the stator flux and rotor flux, represents the torque angle of the IM. Consequently, under the SFOC, the following relationships are obtained:
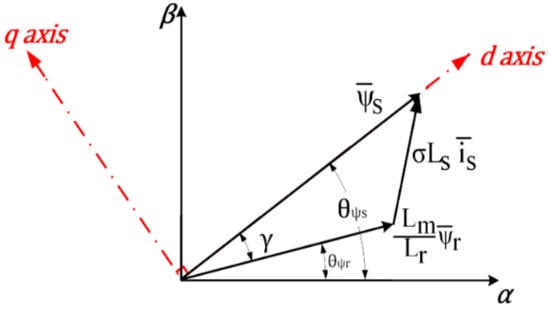
Figure 10.
Vectors’ representations and allocations under SFOC.
From Equations (49) and (51), the IM torque under SFOC can be expressed by:
Also, the voltages’ d-q components of the IM can be expressed under SFOC by:
From Equation (52), it can be realized that the torque can be regulated by controlling the q-axis component of the stator current in case the stator flux is kept constant.
The PVC is implemented based on the deadbeat control which provides simple treatment to the controlled variable because of the desired input voltage ensuring that the system dynamic response will track the desired reference. Deadbeat is used here to generate the reference d-q voltage components in order to use them in the cost function of the PVC strategy. Based on the principles of the deadbeat explained in Reference [27], the d-q references of the stator voltage vector which introduce zero error between the command signal and the output system response can be derived as follows.
From Equation (53), the stator flux vector at instant (k + 1)Ts can be predicted as follows:
The deadbeat approach was used to accomplish flux control, the predicted flux equals the reference value as:
According to the deadbeat, the reference d-component of stator voltage vector can be calculated by:
The other objective of the deadbeat is to find the reference of the stator voltage vector q-component of which is used to regulate the IM torque, and this can be performed as follows:
From Equation (52), the stator flux reference is kept constant ; then, the developed torque can be directly regulated via the q-axis current component .
The variation of the stator current q-axis component depends clearly on the synchronous angular speed of the stator flux vector under SFOC, and this can be investigated by the following relationships
where:
where is the transient inductance, and is the rotor time constant. The slip angular speed in (59) is obtained after applying mathematical manipulation on Equation (46).
The derivative in Equation (59) can be expressed by the following expression assuming small sampling time interval:
In order to achieve the torque control utilizing the deadbeat method, the predicted torque at instant (k + 1)Ts should equal the reference value as:
By incorporating (60) and (61) into (59), the reference value of the synchronous angular speed is calculated by:
From Equation (62) and via substituting in (54), the reference q-component of the stator voltage vector can be expressed by:
Now, using the references and expressed by (57) and (63), the cost function can be expressed as follows:
The values of stator voltage components and are the d-q components of the VSI output which can be easily obtained without estimation, saving computational time. In addition, the cost function does not have the requirement to utilize a weighting factor which saves implementation time and avoids the drawbacks of arbitrary selection of the weights.
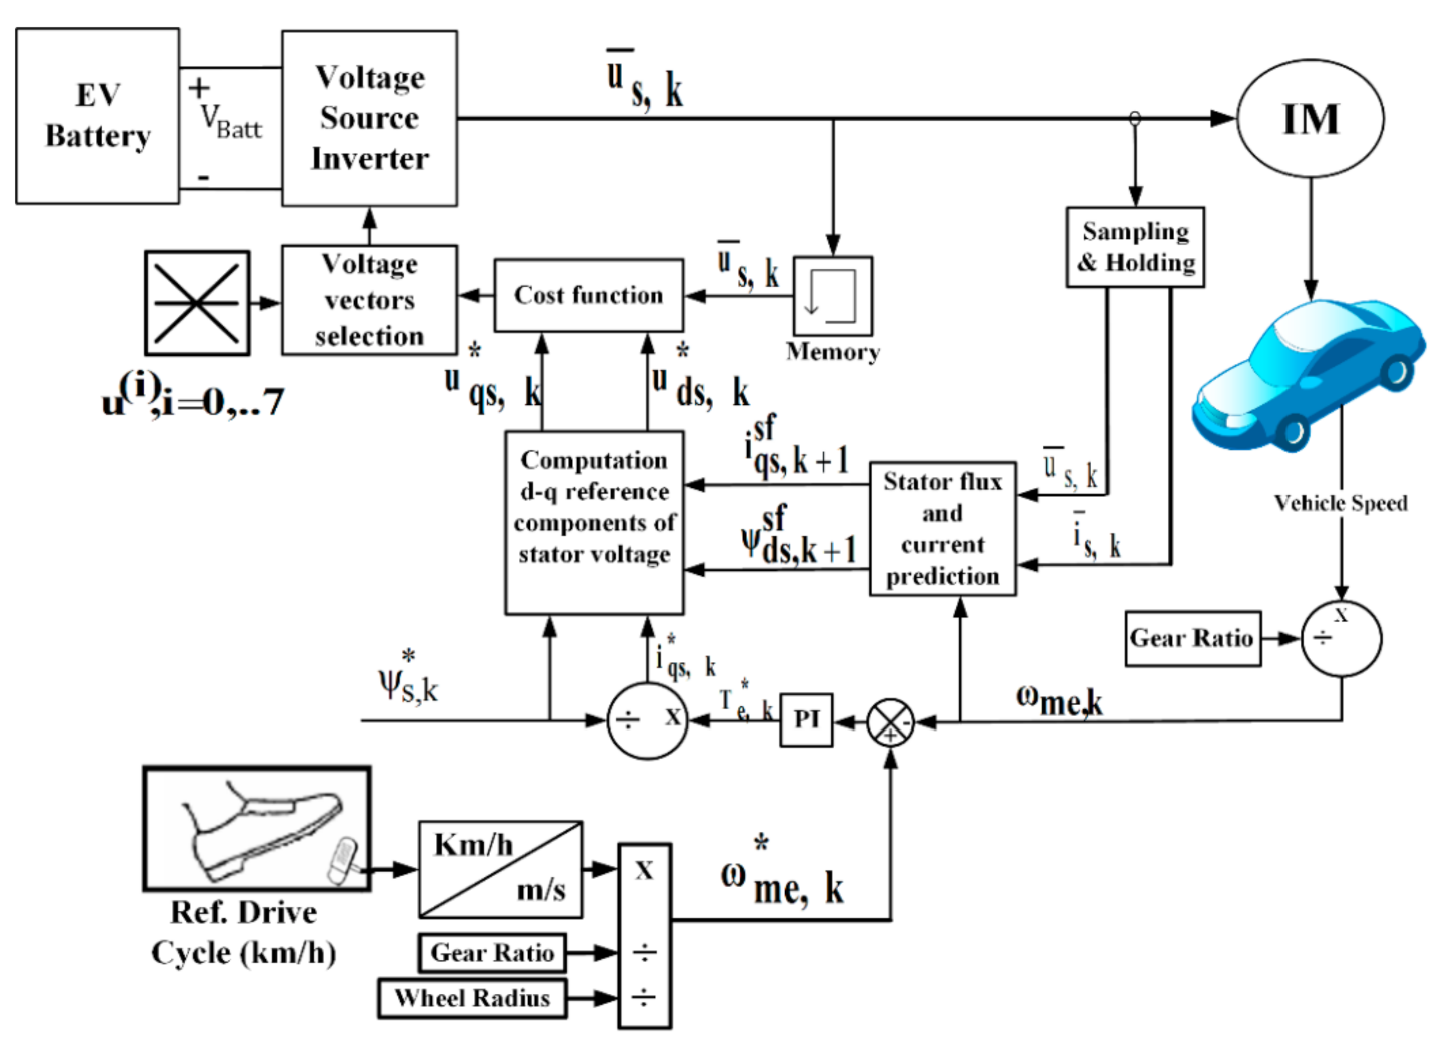
The complete EV system configuration under PVC is illustrated Figure 11. The PVC starts with measuring both the stator voltage and stator current. After that, the measured voltage and current signals are sampled before starting the estimation and prediction of the stator flux and stator current components. The estimated/predicted signals are used in addition to the reference stator flux and reference q-axis current component to obtain the stator voltage d-q components. Then, the reference stator voltage components are compared with the output voltage components of the predictive voltage through the cost function (64). Finally, the minimizing process of the cost function is performed by selecting the optimum voltage vector.
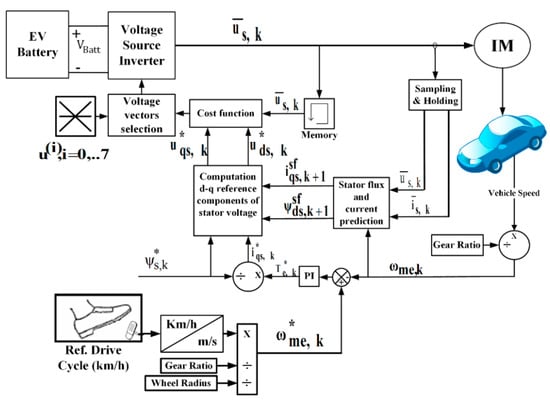
Figure 11.
Block diagram of the PVC technique for an IM in an EV system.
4. Test Results
To evaluate the dynamic performance of the IM in EV system, comprehensive tests are performed under the described DTC, MP DTC and PVC techniques with practical WLTP (class 3) driving cycle. The EV system tests are carried out using MATLAB/Simulink software for the various control methods. The parameters the EV, induction motor, EV battery and the parameters need to be set for the control strategies are presented in Appendix A.
4.1. Test Results under the DTC Technique
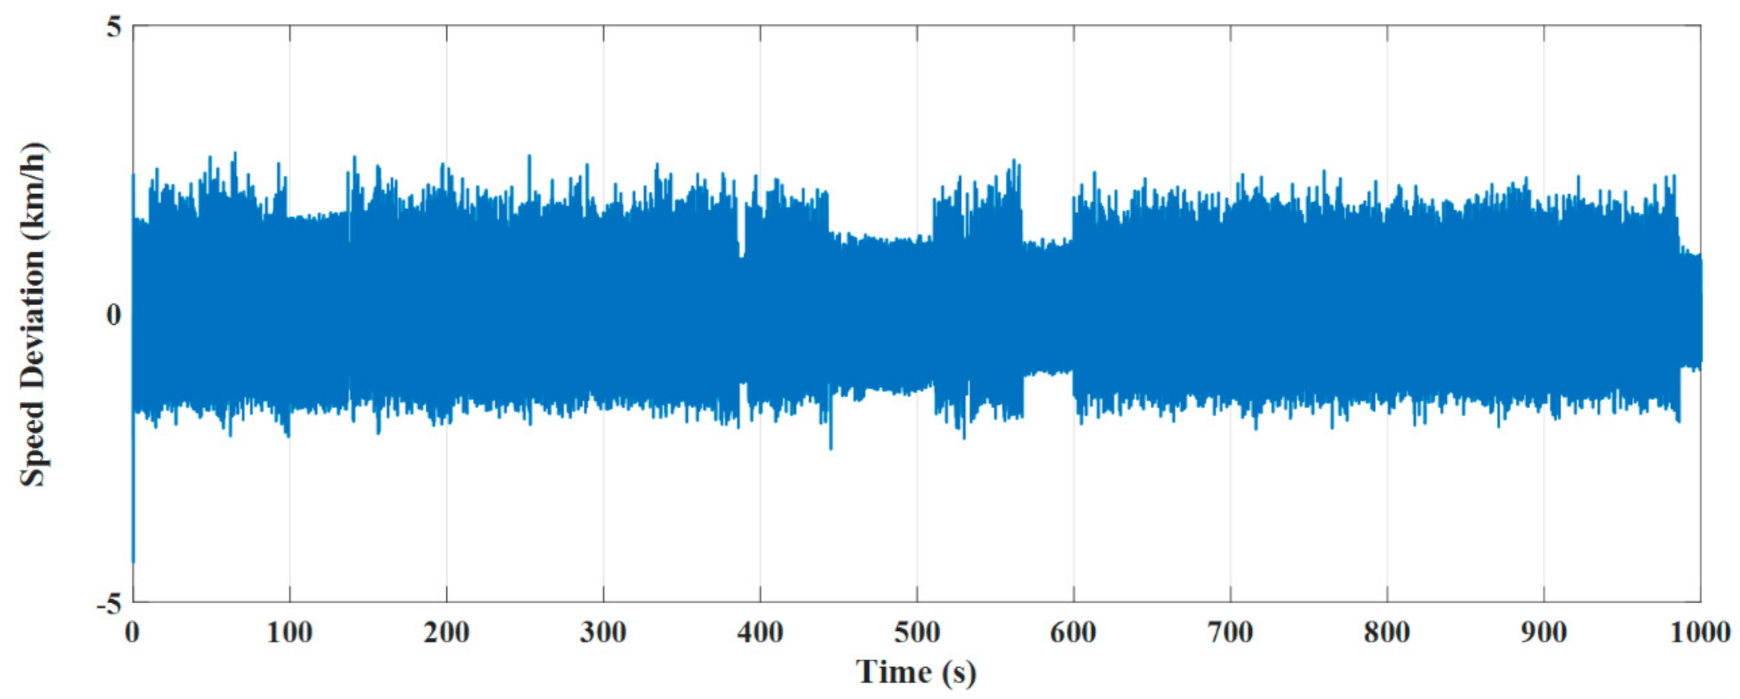
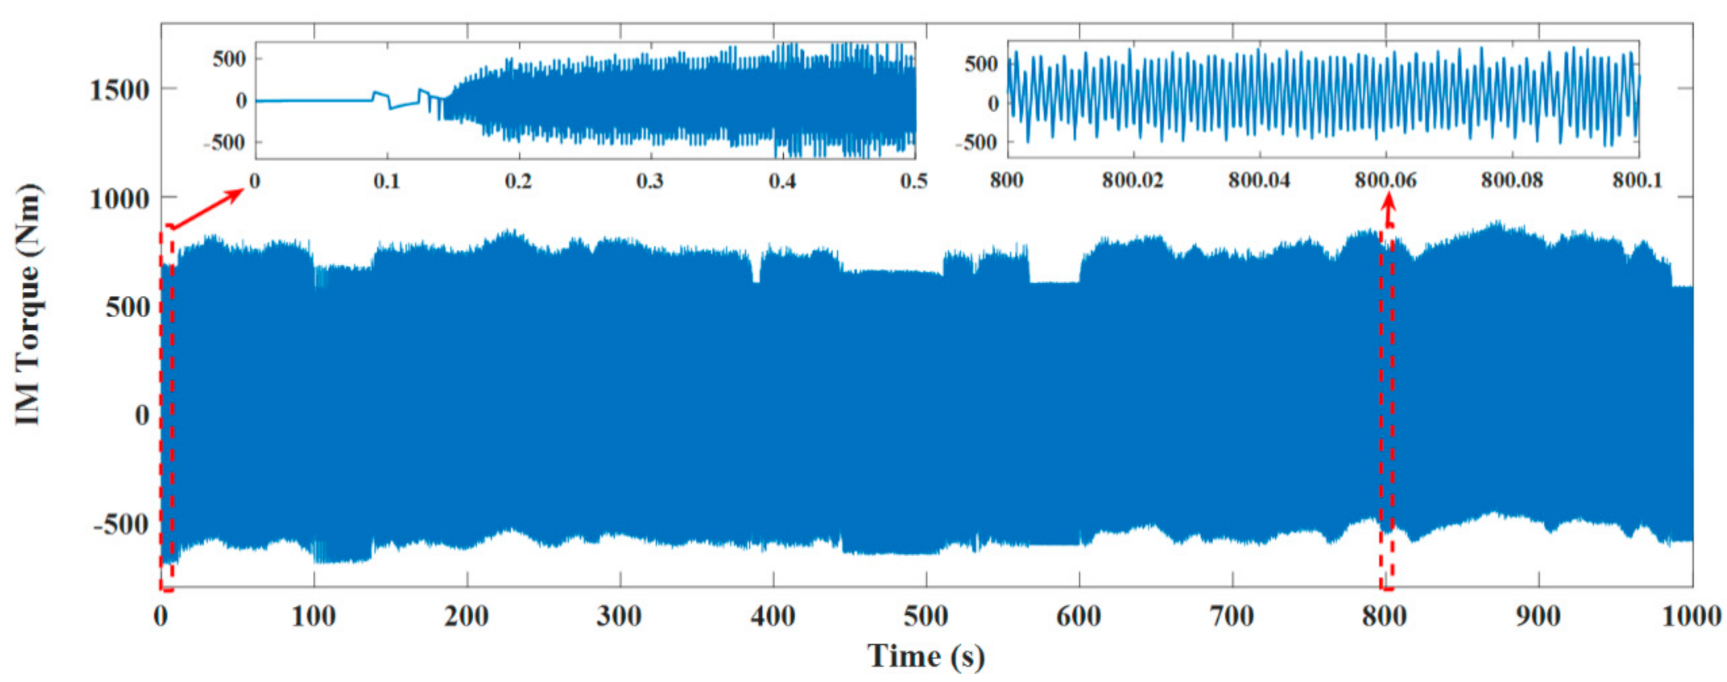
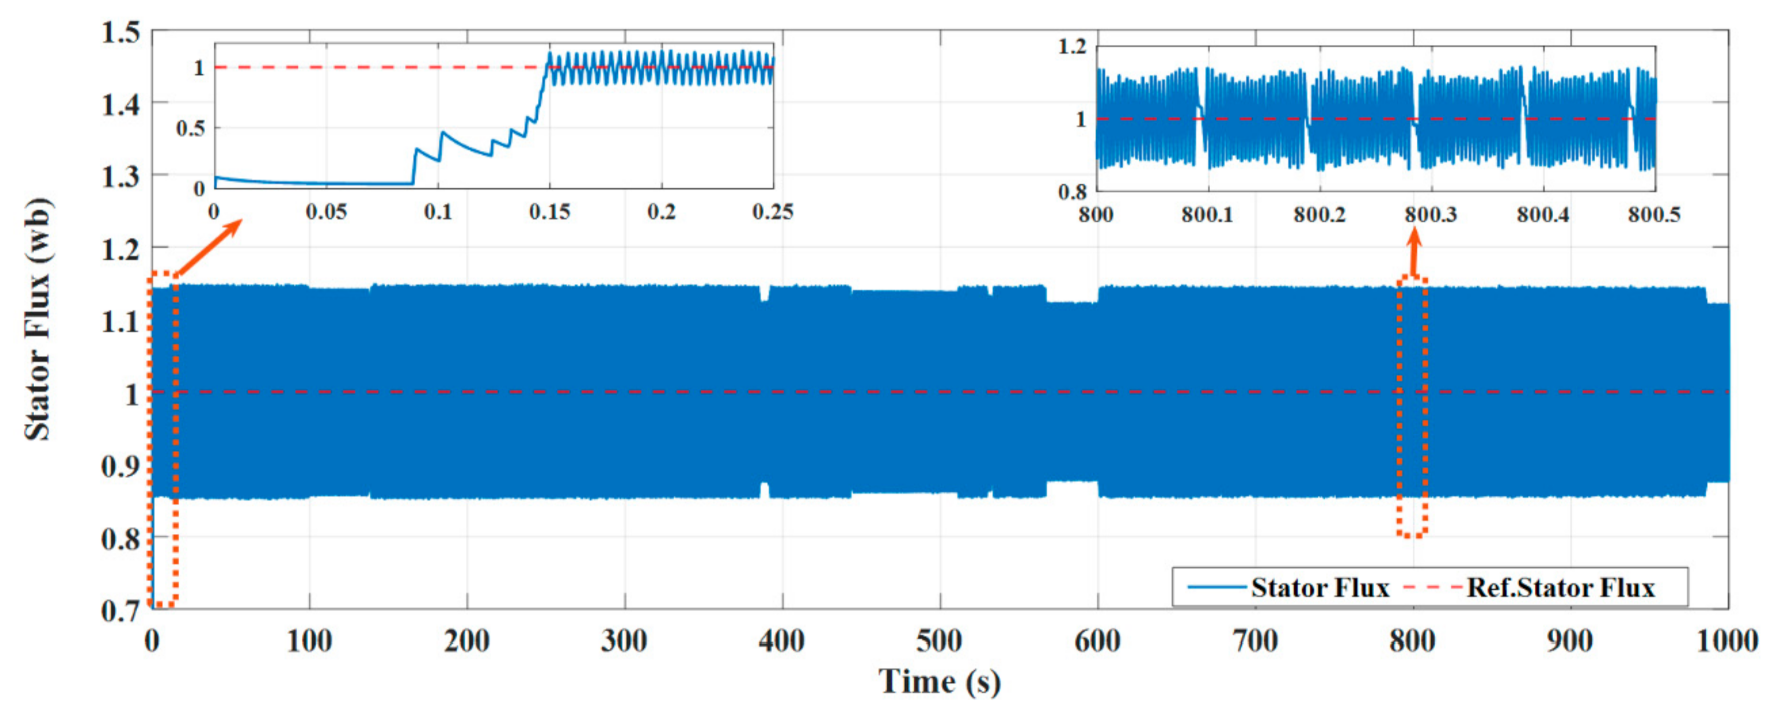
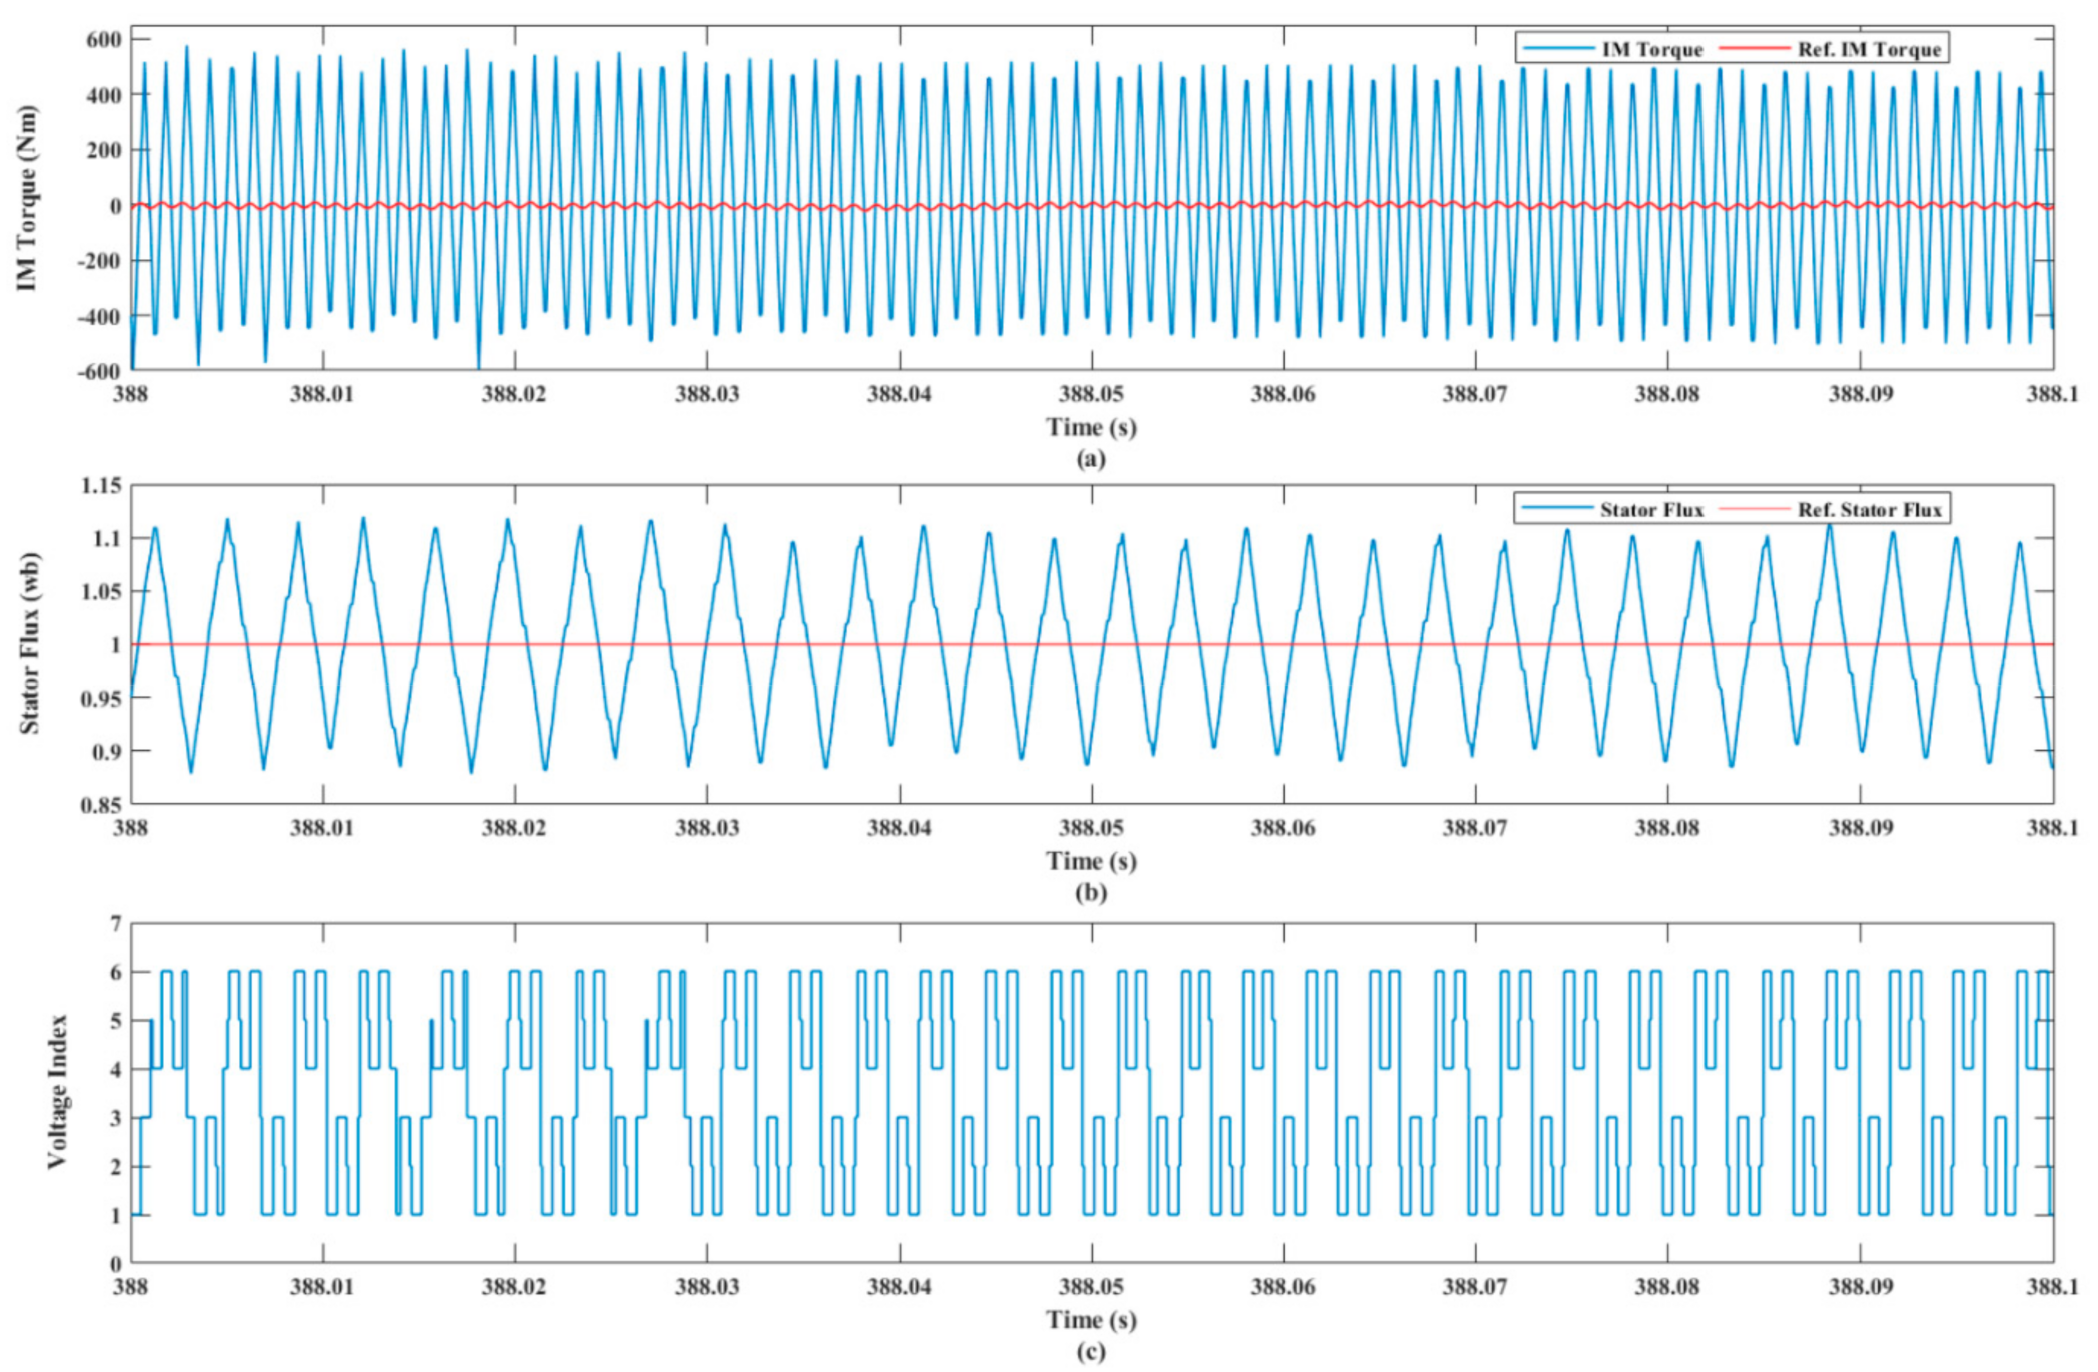
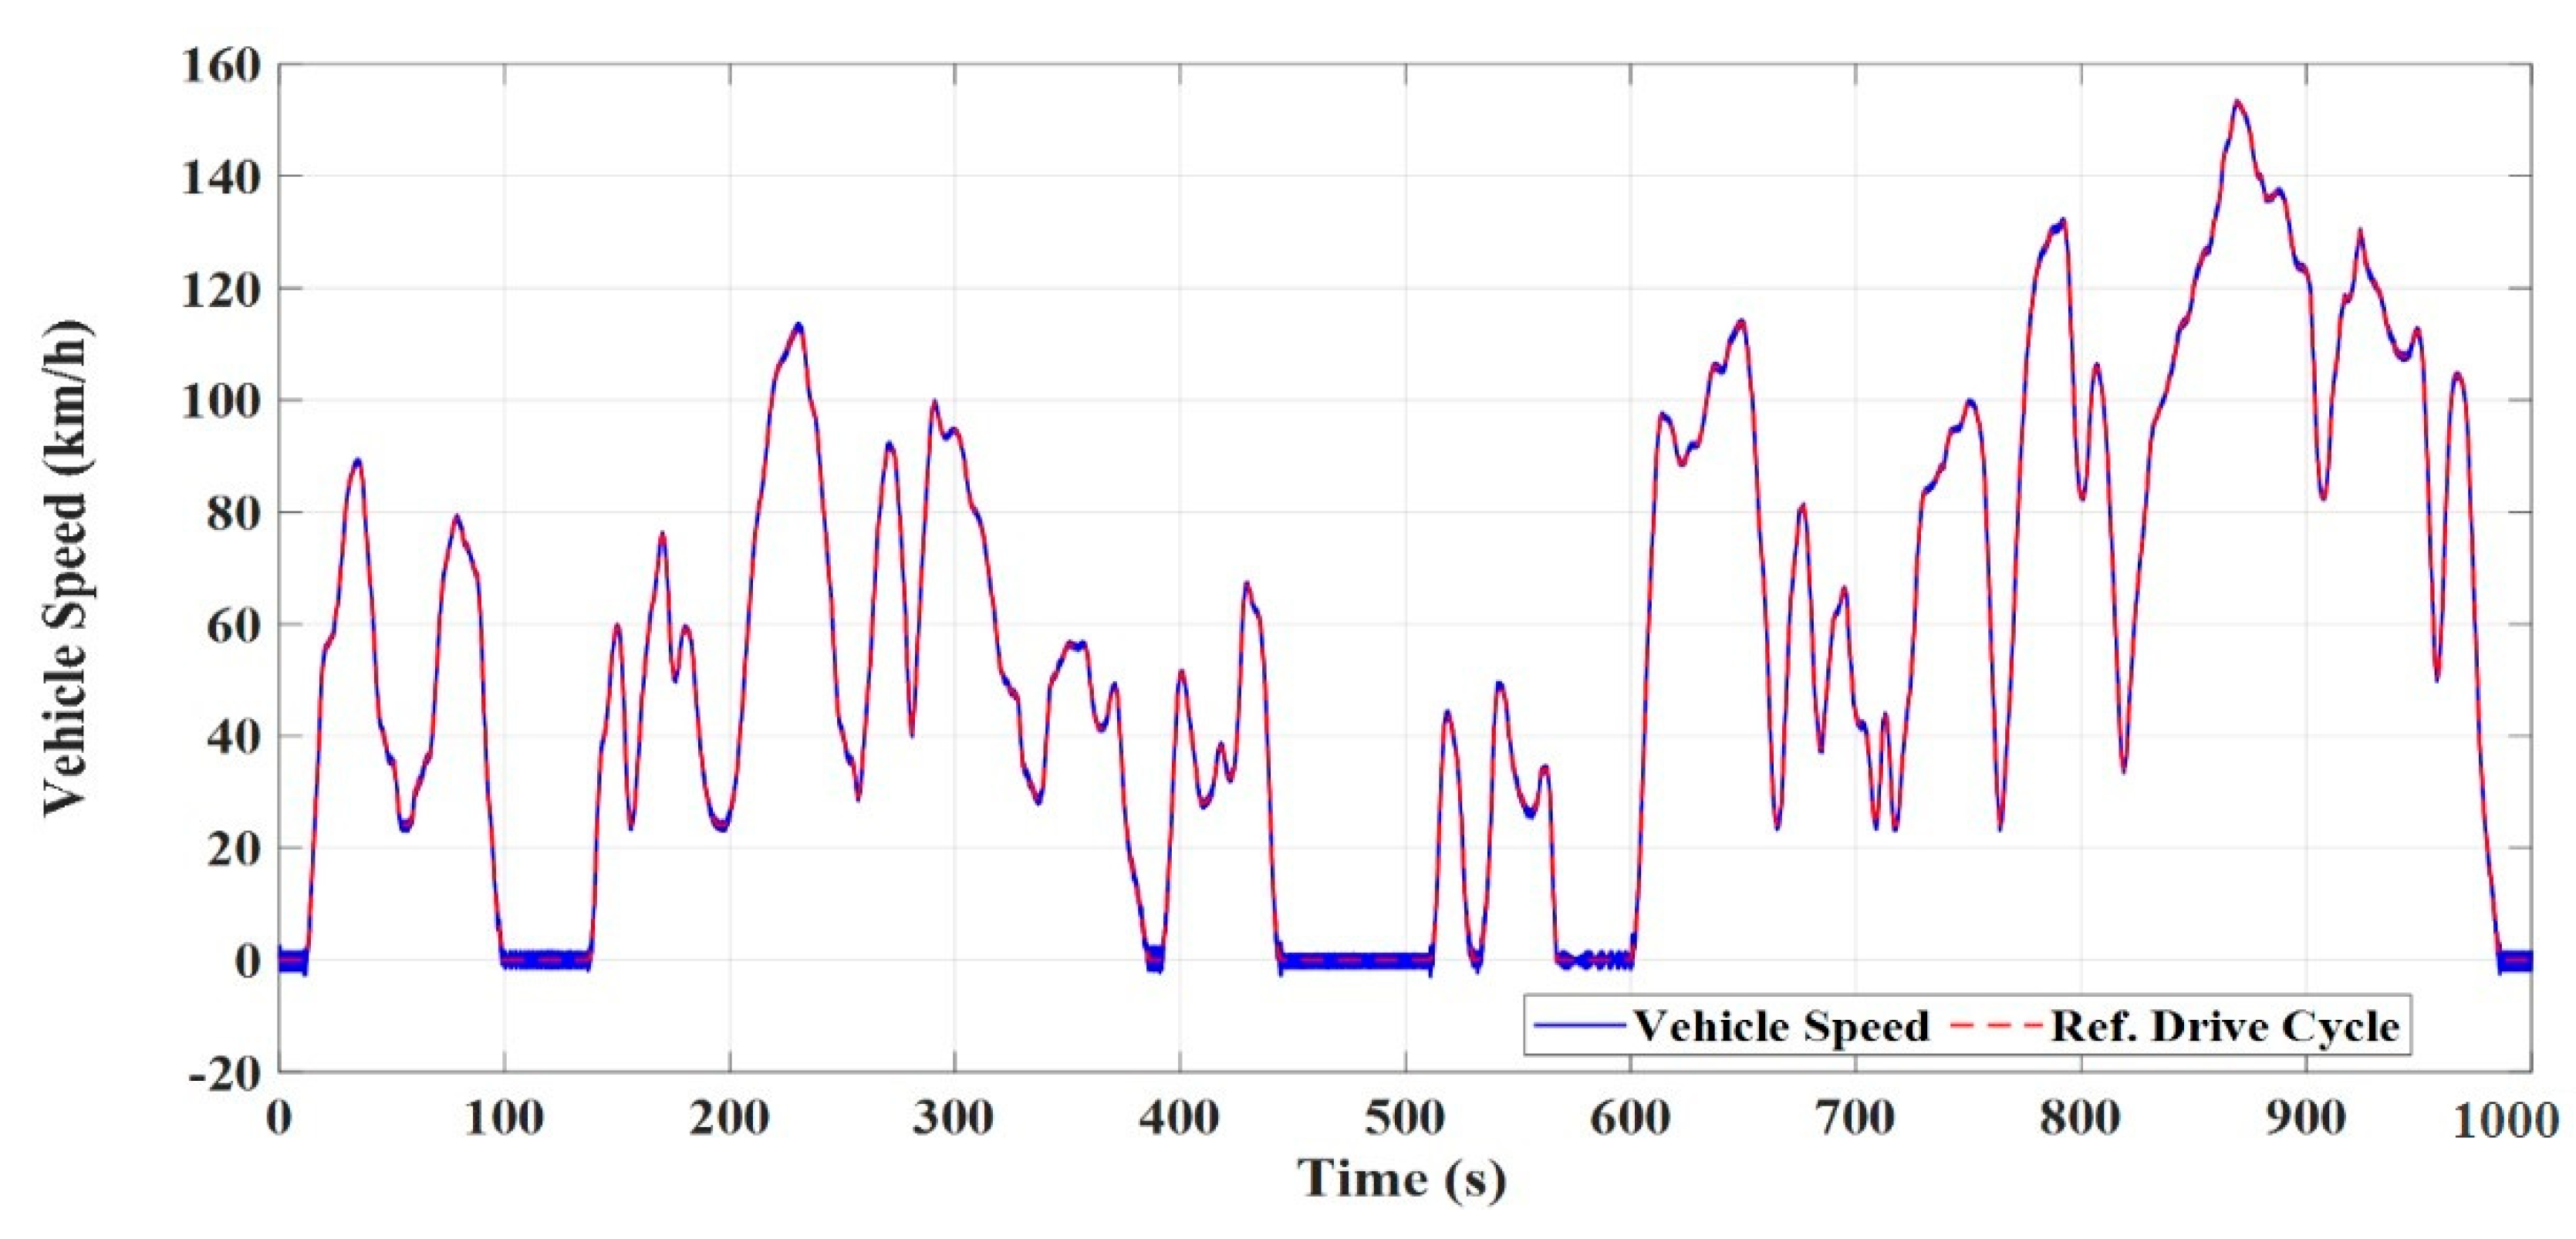
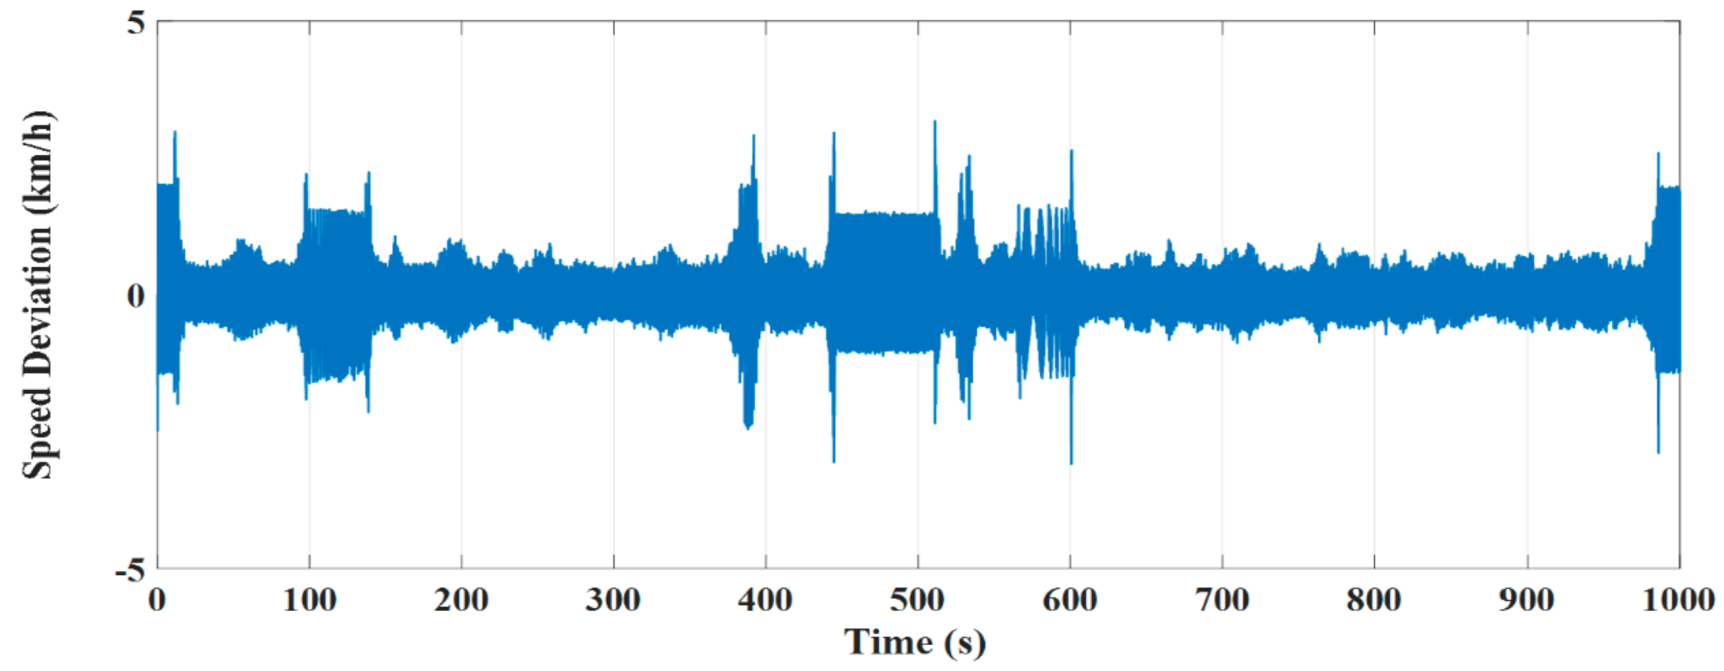
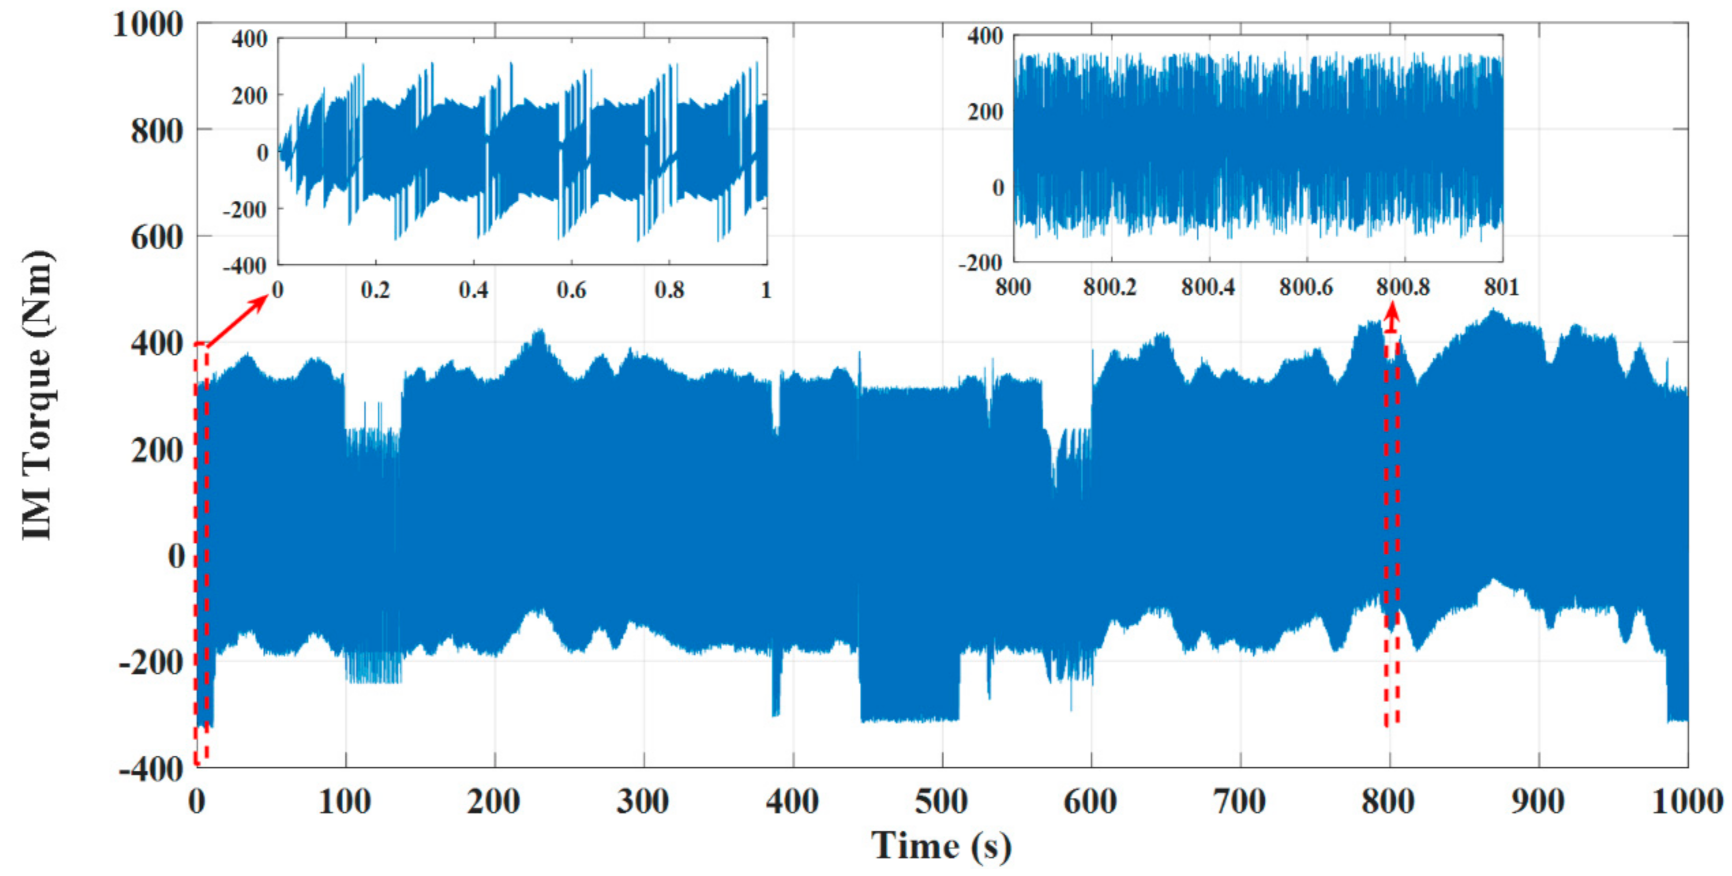
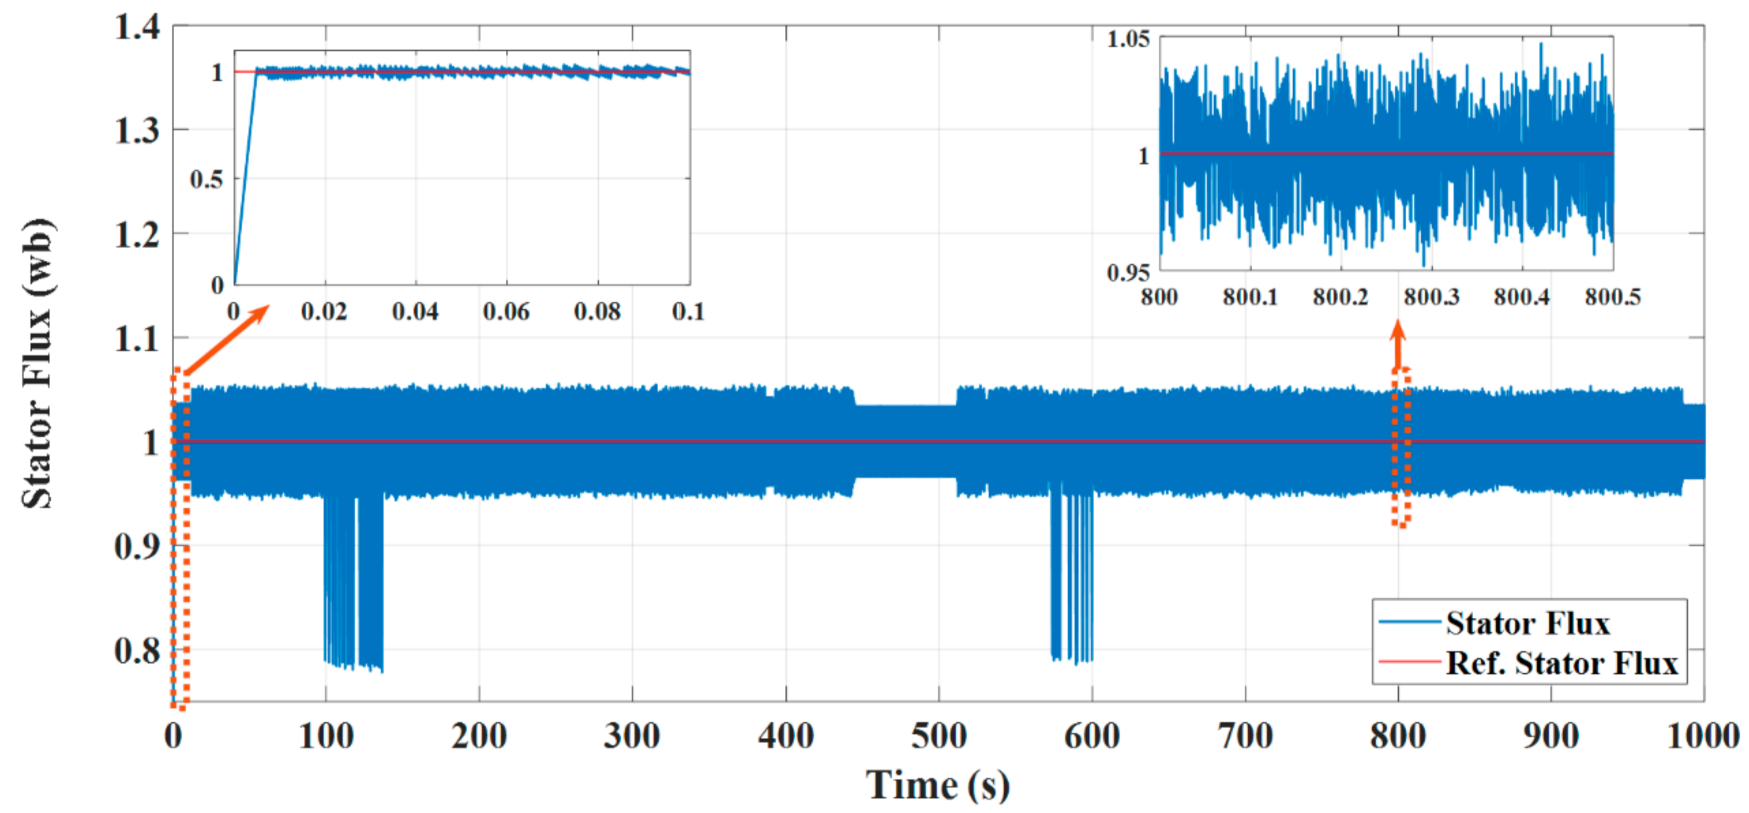
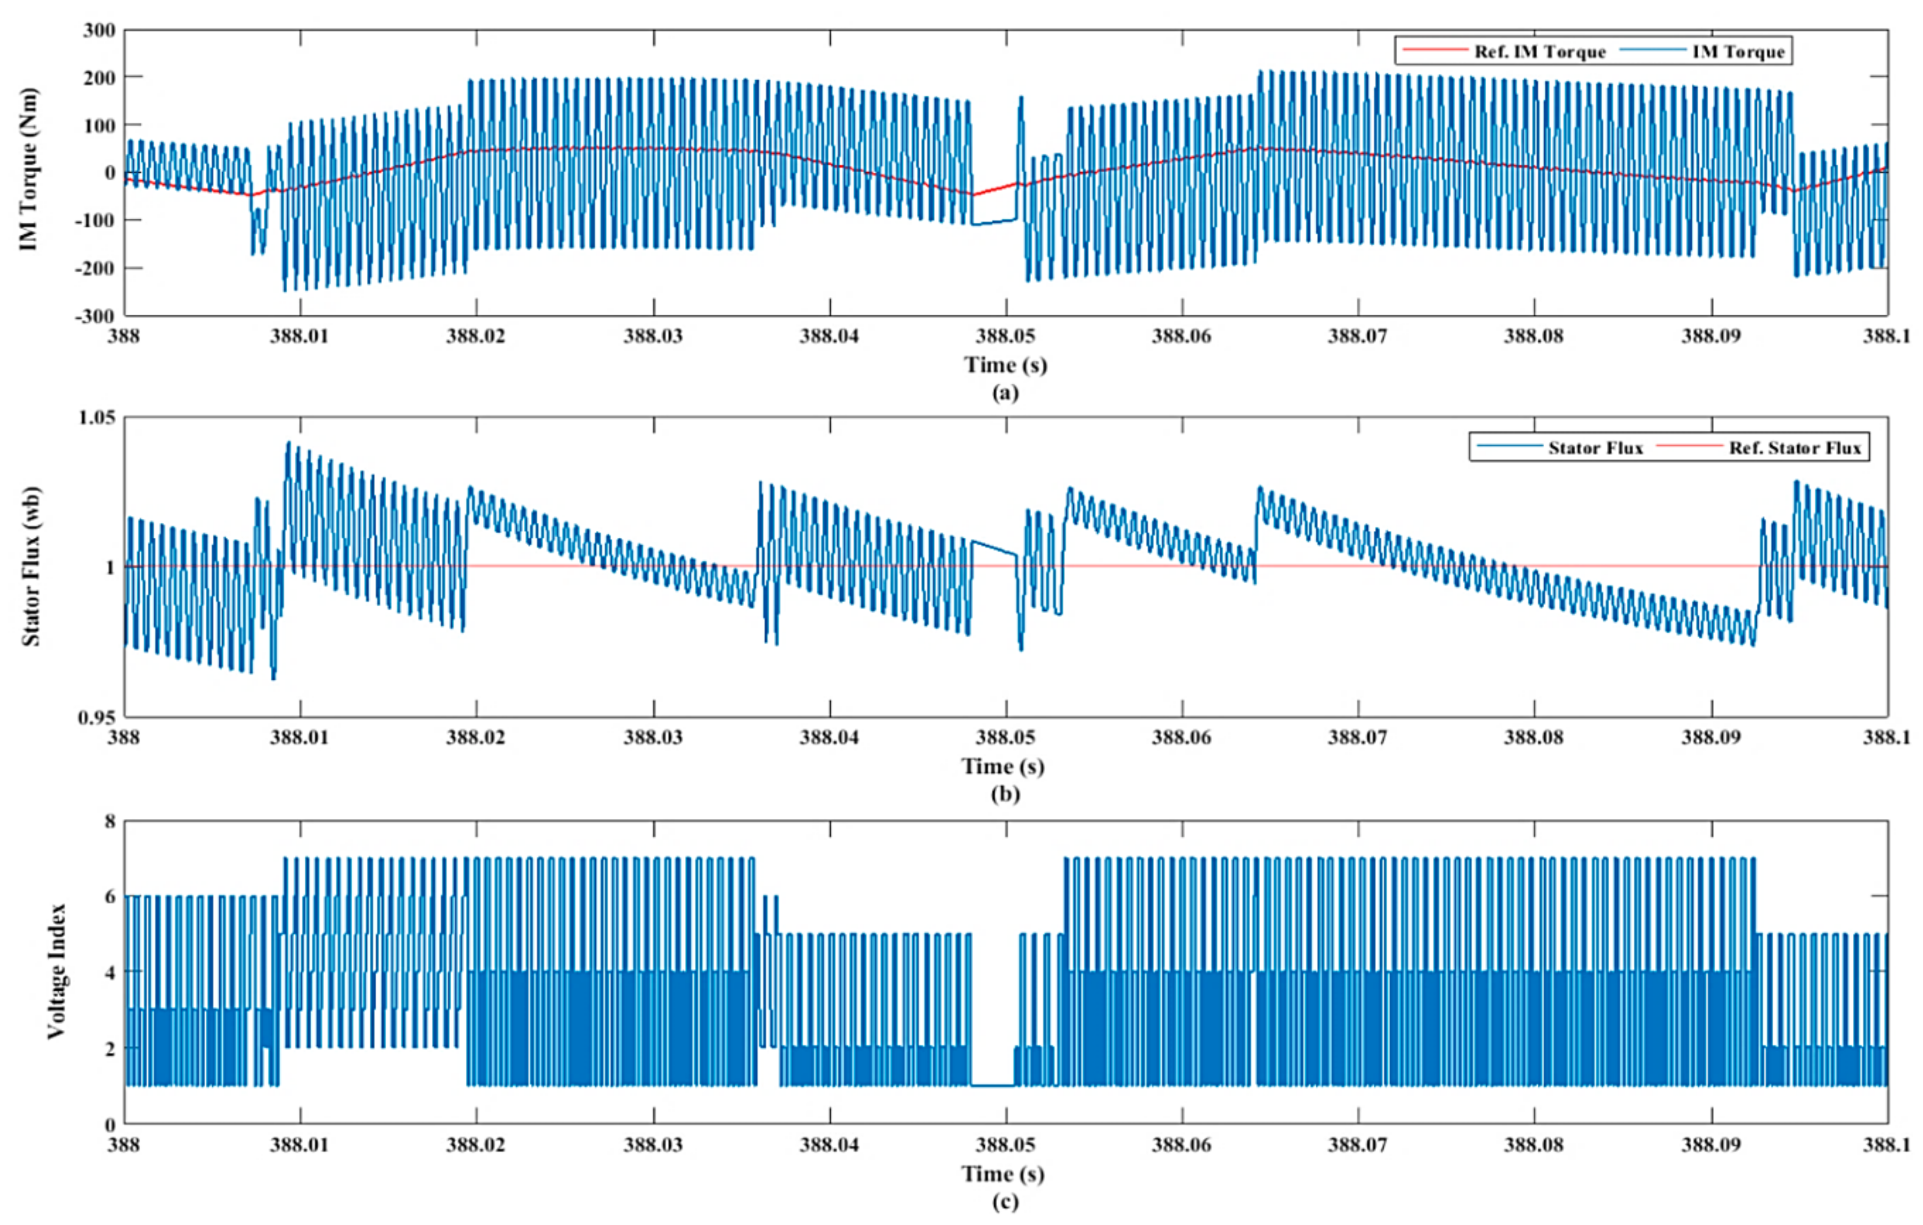
In this subsection, the performance of the EV system was tested when using the DTC approach. Figure 12 illustrates the EV speed which had high speed deviation from the WLTP reference drive cycle as presented in Figure 13. Figure 14 shows that the IM developed torque had high torque ripples. The stator flux under this control method is also illustrated in Figure 15 and shows a high ripple content. Figure 16 illustrates the dynamic behavior of the DTC method. In Figure 16a,b both the torque deviation (ripples) and the stator flux deviation (ripples), respectively, correlate with the change in the applied voltage vector (control action); the latter is illustrated in the form of voltage index variation in Figure 16c, showing the applied voltage sector chosen by the controller.
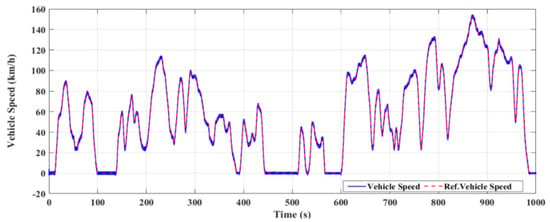
Figure 12.
EV speed based on the DTC with the WLTP (class 3) driving cycle.
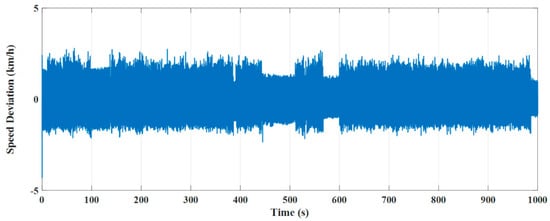
Figure 13.
EV speed deviation under the DTC technique with the WLTP (class 3) driving cycle.
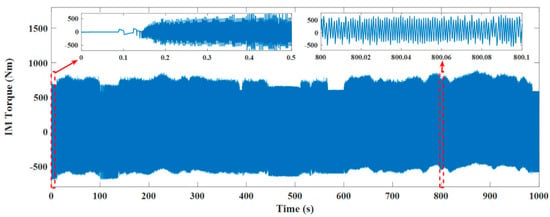
Figure 14.
The IM developed torque based on the DTC technique.
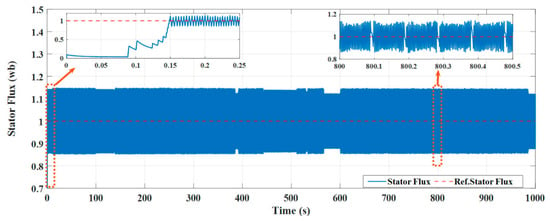
Figure 15.
The IM stator flux based on the DTC technique.
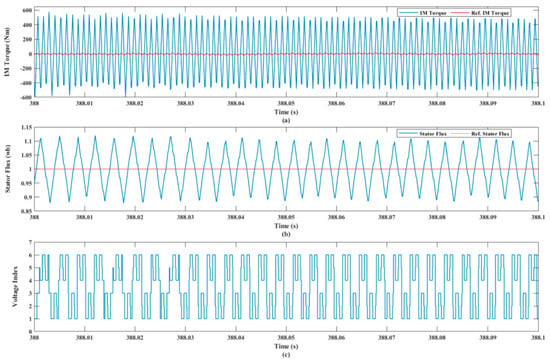
Figure 16.
The behavior of the DTC technique: (a) IM torque; (b) stator flux; (c) voltage index.
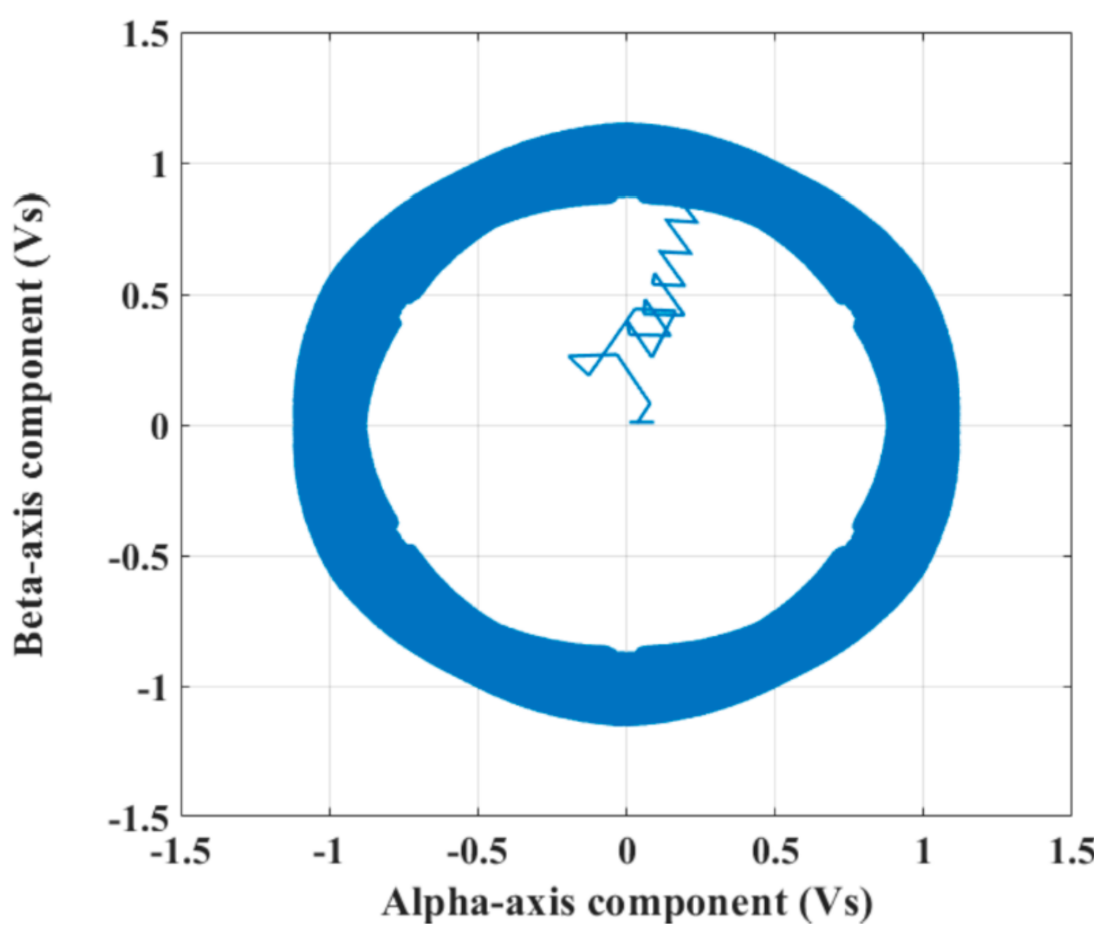
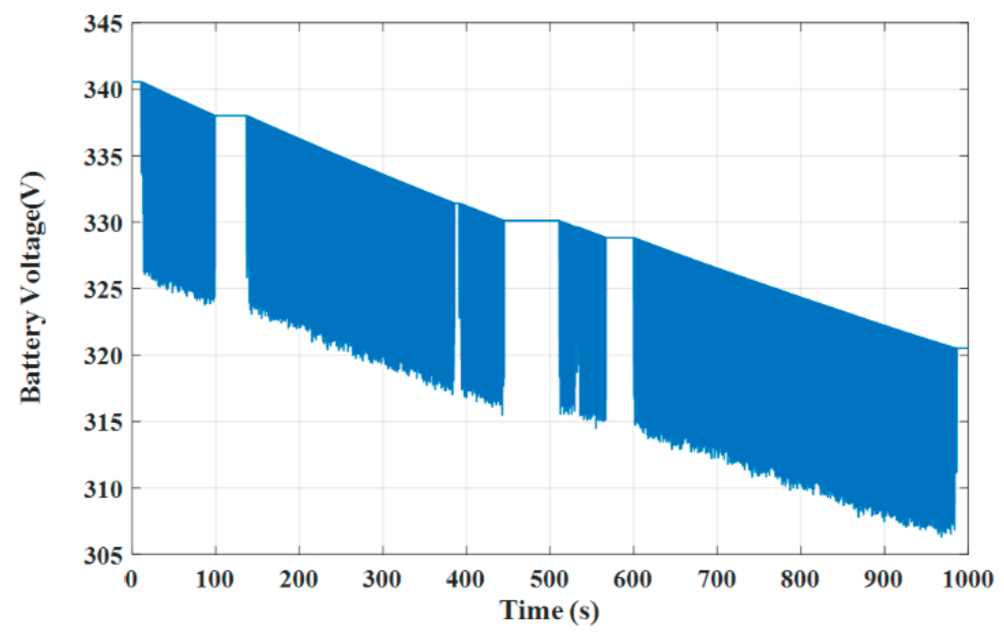
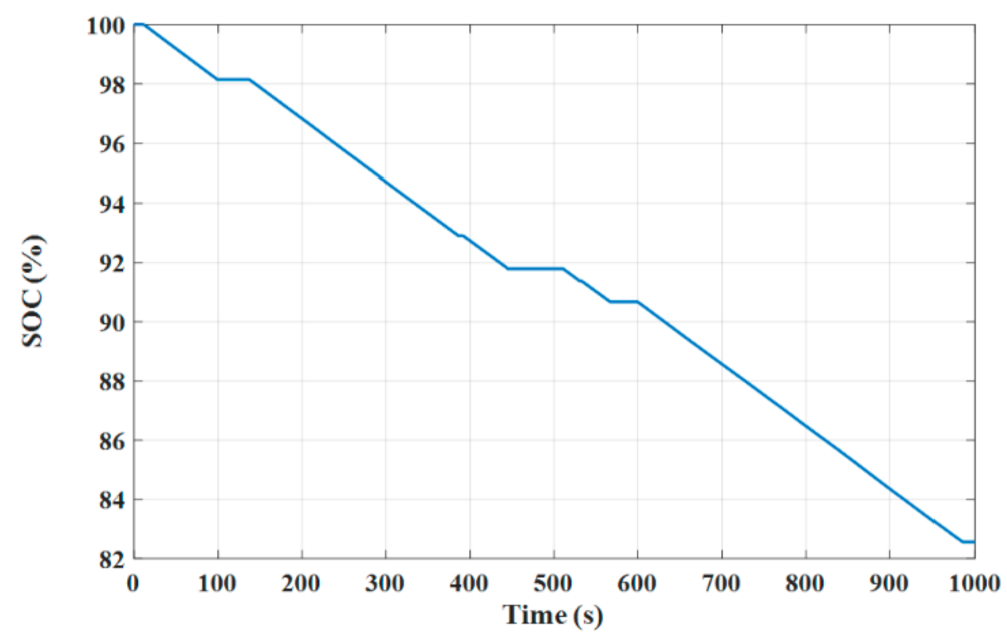
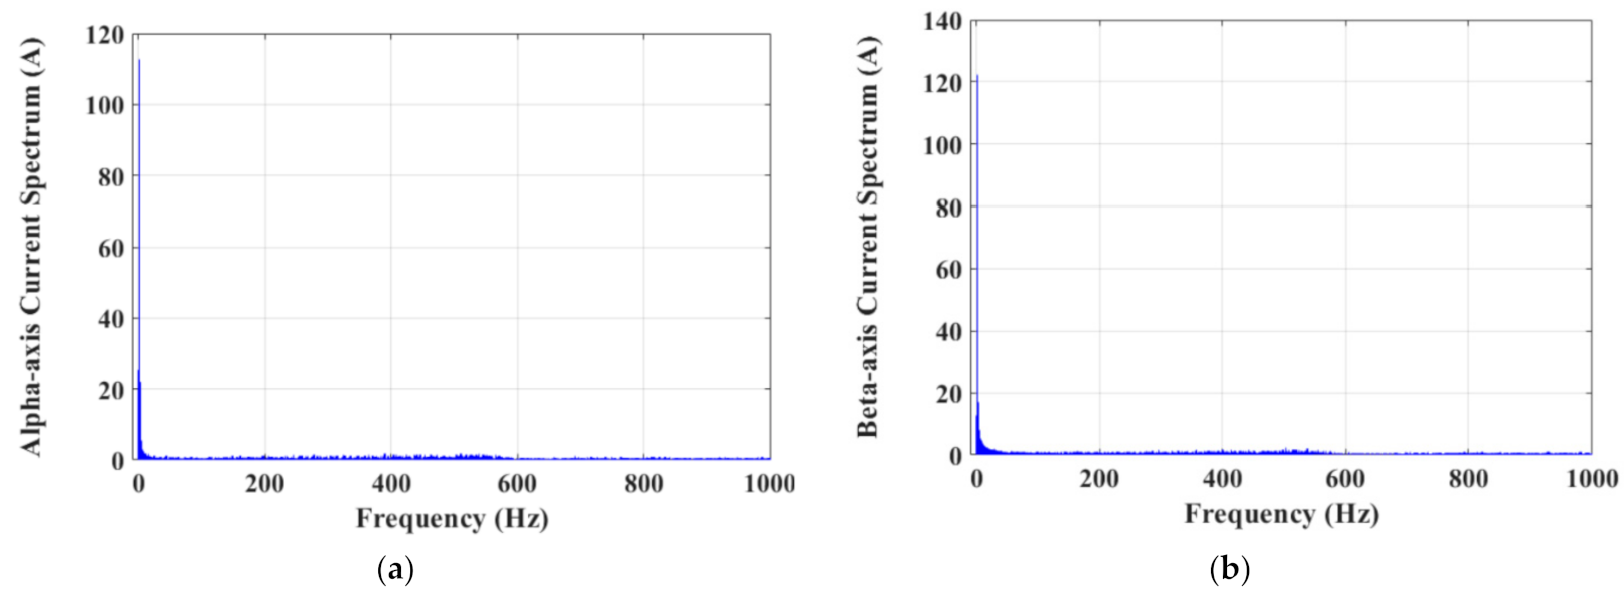
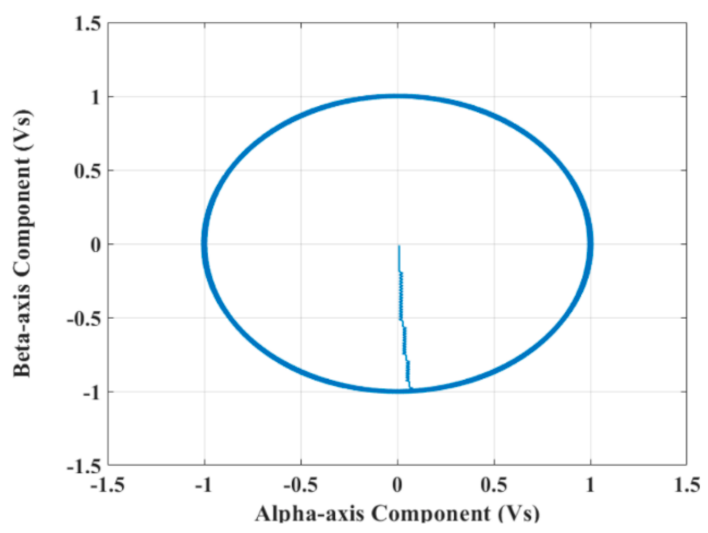
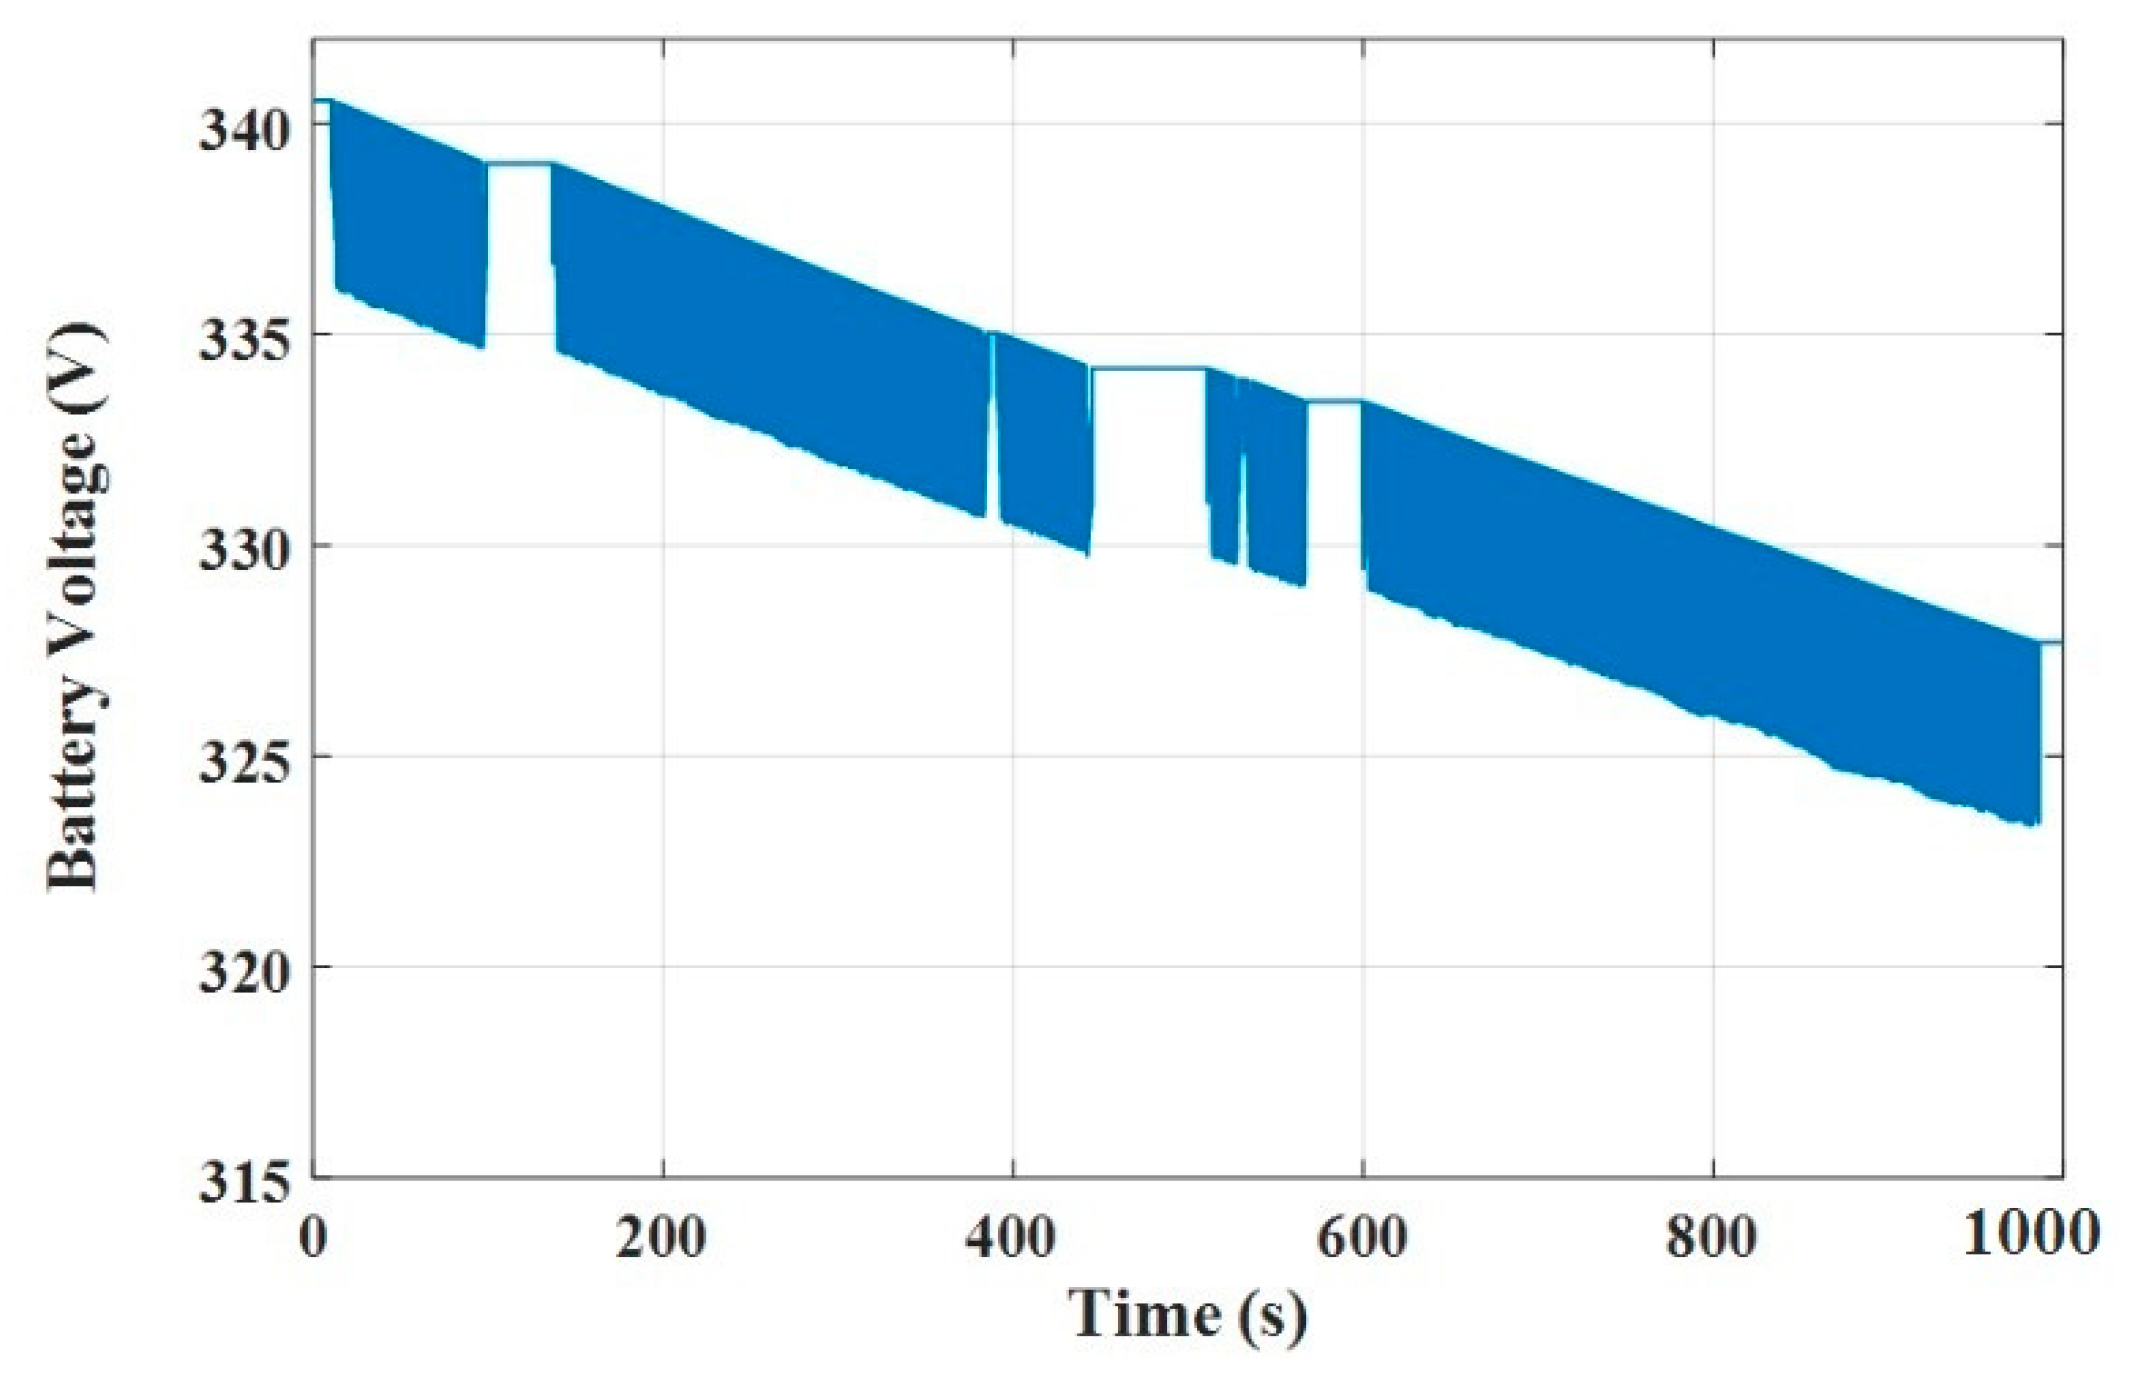
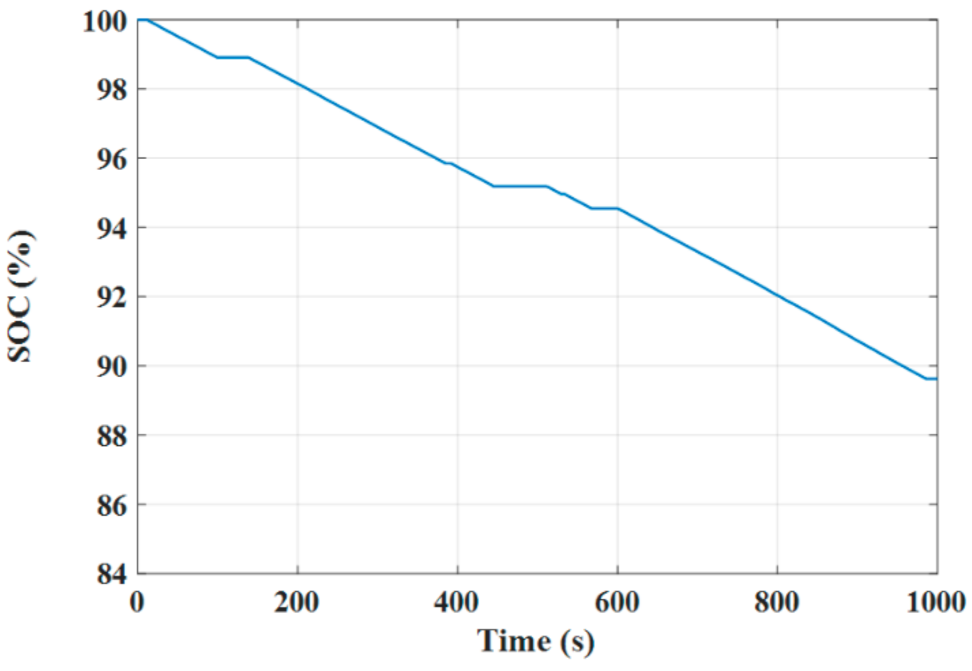
Figure 17 and Figure 18 show the α–β components of the stator current and its FFT spectrums, respectively. The FFT analysis for the stator current α–β components presents a total harmonic distortion (THD) of 4.22% and 3.74% of the fundamental values, respectively. These remarkable contents of the current ripples content can be also observed from the stator flux loci shown in Figure 19. Figure 20 and Figure 21 presents both the battery terminal voltage and the state of charge under DTC control technique.

Figure 17.
Stator current under the DTC technique: (a) alpha-axis current component under DTC; (b) beta-axis current component under DTC.

Figure 18.
The spectrum of the stator current under the DTC technique: (a) alpha-axis current spectrum; (b) beta-axis current spectrum.
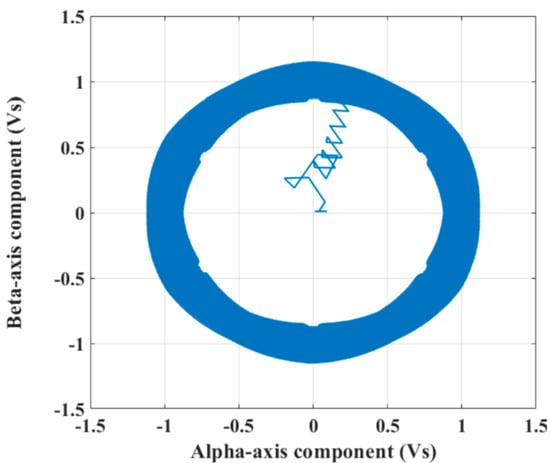
Figure 19.
The loci of the stator flux under the DTC technique.
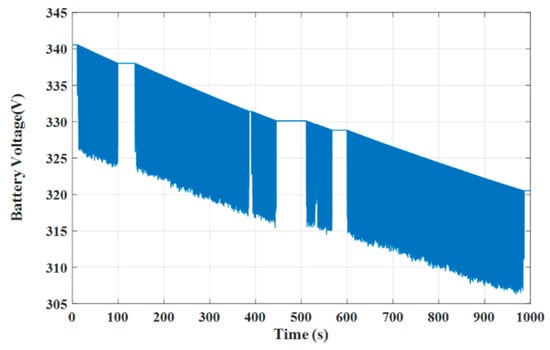
Figure 20.
The battery terminal voltage under the DTC technique.
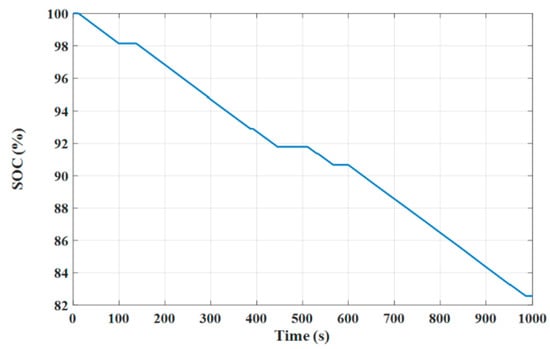
Figure 21.
The battery SOC under the DTC technique.
4.2. Test Results under the MP DTC Technique
In this subsection, the EV system’s dynamic performance is tested when using the MP DTC method. The EV speed based on the MP DTC had a small speed deviation from the WLTP reference drive cycle compared with that the obtained under the DTC as presented in Figure 22 and Figure 23. The developed IM torque under MP DTC was observed to have low ripple content and better dynamic performance than that noticed under DTC as shown in Figure 24. Under MP DTC, the stator flux is shown in Figure 25, presenting a smaller flux deviation in comparison with its behavior under the DTC.
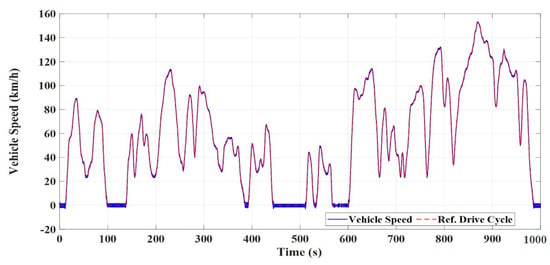
Figure 22.
EV speed based on the MP DTC with the WLTP (class 3) reference drive cycle.
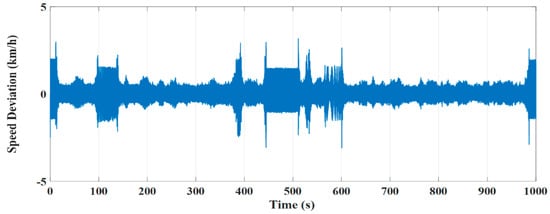
Figure 23.
EV speed deviation under the MP DTC technique with the WLTP (class 3) reference drive cycle.
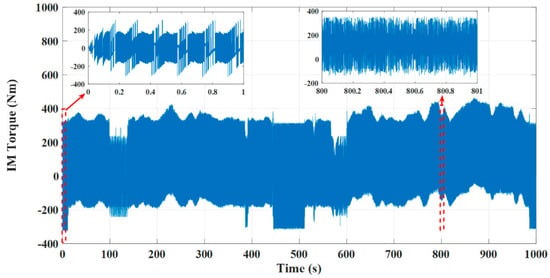
Figure 24.
The IM developed torque based on the MP DTC technique.
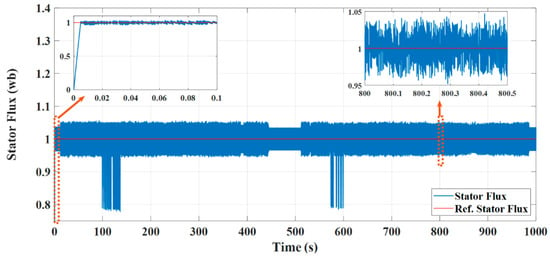
Figure 25.
The IM stator flux based on the MP DTC technique.
Figure 26a,b illustrate the performed control action under MP DTC which presents the variation in both the developed IM torque and the stator flux with respect to the change in the applied voltage vector illustrated by the voltage index variation in Figure 26c.
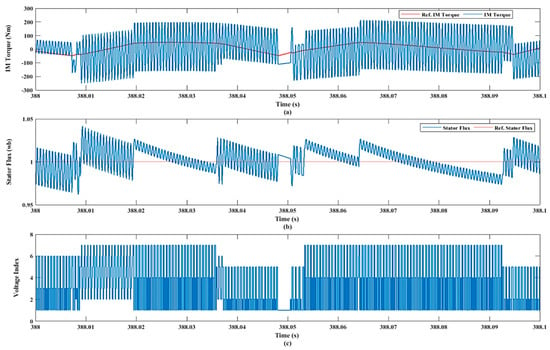
Figure 26.
The control action taken under MP DTC: (a) IM torque deviation; (b) stator flux deviation; (c) voltage index.
Figure 27 and Figure 28 show the α–β components of the stator current and its FFT spectrum under the MP DTC control, respectively. The FFT analysis for the stator current’s α–β components showed a total harmonic distortion (THD) of 0.84% and 1.09% of the fundamental values, respectively.

Figure 27.
Stator current under the MP DTC technique: (a) alpha-axis component of the stator current; (b) beta-axis component of the stator current.

Figure 28.
Stator current spectrum when applying the MP DTC technique: (a) alpha-axis stator current spectrum; (b) beta-axis stator current spectrum.
The stator current components present lower harmonic content compared with the DTC. These facts can be also noticed from the stator flux loci shown in Figure 29.
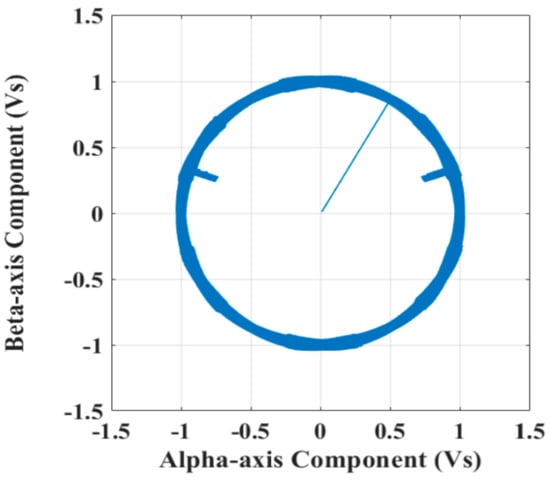
Figure 29.
Loci of stator flux under the MP DTC technique.
Figure 30 illustrates the terminal voltage of the battery stack under the MP DTC technique which had a small ripple content compared to that obtained with the DTC technique. The SOC under the MP DTC technique, presented in Figure 31, showed a low discharging rate under MP DTC compared with the DTC technique.
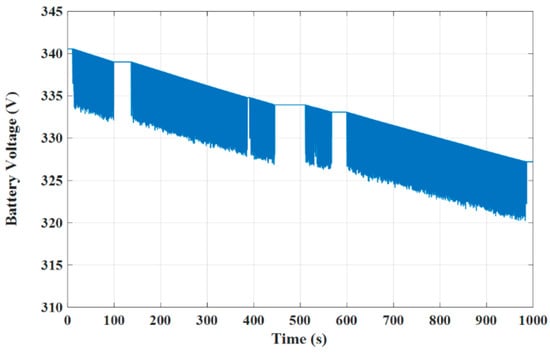
Figure 30.
The battery terminal voltage under the MP DTC technique.
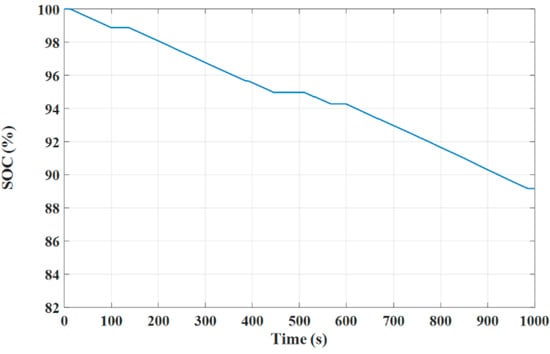
Figure 31.
The battery SOC under the MP DTC technique.
4.3. Test Results under PVC Technique
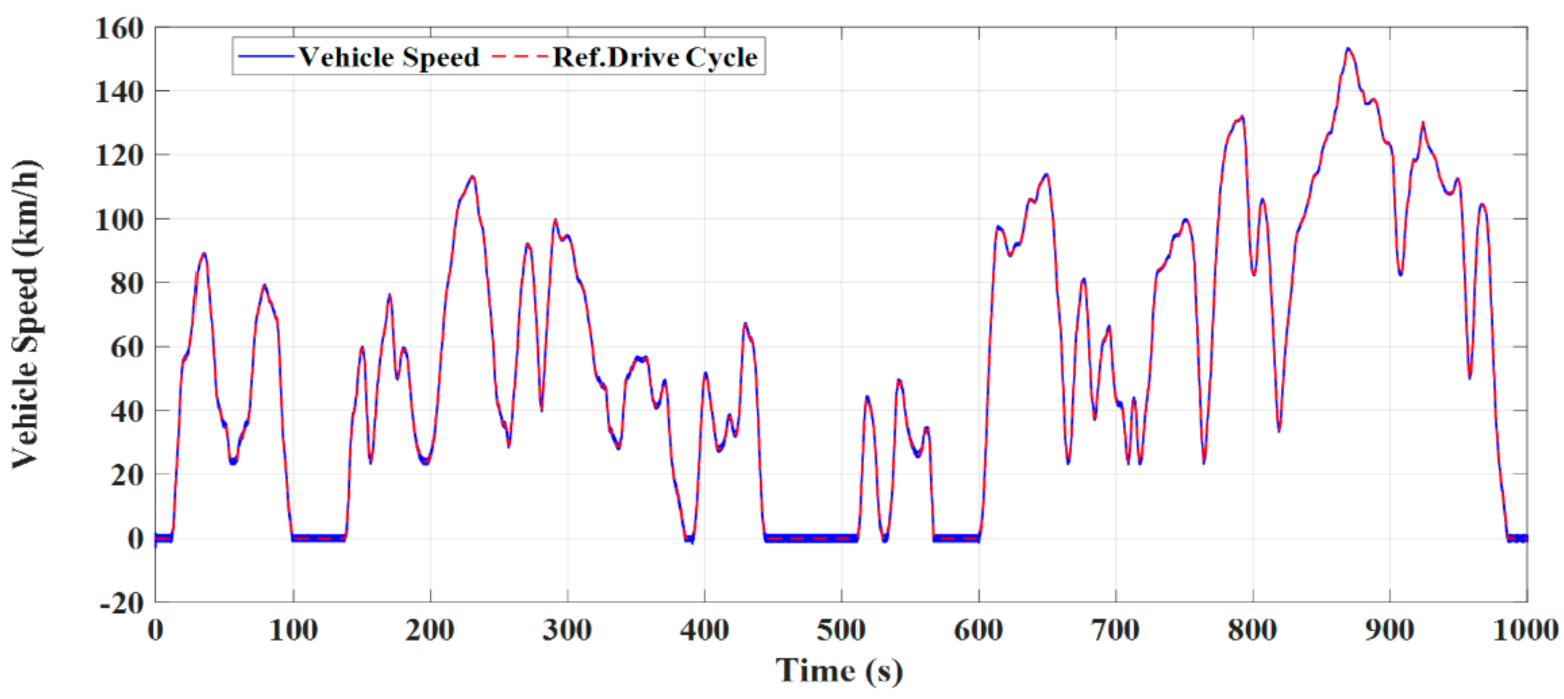
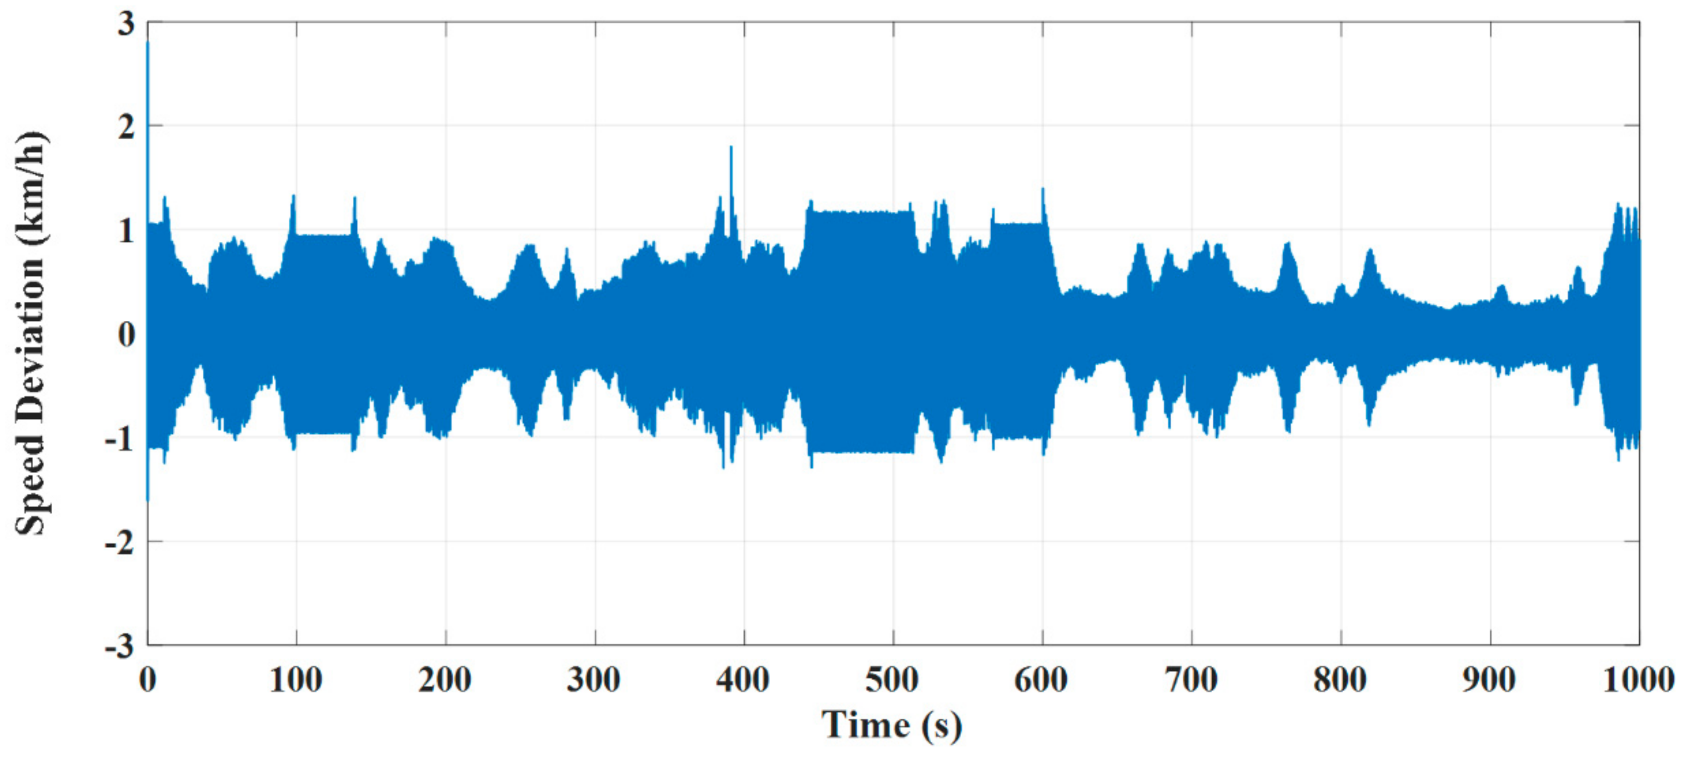
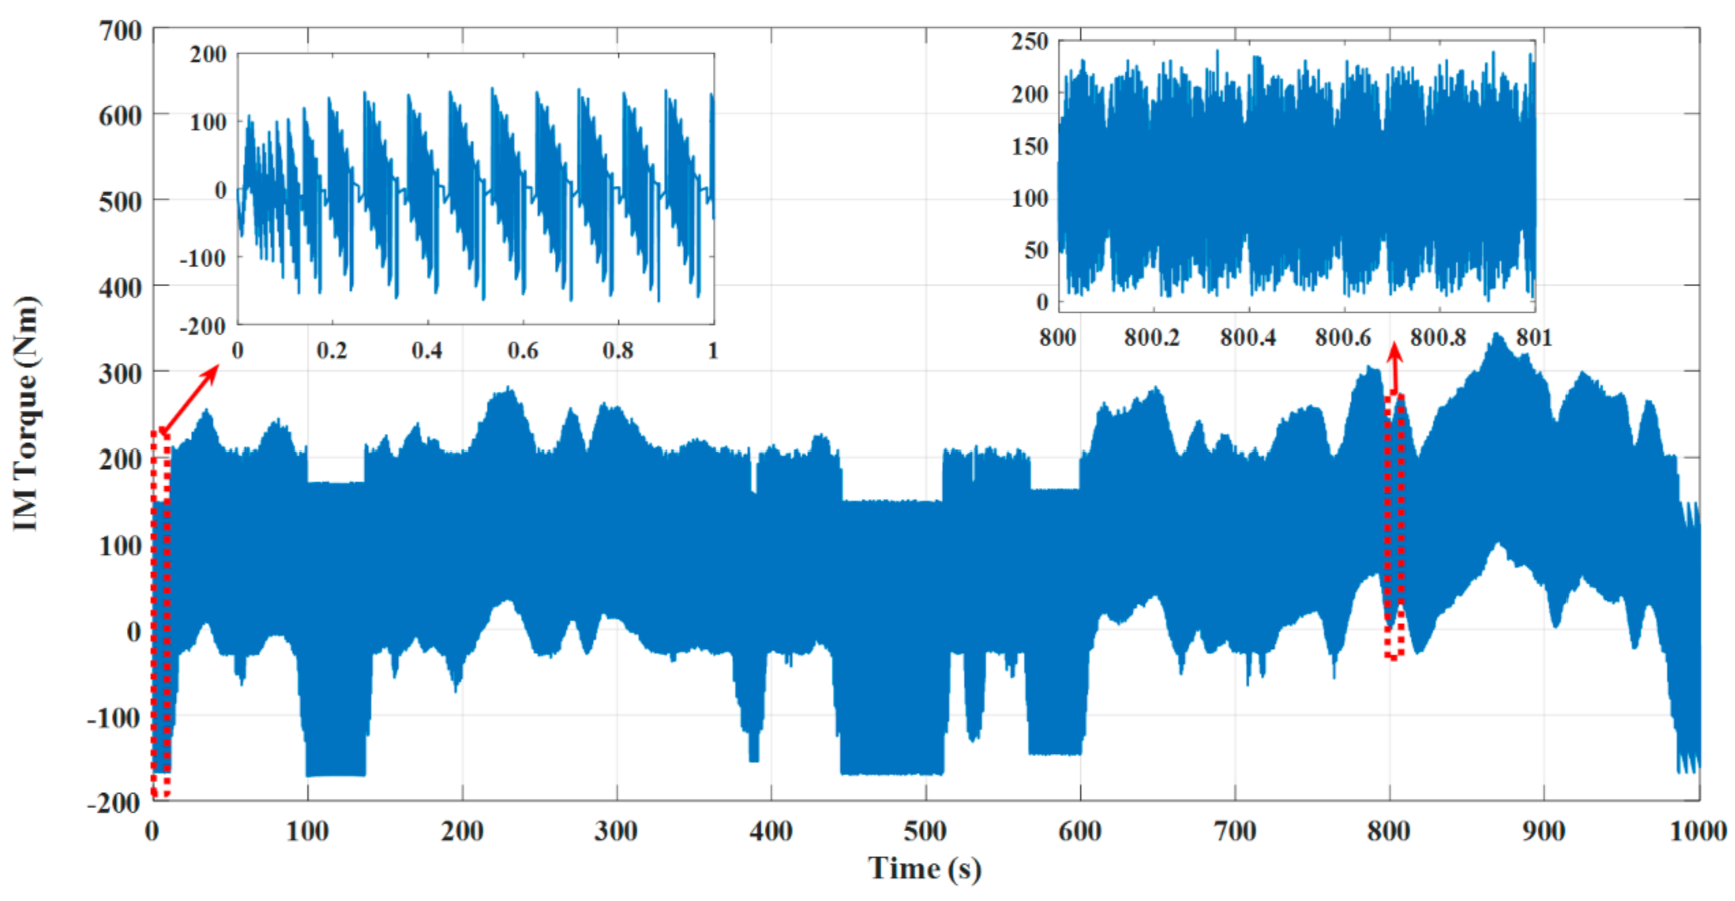
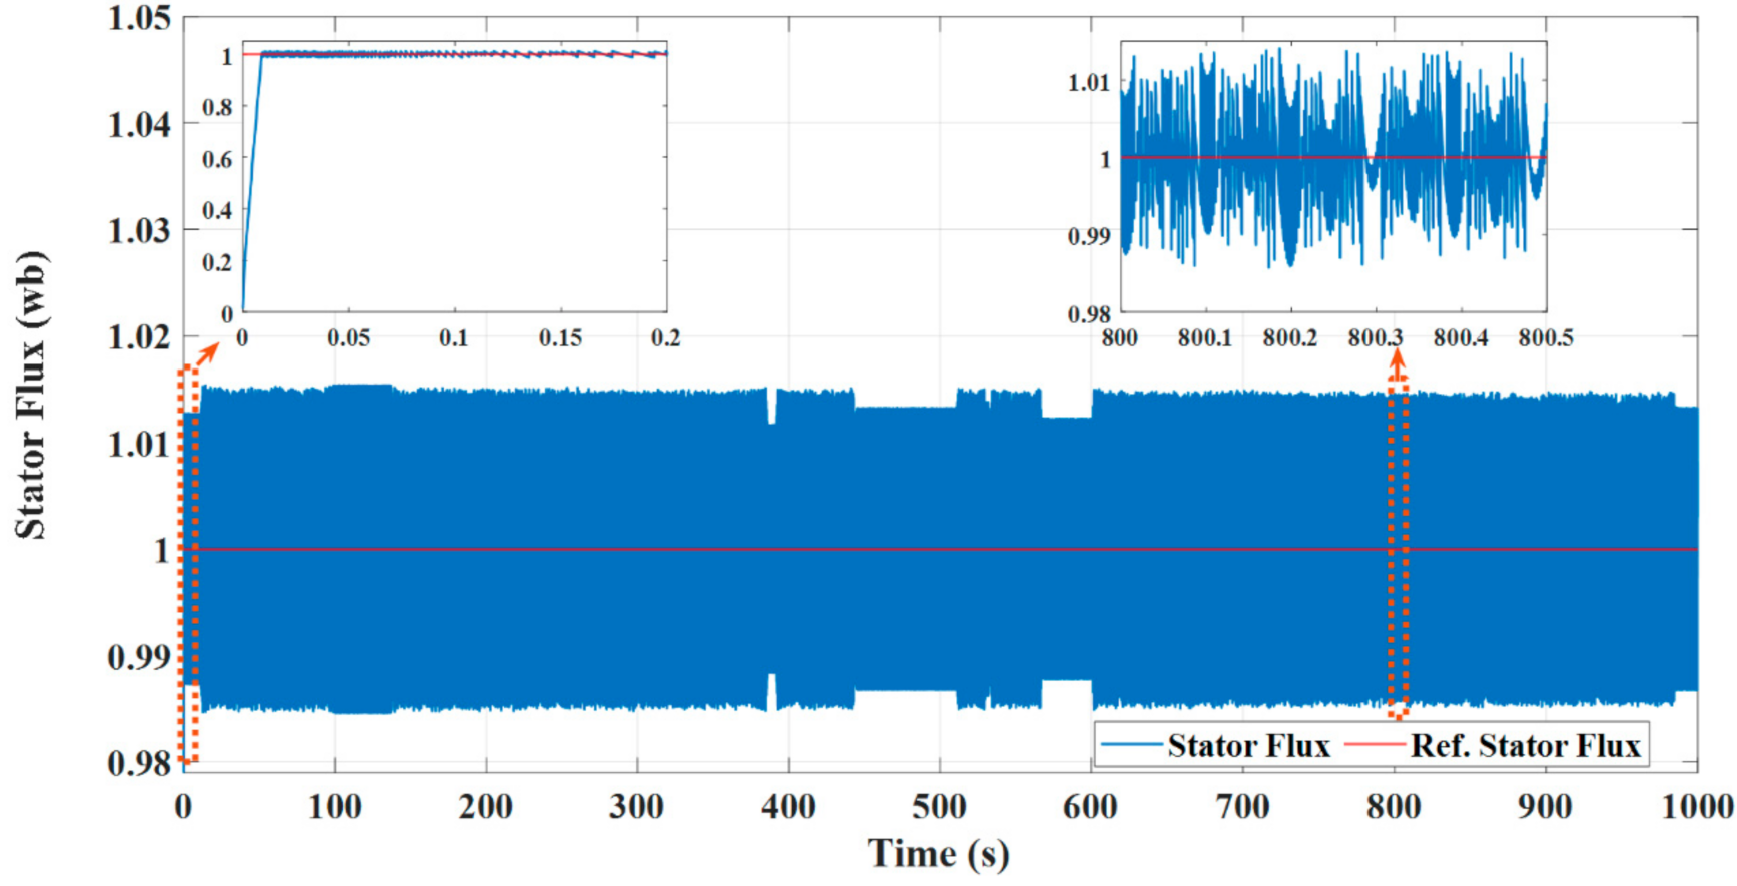
In this subsection, the dynamic performance of the EV system is tested when using the PVC technique. Figure 32 illustrates the EV speed profile based on the PVC which has the smallest speed deviation from the WLTP reference drive cycle compared with the other control techniques; this is verified in Figure 33. The developed IM torque under PVC is illustrated in Figure 34, exhibiting a much lower ripple content compared with MP DTC and DTC. Figure 35 shows the stator flux profile which also presents the smallest deviation from the reference flux.
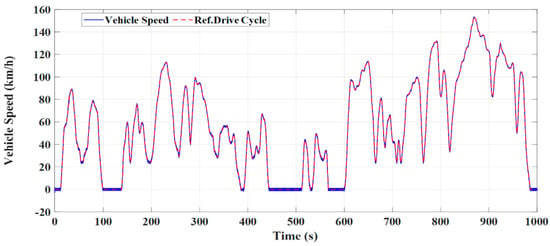
Figure 32.
EV speed based on the PVC with the WLTP (class 3) reference drive cycle.
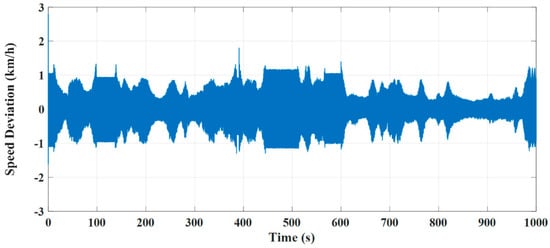
Figure 33.
EV speed deviation under the PVC technique with the WLTP (class 3) reference drive cycle.
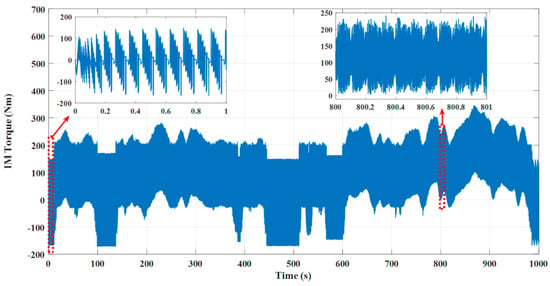
Figure 34.
The IM developed torque based on the PVC technique.
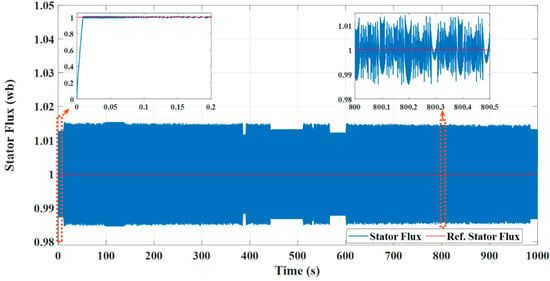
Figure 35.
The IM stator flux based on the PVC technique.
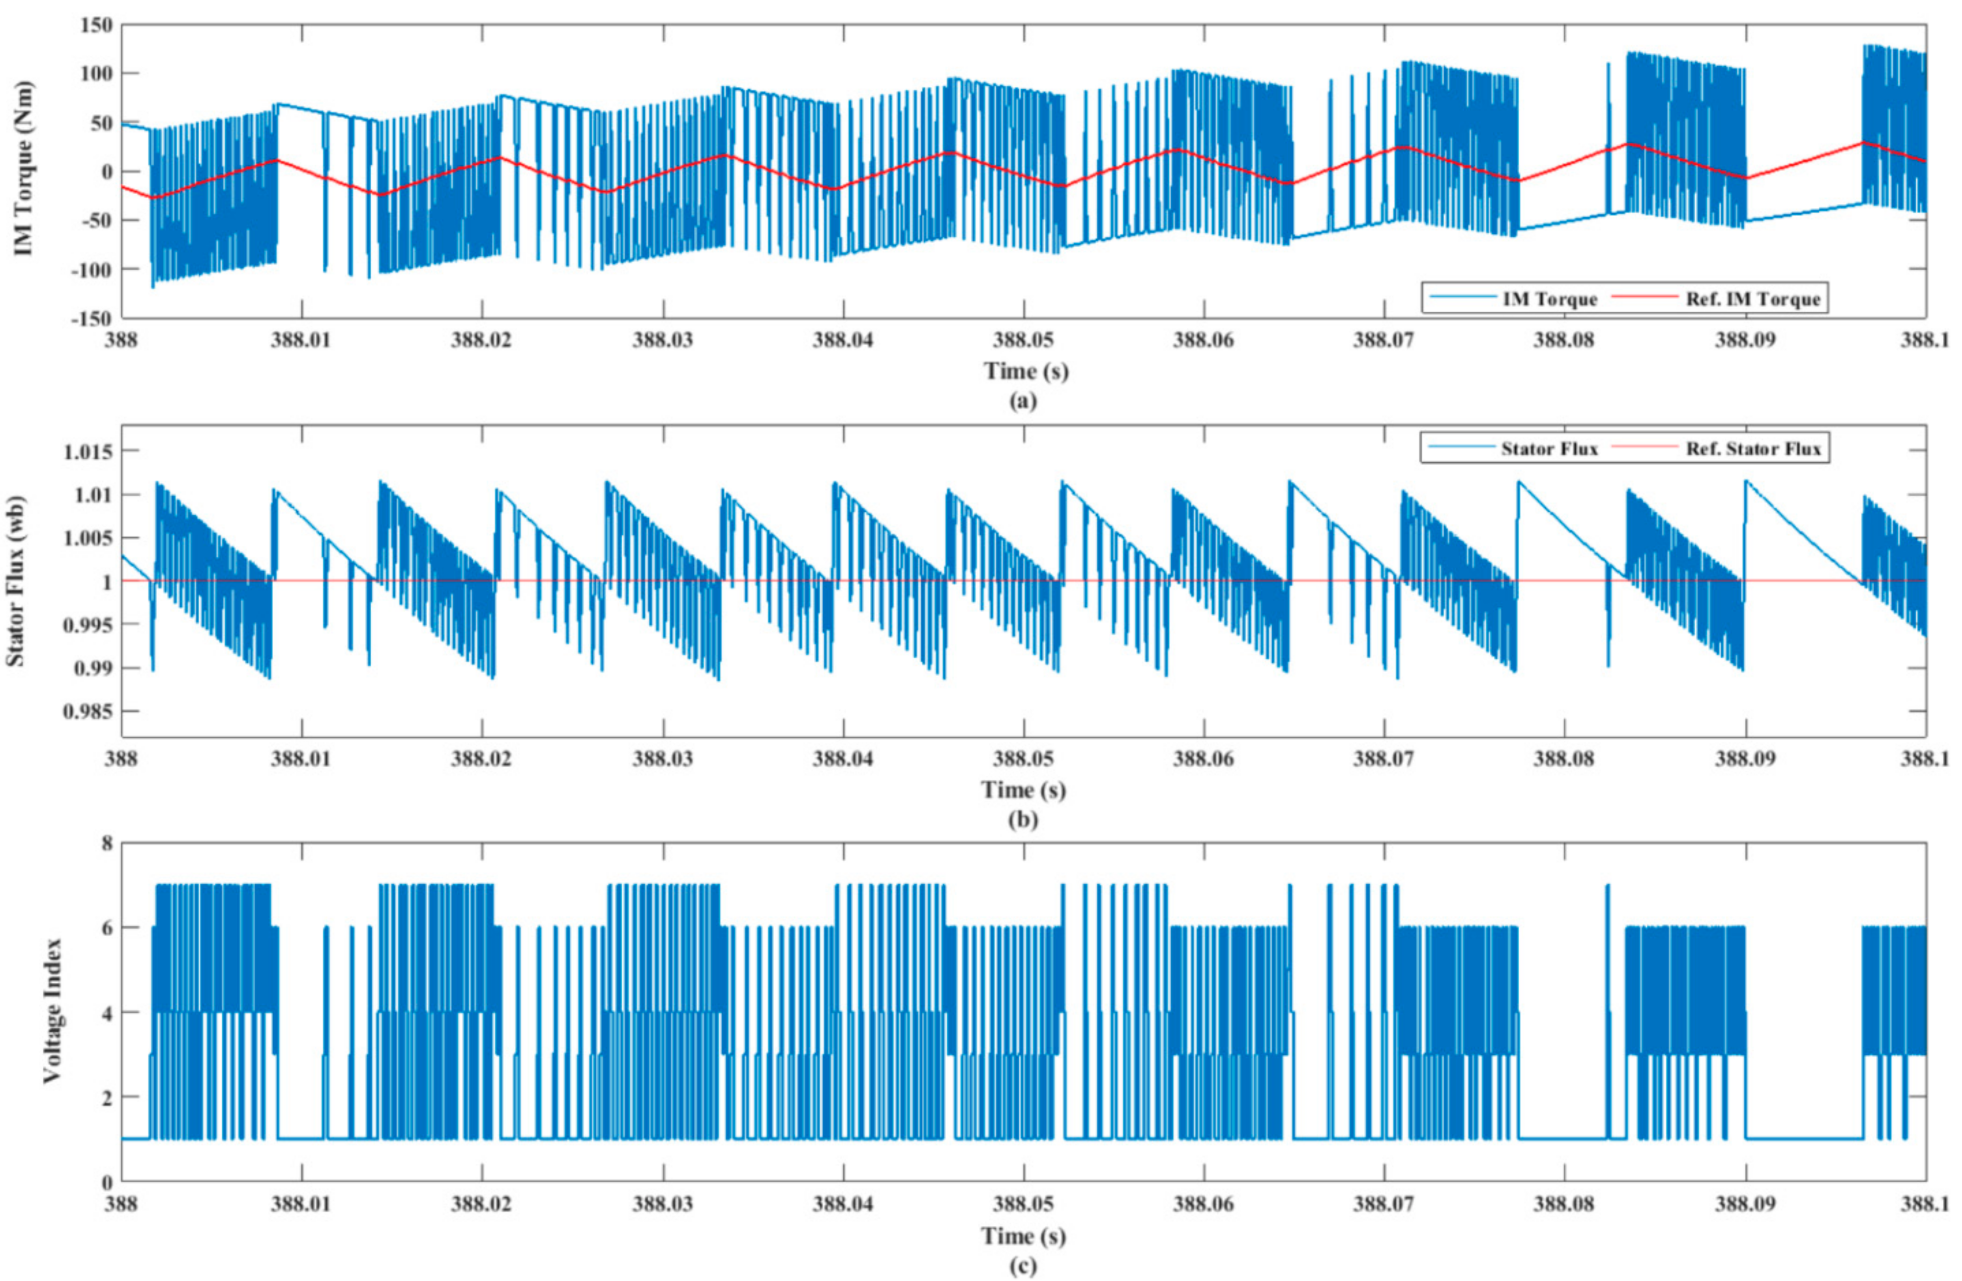
Figure 36a–c illustrate the control action taken under the PVC technique through presenting the variation of the developed IM torque and stator flux with regard to the change in the applied stator voltage vector which is illustrated as a voltage index variation.
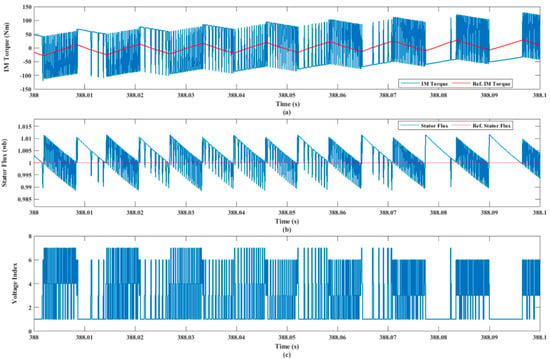
Figure 36.
The control action taken under the PVC technique: (a) IM torque deviation; (b) stator flux deviation; (c) voltage index.
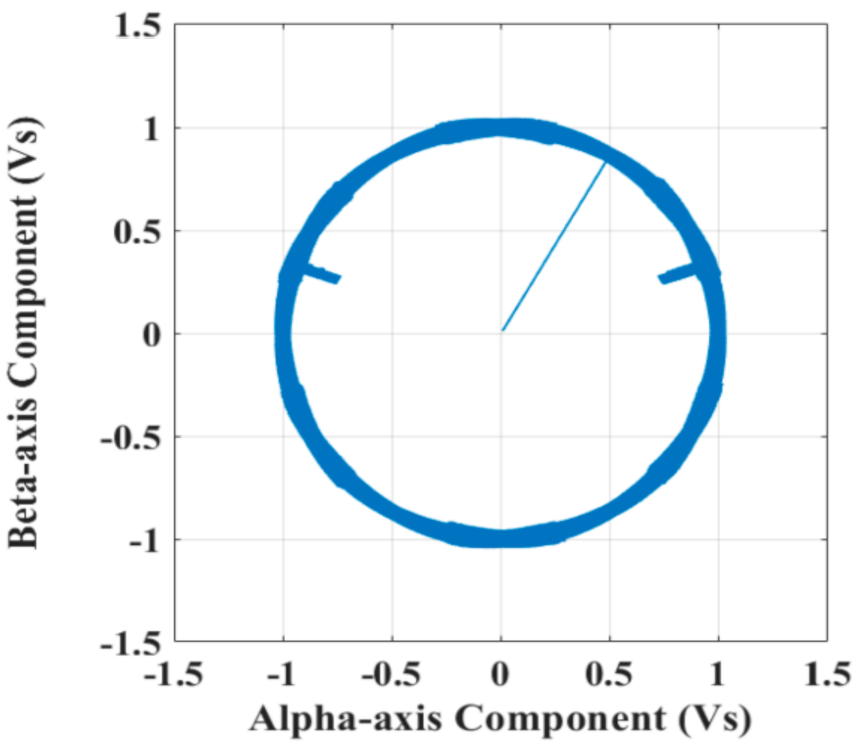
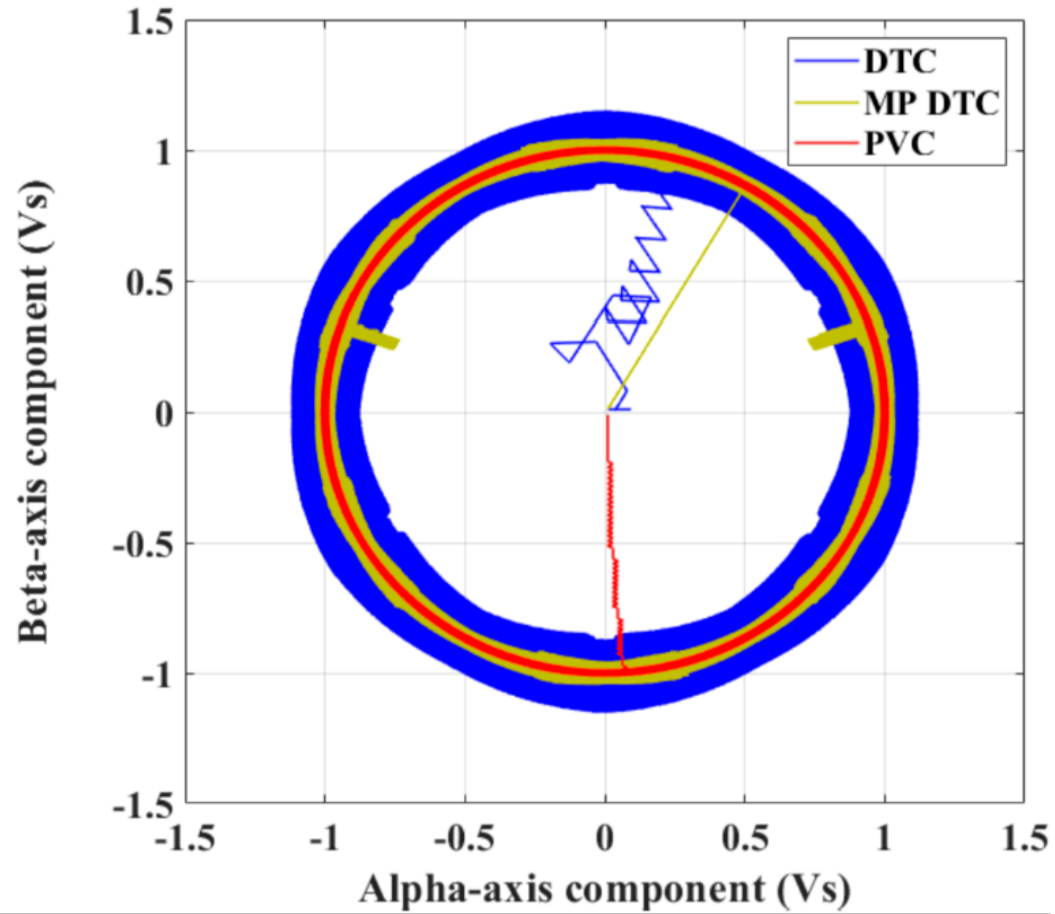
Figure 37 and Figure 38 show the α–β stator current components and their FFT spectrum under the PVC technique, respectively. The FFT analysis for the stator current’s α–β components showed a total harmonic distortion (THD) of 0.5% and 0.63% of the fundamental values, respectively. The stator current’s components presented the smallest harmonic content compared with other control techniques. Figure 39 shows the stator flux loci which verifies the fact that the PVC presents the smallest harmonic content.

Figure 37.
Stator current under the PVC technique: (a) alpha-axis stator current component; (b) beta-axis stator current component.
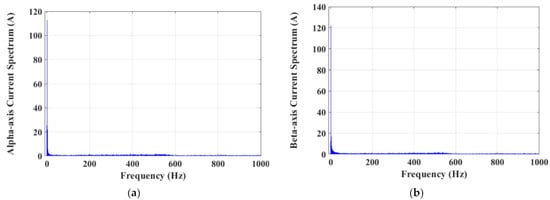
Figure 38.
Stator current spectrum under the PVC technique: (a) alpha-axis stator current spectrum; (b) beta-axis stator current spectrum.
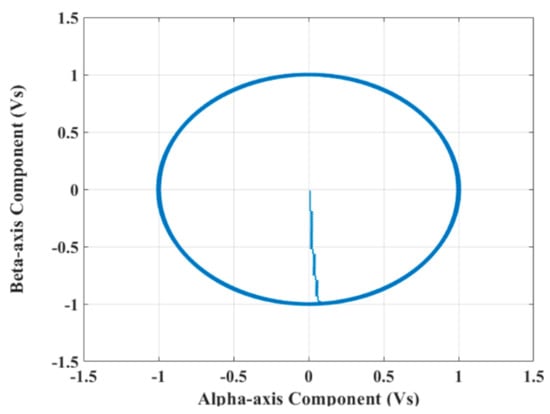
Figure 39.
Stator flux loci under the PVC technique.
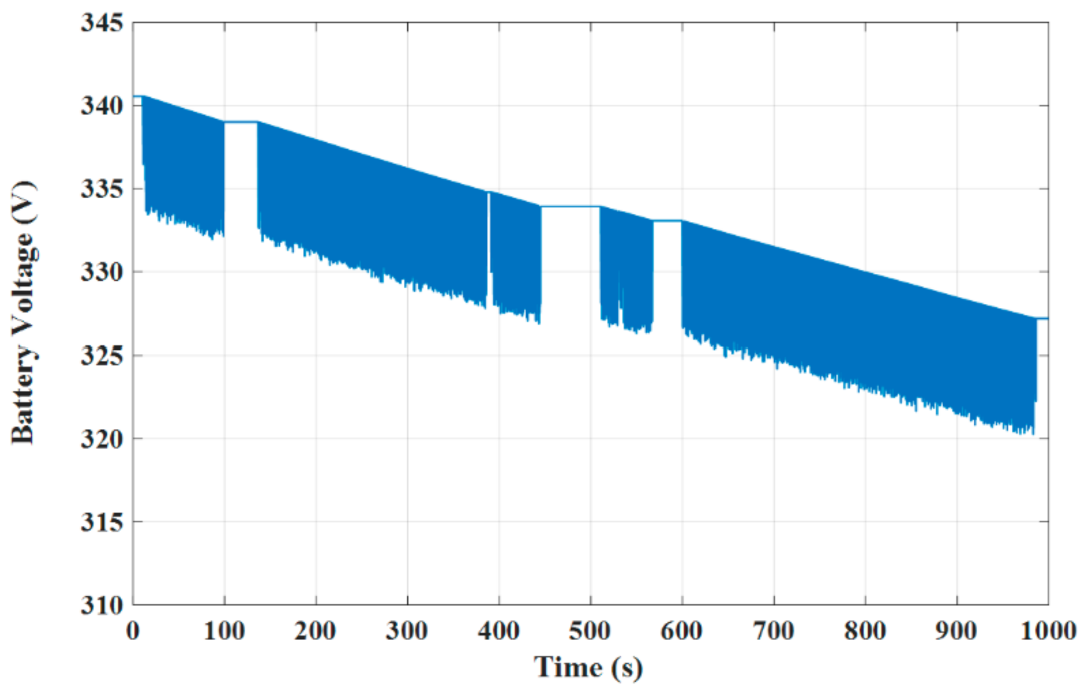
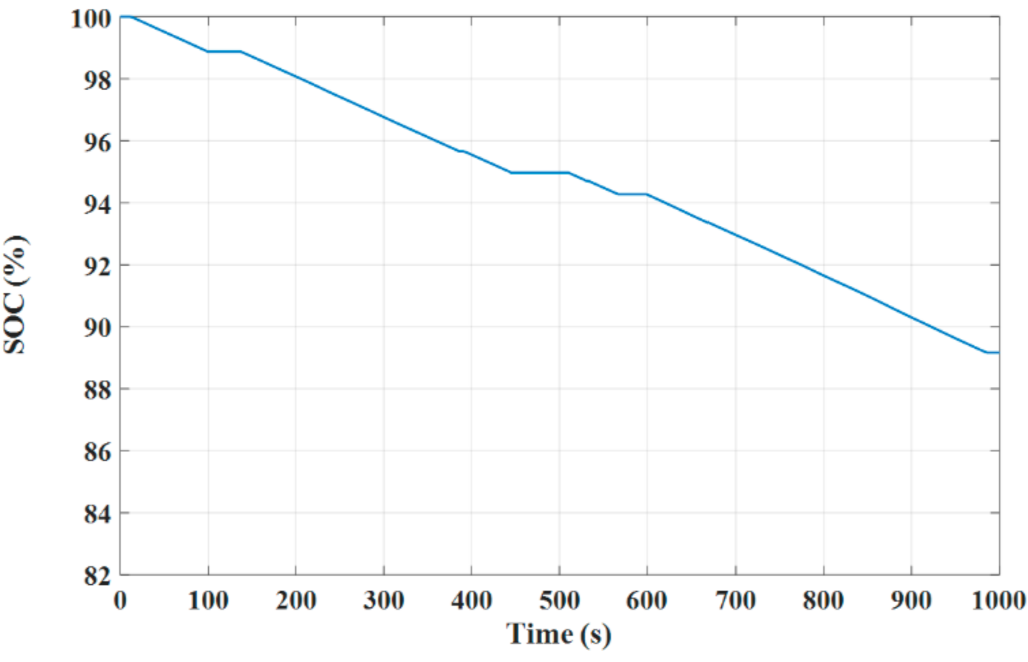
The battery terminal voltage under the PVC method is presented in Figure 40, verifying the fact that PVC allows the smallest terminal voltage variation. Figure 41 illustrates the battery SOC under the PVC technique, showing the smallest amount of discharge.
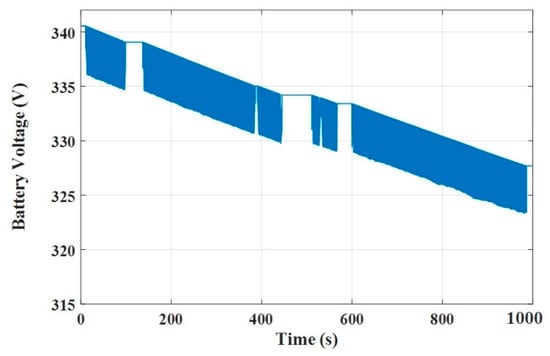
Figure 40.
The battery terminal voltage under the PVC technique.
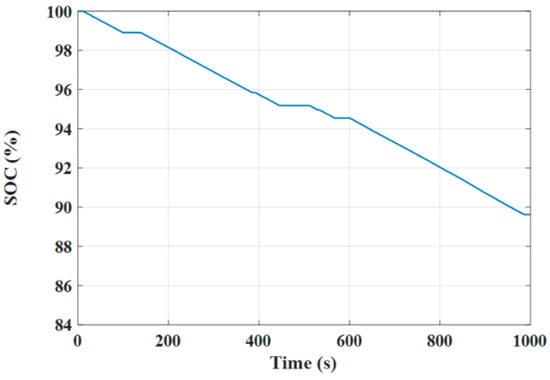
Figure 41.
The battery SOC under the PVC technique.
4.4. Comparison between Different Control Techniques
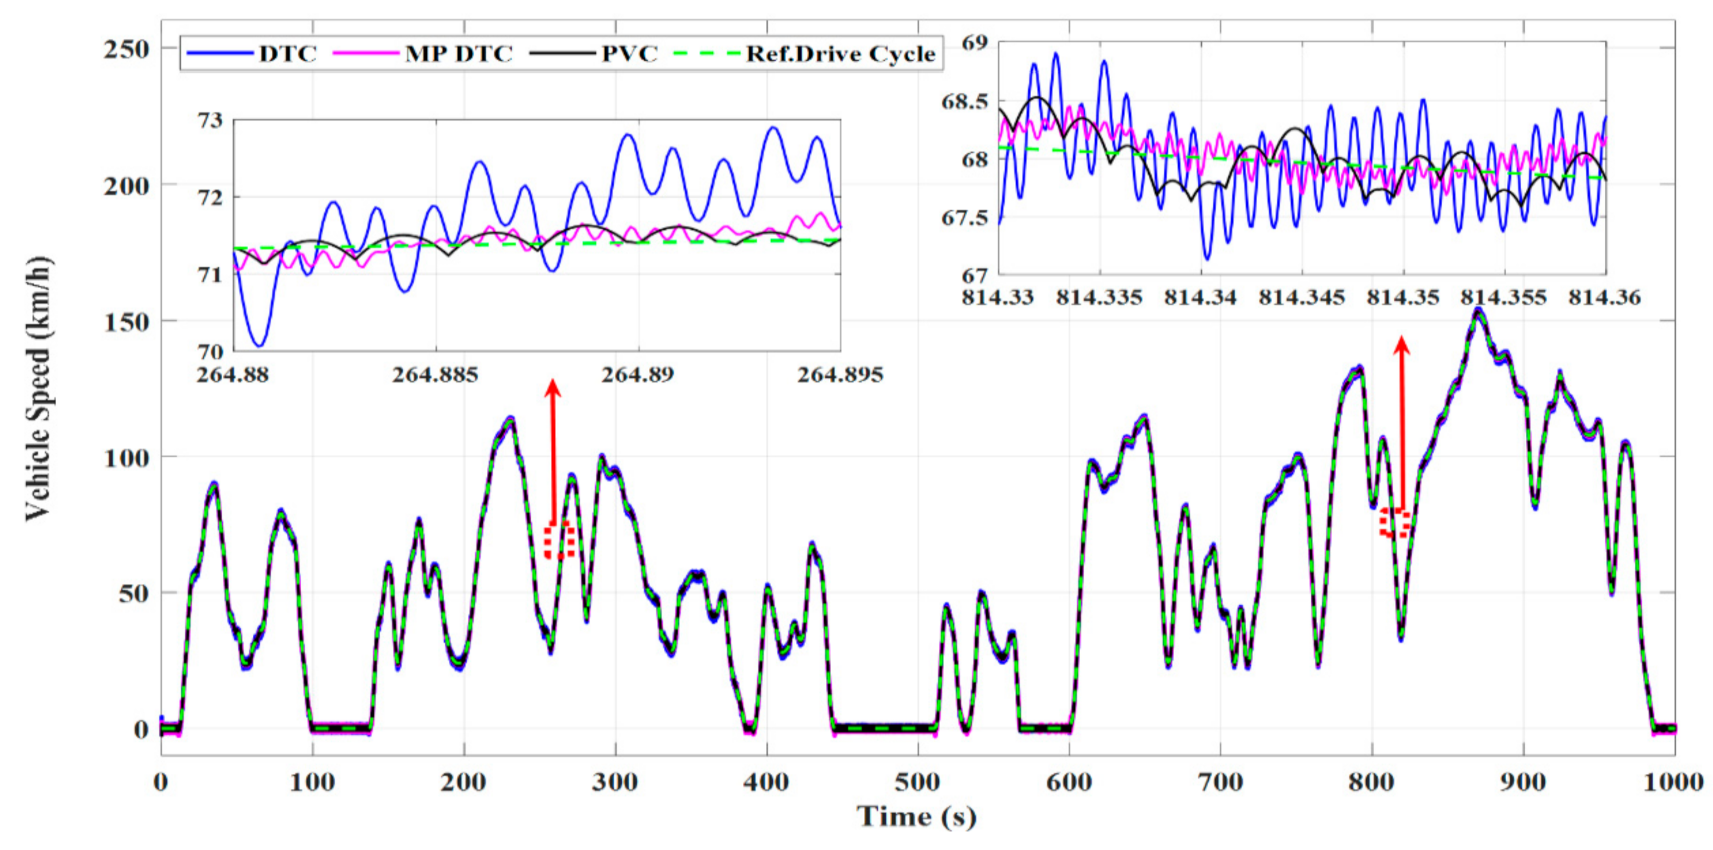
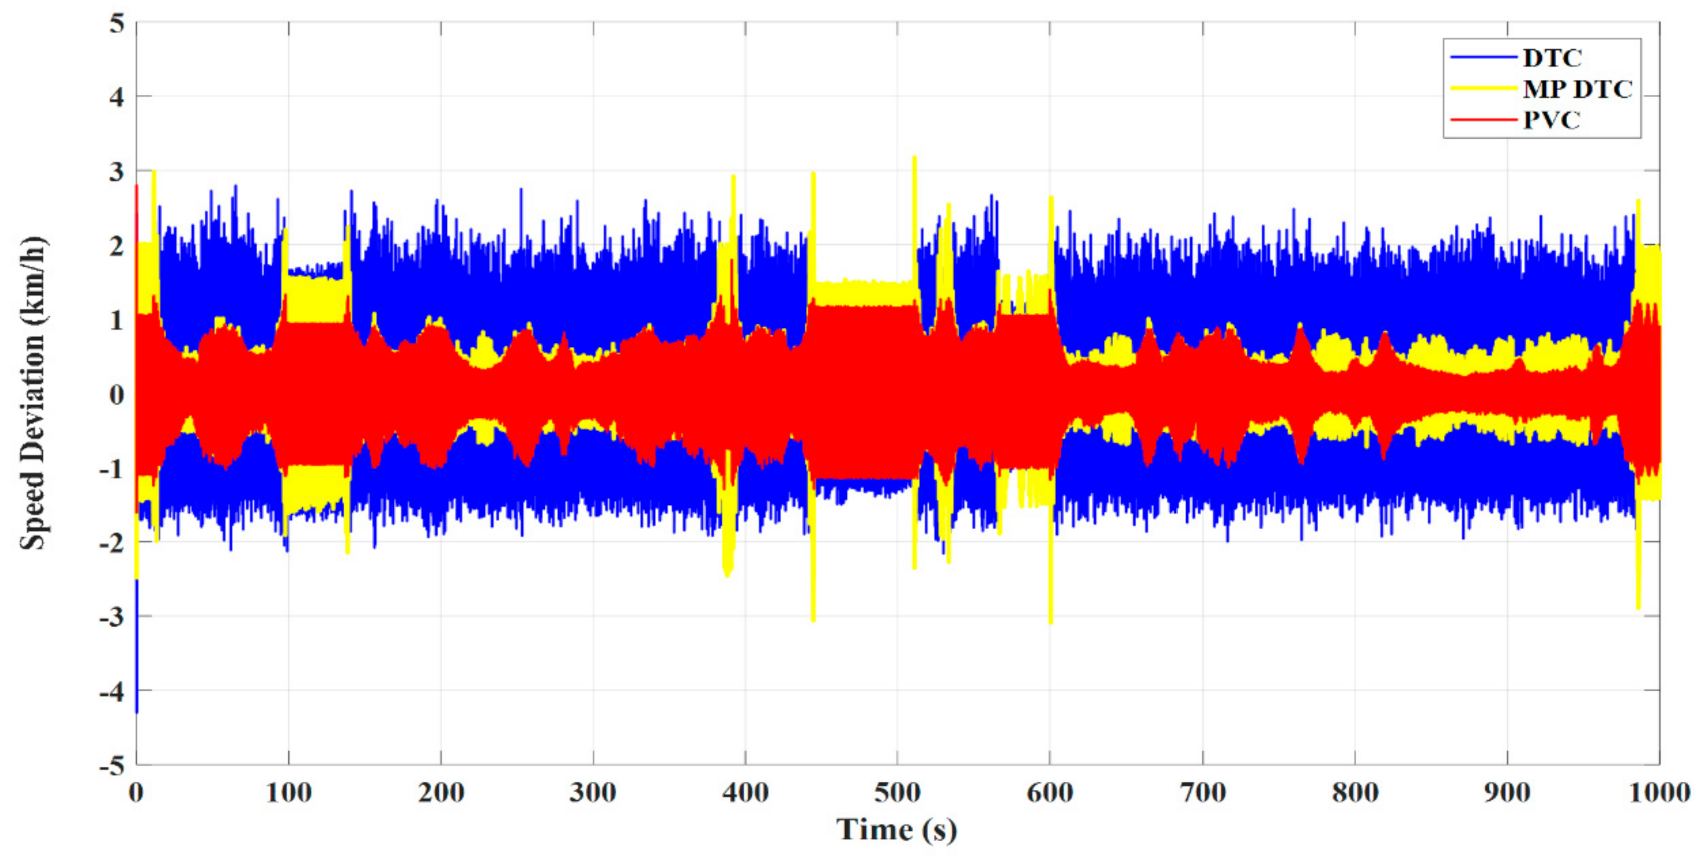
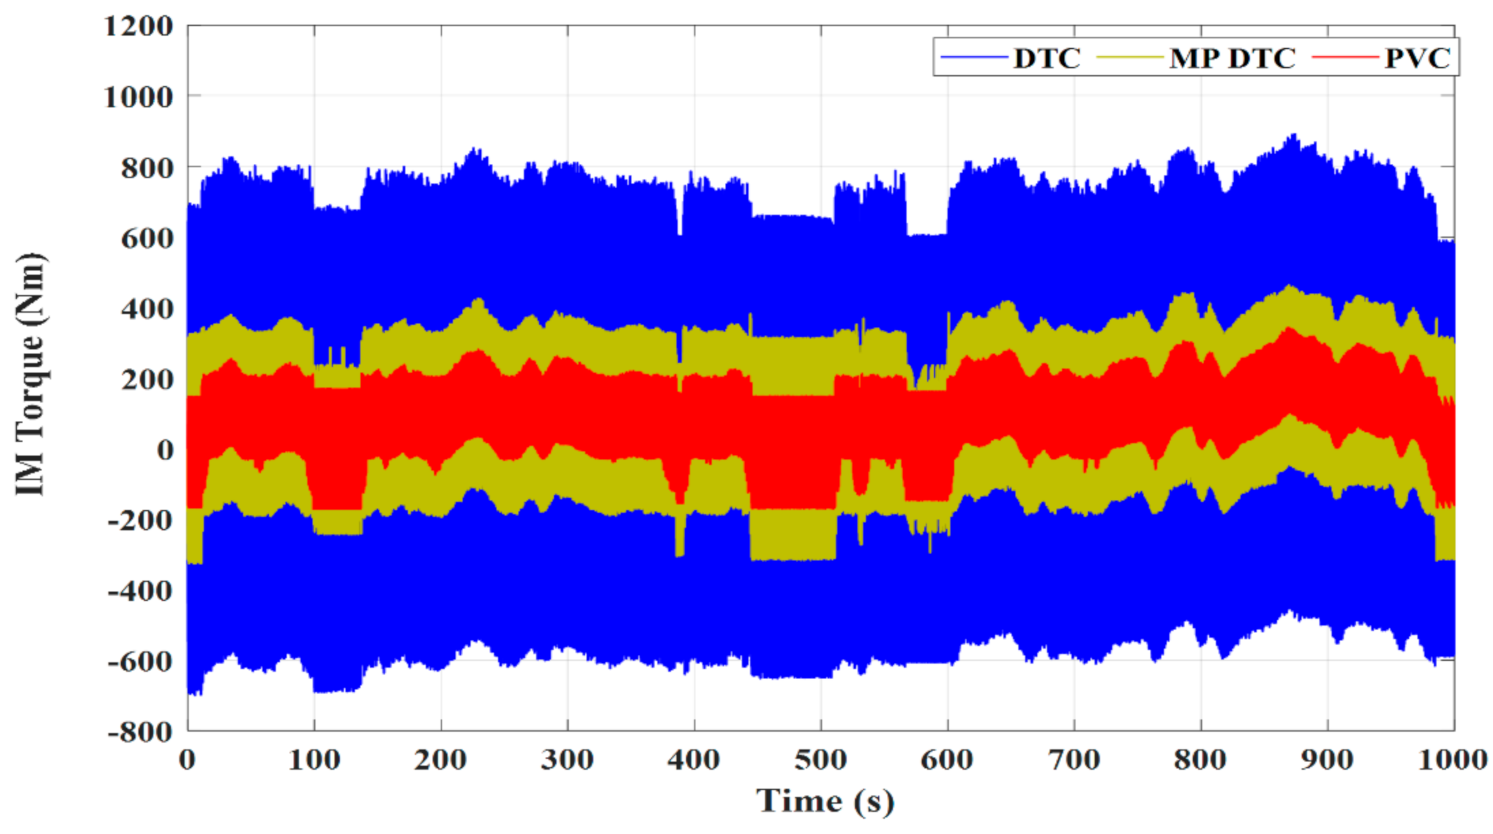
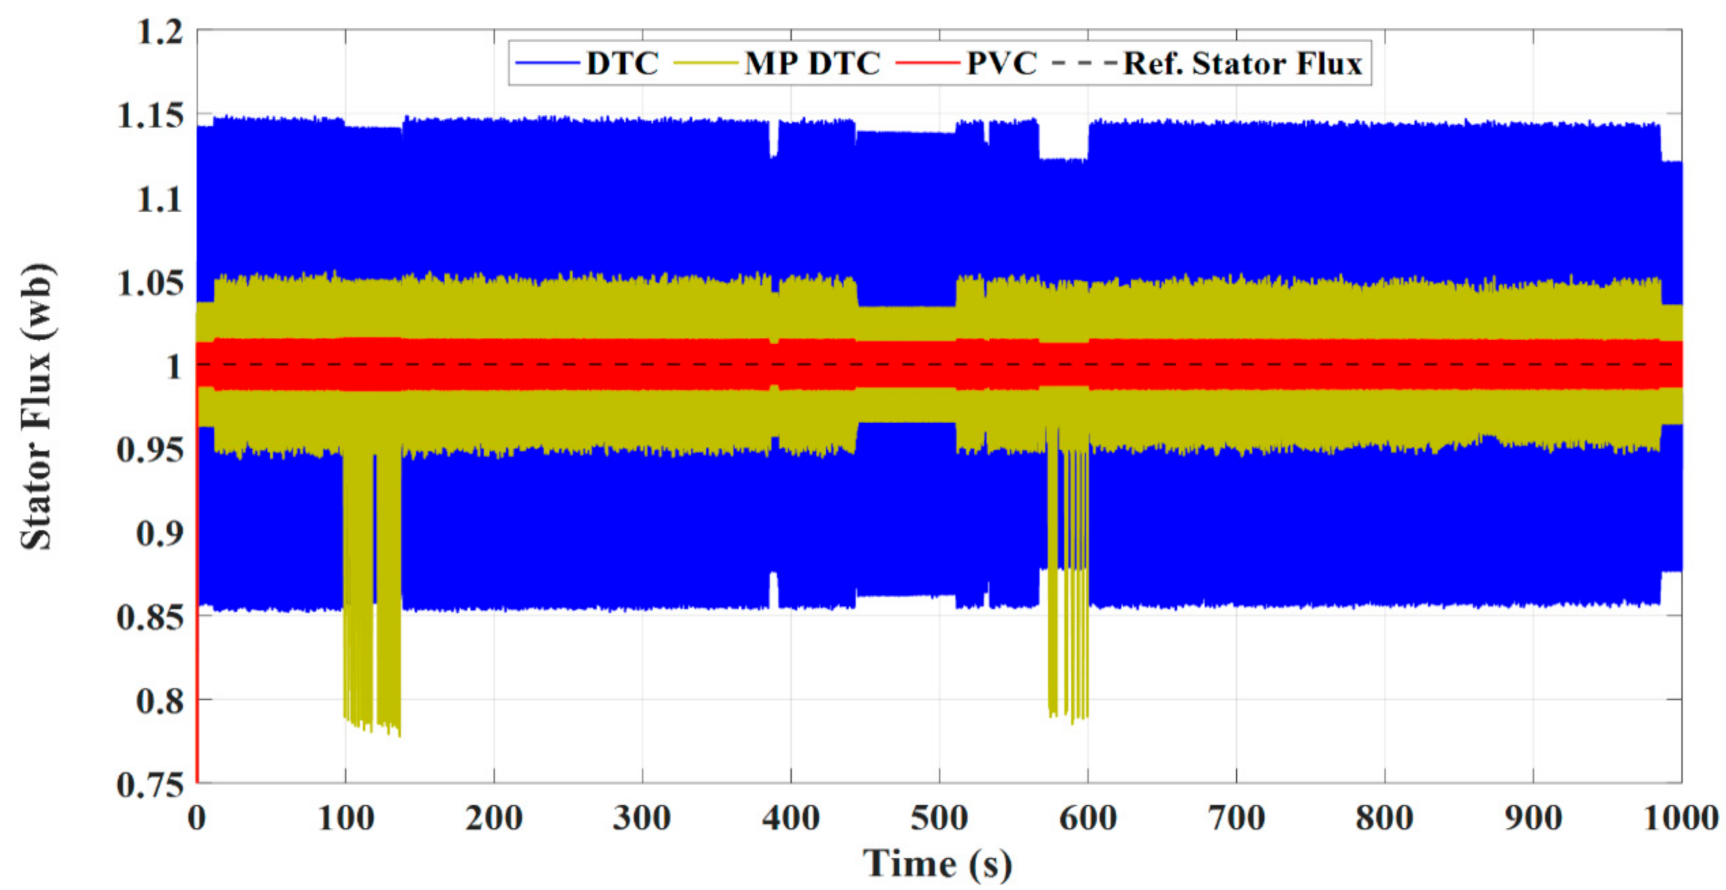
In this subsection, a comparative study between the presented control techniques is performed in order to find the most appropriate control method. Figure 42 illustrates the EV speed using different control methods, reporting a faster dynamic response under PVC than MP DTC and DTC. Moreover, the minimum speed deviation from the reference WLTP (class 3) driving cycle was obtained when adopting the PVC method as illustrated in Figure 43. The developed IM torque is presented in Figure 44, which indicates the smallest torque ripple under PVC compared to other techniques. Figure 45 presents the stator flux of the IM in the EV system under different control methods, reporting that the best dynamic performance was obtained using the PVC method.
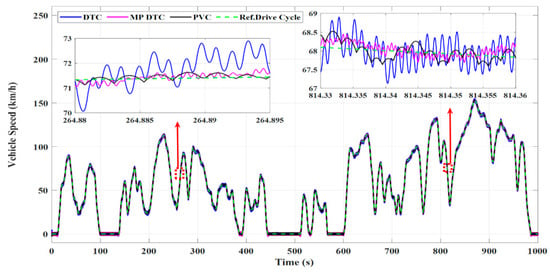
Figure 42.
EV speed under different control techniques with the WLTP (class 3) reference drive cycle.
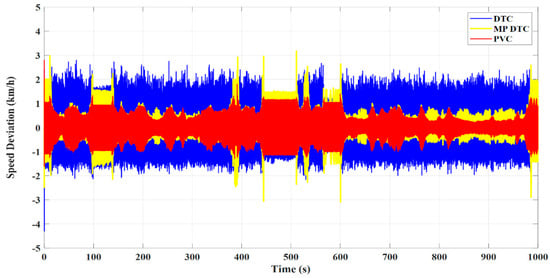
Figure 43.
EV speed deviation under different control techniques with the WLTP (class 3) reference drive cycle.
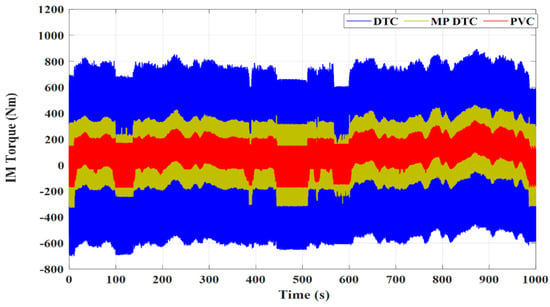
Figure 44.
The IM developed torque under different control techniques.
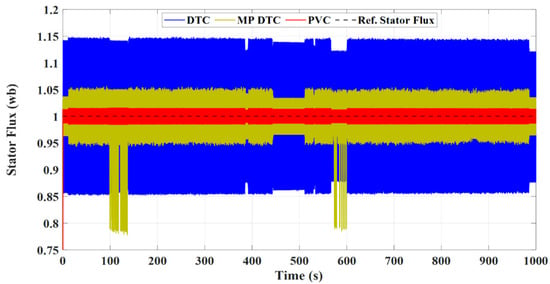
Figure 45.
The stator flux under different control techniques.
The aberration of the stator flux modulus from its reference was taken also as an indicator of the superiority of a given controller over the others, and this is illustrated in Table 2 which shows that the PVC had minimum flux ripples compared to the DTC and MP DTC schemes.

Table 2.
Comparison of the three controllers in terms of stator flux deviation (ripples).
An analytical comparison can be also performed by identifying the THD values of the alpha–beta stator current components as addressed in Table 3. It can be realized that the PVC technique had the minimum THD for the stator current’s α–β components compared to the other methods. The superiority of the PVC over the DTC and MP DTC approaches can be also verified by the stator flux loci presented in Figure 46.

Table 3.
Comparison between the three controllers in terms of THD of the stator current’s α–β components (percentage of the fundamental).
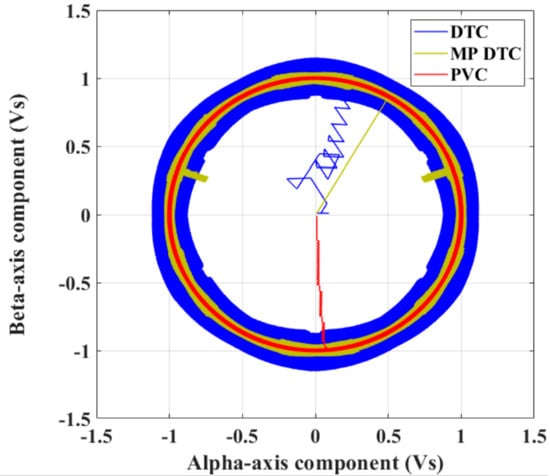
Figure 46.
Stator flux loci under the different control techniques.
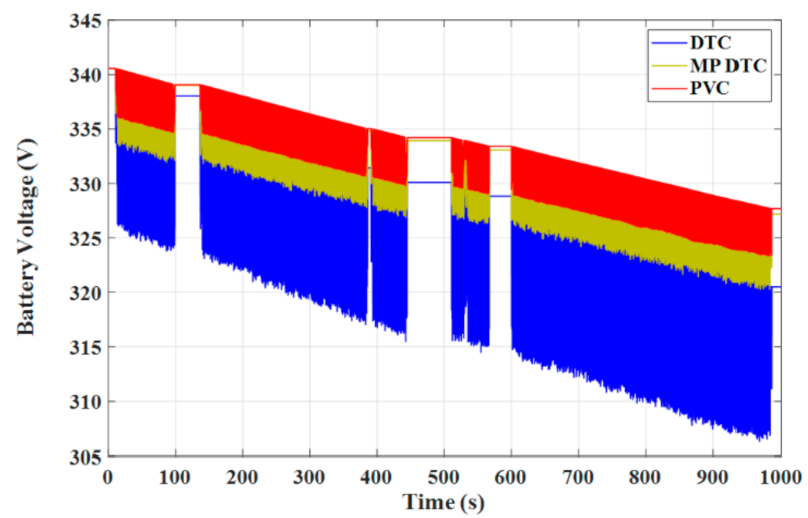
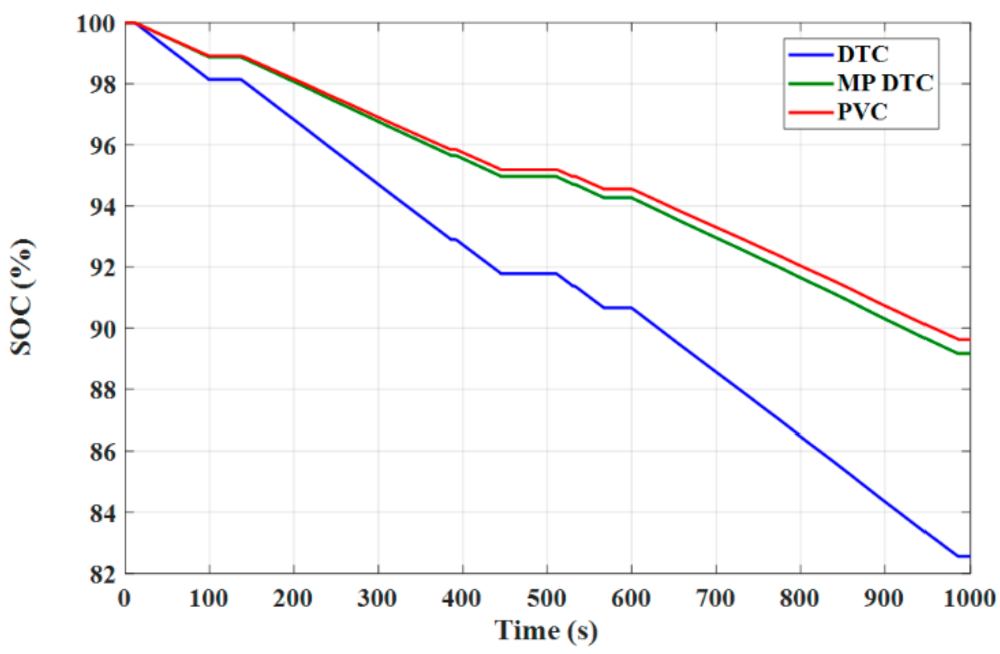
Figure 47 illustrates that the smallest battery stack terminal voltage variation was under the PVC technique. In addition, Figure 48 indicates that the EV system under the PVC technique had the lowest rate of battery discharging, presenting a longer distance that could be travelled with this EV compared to both the DTC and MP DTC.
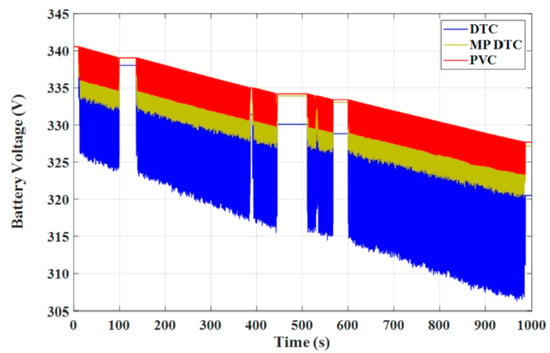
Figure 47.
The battery terminal voltage under the different control techniques.
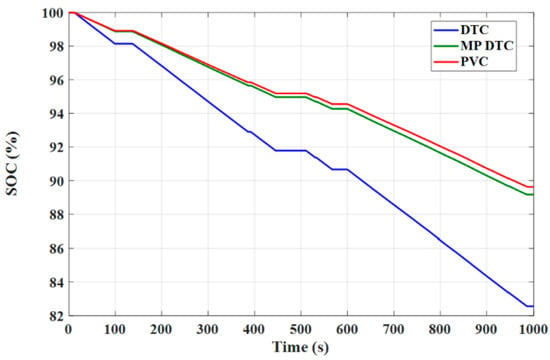
Figure 48.
The battery SOC under the different control techniques.
5. Conclusions
This paper presented the models for each element in the EV system that enabled the study of its dynamics. Three different control techniques were analyzed and adapted to manage the dynamics of an IM drive used in an EV system. The electric dynamic performance of the EV system was evaluated under DTC, MP DTC, and PVC methods. A comparative study was illustrated between these control methods to outline the most appropriate control strategy. The obtained results confirm and emphasize that the PVC has superiority over both the DTC and MP DTC controls. Finally, the following can be elaborated:
- The theoretical base of the DTC, MP DTC and PVC control techniques applied to an EV system were presented;
- A comparative study between the control techniques was presented to set the best IM drive technique;
- The dynamic performance of an IM as a part of an EV under the DTC approach was plagued by excessive ripples in both torque and flux, slow dynamic performance, and bad speed deviation;
- The advantages of the PVC are illustrated in the concepts of lower torque and flux ripples, lower speed deviation, lower THD in stator currents, faster dynamic response, smaller battery stack terminal voltage variation, and lower consumption of battery power, reporting a longer distance that can be travelled by the EV under the PVC compared to both the MP DTC and DTC.
Author Contributions
Conceptualization, M.A.M., M.R.M.H. and G.M.D.; methodology, M.A.M., M.R.M.H. and G.M.D.; software, M.A.M. and M.R.M.H.; validation, M.A.M. and G.M.D.; formal analysis, M.A.M. and M.R.M.H.; investigation, M.A.M., M.R.M.H. and G.M.D.; resources, M.A.M. and M.R.M.H.; data curation, M.R.M.H. and M.A.M.; writing—original draft preparation, M.R.M.H. and M.A.M.; writing—review and editing, M.A.M. and G.M.D.; visualization, M.A.M. and G.M.D.; supervision, M.A.M. and G.M.D.; project administration, M.A.M. and G.M.D.; funding acquisition, M.A.M. All authors have read and agreed to the published version of the manuscript.
Funding
This research received no external funding.
Data Availability Statement
The data presented in this study are available upon request from the corresponding author.
Conflicts of Interest
The authors declare no conflict of interest.
Nomenclature
| Aerodynamics drag force | IM rotor side resistance | ||
| Rolling resistance force | IM rotor side inductance | ||
| Force due to the slope | IM rotor voltage vector | ||
| Force due to the bearing friction | IM rotor current vector | ||
| Acceleration force | IM rotor flux vector | ||
| Mass of the vehicle | IM number of pair poles | ||
| Vehicle speed | IM rotor angular speed | ||
| Angle of the slope | IM angular speed of the arbitrary reference frame | ||
| Tractive force | Battery open circuit voltage | ||
| Air density | Battery constant voltage (V) | ||
| Aerodynamic drag coefficient | Battery polarization constant (V) | ||
| Frontal area of the vehicle | Battery capacity (Ah) | ||
| Wind speed on the vehicle’s moving direction | Battery discharging current | ||
| Coefficient of rolling resistance | Battery exponential zone amplitude (V) | ||
| Gravity acceleration | Battery exponential zone time constant inverse () | ||
| Bearing friction coefficient | Internal resistance of the battery | ||
| Vehicle wheel radius | The inverter output voltage applied to the motor | ||
| Rotation speed of the vehicle’s wheel | IM α-axis stator flux | ||
| Equivalent mass of the vehicle | IM α-axis stator voltage | ||
| Wheel inertia | IM α-axis stator current | ||
| Total angular inertia | IM β -axis stator flux | ||
| Total rotating inertia | IM β -axis stator voltage | ||
| , | The gear ratios of transmission and final drive | IM β -axis stator current | |
| IM stator resistance | IM direct component of the stator flux in synchronous reference frame | ||
| IM stator inductance | IM quadrature component of the stator flux in synchronous reference frame | ||
| IM stator voltage vector | IM direct component of the rotor current in synchronous reference frame | ||
| IM stator current vector | IM quadrature component of the rotor current in synchronous reference frame | ||
| IM stator flux vector |
Appendix A
The parameters of both the EV and IM under tests are expressed in Table A1 and Table A2, respectively. In Table A3, the parameters that needed to be set for the different control strategies are presented and the parameters need to be set for the control strategies are presented in Table A4.

Table A1.
Electric vehicle’s parameters.
Table A1.
Electric vehicle’s parameters.
| Parameter | Symbol | Value |
|---|---|---|
| Vehicle mass | 1645 kg | |
| Wheel radius | 0.315 m | |
| Rolling resistance coefficient | 0.0083 | |
| Air density | ρ | 1.225 kg/m3 |
| Aerodynamic coefficient | 0.46 | |
| Gear box efficiency | 0.96 | |
| Gear box ratio | G | 10 |
| Wind speed | 10 m/s | |
| Front area | 3 m2 | |
| Gravity | g | 9.81 m2 |
| Bearing friction coefficient | 0.001 | |
| Gradient slope | 5 degrees |

Table A2.
The IM’s parameters.
Table A2.
The IM’s parameters.
| Parameter | Value |
|---|---|
| Rated power | 215 hp |
| Rated voltage | 400 V |
| Frequency | 50 Hz |
| Pole pairs | 2 |
| Base speed | 1487 rpm |
| 0.01379 Ω | |
| 0.007728 Ω | |
| 7.842 mH | |
| 7.842 mH | |
| 7.69 mH | |
| Rated torque | 1027 N.m |
| Rated flux | 1 wb |
| Inertia J | 2.9 kg.m2 |

Table A3.
The EV’s battery’s parameters.
Table A3.
The EV’s battery’s parameters.
| Parameter | Symbol | Value |
|---|---|---|
| Battery constant voltage | 280 V | |
| Battery polarization constant | 0.05 V | |
| Battery capacity | 50 Ah | |
| Battery exponential zone amplitude | 60.6 V | |
| Battery exponential zone timeconstant inverse | ||
| Internal resistance of the battery | 0.097 Ω |

Table A4.
The parameters needed to be set for the control strategies.
Table A4.
The parameters needed to be set for the control strategies.
| Parameter | Value |
|---|---|
| Sampling period | 100 µs |
| Speed controller proportional gain () | 257.6 |
| Speed controller integral gain () | 22,890 |
| Reference flux | 1 wb |
| IM torque limits | Nm |
| DTC two level hysteresis flux comparator bands | wb |
| DTC three level hysteresis torque comparator bands | () Nm |
| (Weighting factor) of MP DTC for IM drive | 2300 |
References
- Chan, C.C.; Bouscayrol, A.; Chen, K.Y. Electric, Hybrid, and Fuel-Cell Vehicles: Architectures and Modeling. IEEE Trans. Veh. Technol. 2010, 59, 589–598. (In English) [Google Scholar] [CrossRef]
- Neacsu, D.O.; Rajashekara, K. Comparative analysis of torque-controlled IM drives with applications in electric and hybrid vehicles. IEEE Trans. Power Electron. 2001, 16, 240–247. (In English) [Google Scholar] [CrossRef]
- Singh, B.; Jain, P.; Mittal, A.; Gupta, J. Speed sensorless electric vehicle propulsion system using DTC IM drive. In Proceedings of the IEEE 2006 India International Conference on Power Electronics, Chennai, India, 19–21 December 2006; pp. 7–11. [Google Scholar]
- Trzynadlowski, A.M. 4—Power electronic converters for induction motor drives. In Control of Induction Motors; Trzynadlowski, A.M., Ed.; Academic Press: San Diego, CA, USA, 2001; pp. 55–92. [Google Scholar]
- Wang, Y.; Zhao, K.Q. Field-oriented vector control of induction motor for electric vehicles. In Proceedings of the Iecon 2005: Thirty-First Annual Conference of the IEEE Industrial Electronics Society, Raleigh, NC, USA, 6–10 November 2005; Franquelo, L.G., Malinowski, A., Chow, M.Y., Hess, H.L., Eds.; IEEE Industrial Electronics Society: New York, NY, USA, 2005; Volumes 1–3, pp. 1610–1614. [Google Scholar]
- Öztürk, T.; Aktaş, M. Research on Control Strategy and Energy Consumption for Electric Vehicles. IFAC Proc. Vol. 2013, 46, 444–449. [Google Scholar] [CrossRef]
- Qinglong, W.; Changzhou, Y.; Shuying, Y. Indirect Field Oriented Control Technology for Asynchronous Motor of Electric Vehicle. In Proceedings of the 2020 IEEE International Conference on Power, Intelligent Computing and Systems (ICPICS), Shenyang, China, 28–30 July 2020; pp. 673–677. [Google Scholar]
- Takahashi, I.; Noguchi, T. A New Quick-Response and High-Efficiency Control Strategy of an Induction Motor. IEEE Trans. Ind. Appl. 1986, IA-22, 820–827. (In English) [Google Scholar] [CrossRef]
- Jun-Koo, K.; Seung-Ki, S. New direct torque control of induction motor for minimum torque ripple and constant switching frequency. IEEE Trans. Ind. Appl. 1999, 35, 1076–1082. (In English) [Google Scholar] [CrossRef]
- Khoucha, F.; Marouani, K.; Kheloui, A.; Benbouzid, M. A minimization of speed ripple of sensorless DTC for controlled induction motors used in electric vehicles. In Proceedings of the IEEE IECON 2006-32nd Annual Conference on IEEE Industrial Electronics, Paris, France, 7–10 November 2006; pp. 1339–1344. [Google Scholar]
- Lascu, C.; Boldea, I.; Blaabjerg, F. Variable-Structure Direct Torque Control—A Class of Fast and Robust Controllers for Induction Machine Drives. IEEE Trans. Ind. Electron. 2004, 51, 785–792. (In English) [Google Scholar] [CrossRef]
- Raj, A.; Sharma, R. Improved Direct Torque Control for Induction Motor in Electric Vehicle Application. In Proceedings of the 2018 IEEE 8th Power India International Conference (PIICON), Kurukshetra, India, 10–12 December 2018; pp. 1–5. [Google Scholar]
- Haddoun, A.; Benbouzid, M.; Diallo, D.; Abdessemed, R.; Ghouili, J.; Srairi, K. Comparative analysis of control techniques for efficiency improvement in electric vehicles. In Proceedings of the 2007 IEEE Vehicle Power and Propulsion Conference, Arlington, TX, USA, 9–12 September 2007; pp. 629–634. [Google Scholar]
- Tang, Q.; Ge, X.; Liu, Y.-C.; Hou, M. Improved switching-table-based DTC strategy for the post-fault three-level NPC inverter-fed induction motor drives. IET Electr. Power Appl. 2018, 12, 71–80. [Google Scholar] [CrossRef]
- Wu, X.; Huang, W.; Lin, X.; Jiang, W.; Zhao, Y.; Zhu, S. Direct Torque Control for Induction Motors Based on Minimum Voltage Vector Error. IEEE Trans. Ind. Electron. 2021, 68, 3794–3804. [Google Scholar] [CrossRef]
- Zhang, Y.; Xia, B.; Yang, H.; Rodriguez, J. Overview of model predictive control for induction motor drives. Chin. J. Electr. Eng. 2016, 2, 62–76. [Google Scholar]
- Rodriguez, J.; Cortes, P. Predictive Control of Power Converters and Electrical Drives; John Wiley & Sons: Hoboken, NJ, USA, 2012. [Google Scholar]
- Wang, F.; Li, S.; Mei, X.; Xie, W.; Rodríguez, J.; Kennel, R.M. Model-Based Predictive Direct Control Strategies for Electrical Drives: An Experimental Evaluation of PTC and PCC Methods. IEEE Trans. Ind. Inform. 2015, 11, 671–681. [Google Scholar] [CrossRef]
- Mamdouh, M.; Abido, M.A. Efficient Predictive Torque Control for Induction Motor Drive. IEEE Trans. Ind. Electron. 2019, 66, 6757–6767. [Google Scholar] [CrossRef]
- Su, J.; Gao, R.; Husain, I. Model Predictive Control Based Field-Weakening Strategy for Traction EV Used Induction Motor. IEEE Trans. Ind. Appl. 2018, 54, 2295–2305. [Google Scholar] [CrossRef]
- Zhang, Y.; Yang, H. Model Predictive Torque Control of Induction Motor Drives With Optimal Duty Cycle Control. IEEE Trans. Power Electron. 2014, 29, 6593–6603. [Google Scholar] [CrossRef]
- Mossa, M.A.; Bolognani, S. Model Predictive Phase Angle Control for an Induction Motor Drive. In Proceedings of the IEEE 2018 Twentieth International Middle East Power Systems Conference (MEPCON), Cairo, Egypt, 18–20 December 2018; pp. 128–134. [Google Scholar]
- Ahmed, A.A.; Koh, B.K.; Lee, Y.I. Torque Control of Induction Motors with Minimal Ripples Based on Continuous Control Set-MPC in a Wide Speed Range. In Proceedings of the 2017 IEEE Vehicle Power and Propulsion Conference (VPPC), Belfort, France, 11–14 December 2017; pp. 1–6. [Google Scholar]
- Lakhimsetty, S.; Somasekhar, V.T. A Four-Level Open-End Winding Induction Motor Drive With a Nested Rectifier–Inverter Combination With Two DC Power Supplies. IEEE Trans. Power Electron. 2019, 34, 8894–8904. [Google Scholar] [CrossRef]
- Xia, C.; Liu, T.; Shi, T.; Song, Z. A Simplified Finite-Control-Set Model-Predictive Control for Power Converters. IEEE Trans. Ind. Inform. 2014, 10, 991–1002. [Google Scholar]
- Siami, M.; Khaburi, D.A.; Rodriguez, J. Simplified Finite Control Set-Model Predictive Control for Matrix Converter-Fed PMSM Drives. IEEE Trans. Power Electron. 2018, 33, 2438–2446. [Google Scholar] [CrossRef]
- Mossa, M.A.; Kamel, O.M.; Bolognani, S. Explicit Predictive Voltage Control for an Induction Motor Drive. In Proceedings of the IEEE 2019 21st International Middle East Power Systems Conference (MEPCON), Cairo, Egypt, 17–19 December 2019; pp. 258–264. [Google Scholar]
- Mossa, M.A.; Echeikh, H.; Quynh, N.V. A Novel Sensorless Predictive Voltage Control for an Induction Motor Drive Based on a Back-Stepping Observer-Experimental Validation. IEEE Access 2021, 9, 11921–11942. [Google Scholar] [CrossRef]
- Mossa, M.A.; Quynh, N.V.; Echeikh, H.; Do, T.D. Deadbeat-Based Model Predictive Voltage Control for a Sensorless Five-Phase Induction Motor Drive. Math. Probl. Eng. 2020, 2020, 4164526. [Google Scholar] [CrossRef]
- Mossa, M.A.; Do, T.D.; Al-Sumaiti, A.S.; Quynh, N.V.; Diab, A.A.Z. Effective Model Predictive Voltage Control for a Sensorless Doubly Fed Induction Generator. IEEE Can. J. Electr. Comput. Eng. 2021, 44, 50–64. [Google Scholar] [CrossRef]
- Lekshmi, S.; PS, L.P. Mathematical modeling of Electric vehicles—A survey. Control. Eng. Pract. 2019, 92, 104138. [Google Scholar]
- Nam, K.H. AC Motor Control and Electrical Vehicle Applications; CRC Press: Boca Raton, FL, USA, 2018. [Google Scholar]
- Massey, S. Modeling, simulation and control of hybrid electric vehicle drive while minimizing energy input requirements using optimized gear ratios. Master’s Thesis, Michigan Technological University, Houghton, MI, USA, 2016. [Google Scholar] [CrossRef]
- Larminie, J.; Lowry, J. Electric Vehicle Technology Explained, 2nd ed.; John Wiley & Sons: Hoboken, NJ, USA, 2012. [Google Scholar]
- Fajri, P.; Prabhala, V.A.K.; Ferdowsi, M. Emulating On-Road Operating Conditions for Electric-Drive Propulsion Systems. IEEE Trans. Energy Convers. 2016, 31, 1–11. [Google Scholar] [CrossRef]
- Ehsani, M.; Gao, Y.; Longo, S.; Ebrahimi, K. Modern Electric, Hybrid Electric, and Fuel Cell Vehicles; CRC Press: Boca Raton, FL, USA, 2018. [Google Scholar]
- Silva, M.; Goncalves, A.P.; Marques, J.; Sousa, J.; Nunes, U. Modelling an electric vehicle powertrain on bench. In Proceedings of the 2014 IEEE Vehicle Power and Propulsion Conference (VPPC), Coimbra, Portugal, 27–30 October 2014; pp. 1–6. [Google Scholar]
- Tremblay, O.; Dessaint, L.-A. Experimental Validation of a Battery Dynamic Model for EV Applications. World Electr. Veh. J. 2009, 3, 289–298. [Google Scholar] [CrossRef] [Green Version]
- Quintero-Montenegro, A.M.; Mendoza-Grosso, C.C.; Santamaría, F.; Alarcón-Villamil, J.A.J.D. Dynamic consumption representation of electric vehicles based on battery capacity. DYNA 2018, 85, 177–184. [Google Scholar] [CrossRef]
- Tsokolis, D.; Tsiakmakis, S.; Dimaratos, A.; Fontaras, G.; Pistikopoulos, P.; Ciuffo, B.; Samaras, Z. Fuel consumption and CO2 emissions of passenger cars over the New Worldwide Harmonized Test Protocol. Appl. Energy 2016, 179, 1152–1165. [Google Scholar] [CrossRef]
- Abu-Rub, H.; Iqbal, A.; Guzinski, J. High Performance Control of AC Drives with MATLAB/Simulink Models; John Wiley & Sons: Hoboken, NJ, USA, 2012. [Google Scholar]
- Ahmad, M. High Performance AC Drives: Modelling Analysis and Control; Springer Science & Business Media: Berlin/Heidelberg, Germany, 2010. [Google Scholar]
- Okumus, H.I.; Aktas, M. Direct torque control of induction machine drives using adaptive hysteresis band for constant switching frequency. In Proceedings of the 2007 IEEE International Electric Machines & Drives Conference, Antalya, Turkey, 3–5 May 2007; Volume 2, pp. 1762–1767. [Google Scholar]
- Mohan, N. Advanced Electric Drives: Analysis, Control, and Modeling Using MATLAB/Simulink; John Wiley & Sons: Hoboken, NJ, USA, 2014. [Google Scholar]
- Hu, H.; Zhu, J.; Guo, Y. Model predictive control of permanent magnet synchronous machine with reduced torque ripple. In Proceedings of the IEEE 2013 International Conference on Electrical Machines and Systems (ICEMS), Busan, Korea, 26–29 October 2013; pp. 1478–1482. [Google Scholar]
- Mossa, M.A.; Bolognani, S. A new formulation of model predictive direct torque control for a sensorless IM drive. In Proceedings of the IEEE 2017 Nineteenth International Middle East Power Systems Conference (MEPCON), Cairo, Egypt, 19–21 December 2017; pp. 664–670. [Google Scholar]
- Mossa, M.A.; Bolognani, S. Effective model predictive direct torque control for an induction motor drive. In Proceedings of the IEEE 2016 International Symposium on Power Electronics, Electrical Drives, Automation and Motion (SPEEDAM), Capri, Italy, 22–24 June 2016; pp. 746–754. [Google Scholar]
Publisher’s Note: MDPI stays neutral with regard to jurisdictional claims in published maps and institutional affiliations. |
© 2021 by the authors. Licensee MDPI, Basel, Switzerland. This article is an open access article distributed under the terms and conditions of the Creative Commons Attribution (CC BY) license (https://creativecommons.org/licenses/by/4.0/).

