1. Introduction
Since the year 2000, sentiment analysis is one of the most well-studied research domains in natural language processing (NLP), not in the least because of its broad application potential. Companies and organisations use it to learn more about (potential) customers or clients [
1] or to gauge their online reputation [
2]. Traditionally, sentiment analysis focused on the study of polarity with the goal of classifying textual instances as either positive or negative [
1]. However, from a company perspective, it can be more interesting to pinpoint exactly what customers are talking about: for example, if they mention a product in an online review, they can be very specific as to which aspects they liked (e.g., quality and design) and/or disliked (e.g., user-friendliness). This had led to the emergence of aspect-based sentiment analysis, which focuses on the detection of sentiment expressions on the aspect or feature level [
3].
In more recent years, the field advanced from analysing polarity to detecting more fine-grained emotions [
4]. The goal in emotion analysis is to analyse specific emotional states such as
anger,
joy and
sadness or emotional dimensions like
valence and
arousal. By studying emotions, companies get more hands-on insights into which customer responses require an immediate action. For example, understanding when a customer is clearly angry or sad is more insightful than the label
negative in the framework of customer response management or when thinking about employing chatbots for customer support. Moreover, the emotions of interest might vary regarding the application or domain.
When dealing with emotion analysis for specific applications, this leads to an important methodological issue, namely the choice of emotion framework. Many studies focus on the classification of textual utterances into basic emotion categories following the frameworks of Ekman (
anger,
disgust,
fear,
joy,
sadness and
surprise) [
5] and Plutchik (
anger,
anticipation,
disgust,
fear,
joy,
sadness,
surprise and
trust) [
6]. However, multiple researchers have emphasized the need of studying emotions not only in terms of basic emotion categories, but based on emotional dimensions like
valence,
arousal and
dominance (VAD) as well [
7,
8].
In earlier work, we have already criticized the apparent arbitrariness with which an emotion framework is chosen for studies in NLP [
9]. Mostly, a data-driven motivation or experimentally grounded choice is lacking. However, some researchers see benefits in tailoring the emotion label set to the task at hand. In the case of crisis communication, for example, it would be appropriate to employ the crisis-related emotion framework of Jin et al. [
10], as proposed by Hoste et al. [
11].
Although the emotional nuances in different label sets could be useful, tailoring these sets to specific applications or domains might introduce different challenges: (a) resources will need to be created for every specific application and domain, (b) emotion detection resources will be scattered over different frameworks, and (c) emotion detection systems will not be generalizable.
Cross-framework transfer learning methods could mitigate these challenges. Finetuning pre-trained models, multi-task learning or label space mapping methods can considerably decrease the amount of required training data, as this allows for the transfer of knowledge across divergent emotion frameworks.
A straight-forward approach to shift between frameworks is to map discrete categories into a three-dimensional space, which corresponds to Mehrabian and Russell’s claim that all affective states can be represented by the dimensions
valence,
arousal and
dominance [
12]. This mapping to and from the VAD space can be regarded as a pivot mechanism. Regardless of the specific mapping technique (e.g., linear regression, kNN or lexicon-based mappings), this idea opens possibilities. Given an accurate mapping technique and a well-performing emotion analysis system that predicts values for
valence,
arousal and
dominance, the predicted VAD values can be converted to any categorical emotion label set. Emotion frameworks can then easily be tailored to specific tasks and domains, broadening their scope of application in e.g., customer service management or conversational agents.
Moreover, previous experiments for Dutch emotion detection revealed that the classification of emotional categories (
anger,
fear,
joy,
love and
sadness) is very challenging, while more promising results were found for VAD regression [
13]. Transferring information from the regression task to improve performance on the classification task would therefore be an interesting line of research.
This study investigates the potential of dimensional representations and revolves around two research questions: (a) can dimensional representations serve as an aid in the prediction of emotion categories and (b) can dimensional representations contribute in tailoring label sets to specific tasks and domains?
Our research focuses on Dutch emotion detection and will make use of the EmotioNL dataset [
13]. We examine three cross-framework transfer methodologies, namely multi-task learning, meta-learning and the aforementioned pivot mechanism. In the multi-task setting, the VAD regression task and classification task are learned simultaneously. In the meta-learner approach, two systems are trained separately, one for VAD regression and one for emotion classification. We will investigate whether a multi-task learner or a meta-learner that exploits both sources of information is favorable compared to a system that only uses one source. These models will be compared to a system relying on a pivot method, using solely dimensional representations. The code is publicly available at
https://github.com/LunaDeBruyne/Mixing-Matching-Emotion-Frameworks (accessed on 30 September 2021).
We thus contribute to the field of emotion analysis in NLP by leveraging dimensional representations to increase the performance of emotion classification and by proposing a method to tailor label sets to specific applications.
The remainder of this paper is organised as follows: in
Section 2, related work on the combination of categorical and dimensional frameworks in emotion detection is discussed.
Section 3 describes the materials and methods of our study and gives an overview of the used data (
Section 3.1) and a description of the experimental setup (
Section 3.2). Results are reported in
Section 4 and further discussed in
Section 5. This paper ends with a conclusion in
Section 6.
2. Related Work
Our previous work on Dutch emotion detection focused on the prediction of the classes
joy,
love,
anger,
fear,
sadness or
neutral and the emotional dimensions
valence,
arousal and
dominance in Dutch Twitter messages and captions from reality TV-shows [
13]. We found that the classification results were low (54% accuracy for tweets and 48% for captions). However, the results for emotional dimensions were more promising (0.64 Pearson’s
r for both domains). This observation, together with the issue of having specialised categorical labels for specific tasks/domains, reinforces the urgency to focus more on dimensional models and investigate their potential of aiding emotion classification by means of transfer learning.
Multi-task learning settings have proven successful in many tasks related to emotion and sentiment analysis [
14,
15]. Although there are not many studies that perform transfer learning with multiple emotion frameworks, there are various studies that employ multi-task learning by jointly training emotion detection with sentiment analysis [
16,
17] or other related tasks [
18]. All of these studies suggest that multi-task frameworks outperform single-task experiments and thus motivate the idea to train emotion classification and VAD regression jointly, especially as VAD probably contains more valuable emotional information than sentiment (which only contains the first dimension:
valence).
Various studies have also investigated how to deal with disparate label spaces. Mostly, this involves a mapping between categorical and dimensional frameworks, e.g., in the work of Stevenson et al. [
19] and Buechel and Hahn [
20,
21]. In these studies, scores for
valence,
arousal and
dominance were used to predict intensity values for the basic emotion categories
happiness,
anger,
sadness,
fear and
disgust, and vice versa. To this end, linear regression [
19], a kNN model [
20] and a multi-task feed-forward network [
21] were used. Especially this last method provided promising results, where a Pearson correlation of 0.877 was obtained for mapping dimensions to categories and 0.853 for the other direction.
A straightforward approach is to map discrete categories directly into the VAD space, which corresponds to Mehrabian and Russell’s claim that all affective states can be represented by the dimensions
valence,
arousal and
dominance [
12].
Figure 1 shows the positions of Ekman’s basic emotions in the VAD space, based on the scores of these terms in Mehrabian and Russell [
12]. Calvo and Mac Kim employ this idea and apply it directly to the task of emotion detection [
22]. They obtain lexicon scores for emotion words related to the categories
anger/disgust,
fear,
joy and
sadness by looking them up in the Affective Norms for English Words (ANEW) [
23], and map the center of each of these categories in the VAD space. Then, they calculate VAD scores for sentences (again using the ANEW lexicon), which are placed in the emotional space as well. By computing cosine similarity between the sentence and the previously mapped emotion categories, the emotional category of the sentence can be determined. This lexicon-based mapping approach has as an advantage that no annotated categories are needed, in contrast to the previously discussed approaches which do require annotated categories to learn a mapping.
Besides mapping between emotion frameworks, a similar line of research deals with the unification of disparate label spaces in emotion and sentiment resources. Examples of merging sentiment lexica are [
24,
25,
26] for emotion lexica and [
27] for emotion datasets. Techniques exist out of Bayesian models [
24], variational autoencoders [
25,
26] and rule-based combination techniques [
27] to map lexica or datasets with different labels into the same space.
4. Results
We report results for the three metrics (macro F1, accuracy and cost-corrected accuracy) for the base transformer model, the multi-task model in its three settings (equal weights, higher weight for classification and higher weight for regression), the meta-learner and the pivot model. The results for Tweets are shown in
Table 4 for categories and
Table 5 for VAD, while results for Captions are shown in
Table 6 and
Table 7.
The results of the base models are rather similar in both domains. As also observed in De Bruyne et al. [
13], the performance is notably low for categories, especially regarding macro F1-score (only 0.347 for Tweets and 0.372 for Captions). Note that we are dealing with imbalanced datasets, which explains the discrepancy between macro F1 and accuracy (instances per category in Tweets subcorpus: n_anger = 188, n_fear = 51, n_joy = 400, n_love = 44, n_sadness = 98, n_neutral = 219; Captions subcorpus: n_anger = 198, n_fear = 96, n_joy = 340, n_love = 45, n_sadness = 186, n_neutral = 135). Scores for dimensions seem more promising, although results are hard to compare as we are dealing with different metrics (
0.635 for Tweets and 0.641 for Captions).
When we look at multi-framework settings (multi-task and metalearner), we see that performance goes up for the categories (from 0.347 to 0.420 in the meta-learning setting for Tweets and from 0.372 to 0.407 for Captions), while it drops or stays constant for the dimensions (from 0.635 to 0.638 and from 0.641 to 0.643 for the meta-learner in Tweets and Captions, respectively). This observation confirms that categories benefit more from the additional information of dimensions than in the opposite direction and corroborates the assumption that the VAD model is more robust than the classification model.
The boost in performance for categories is especially clear for the meta-learner setting, where scores improve for all evaluation metrics in both domains (increase of no less than 7% macro F1 and around 2% (cost-corrected) accuracy for Tweets and around 3% in all metrics for Captions).
For the multi-task approach, only macro F1 increased for categories, while for Captions, (cost-corrected) accuracy also went up in two out of three settings. When taking all metrics into account, the largest increase was found in the setting where VAD had the largest weight (noted in
Table 4 and
Table 6 as Multi-task (0.25)).
For the pivot method, the primary objective was not to outperform the base model, but to be on par with it. However, looking at the performance, we observe a steep drop in performance for all metrics (e.g., for Tweets accuracy and Captions F1 the decrease is almost 10%). The loss in cost-corrected accuracy is smaller. Error analysis will need to clarify whether predictions made in the pivot approach are useful (see
Section 5). However, based on these results, it does not seem that the pivot method is an effective approach to predict emotion categories.
5. Discussion
The results in
Section 4 suggest that VAD dimensions can help in predicting emotional categories, as the VAD regression model seems more robust than the classification model. However, the pivot method did not seem an effective approach to predict emotion categories. In this section, we will take a look at the correlation between categories and VAD dimensions as annotated in our dataset and perform an error analysis on the predictions of the pivot method. Finally, we give some suggestions for future research directions.
5.1. Correlation between Categories and Dimensions
The point biserial correlation coefficient is used to measure correlation between a continuous and a binary variable. This allows us to assess the correlation between each emotion category (either 0 or 1, so the binary variable) and each one of the VAD dimensions (continuous). The results are shown in
Table 8 (Tweets) and
Table 9 (Captions).
In both domains, anger and sadness show a high negative correlation with valence (Tweets subset: and , respectively; Captions subset: and ), while joy shows a high positive correlation with this dimension ( for Tweets and for Captions). For fear and love, the correlation is less obvious (Tweets: and ; Captions: and ).
Arousal is (weakly) positively correlated with anger and joy (Tweets: and , respectively; Captions: and ). Sadness has a negative correlation with this dimension in Captions (). Strikingly, neutral has a notable negative correlation with arousal ( in Tweets and in Captions). This goes a bit against our assumption that the neutral state is the center of the VAD space, although it is not completely counter-intuitive that neutral sentences were judged as having low arousal instead of medium arousal.
Contrary to what some studies claim [
36], the
dominance dimension seems more correlated with emotion categories than
arousal. Especially with
sadness, with which
dominance is negatively correlated, the correlation is rather high (
in Tweets and
in Captions). In the Captions subset,
fear and
joy are rather highly correlated with
dominance as well (
and
, respectively).
The dimensional and categorical annotations in our dataset are thus correlated, but not for each dimension-category pair and certainly not always to a great extent. These observations do seem to suggest that a mapping could be learned. Indeed, various studies have already successfully accomplished this [
19,
20,
21]. However, our goal is not to
learn a mapping, because then there would still be a need for annotations in the target label set. Instead, a mapping should be achieved without relying on any categorical annotation. The correlations shown in
Table 8 and
Table 9 thus seem too low to directly map VAD predictions to categories through a rule-based approach, as was proven in the results of the presented pivot method.
For comparison, we did try to learn a simple mapping using an SVM. This is a similar approach as the one depicted in
Figure 3, but now only the VAD predictions are used as input for the SVM classifier. Results of this learned mapping are shown in
Table 10. Especially for the Tweets subset, results for the learned mapping are on par with the base model, suggesting that a pivot method based on a learned mapping could actually be operative.
Apart from looking at correlation coefficients, we also try to visualise the relation between categories and dimensions in our data. We do this by plotting each annotated instance in the three-dimensional space according to its dimensional annotation, while at the same time visualising its categorical annotation through colours.
Figure 5 and
Figure 6 visualise the distribution of data instances in the VAD space according to their dimensional and categorical annotations. On the
valence axis, we clearly see a distinction between the
anger (blue) and
joy (green) cloud. In the negative
valence area,
anger is more or less separated from
sadness and
fear on the
dominance axis, although
sadness and
fear seem to overlap rather strongly. In addition,
joy and
love show a notable overlap.
Average vectors per emotion category are shown in
Figure 7 and
Figure 8. It is striking that these figures, although they are based on annotated real-life data (tweets and captions), are very similar to the mapping of individual emotion terms as defined by Mehrabian [
12] (
Figure 1), although the categories with higher
valence or
dominance are shifted a bit more to the neutral point of the space. Again, it is clear that
joy and
love are very close to each other, while the negative emotions (especially
anger with respect to
fear and
sadness) are better separated.
Although the average VAD per category values corresponds well to the definitions of Mehrabian [
12], which are used in our mapping rule, the individual data points are very much spread out over the VAD space. This results in quite some overlap between the classes. Moreover, many (predicted) data points within a class will actually be closer to the center of the VAD space than it is to the average of its class. However, this is somewhat accounted for in our mapping rule by first checking conditions and only calculating cosine distance when no match is found (see
Table 3). Nevertheless, inferring emotion categories purely based on VAD predictions does not seem efficient.
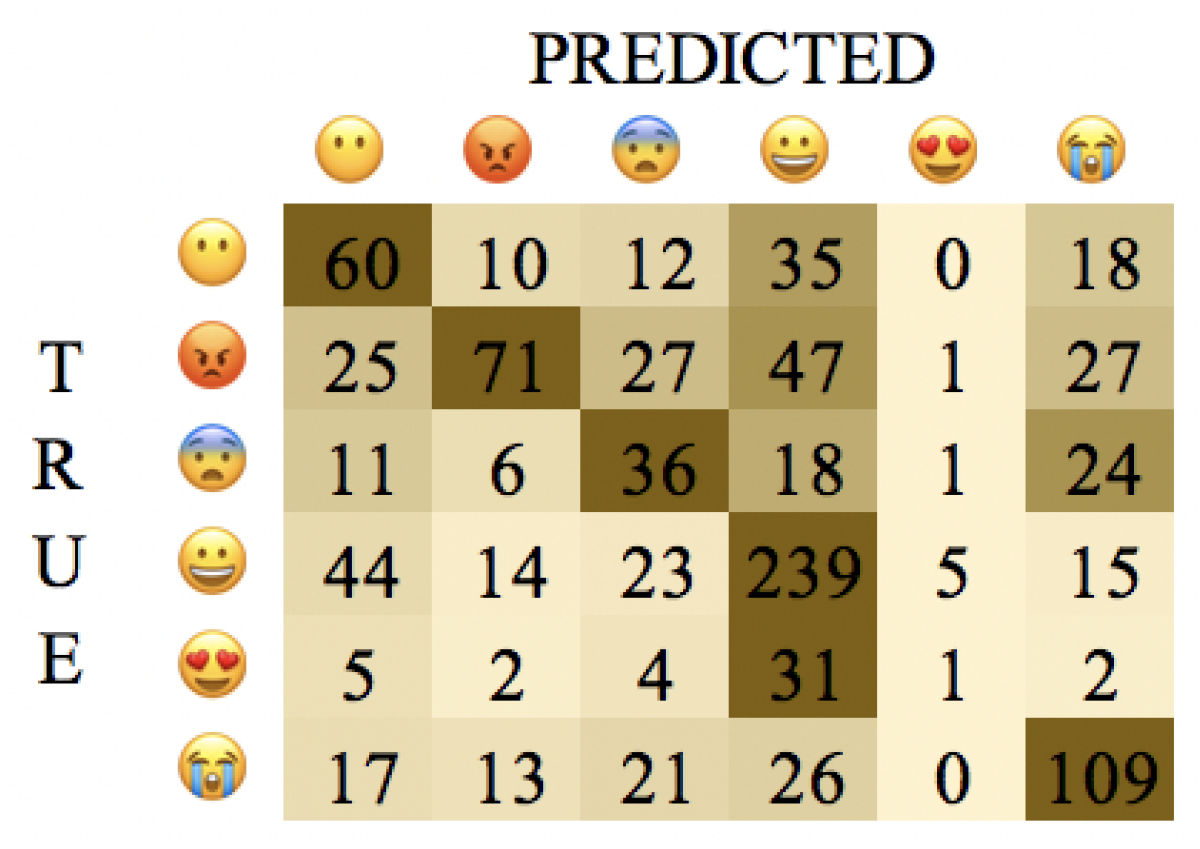
5.2. Error Analysis
In order to get some more insights into the decisions of our proposed models, we perform an error analysis on the classification predictions. We show the confusion matrices of the base model, the best performing multi-framework model (which is the meta-learner) and the pivot model. Then, we randomly select a number of instances and discuss their predictions.
Confusion matrices for Tweets are shown in
Figure 9,
Figure 10 and
Figure 11, and those of the Captions subset are shown in
Figure 12,
Figure 13 and
Figure 14. Although the base model’s accuracy was higher for the Tweets subset than for Captions, the confusion matrices show that there are less misclassifications per class in Captions, which corresponds to its overall higher macro F1 score (0.372 compared to 0.347). Overall, the classifiers perform poorly on the smaller classes (
fear and
love).
For both subsets, the diagonal in the meta-learner’s confusion matrix is more pronounced, which indicates more true positives. The most notable improvement is for fear. Besides fear, love and sadness are the categories that benefit most from the meta-learning model. There is an increase of respectively 17%, 9% and 13% F1-score in the Tweets subset and one of 8%, 4% and 6% in Captions.
The pivot method clearly falls short. In the Tweets subset, only the predictions for joy and sadness are acceptable, while anger and fear get mixed up with sadness. In the Captions subset, the pivot method fails to make good predictions for all negative emotions.
To get more insights into the misclassifications, ten instances (five from the Tweets subcorpus and five from Captions) were randomly selected for further analysis. These are shown in
Table 11 (an English translation of the instances is given in
Appendix A). In all given instances (except instance 2), the base model gave a wrong prediction, while the meta-learner outputted the correct class. In particular, the first example is interesting, as this instance contains irony. At first glance, the sunglasses emoji and the words “een politicus liegt nooit” (
politicians never lie) seem to express
joy, but context makes us understand that this is in fact an
angry message. Probably, the
valence information present in the VAD predictions is the reason why the polarity was flipped in the meta-learner prediction. Note that the output of the pivot method is a negative emotion as well, albeit
sadness.
In three cases of the shown instances, the base model predicted emotions in the wrong polarity, which were, in turn, of the correct valence (or polarity) for the meta-learner and pivot method (instance 1, 6 and 8). Indeed, although the performance of the pivot method was low regarding macro F1 and accuracy, the cost-corrected accuracy (which takes the polarity into account) was reasonably good.
What is striking is that, out of the seven examples where the pivot failed to make a correct prediction (all instances except 7, 8 and 10), four examples would have been correctly classified based on gold VAD values. This could indicate that the main problem with the pivot method is not the mapping rule, but incorrect predictions made by the VAD regression model. To investigate this, the pivot experiments were repeated, but this time using gold VAD values instead of predicted ones. As can be observed in
Table 12, results are now on par with the base classification model. This suggests that our pivot method could be efficient, provided that the VAD regression model is further improved upon.
5.3. Future Work
Our experiments showed that dimensional emotion representations can help in improving the performance of emotion classification models in the EmotioNL dataset. The pivot-based approach was not successful, although we found evidence that this method might be beneficial when the VAD regression model is further improved.
This leads to several suggestions for future work. First of all, we suggest that these methods are validated on other datasets and other languages than Dutch. Furthermore, we want to improve the VAD model by testing different model architectures and investigate its effect on the usability of the pivot method. The pivot method could then be investigated when used for mapping to label sets different than the one described in this paper. Finally, an interesting research direction could be to look at other modalities, e.g., facial emotion recognition (FER). A well-known problem in FER is the poor performance in real-time testing because of the bad quality of datasets [
37]. It would be interesting to investigate whether dimensional representations might be of help here as well.
6. Conclusions
In emotion detection studies, researchers usually opt for either categorical or dimensional emotion frameworks. Our previous work on Dutch emotion detection showed that the classification of emotional categories is a very challenging task, but that a regression task for predicting valence, arousal and dominance achieves more promising results. In this paper, we have therefore investigated whether transferring information from the regression to the classification task can improve performance. Moreover, we have examined the potential of dimensional representations to be used as a pivot mechanism, which allows tailoring emotion frameworks to specific tasks and domains.
Our results reveal that dimensional representations can indeed boost the baseline emotion classification’s performance, especially in a meta-learning setting. Moreover, while categories do benefit from the additional VAD information, the opposite does not hold, which further underlines the assumption that the VAD model is more robust than the classification model.
The pivot method was not able to compete with the base model and revealed a substantial drop in performance. However, further inspection revealed that the rule-based mapping itself does perform on par with the base model when gold VAD values are used. This suggests that the pivot method could be efficient, provided that the VAD regression model is further improved. This opens up possibilities to tailor emotion frameworks to specific tasks and domains and thus broaden their application scope.


 a politician never lies
 not this time.#fail #bulned #itaned
 a real example! DO WHAT YOU LIKE!
  and u see, you’ll get there https://t.co/6AUw29DXso (accessed on 30 September 2021)
 RIP Lobanzo
 condolences to the grieving family. https://t.co/3NBjWlE16D (accessed on 30 September 2021)
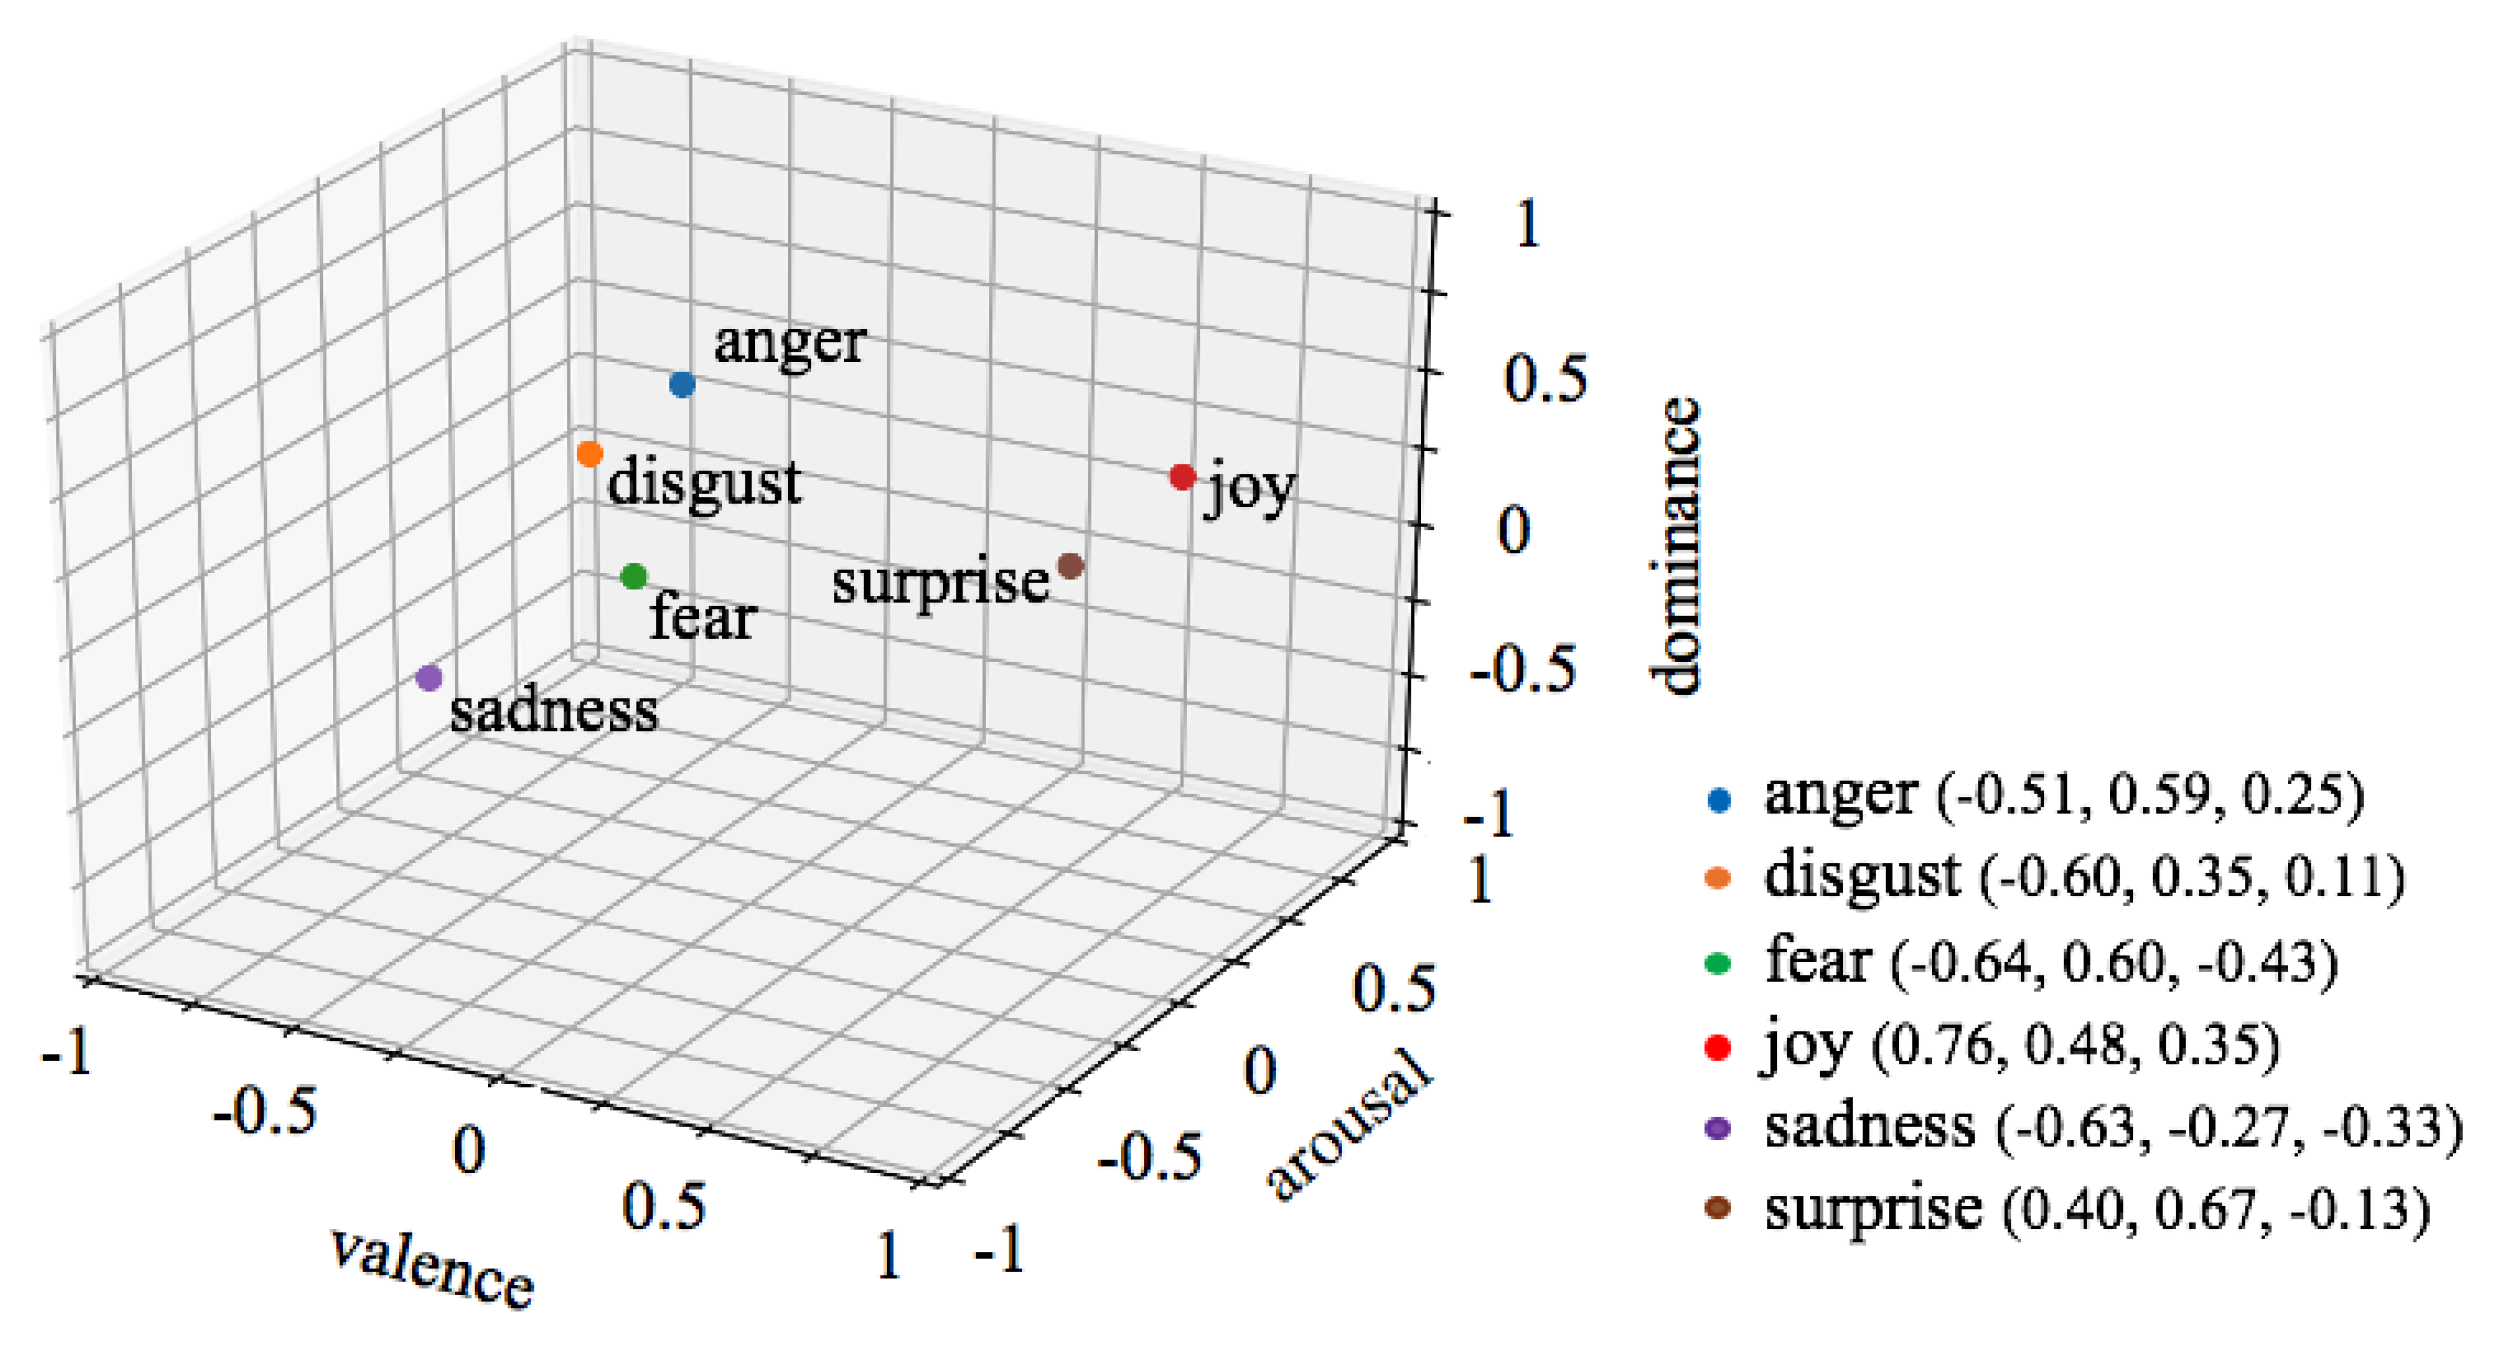


 Vandaag er even op uit en genieten van de zon. Fijne dag allemaal
 https://t.co/6AUw29DXso (accessed on 30 September 2021)