In this section, a Genetic-Algorithm (GA) optimization-based method available in the MATLAB optimization toolbox is used to size the power rating of the base modules as well as the number of shared modules N in the proposed charging station configuration. The optimization algorithm aims to minimize the infrastructure cost on one side, and the penalty related to the “unsupplied” power to the connected electric cars on the other side.
3.1. Objective Function
The objective function to be minimized is the costs related to the conversion stage of the UFCS (
) in a
T scheduling horizon. Since the optimization problem starts from the assumption that the presence of an UFCS in the assumed site is deemed necessary, the objective function does not consider all the other cost related to the operation, construction, and maintenance of the overall UFCS but only the initial costs related to the power conversion system. The objective function is formulated as follows:
where
and
are the hardware and installation costs of the base modules and power switches weighted in
T, respectively. Lastly,
represent the penalty coming from the electric vehicles connected to the UFCS, which charges at limited power.
The overall costs of the modular stage are computed in (3) and (4).
However, knowing the scheduling horizon
T expressed in days and considering the charging station lifespan
Y in years, we get the weighted costs in (5) and (6).
To attribute a penalty cost to the possible power limitations
, imposed by the UFCS on the vehicles charging power, the first step is an
x-axis change of the charging profile, which is usually given as a function of the battery state of charge. Therefore, the charging speed as a function of time of is obtained by applying the following Formula (7).
In this study, only the time needed to go from 10% up to 80% is considered. This is mainly due to the fact that beyond a SOC of 80% the charging rate slows dramatically.
The next step is the discretization of the charging profiles in time interval d length.
An example of the output of Algorithm 1 is depicted in orange in
Figure 5, which represents the vector [1 × 20] in (8).
| Algorithm 1 discretization of charging profile |
| ,, |
| ; |
|
| 4: Procedure |
|
|
|
|
|
| 10: end |
|
| 12: end |
A list of the different EVs model considered in the optimization process is created. Such a list is composed by electric vehicles, which are randomly chosen among the selected models. However, to approach the real market, the percentage of each model is introduced in the algorithm as . This will allow us to get a list that better approximates the real EV fleet in the studied area.
Algorithm 2 returns
a structure composed of two columns and
lines, which represent the randomly selected EV’s list that will be charged at the considered charging station. The first column contains the vectors of the discretized charging power rates
, and the second column specifies the name of the EV model at which the charging profile belongs.
| Algorithm 2 creation of the EVs’ queue to be charged |
|
|
|
| 4: Procedure: |
| of random integer number from 1 up to 100: |
|
|
|
| 9: end |
|
|
|
|
|
| 15: end |
| 16: end |
|
| 18: end |
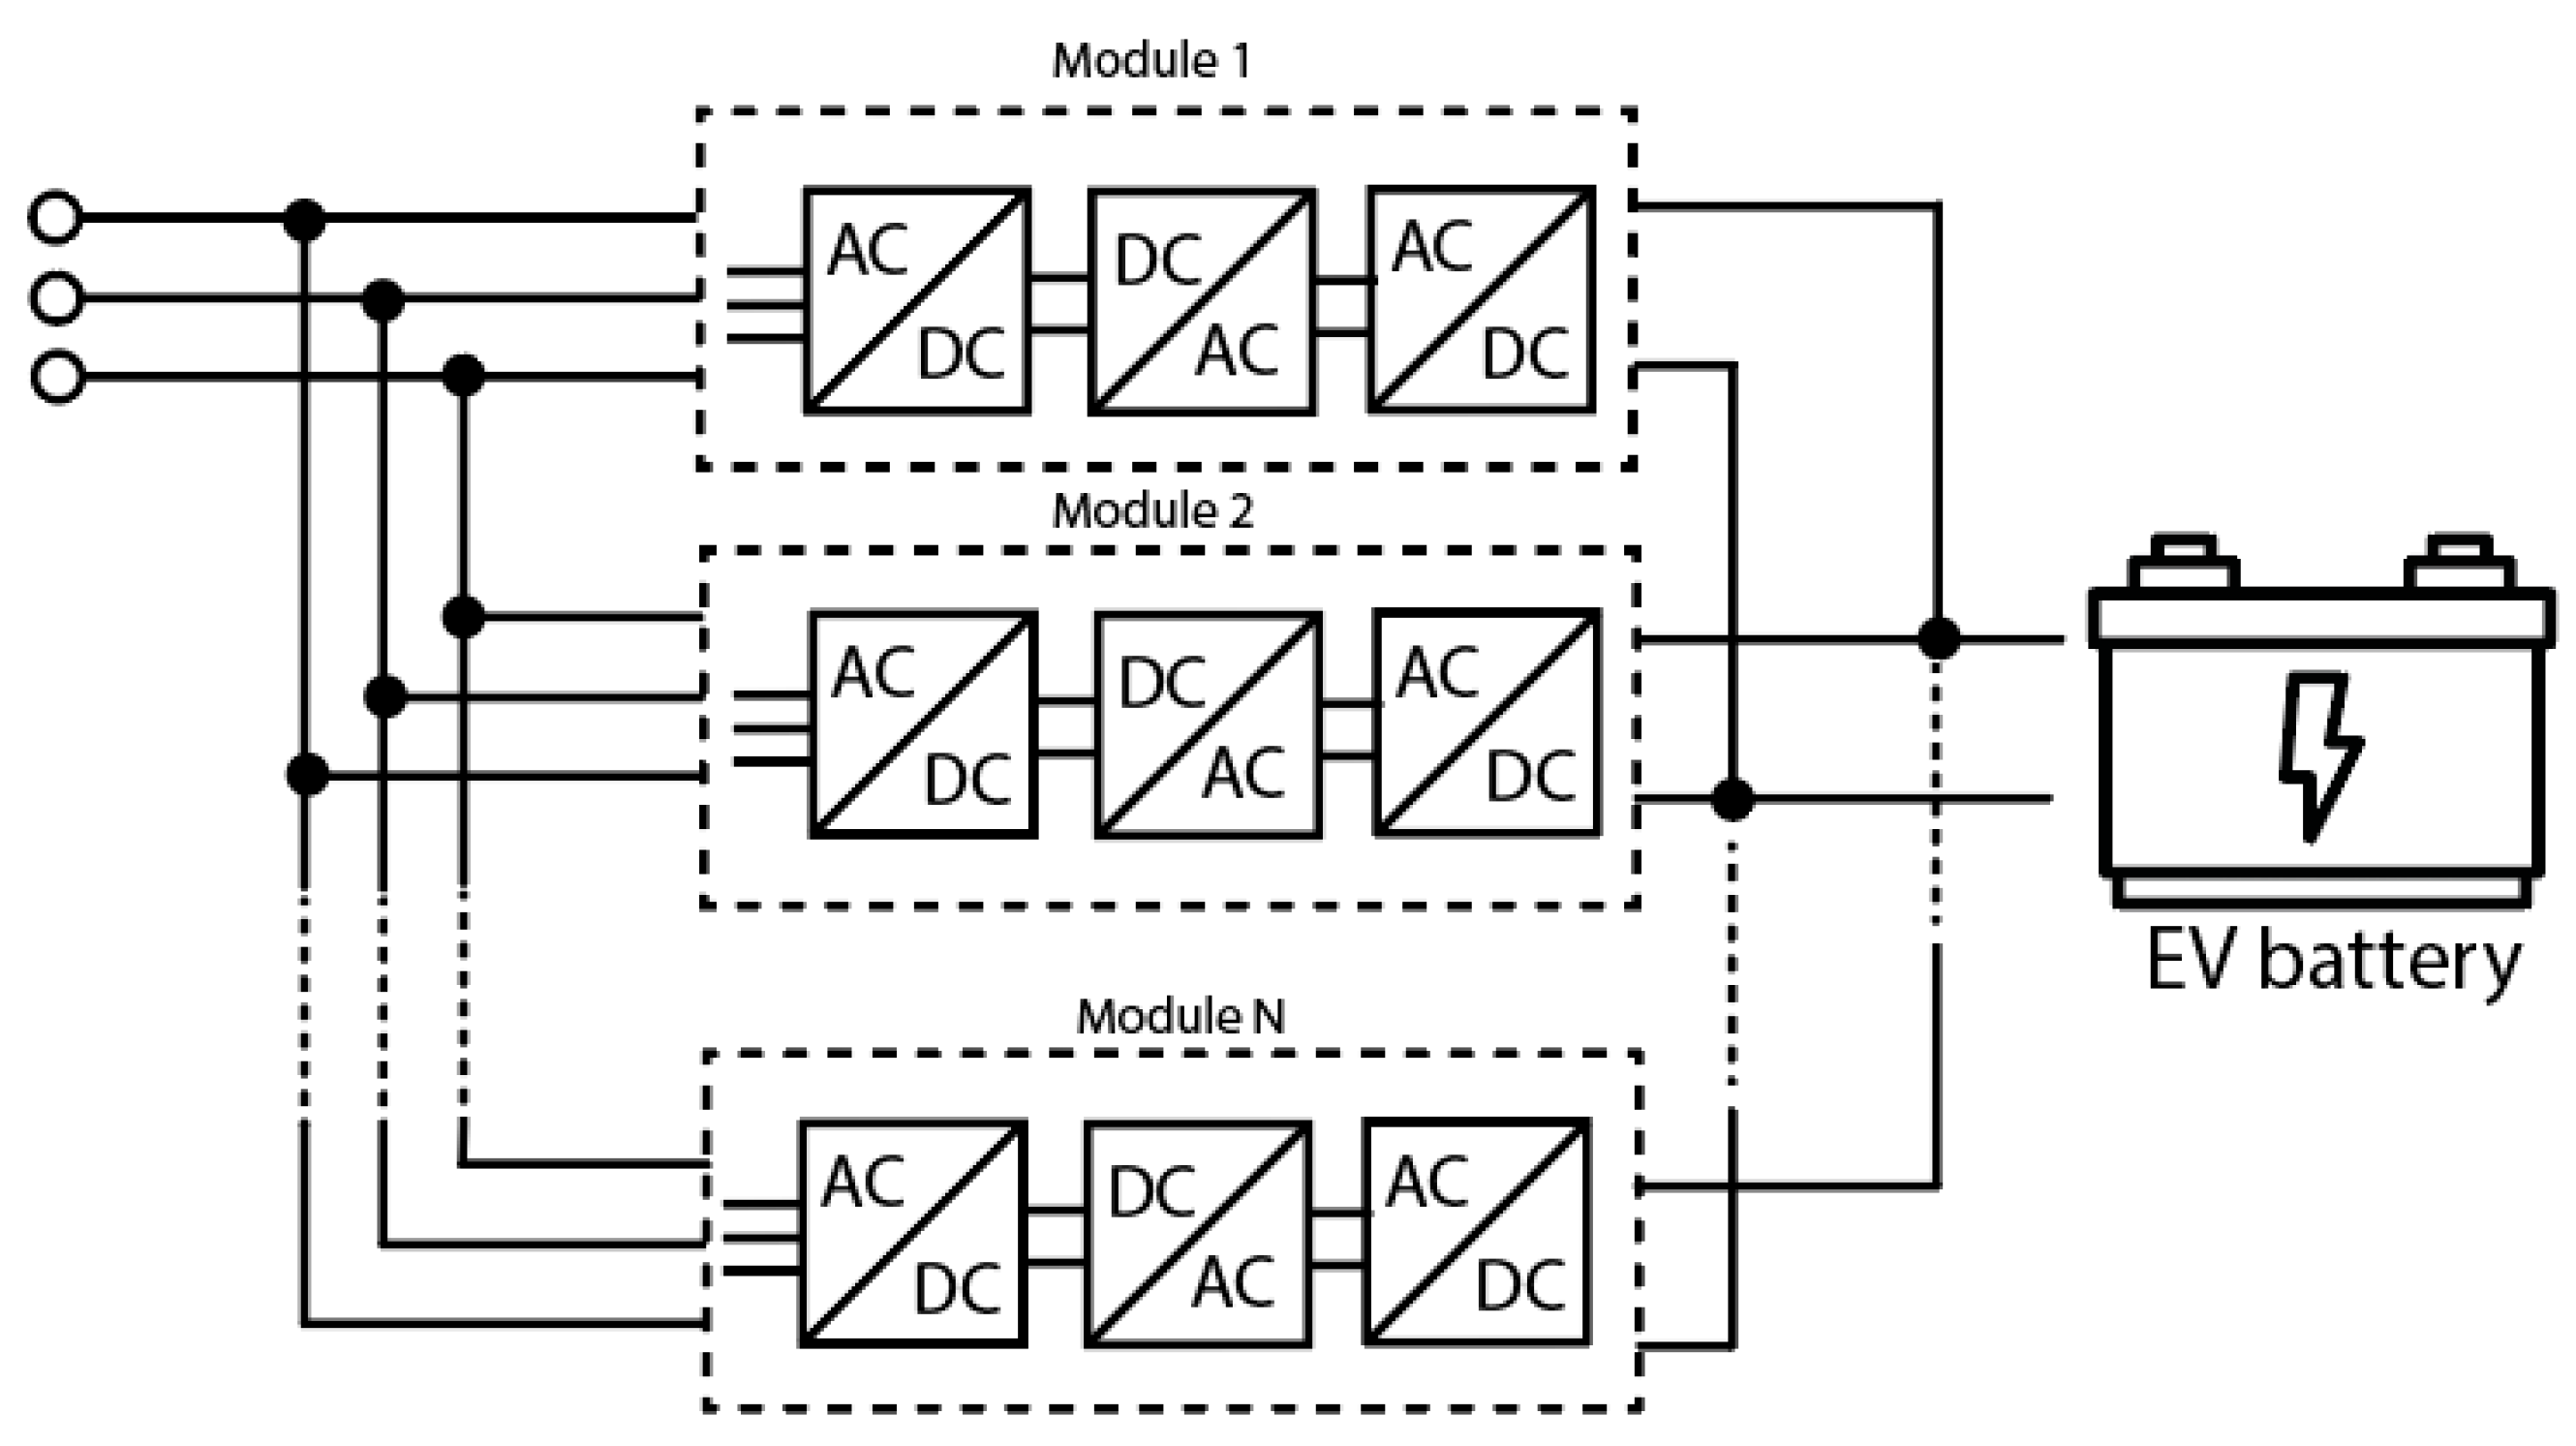
Finally, to find the penalty cost, the connecting time of the vehicles is computed according to their maximum capability, which means the charging curve is allowed by the BMS (
Figure 1) and kept constant regardless of whether the charging station provides the required power rate or not. For instance, if a Hyundai Kona arrives with a SoC of 10% to the UFCS, its expected charging time to reach 80% according to the charging curve provide by the BMS (
Figure 5) is about 41 min, therefore, it is assumed that the e-car will stop at the station for that fixed amount of time, and if the UFCS does not provide the required power level, then the difference between the value of required power and supplied one turns into unsold energy.
Another factor that must be taken into account at this point is the occupancy rate of the station during the scheduling horizon considered in the optimization. This variable depends on many factors, such as the stochastic behavior of e-vehicle drivers, the number and the length of the performed journeys, the position, and the type of charging infrastructure. In the literature, many works try to assess the EVs’ load demand throughout a day for different types of charging infrastructure. For instance, in [
27] the authors generate a schedule for the charging events starting from real-world travel data collected through GPS. In contrast, in the authors forecast, the EV charging demand starts from big data containing historical real-world traffic data.
In this work, the parameter
is defined as the occupation interval of time (hours) of the station charging points. For instance, a value of
equal to 18 means that only 10% of the charging points of the station are assumed occupied for 18 h over the operation horizon. Therefore, it holds:
Instead,
is the number of d-length intervals of time in which the station is occupied at the occupation rate
and it is computed through (11). Keeping on with the previous example and considering a time interval of 2-min length, then 18 h corresponds to a
equal to 540.
For the computation of the overall penalty cost, the matrix containing the charging powers delivered each d minutes by each occupied charging ports must be computed. Such a matrix is denominated and it has CP lines and columns, however only the lines from 1 up to contain values different from zeros.
The matrix
has been built by considering the queuing process represented in
Figure 6. The UFCS is equipped with
CP charging ports and a certain number of them are occupied
. Once a charger among the
becomes available again in the time interval
i, the next EV in the
list is served in the now free charging point. In this way, the station is assumed occupied at a rate
for a time interval of
. When the occupancy rate changes, the number of occupied charging ports
is modified too, but the occupation policy remains the same and the EV list continues without being updated. Therefore, as a scheduling policy, we consider the first- come-first-serve (FCFS) policy. In FCFS, the EVs are prioritized based on their arrival time.
The procedure must be repeated for all the considered values of
, and this implies that there will be as many
as the
values considered. The procedure used to assess
is represented in Algorithm 3.
| Algorithm 3 Estimation of the output power of each charging column |
|
|
| 3: Initialization:, % h represents the progression of the EVs in the list |
| 4: Procedure: |
| 5: In case of rational result, the number of occupied charging ports is rounded to the next whole integer. |
| 6: for |
|
|
| 9: end |
|
|
|
|
| 14: end |
| 15: end |
|
|
|
|
| ) = 0; |
| %random initial state of charge |
| ; |
| ; |
|
| 25: end |
| 26: end |
| 27: end |
|
| =; |
| 30: end |
| ; |
| 32: end procedure |
Once
is computed, the penalty cost can be found by following the flowcharts in
Figure 7 and
Figure 8. Mainly, the procedure compares, in every interval of time, the overall power required by the EVs connected to the station with the possible deliverable one, considering the availability and the power supplied by both the fixed and shared modules. Thus, if the demand in the
i-th interval of time is satisfied, the value of unsupplied power is nil, otherwise the value of unsold energy is equal to the unsupplied power times the length d of the interval of time. Finally, the overall unsold energy is computed, summing the energy of each interval of time and the penalty cost
by multiplying by the energy price.
The full procedure to achieve
is explained below step-by-step. In the first place, through the process in
Figure 7, we arrive at the matrix
, which has the same dimension of
, since it is obtained by subtracting to every element of
the power provided by the
CP fixed modules of power rate
.
The next step aims to obtain from
the power the station cannot provide to the connected vehicles. Therefore, the
must be removed from the power delivered by the shared modules; however, always remembering the number of shared modules is limited at
N, and if one shared module is used for the
p-th charging port in the
i-th interval of time, then it cannot be used in other ports. Following the flowchart reported in
Figure 8, we arrive at the vector
specifying the unsupplied power from the station in every
i-th. Then, by summing the power missing in each interval of time, we ascertain the overall power unsupplied when the station is at an occupancy rate of
. Summing all the cells of the vector
we ascertain the overall power unprovided
when the station is occupied at
.
Repeating the procedures in
Figure 7 and
Figure 8 for every rate
and by multiplying the power missing
at each
occupation rate for the length d of the intervals of time (12) we arrive at the unsupplied energy in kWh
. Summing all the
(13) the unsold energy during all the considered
T horizon interval is carried oud. Lastly, we can compute the penalty cost
through (14).


