Abstract
Superconducting fault current limiters (SFCLs) are attracting increasing attention due to their potential for use in modern smart grids or micro grids. Thanks to the unique non-linear properties of high-temperature-superconducting (HTS) tapes, an SFCL is invisible to the grid with faster response compared to traditional fault current limiters. The quench recovery characteristic of an HTS tape is fundamental for the design of an SFCL. In this work, the quench recovery time of an HTS tape was measured for fault currents of different magnitudes and durations. A global heat transfer model was developed to describe the quench recovery characteristic and compared with experiments to validate its effectiveness. Based on the model, the influence of tape properties on the quench recovery time was discussed, and a safe margin for the impact energy was proposed.
1. Introduction
The smart grid technology market is booming due to demands for the automatic management of complex power grids [1]. The incorporation of renewable energy sources such as wind, solar or hydro and other distributed energy sources is generating unprecedented challenges to power generation, transmission and distribution in terms of efficiency, reliability and flexibility [2,3]. The development of power grid technology is being revolutionized rather than improved; for example, many direct-current grid projects are being tested and are proved promising, especially for power transmission and distribution in data centres, electrical ships or aircraft, and self-sustainable micro grids [4,5,6,7].
However, the smart grid meets important challenges associated with fault currents, which are occurring at rising rates, and have larger peak values and faster propagation speeds [8,9]. Therefore, in addition to intelligent parts for the realization of real-time monitoring and control of grid operation, smart grids feature advanced power applications such as fault current limiters to reduce the fault current rapidly and effectively [10,11]. A superconducting fault current limiter (SFCL) that mainly consists of high-temperature-superconducting (HTS) coils generates almost no Joule losses during normal operation; however, it can suppress fault currents much faster and more efficiently than conventional ones, let mechanical current breakers function, and recover to normal operation quickly when an electrical fault happens [12,13]. Such features like “invisibility” and self-healing (i.e., that the SFCL can automatically switch between fault current limit and normal operation state) mean SFCLs meet the needs of smart grids [14].
With increasing interest in the use of SFCLs in modern grids, the feasibility, fabrication and management of SFCLs are being considered in laboratories and even tested in grids [15,16,17,18]. For example, the 10 kV/200 A, 40 kV/2 kA and 220 kV/1.5 kA resistive-type SFCLs were tested in a grid and proved to be effective in China by Shanghai Jiaotong University, Institute of Electrical Engineering and Beijing Jiaotong University [19,20,21]. However, many scientific and technical problems remain in building a practical SFCL, due to the complex non-linear, temperature- and magnetic-field-dependent properties of superconducting materials. An SFCL works by transforming into normal states (namely, quench) to restrain fault currents, and by recovering to superconducting states to restore normal grid operation. The quench recovery time, which is the time taken by an SFCL to restore normal operation, is crucial as it determines the time window for fault isolation and load current compensation [22].
In the literature, experiments and simulations were reported to investigate quench recovery characteristics of SFCLs. From the macroscopic point of view, the topology of SFCLs was discussed qualitatively, mainly for determining the current-limiting efficiency [23,24,25]. For more precise descriptions of quench recovery processes, measurement and calculation of HTS tapes were carried out, which clarified the physical nature of the process [26,27,28,29,30,31,32,33]. However, when a practical SFCL is designed and built for operation, how the quench recovery time changes with a different fault current or energy needs to be known. Approaches for such a quick and effective estimation of the quench recovery time directly from the impact energy of a practical fault current have not been reported.
State Grid Corporation of China has developed a resistance type 10 kV/100 A SFCL prototype and tested it in a grid. In the present work, as part of theoretical research in the project, the quench recovery time of an HTS tape was investigated numerically and experimentally. Fault currents of different magnitudes and duration were applied to an identical HTS sample to measure its non-linear response at 77 K. A simple but effective global heat transfer model was proposed to quickly estimate the recovery time with the impact energy. With consideration of the temperature dependent properties of different composite materials in HTS tapes, the model fits well with the experimental results. Based on the model, influences of geometry and material compositions of HTS tapes on quench recovery wer discussed to guide the future design of SFCLs. In addition, the damage temperature of HTS tapes was verified by the model and experiment. Furthermore, a safety margin of the impact energy for avoiding irreversible damage of HTS tapes was suggested.
2. Experimental Details
2.1. Sample
The characteristics of the HTS tape used in the experiment are listed in Table 1, and the picture of the sample is displayed in Figure 1. The time-dependent voltage and current were measured by the four-point method. The copper terminals were 20 cm apart and the distance between the two voltage leads was 18 cm. The voltage taps were soldered onto the YBCO tape supported by a G10 plate. The YBCO copper tape was wrapped with kapton films to simulate actual working conditions. During the experiments, the entire experimental set-up was kept at 77 K by being immersed in liquid nitrogen under standard atmospheric pressure.

Table 1.
HTS tape properties.
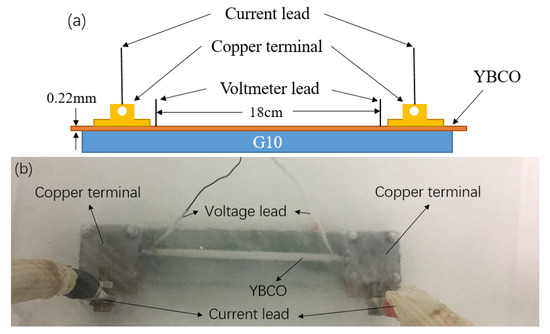
Figure 1.
The experimental set-up, (a) schematic diagram, (b) Photo under test.
2.2. Experimental System
Figure 2 depicts our experimental system for quench/recovery measurement. This system mainly includes six parts: DC power supply (Agilent/KEYSIGHT 6680A, 10 Hz, Keysight, Santa Rosa, CA, USA), nanovoltmeter (Keithley 2182A, 10 Hz, Keithley, Cleveland, OH, USA), data acquisition card (SCB 68A, 1000 Hz, NI, Austin, TX, USA), computer, a fixed value resistor and the test sample.
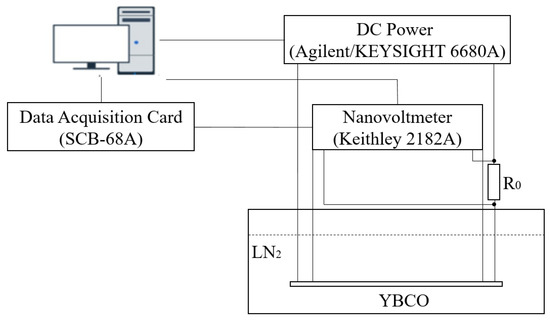
Figure 2.
Schematic of the experimental system.
When the measurement started, the programmable power supply output a current pulse of large amplitudes (detailed in Section 3) to impact the tape. The tape was subsequently quenched and lost its superconducting characteristics. Immediately after the impact current pulse was over, the power supply was switched to output a small constant current of 0.5 A. This value of current allows continuous measurement of the sample without producing non-trivial heat. The sample then started to be cooled down by liquid nitrogen to recover superconductivity around 90 K and reach 77 K finally. Throughout the measurement, the voltage drops of the sample and were recorded by the nanovoltmeter and the data acquisition card at sampling rates of 1000 Hz and 10 Hz for the quench process and recovery process, respectively. The amplitude of current flowing through the sample was obtained by the voltage measurement of .
3. Results
In this work, sixteen groups of experiments were carried out on the sample. As shown in Table 2, impact currents of different amplitudes and durations were applied to the sample. Currents and voltages were measured simultaneously and the corresponding impact energy was calculated by their integration. The quench recovery time, defined as the time needed to drop from the maximum resistance of the tape to around zero, was extracted.
Table 2.
Impact current, pulse duration, impact energy, and recovery time obtained in the experiments.
The quench and recovery process of the HTS tape can be identified from the resistance of the tape. Figure 3 compares the resistance of the YBCO tape under different impact currents of 370 A, 480 A, 580 A, and 690 A, with the same pulse duration of 500 ms. As shown in Figure 3, the resistance first ascends to a peak value and then descends to zero with time, which represents the quench and recovery processes of the HTS tape. The incoming current travels the path with the least resistance once after the YBCO copper tape is completely quenched, so the current will, therefore, pass through both sides of the copper layers in our experimental setup.

Figure 3.
Resistance of the sample during the quench and recovery process at impact currents of 370 A, 480 A, 580 A and 690 A when the pulse duration was 500 ms.
The peak resistance occurred at 500 ms when the impact current ended. The peak resistance of the sample increased with the increasing amplitude of the impact current. After the peak, the resistance reduced to zero, suggesting that the sample recovered to the superconducting state. The descending slopes of the four curves are almost the same, which will be further discussed in the next section.
Figure 4 compares resistance of the YBCO tape under the same impact current 580 A for different pulse durations of 250 ms, 500 ms, 750 ms and 1000 ms. As shown in Figure 4, the ascending slopes of the four curves are identical for euqal impact currents. The peak resistances occur at different times according to when the impact currents end. The peak resistance and quench recovery time increase with the durations of current pulse. Similar to Figure 3, the descending slopes of the four curves are almost the same.
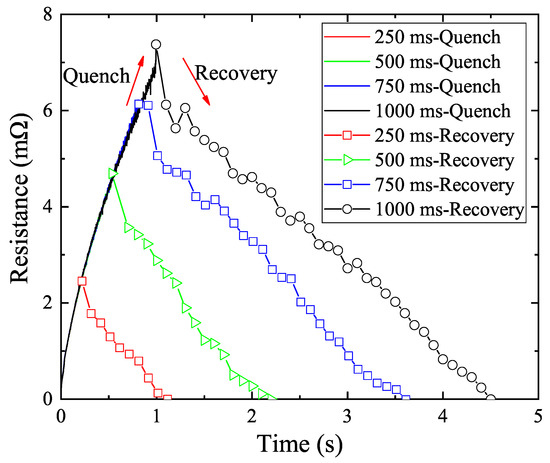
Figure 4.
Resistance of the sample during the quench and recovery processes at pulse durations of 250 ms, 500 ms, 750 ms and 1000 ms when the impact current was 580 A.
At the end of the experiment, the YBCO tape was found to be damaged under an impact current of 690 A and pulse duration of 1000 ms, as shown in Figure 5. With the observed drop off of the voltage and delamination of the tape, the superconducting tape was irreversibly damaged.
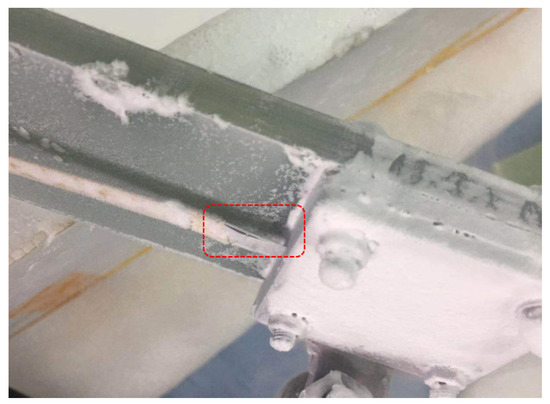
Figure 5.
Damage to the superconducting tape occurred under an impact current of 690 A and pulse duration of 1000 ms.
4. Numerical Model
As mentioned above, the resistivity of the sample, which depends on the temperature, can indicate the states of the sample; as a result, we proposed to use the global temperature as the state variable to describe the quench and recovery processes. A global heat transfer model was developed, inspired by earlier heat transfer models [34,35].
During the quench process, a current pulse of amplitude was supplied to the sample. The temperature quickly increased and the process could be described as a differential equation,
In this equation, the product of current and voltage was the electrical power absorbed by the sample. q(T) was the heat dissipation from the sample to the liquid nitrogen. The item on the right side of the equation describes the temperature increase of the sample. The temperature dependent heat capacity c(T) is a weighted value calculated from heat capacity of copper and Hastelloy [36], since they composed nearly all mass of the tape. The integrated form of Equation (1) is:
where is the pulse duration. is referred to as the impact energy as shown in Table 2. is the total energy dissipated from the tape to liquid nitrogen during the quench process. In literature, the quench process is often supposed to be adiabatic for simplification, which means [37,38],
Applicability of this assumption will be discussed in the next section.
During the recovery process, the temperature slowly decreased following,
During this process, the heat dissipation q(T) was dominated by convection cooling of the liquid nitrogen; as a result, q(T) was determined by the surface area of heat exchange and the temperature difference between the sample and liquid nitrogen,
where S is the double-sided surface area of the sample, is the boiling point of liquid nitrogen (77 K) and h(T) with the unit of is the convention cooling coefficient. The values of h(T), was taken from reference [36].
In this work, we are mainly interested in the recovery time, so instead of solving equations from the very beginning, we can also solve Equation (4) from the time when the recovery process starts. The initial condition for Equation (4) is then the peak temperature of the tape when the quench process ends. This peak temperature can be evaluated from the measured resistivity of the tape,
where is the effective conducting area and is the length of the sample. The sample contained several metal layers among which copper contributes the main conducting route. For simplicity, the effective conducting area was calibrated by experiments. The resistivity was assumed to be the value of copper at 90 K when linear resistance first appeared after the impact current applied. Then the temperature with time can be estimated by simply comparing this resistivity to the temperature-dependent resistivity of copper [39]. This approach provides more reasonable results, because it does not take the adiabatic assumption for the quench process as Equation (3). Further discussions will be made in the next section.
This model can be easily solved by time-step iteration. In the next Section, the temperatures and recovery time will be calculated using the global heat transfer model and compared with experiments to discuss the feasibility and application of the model.
5. Discussion
The influence of the impact energy on the recovery process was investigated through comparison of the numerical model and experiments. The resistivity of the tape first increased with the temperature to a maximum value, indicating a quenched state, and then decreased to zero, indicating recovery of the superconducting state. The resistivity and temperature of the tape reflect the state of the tape.
The peak resistance or temperature is of importance for indicating initiation of quench recovery. Peak resistance of the tape is plotted against impact energy in Figure 6. With increasing impact energy, the peak resistance increases for any pulse duration. Furthermore, the peak resistance increases linearly with the impact energy. For the same impact energy, a shorter pulse duration results in a larger peak resistance. The reason for this is that a shorter pulse results in smaller in Equation (2), thus larger peak current and peak resistance.
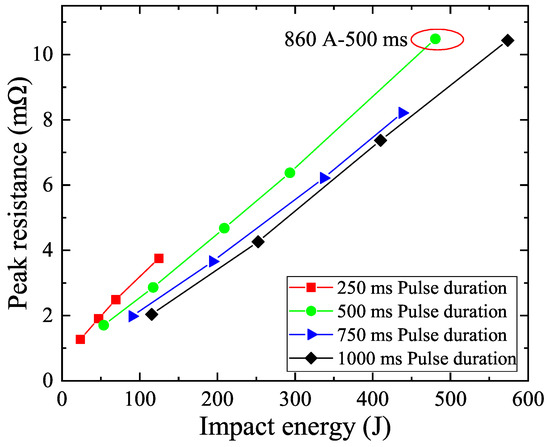
Figure 6.
Peak resistance of the HTS tape as a function of the impact energy. The pulse durations of 250 ms, 500 ms, 750 ms and 1000 ms are compared. The peak resistance value of a supplementary experiment in the red circle will be discussed later.
Figure 7 illustrates the effect of impact energy on peak temperature with pulse durations of 250 ms, 500 ms, 750 ms and 1000 ms, respectively. With increasing impact energy, the peak temperature increases throughout the pulse duration. For the same impact current, the peak temperature increases with the impact energy and the trend is the same to that of peak resistance shown in Figure 6. The reason is that the resistivity of stabilizers increases almost linearly with temperature above 100 K.
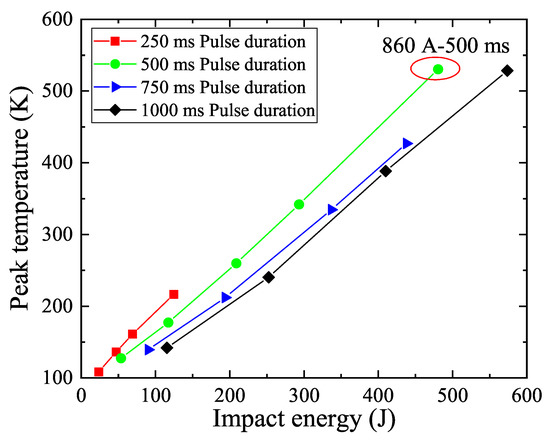
Figure 7.
Peak temperature of the HTS tape, calculated by the peak resistance, as a function of the impact energy. The pulse durations of 250 ms, 500 ms, 750 ms and 1000 ms are compared. The peak temperature value of a supplementary experiment in the red circle will be discussed later.
Figure 8 shows the temperature change as a function of time during the recovery process, which is calculated by Equation (4) using the iterative method of time steps. The temperature dependence of the convection coefficient and the heat capacity of the tape were taken into account. The recovery time can be recognized as the time needed for the temperature to drop from the peak value to 90 K as shown in red dotted line in the Figure 8, which is the critical temperature of the tape. As shown in Figure 8, for any impact energy, the temperature decreases with time at varying rates. The temperature decrease was faster at above 120 K; however, it was boosted below 120 K, during the recovery process. This can be explained by the fact that the heat exchange process is dominated by film cooling at higher temperatures. The gas film hinders the heat exchange between the liquid nitrogen and the tape in the film boiling state, so the heat transfer coefficient of film boiling at higher temperatures is smaller than that of nucleate boiling at lower temperatures. Moreover, the heat capacity of stabilizers and substrates decreases with temperatures, which increases their sensitivity to temperature. The recovery time can be extracted as the cross points of the curves with the horizontal axis for further discussions.
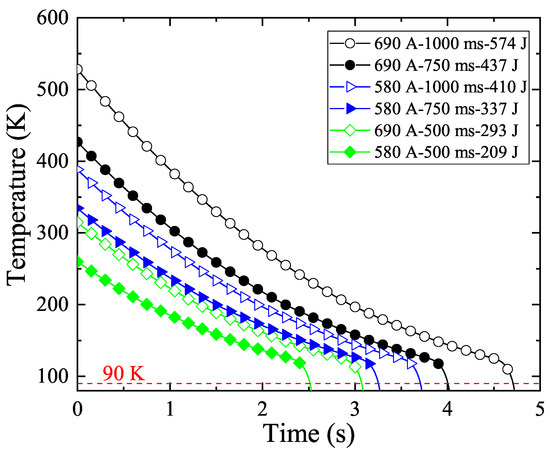
Figure 8.
Curves of temperature asa function of time in the recovery process, calculated by the peak temperature. Different recovery processes are compared when the impact energy is 209 J, 293 J, 337 J, 410 J, 437 J and 574 J.
Figure 9 presents the recovery time calculated by solving Equations (1)–(5) assuming that the quench process is adiabatic. The calculated values are compared with experiments. As shown in Figure 9, the curves of recovery time with impact energy almost overlap for different pulse durations, which demonstrates that the recovery time is mainly determined by the impact energy. This observation holds for either the experimental or calculated results. However, there exists a large deviation of the calculated curves from the experimental ones. As marked in Figure 9, the calculated recovery time was generally overestimated by 2 s. This error results from the ideal assumption that the quench process is adiabatic. However, heat exchange during the quench process should not be neglected; in fact, a common observation is that quench cannot be triggered, when the impact energy is not large enough and the heat exchange rate between the tape and liquid nitrogen is relatively fast.
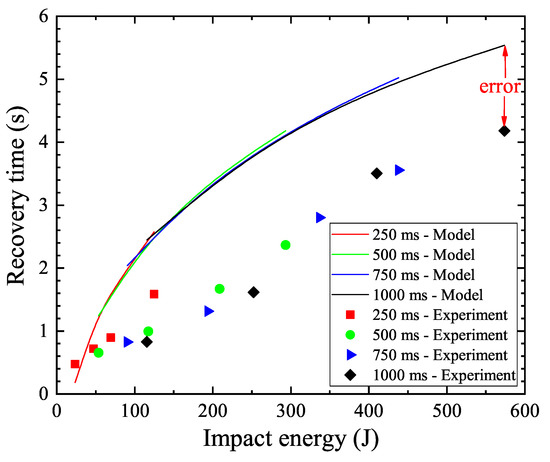
Figure 9.
Calculated recovery time compared with the experimental results. Lines and dotted lines represent the calculated and experimental results, respectively. The recovery time is calculated from impact energy throughout the quench and recovery processes.
Figure 10 presents results calculated using the modified model by solving Equations (4) –(6). The peak temperatures obtained from Figure 7 were used as initial conditions instead of considering the quench process. As shown in Figure 10, the calculated and experimental results are in good agreement, which validates the numerical model. Similar to Figure 9, the calculated results show clear trends that the impact energy dominates recovery time; however, unlike Figure 9, the pulse duration does play a role as well. The shorter the pulse duration, the larger the recovery time, which can be explained by the fact that the loss dissipation time during quench is shorter for shorter pulse durations. The peak temperature as a function of the impact energy in Figure 8 shows equivalent trends, correspondingly.
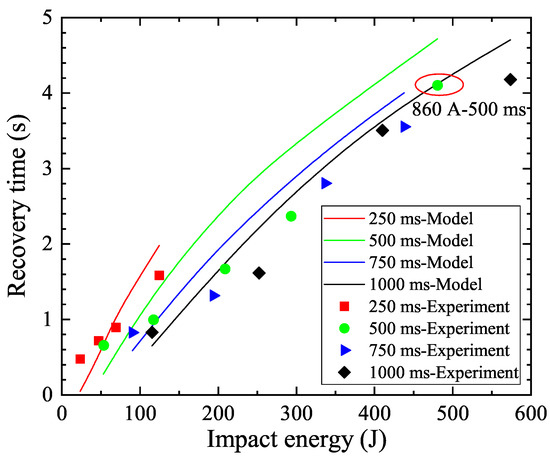
Figure 10.
Calculated recovery time compared with experimental results. Lines and dotted lines represent calculated and experimental results, respectively. The recovery time is calculated from the measured peak resistance during the recovery process. The recovery time of a supplementary experiment in the red circle will be discussed later.
As mentioned in Section 3, the sample was irreversibly damaged by delamination under an impact current of 690 A and pulse duration of 1000 ms. The occurrence of such damage is considered to be directly related to the peak temperature. A supplementary experiment using an impact current of 860 A and pulse duration of 500 ms was carried out as marked in Figure 6, Figure 7 and Figure 10. This sample was also damaged. As shown in Figure 7, the peak temperatures of the two damaged samples were both around 530 K. This observation is consistent with [40,41,42]. In other words, this threshold temperature determines the possibility of recovery. When the impact energy is large enough to increase the temperature of the HTS tape to around 530 K, the tape will be delaminated or damaged.
As discussed above, the validity of the model has been justified by the agreement between the experimental and calculated results. In the literature, factors that influence the recovery time were reported. For example, Pavol suggested lowering the thermal capacity/wetted surface ratio of the tape to accelerate recovery and demonstrated the effect in a numerical simulation [34,43]. Hellmann also reported that surfaces with a macroscopic texture and increased lamination thickness can achieve a higher heat flux to surrounding coolants [44]. Furthermore, Maeda found that recovery characteristics were much improved by pressurization of liquid nitrogen [27]. Based on the developed model proposed in this work, the influence of different factors on the quench recovery time can be investigated or predicted in a more simple and effective way. Next, the geometry of the tape will be discussed; moreover, the impact energy that can result in irreversible damage of the tape will be predicted.
Figure 11 shows the calculated recovery time as a function of the impact energy for tapes of different widths. The tape would be damaged when the impact energy was 500 J and the width of tape was 4 mm. Generally, the recovery time increases with impact energy at similarly for different tape widths. The wider the tape, the shorter the recovery time. This can be understood by the fact that wider tapes posses a larger area of heat exchange. In addition, the extra width of the tape acts as a thermal sink and the peak temperature is lowered. This suggests that incorporating wider metallic coats into an HTS tape can be effective at increasing the speed of recovery.
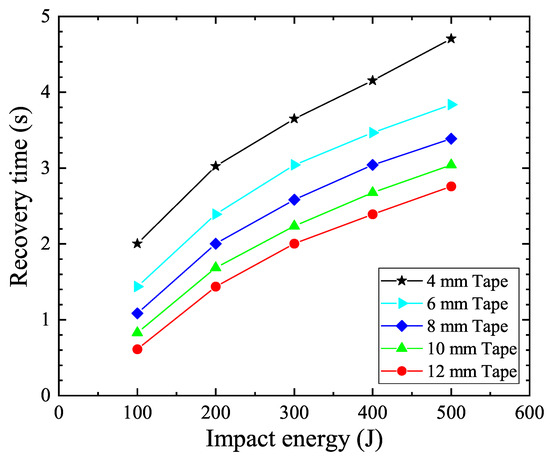
Figure 11.
The recovery time as a function of impact energy when the unilateral thickness of the copper layer is constant at 75 μm and the width of the tape is 4 mm, 6 mm, 8 mm, 10 mm and 12 mm.
The influence of the thickness of copper stabilizers was also investigated by the model and cross-validated with results in the literature. Calculated results of peak temperatures with impact energy were compared for HTS tapes with different thicknesses of stabilizers in Figure 12. Peak temperatures show a linear trend with impact energy, and the slope decreases with increasing thickness of copper. The reason for this is that thick copper stabilizers act as thermal sink and contribute to an enthalpy increase.
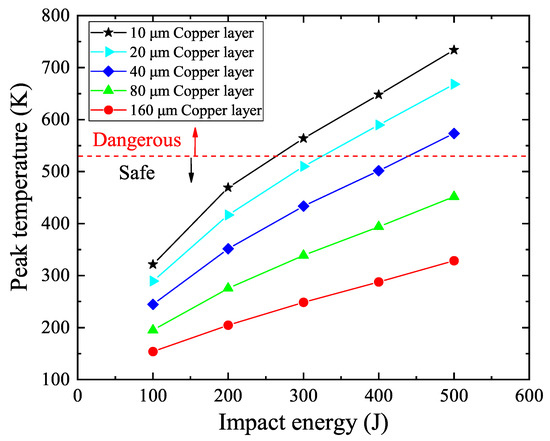
Figure 12.
The peak temperature as a function of the impact energy when the width of the tape is constant at 4.8 mm and the unilateral thickness of the copper layer in the tape is 10 μm, 20 μm, 40 μm, 80 μm and 160 μm.
As mentioned above, the HTS tape can be irreversibly damaged when the peak temperature exceeds 530 K. From Figure 12, the safe margin of impact energies can be identified for different types of tapes. For example, the stabilizer has to be thicker than 40 μm when an impact energy of 500 J is applied.
Based on the peak temperature, the recovery time as a function of the impact energy was calculated for different copper thicknesses, as shown in Figure 13. Interestingly, unlike the peak temperature, the recovery time decreases with increasing copper thickness, particularly for large impact energies. For thinner tapes, the peak temperature is higher, but the heat capacity is smaller; as a result, the cooling efficiency of thinner tapes is much improved. This observation is consistent with results reported in [34]. The results suggest that thinner tapes, despite being more easily damaged, help to reduce recovery time.
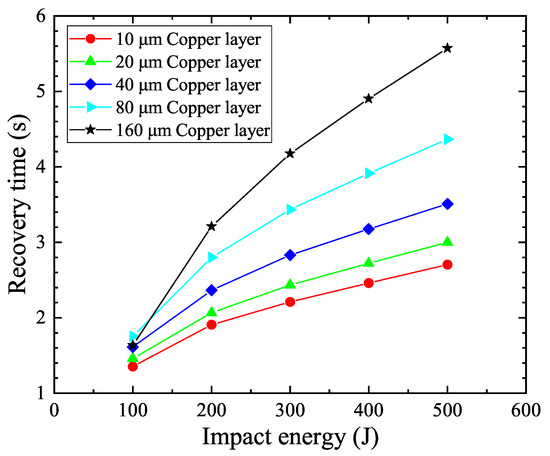
Figure 13.
Curves of the recovery time as a function of impact energy when the width of the tape is constant at 4.8 mm and the unilateral thickness of the copper layer in the tape is 10 μm, 20μm, 40 μm, 80 μm and 160 μm.
To provide a more intuitive picture of the analysis, a two dimensional contour plot is shown in Figure 14. The two axes represent width and thickness of the tape. The contour lines represent when the margin temperature 530 K is reached. The three lines in Figure 14 represent the safety margin of the tape when the impact energy is 300 J, 400 J and 500 J. For example, when the impact energy is 500 J, tapes with geometry size below the black line are probably damaged. Below the 530 K contour line is the predicted dangerous zone where the tape will be damaged, and above is the predicted safe zone. It is not difficult to see that as the impact energy increases, the zone regarding the width and thickness of the tape increases. The result shows that selecting the appropriate width and thickness of the tape in the safe zone according to different impact energies can avoid damage to the tape.
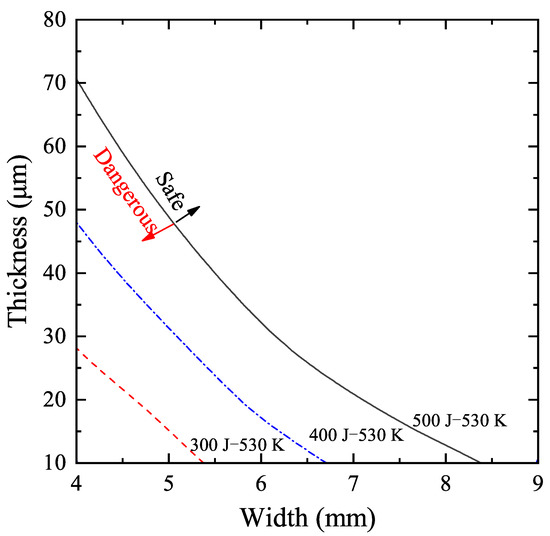
Figure 14.
Curves of the 530 K temperature contour as a function of the width of the tape and the thickness of the copper layer in the tape when the impact energy is 300 J, 400 J and 500 J.
6. Conclusions
In this work, quench recovery characteristics of a high-temperature superconducting (HTS) tape were investigated experimentally and numerically. The resistivity of an HTS tape was measured throughout the quench and recovery processes. The influence of the impact current on the recovery time was discussed in detail. Correspondingly, a numerical model was developed with temperature-dependent material properties taken into account. The calculated recovery time fit well with experimental results, which justified effectiveness of the model. The model also suggested that the previous adiabatic assumption for the quench process was not proper since it could produce obvious error to the calculated values in the recovery time. Besides, impact energy margin that could result in irreversible damage of HTS tapes were calculated and validated by repeatedly damaging experiments. Based on the model, the influences of the geometry of the tape on quench recovery time and the margin of impact energy that may damage the tape were discussed. Further study can be done to improve the model by including dynamic boundary conditions to describe the quench process.
Author Contributions
Data curation, H.J.; Methodology, P.S. and T.Q.; Project administration, J.Z.; Writing—original draft, W.C.; Writing—review and editing, S.Z. All authors have read and agreed to the published version of the manuscript.
Funding
This research was funded by the National Natural Science Foundation of China under Grant No. 51807192 and China State Grid Corporation Science and Technology Project under Grant DG71-18-004.
Acknowledgments
The authors would like to thank Beijing Jiaotong University Applied Superconducting Technology Research Center for their kind support in experiment and Shutong Deng for helpful comments.
Conflicts of Interest
The authors declare no conflict of interest.
References
- Bayindir, R.; Colak, I.; Fulli, G.; Demirtas, K. Smart grid technologies and applications. Renew. Sustain. Energy Rev. 2016, 66, 499–516. [Google Scholar] [CrossRef]
- Hossain, M.; Madlool, N.; Rahim, N.; Selvaraj, J.; Pandey, A.; Khan, A.F. Role of smart grid in renewable energy: An overview. Renew. Sustain. Energy Rev. 2016, 60, 1168–1184. [Google Scholar] [CrossRef]
- Kakran, S.; Chanana, S. Smart operations of smart grids integrated with distributed generation: A review. Renew. Sustain. Energy Rev. 2018, 81, 524–535. [Google Scholar] [CrossRef]
- Pueschel, T. DC-powered office buildings and data centres: The first 380 VDC micro grid in a commercial building in germany. In Proceedings of the 2018 International Power Electronics Conference (IPEC-Niigata 2018-ECCE Asia), Niigata, Japan, 20–24 May 2018; pp. 190–195. [Google Scholar]
- Yoldaş, Y.; Önen, A.; Muyeen, S.; Vasilakos, A.V.; Alan, İ. Enhancing smart grid with microgrids: Challenges and opportunities. Renew. Sustain. Energy Rev. 2017, 72, 205–214. [Google Scholar] [CrossRef]
- Loder, D.C.; Bollman, A.; Armstrong, M.J. Turbo-electric distributed aircraft propulsion: Microgrid architecture and evaluation for ECO-150. In Proceedings of the 2018 IEEE Transportation Electrification Conference and Expo (ITEC), Long Beach, CA, USA, 13–15 June 2018; pp. 550–557. [Google Scholar]
- Jin, Z.; Sulligoi, G.; Cuzner, R.; Meng, L.; Vasquez, J.C.; Guerrero, J.M. Next-generation shipboard dc power system: Introduction smart grid and dc microgrid technologies into maritime electrical netowrks. IEEE Electrif. Mag. 2016, 4, 45–57. [Google Scholar] [CrossRef]
- Garcia, W.R.L.; Tixador, P.; Raison, B.; Bertinato, A.; Luscan, B.; Creusot, C. Technical and economic analysis of the R-type SFCL for HVDC grids protection. IEEE Trans. Appl. Supercond. 2017, 27, 2739642. [Google Scholar]
- Zhang, Y.; Dougal, R.A. State of the art of fault current limiters and their applications in smart grid. In Proceedings of the 2012 IEEE Power and Energy Society General Meeting, San Diego, CA, USA, 22–26 July 2012. [Google Scholar]
- Angioni, A.; Shang, J.; Ponci, F.; Monti, A. Real-time monitoring of distribution system based on state estimation. IEEE Trans. Instrum. Meas. 2016, 65, 2234–2243. [Google Scholar] [CrossRef]
- McGuckin, P.; Burt, G. Overview and assessment of superconducting technologies for power grid applications. In Proceedings of the 2018 53rd International Universities Power Engineering Conference (UPEC), Glasgow, Scotland, 4–7 September 2018. [Google Scholar]
- Kim, H.; Lee, J.Y.; Kim, H.R.; Yang, S.E.; Yu, S.D.; Kim, W.S.; Hyun, O.B.; Ko, J.; Yeom, H. An effect of HTS wire configuration on quench recovery time in a resistive SFCL. IEEE Trans. Appl. Supercond. 2013, 23, 5604104. [Google Scholar]
- Nam, K.; Kang, H.; Lee, C.; Ko, T.K.; Seok, B.Y. Visualization study on boiling of nitrogen during quench for fault current limiter applications. IEEE Trans. Appl. Supercond. 2006, 16, 727–730. [Google Scholar] [CrossRef]
- Sun, J.; Du, J.; Li, Y.; Mo, S.; Cai, Y.; Yuan, W.; Ma, T. Design and Performance Test of a 20-kV DC Superconducting Fault Current Limiter. IEEE Trans. Appl. Supercond. 2020, 30, 2963410. [Google Scholar] [CrossRef]
- Lee, H.Y.; Asif, M.; Park, K.H.; Lee, B.W. Feasible Application Study of Several Types of Superconducting Fault Current Limiters in HVDC Grids. IEEE Trans. Appl. Supercond. 2018, 28, 5601205. [Google Scholar] [CrossRef]
- Li, B.; Wang, C.; Wei, Z.; Xin, Y.; Li, B.; He, J. Technical requirements of the DC superconducting fault current limiter. IEEE Trans. Appl. Supercond. 2018, 28, 5602805. [Google Scholar] [CrossRef]
- Jiang, Z.; Wang, Y.; Dai, S.; Ma, T.; Yuan, X.; Liu, M.; Chen, H.; Wang, M.; Peng, C. Application and design of resistive SFCL in ±160 kV MMC-HVdc system. IEEE Trans. Appl. Supercond. 2019, 29, 5603505. [Google Scholar] [CrossRef]
- Hayakawa, N.; Maeno, Y.; Kojima, H. Fault current limitation coordination in electric power grid with superconducting fault current limiters. IEEE Trans. Appl. Supercond. 2018, 28, 5602304. [Google Scholar] [CrossRef]
- Hong, Z.; Sheng, J.; Yao, L.; Gu, J.; Jin, Z. The structure, performance and recovery time of a 10 kV resistive type superconducting fault current limiter. IEEE Trans. Appl. Supercond. 2012, 23, 5601304. [Google Scholar] [CrossRef]
- Qiu, Q.; Xiao, L.; Zhang, J.; Zhang, Z.; Song, N.; Jing, L.; Zha, W.; Du, X.; Teng, Y.; Zhou, Z.; et al. Design and Test of 40-kV/2-kA DC Superconducting Fault Current Limiter. IEEE Trans. Appl. Supercond. 2020, 30, 2988068. [Google Scholar] [CrossRef]
- Dai, S.; Ma, T.; Xue, C.; Zhao, L.; Huang, Y.; Hu, L.; Wang, B.; Zhang, T.; Xu, X.; Cai, L.; et al. Development and test of a 220 kV/1.5 kA resistive type superconducting fault current limiter. Phys. C Supercond. Its Appl. 2019, 565, 1253501. [Google Scholar] [CrossRef]
- Kempski, A.; Rusiński, J.; Hajdasz, S. Analysis of recovery time of HTS tapes with electrical insulation layers for superconducting fault current limiters under load conditions. IEEE Trans. Appl. Supercond. 2019, 29, 5603910. [Google Scholar] [CrossRef]
- Zha, W.; Qiu, Q.; Cao, S.; Wang, H. Quench and Recovery Characteristics of Solenoid and Pancake SFCLs Under DC Impact Current. IEEE Trans. Appl. Supercond. 2019, 30, 5600106. [Google Scholar] [CrossRef]
- Lim, S.H.; Lim, S.T. Current Limiting and Recovery Characteristics of a Trigger-Type SFCL Using Double Quench. IEEE Trans. Appl. Supercond. 2018, 28, 5601305. [Google Scholar] [CrossRef]
- Baldan, C.A.; Shigue, C.Y.; Guedes, L.C.; Bernardes, A.A.; Ruppert, E. Recovery tests of an hybrid current limiter composed of a SFCL in parallel to an air-core power reactor. J. Supercond. Nov. Magn. 2015, 28, 691–695. [Google Scholar] [CrossRef]
- Lai, L.; Gu, C.; Yue, Y.; Chen, S.; Song, M.; Hu, N.N.; Qu, T.; Zou, S. Characterization of I c Degradation in Bent YBCO Tapes. IEEE Trans. Appl. Supercond. 2019, 29, 9001505. [Google Scholar] [CrossRef]
- Maeda, C.; Yanai, S.; Shirai, Y.; Shiotsu, M.; Honda, G.; Isojima, S. Recovery Characteristics of GdBCO Tape in a Pressurized Liquid Nitrogen for a Resistive SFCL. IEEE Trans. Appl. Supercond. 2019, 29, 5602505. [Google Scholar] [CrossRef]
- Jiang, Z.; Wang, Y.; Dai, S.; Ma, T.; Peng, C.; Liu, M.; Chen, H. Influence of Insulation on Quench and Recovery of YBCO Tape Under DC Impact. IEEE Trans. Appl. Supercond. 2018, 29, 7700305. [Google Scholar] [CrossRef]
- Xiang, B.; Junaid, M.; Gao, L.; Liu, Z.; Geng, Y.; Wang, J.; Yanabu, S. Influencing Factors on Quench and Recovery of YBCO Tapes for DC Superconducting Fault Current Limiter. IEEE Trans. Appl. Supercond. 2018, 29, 5600806. [Google Scholar] [CrossRef]
- Du, H.I. Evaluation on Resistance Tendency and Recovery Characteristics of 2G Wire With Insulation Layer. IEEE Trans. Appl. Supercond. 2013, 23, 6602004. [Google Scholar]
- Xiang, B.; Junaid, M.; Gao, L.; Liu, Z.; Geng, Y.; Wang, J.; Yanabu, S. Effects of Short Circuit Currents on Quench and Recovery Properties of YBCO Tapes for DC SFCL. IEEE Trans. Appl. Supercond. 2018, 29, 5600706. [Google Scholar] [CrossRef]
- Wang, Y.; Chan, W.K.; Schwartz, J. Self-protection mechanisms in no-insulation (RE) Ba2Cu3O x high temperature superconductor pancake coils. Supercond. Sci. Technol. 2016, 29, 045007. [Google Scholar] [CrossRef]
- Wang, Y.; Weng, F.; Li, J.; Šouc, J.; Gömöry, F.; Zou, S.; Zhang, M.; Yuan, W. No-Insulation High-Temperature Superconductor Winding Technique for Electrical Aircraft Propulsion. IEEE Trans. Transp. Electrif. 2020, 6, 1613–1624. [Google Scholar] [CrossRef]
- Usak, P.; Mozola, P. How to Speed Up Y–Ba–Cu–O Tape Recovery. IEEE Trans. Appl. Supercond. 2013, 23, 4701011. [Google Scholar] [CrossRef]
- Zou, S.; Zermeño, V.; Baskys, A.; Patel, A.; Grilli, F.; Glowacki, B. Simulation and experiments of stacks of high temperature superconducting coated conductors magnetized by pulsed field magnetization with multi-pulse technique. Supercond. Sci. Technol. 2016, 30, 014010. [Google Scholar] [CrossRef]
- Ekin, J.W.; Zimmerman, G.O. Experimental Techniques for Low-Temperature Measurements: Cryostat Design, Material Properties, and Superconductor Critical-Current Testing. Phys. Today 2007, 60. [Google Scholar] [CrossRef]
- Ye, L.; Juengst, K.-P. Modeling and simulation of high temperature resistive superconducting fault current limiters. IEEE Trans. Appl. Supercond. 2004, 14, 839–842. [Google Scholar] [CrossRef]
- de Sousa, W.T.B.; Näckel, O.; Noe, M. Transient simulations of an air-coil SFCL. IEEE Trans. Appl. Supercond. 2014, 24, 5601807. [Google Scholar] [CrossRef]
- Matula, R.A. Electrical resistivity of copper, gold, palladium, and silver. J. Phys. Chem. Ref. Data 1979, 8, 1147–1298. [Google Scholar] [CrossRef]
- Ariyama, T.; Takagi, T.; Nakayama, D.; Sasaki, E.; Takao, T.; Tsukamoto, O.; Matsuoka, T. Quench protection of YBCO coils: Co-winding detection method and limits to hot-spot temperature. IEEE Trans. Appl. Supercond. 2016, 26, 4702205. [Google Scholar] [CrossRef]
- Ariyama, T.; Takagi, T.; Takao, T.; Tsukamoto, O.; Matsuo, R.; Matsuda, N. Study on hot-spot temperature limits for YBCO epoxy-impregnated coil to be safe from damages caused by quenches. IEEE Trans. Appl. Supercond. 2016, 27, 4600504. [Google Scholar] [CrossRef]
- Ishiyama, A.; Arai, M.; Momotari, H.; Wang, X.; Ueda, H.; Saito, T.; Aoki, Y.; Yagi, M.; Machi, T.; Fujiwara, N. Degradation of YBCO coated conductors due to an over-current pulse. IEEE Trans. Appl. Supercond. 2010, 21, 3025–3028. [Google Scholar] [CrossRef]
- Kim, H.R.; Park, C.R.; Yim, S.W.; Yu, S.D.; Hyun, O.B. Recovery characteristics of coated conductors. IEEE Trans. Appl. Supercond. 2010, 20, 2194–2198. [Google Scholar]
- Hellmann, S.; Noe, M. Influence of different surface treatments on the heat flux from solids to liquid nitrogen. IEEE Trans. Appl. Supercond. 2013, 24, 0501605. [Google Scholar] [CrossRef]


Publisher’s Note: MDPI stays neutral with regard to jurisdictional claims in published maps and institutional affiliations. |
© 2021 by the authors. Licensee MDPI, Basel, Switzerland. This article is an open access article distributed under the terms and conditions of the Creative Commons Attribution (CC BY) license (http://creativecommons.org/licenses/by/4.0/).