1. Introduction
The industrial control system (ICS) consists of devices, networks, and controllers to automate industrial processes. ICS contains several types of control systems, such as supervisory control and data acquisition (SCADA) systems, and distributed control systems (DCSs). ICSs are widely used in different critical infrastructures such as smart grids, power distribution, transportation systems, water treatment plants, and manufacturing [
1,
2]. In the power plants, ICS’s key role is evident, and a multitude of automated systems are operating in a SCADA framework. The automated systems’ entanglements could endanger the entire system’s performance, where a small fault or malfunction would lead to a cascade failure. Thus, fault detection in ICSs, especially in critical infrastructures such as large-scale power plants, has attracted much attention in recent years [
3,
4,
5,
6].
Generally, communication between ICS components is based on an information technology stack (ITS) and remote connectivity. The reliance on communication networks to transmit measurements could increase the possibility of intentional attacks against physical plants. Conventionally, network traffic is secured by mechanisms such as authentication, data encryption, and message integrity techniques. However, these methods cannot completely protect the entire levels of an ICS network against a wide range of malicious activities.
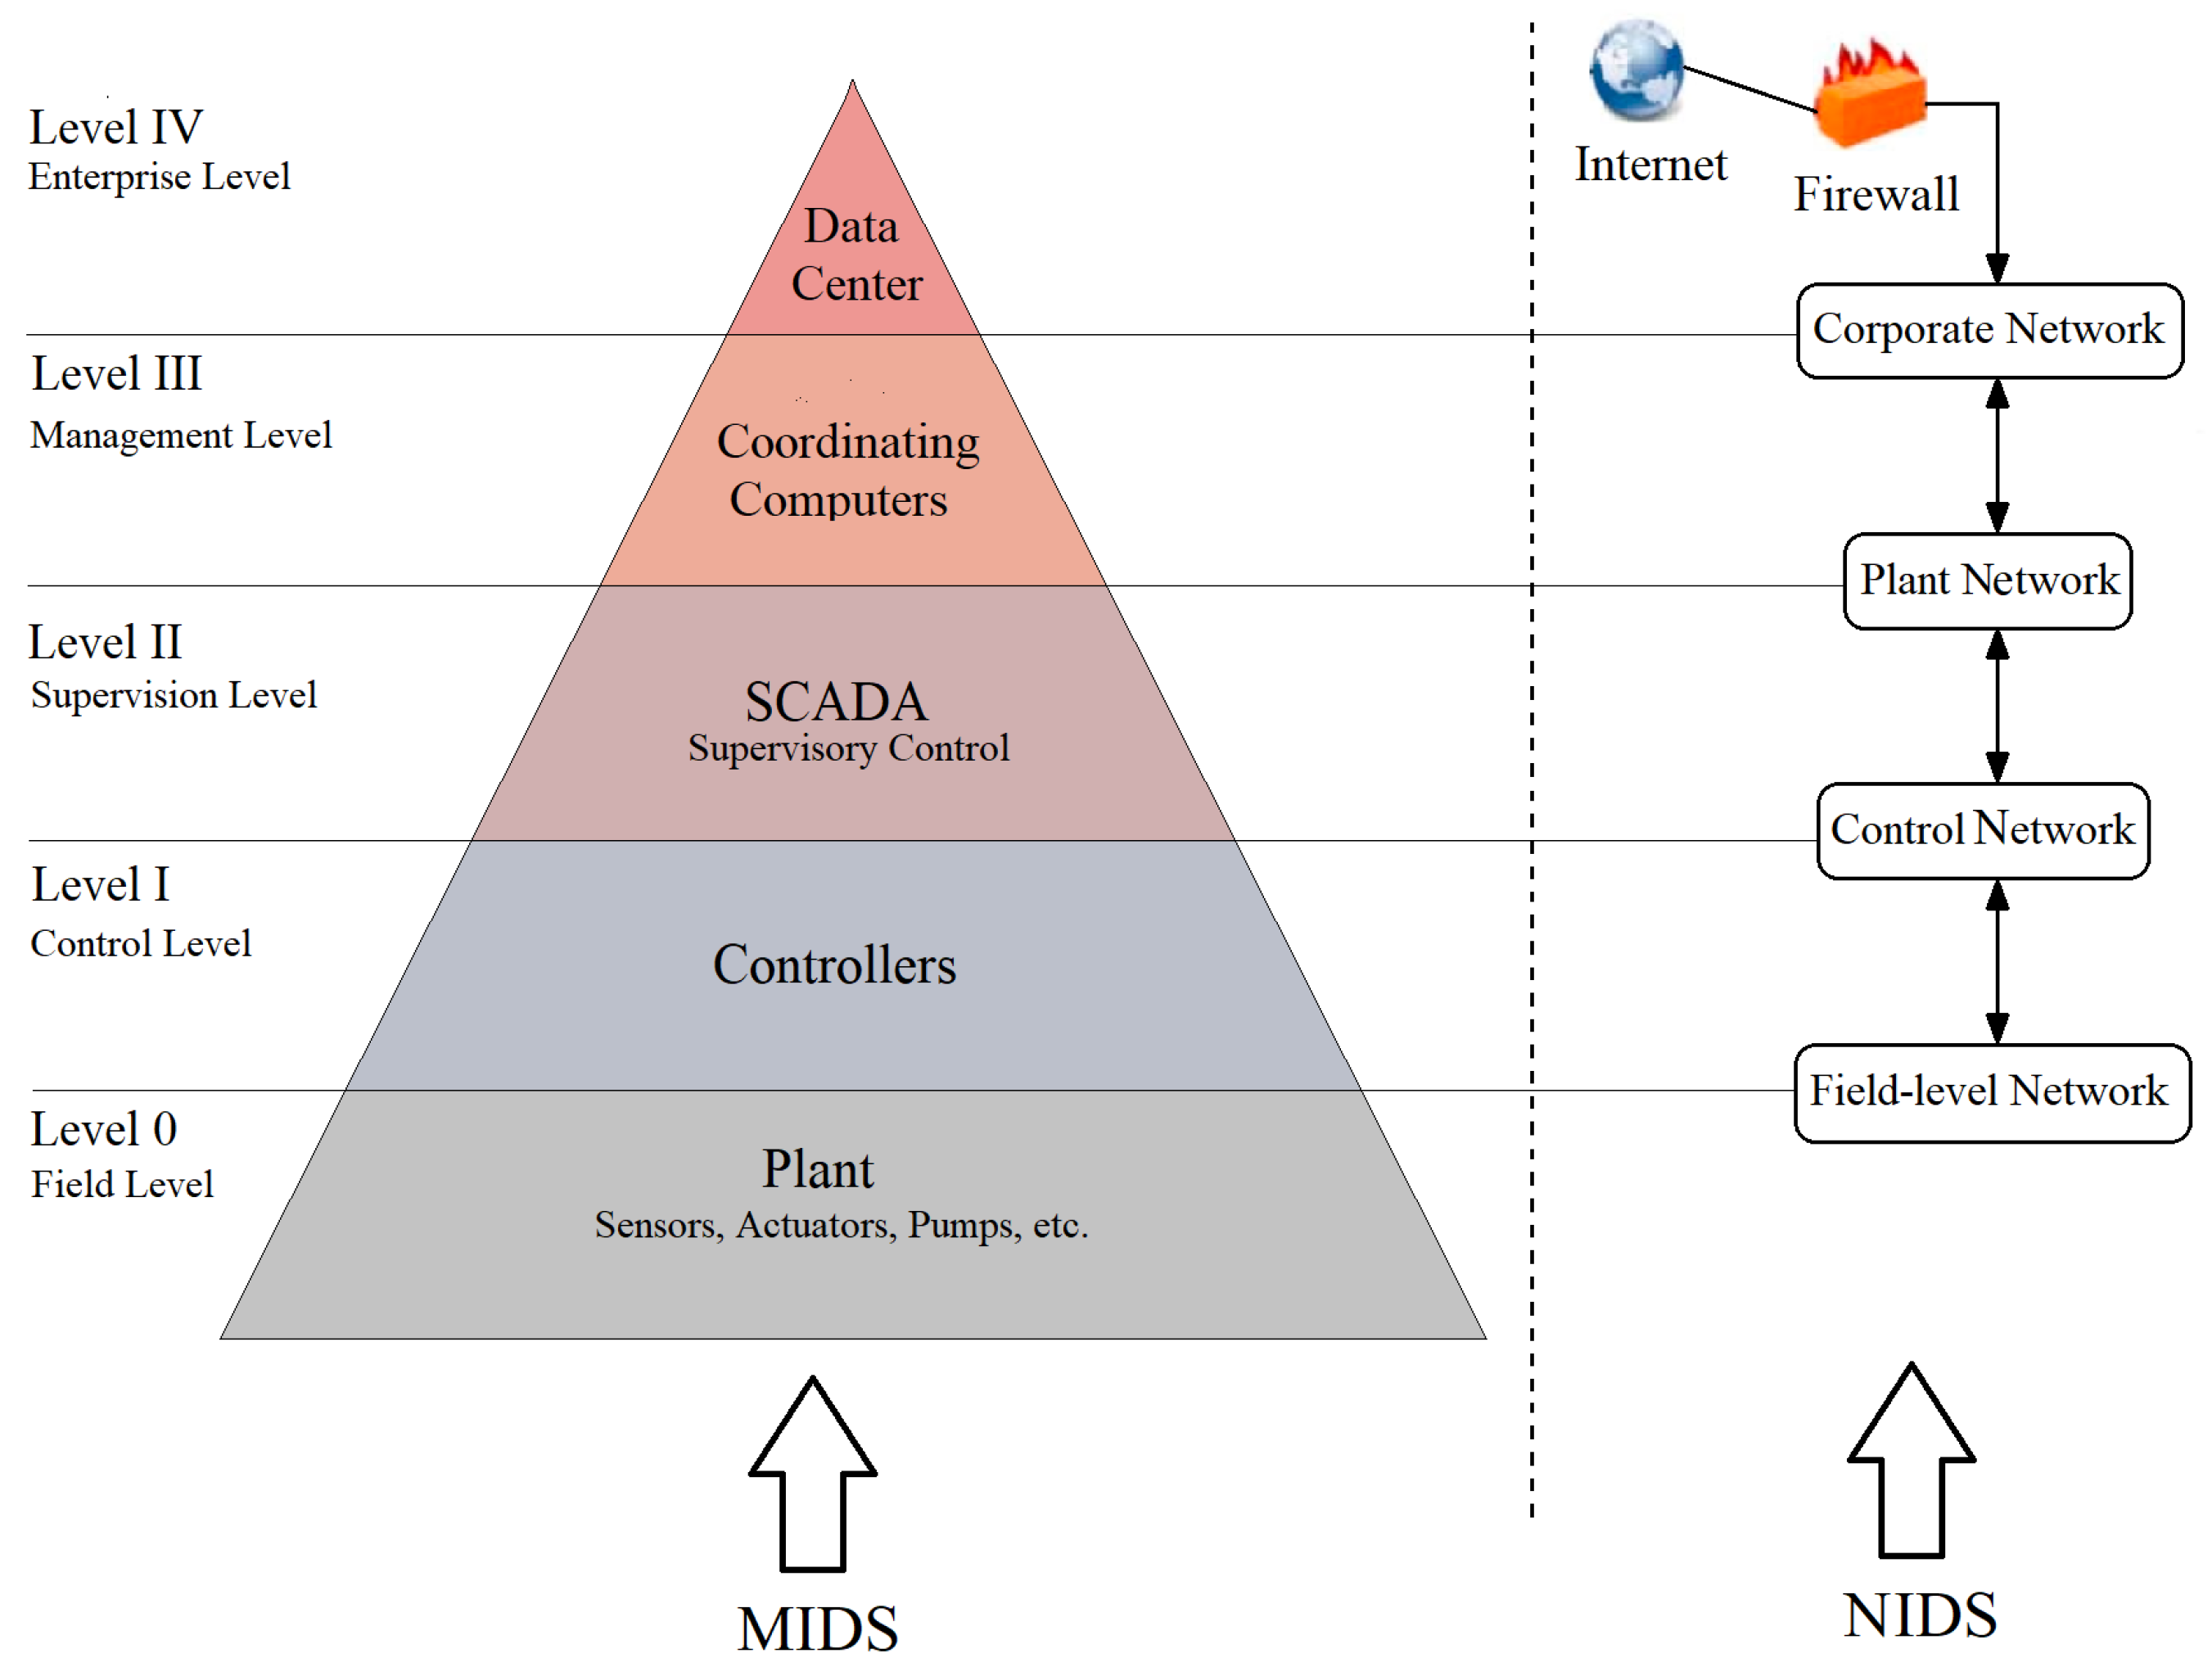
Figure 1 illustrates the five distinct levels of an ICS architecture. These conventional mechanisms try to secure the network traffic transmitting between ICS levels and do not investigate the compatibility of the physical plant measurements. This makes the system vulnerable against malicious activities such as insider sabotages, spoofing, and stealthy attacks [
7]. One solution to tackle this problem is the intrusion detection system (IDS). The two main IDS strategies are signature-based and anomaly-based, which differ in their detection mechanisms [
8]. The signature-based strategy trains the system to find specific anomalies while the anomaly-based strategy searches for any deviation from a pre-known normal activity. Generally, IDS investigates the network traffic in an ICS and tries to detect abnormal activities in the transmitting data packets. This strategy, known as the network intrusion detection system (NIDS), monitors the incoming data packets and prevents suspicious data from intruding into the system. Many studies leveraged machine learning algorithms to train a NIDS model, which is responsible for detecting attacks in the network traffic [
9,
10,
11]. Although the NIDS effectively qualifies and quantifies attacks by analyzing the amount and types of attacks in the network flow, its performance against encrypted data packets, faked IP packets, and regular false positive alerts is not guaranteed.
On the other hand, the measurement intrusion detection system (MIDS) instead of monitoring the network traffic, investigates suspicious activities in the system’s measurement data. As shown in
Figure 1, the MIDS does not interact with the connections between the ICS levels, but directly inspect the measurement data in the system. This fault detection approach can find any deviation from normal performance caused by malicious activities such as changing the sensors setpoints or injecting fake data measurements into the ICS network levels. Since, in an ICS, the SCADA system (Level II) collects the data from the entire system, the MIDS can be embedded in this system’s level. In comparison to the NIDS method, a few studies tried to use machine learning algorithms for training a fault detection model. Choi et al. [
12] presented an IDS based on voltage measurement data to detect in-vehicle controller area network (CAN) intrusions using inimitable characteristics of electrical signals. Their approach is well designed to detect bus-off attacks [
13] and performs very well to secure an in-vehicle CAN. However, relying on only one type of variable to detect suspicious activities in the system caused a high rate of false positives in the IDS. In [
14], Pan et al. introduced an IDS strategy leveraging features of signature-based and specification-based detection methods which protects an electrical power transmission line from attacks. They used data from relay, network security logs, and energy management system (EMS) logs. Their method could accurately distinguish malicious activities from normal control operations. However, their proposed algorithm requires a large number of captured data scenarios, which is difficult to acquire. In another study, Ozay et al. [
15] proposed an attack detection model employing state vector estimation (SVE) to detect false data injection at the physical layer of a smart grid. They showed that the model performs accurately on various IEEE test systems in detection of abnormal behaviors; however, it cannot detect the stealthy malicious activities properly.
Basically, due to the difficulties in generating a labeled dataset, which indicates different types of attacks in an ICS, most studies apply a normal activity dataset for training machine learning models. Therefore, the MIDS could only compare a set of normal data with the incoming data and detect any deviation from the normal activity. This strategy would fail while a stealthy attack that imitates a normal behavior intrudes into the system. A solution to tackle this problem is generating a labeled dataset that includes different types of attacks to train a machine learning model that is capable of detecting malicious stealthy activities in the system. But, building a labeled dataset consisting attack scenarios means the system should tolerate a set of controlled attack injected to the system, that could lead to a system failure and irreparable damages. Nevertheless, it is possible to simulate the critical infrastructures of an ICS using a hardware-in-the-loop (HIL) to prevent damaging the system. This approach could be sensible while the ICS is a vital infrastructure, and the system’s security is dramatically significant [
16]. The main goal of this paper is to investigate the performance of the MIDS by training machine learning algorithms leveraging a labeled dataset. To this end, we develop an experimental setup in which we can evaluate the effectiveness of fault detection by monitoring the measurement data in an ICS. For this, we employ a power generation testbed whose sensors’ values are measured over several days. Different scenarios of attacks are injected into the system to generate the labeled dataset. The dataset was generated in 2020, available at [
17]. Overall, this work has made the following contributions to the attack detection domain:
(1) Introducing a novel approach which can be integrated to NIDS as a second layer of defense mechanism for intrusion detection using measurement data and improving the security of the ICS system.
(2) Applying the HIL-based augmented ICS (HAI) testbed dataset [
18] for the first time for training a supervised machine learning model to detect intrusions in an ICS. Unlike the previous works [
12,
13,
14,
15], our proposed design is able to detect the stealthy attacks without imposing any threat to the actual system using the advantages of labeled data obtained from the HIL testbed.
(3) Using the measurement data in the all levels of ICS (
Figure 1), which can help to detect not only the sabotages in the communication links between the levels but also the insider sabotages in each level. This particular feature would help to improve the security of the system without any conflict with NIDS.
In addition, we compared different machine learning techniques to find the best learning model for the detection of stealthy attacks in the ICSs. According to the results, the random forest algorithm [
19] has the best performance for the proposed dataset.
Problem Description and Motivation
ICS, including SCADA networks, consists of several parts such as controllers monitored by operators through the human–machine interface (HMI). In critical ICS infrastructures such as power plants, the communication network between parts of the system can be extended over large geographical regions, which perform under virtual private networks (VPN) or the Internet. Although connecting the communication network to the Internet or using remote connections help to have an off-site operation and management of ICS over a vast geographical distance, it puts the system at risk of malicious attacks [
20]. The NIDS is widely employed to detect any kind of abnormal activity in the system’s network flow to defeat these types of attacks. Nevertheless, while the NIDS could address the problem of cyber attacks at a sensible rate of accuracy, these systems are inefficient in detecting insider attacks or any other sabotage inside the system. Furthermore, the NIDS is incapable of detecting encrypted or any other faked data packets, especially stealthy attacks. To address these problems, one solution is investigating the behavior of measurement data instead of monitoring network traffic.
The MIDS is not only capable of detecting any deviation from the normal activity of the ICS, but it is also effective in the detection of stealthy attacks [
21]. The presence of SCADA systems, especially in large-scale ICSs, helps deploy the MIDS without any additional devices; however, the main obstacle in practicing the MIDS is preparing a comprehensive dataset to train a machine learning model. Basically, building an attack dataset for measured data means injecting a malfunction to the system and possibly the whole system’s failure. This could have dramatically high costs when the system is a critical large-scale ICS. Moreover, for each system’s environment, the dataset should be built separately, and it could be extremely expensive. Fortunately, in recent years, development in processing units and computation power has helped to overcome this problem by introducing the HIL technique. This technique stimulates the critical parts of an ICS and injects attacks into the system without any threat to the existing system. Tackling the problem of building a dataset, including real-time attacks, provides a remarkable opportunity for studying the MIDS.
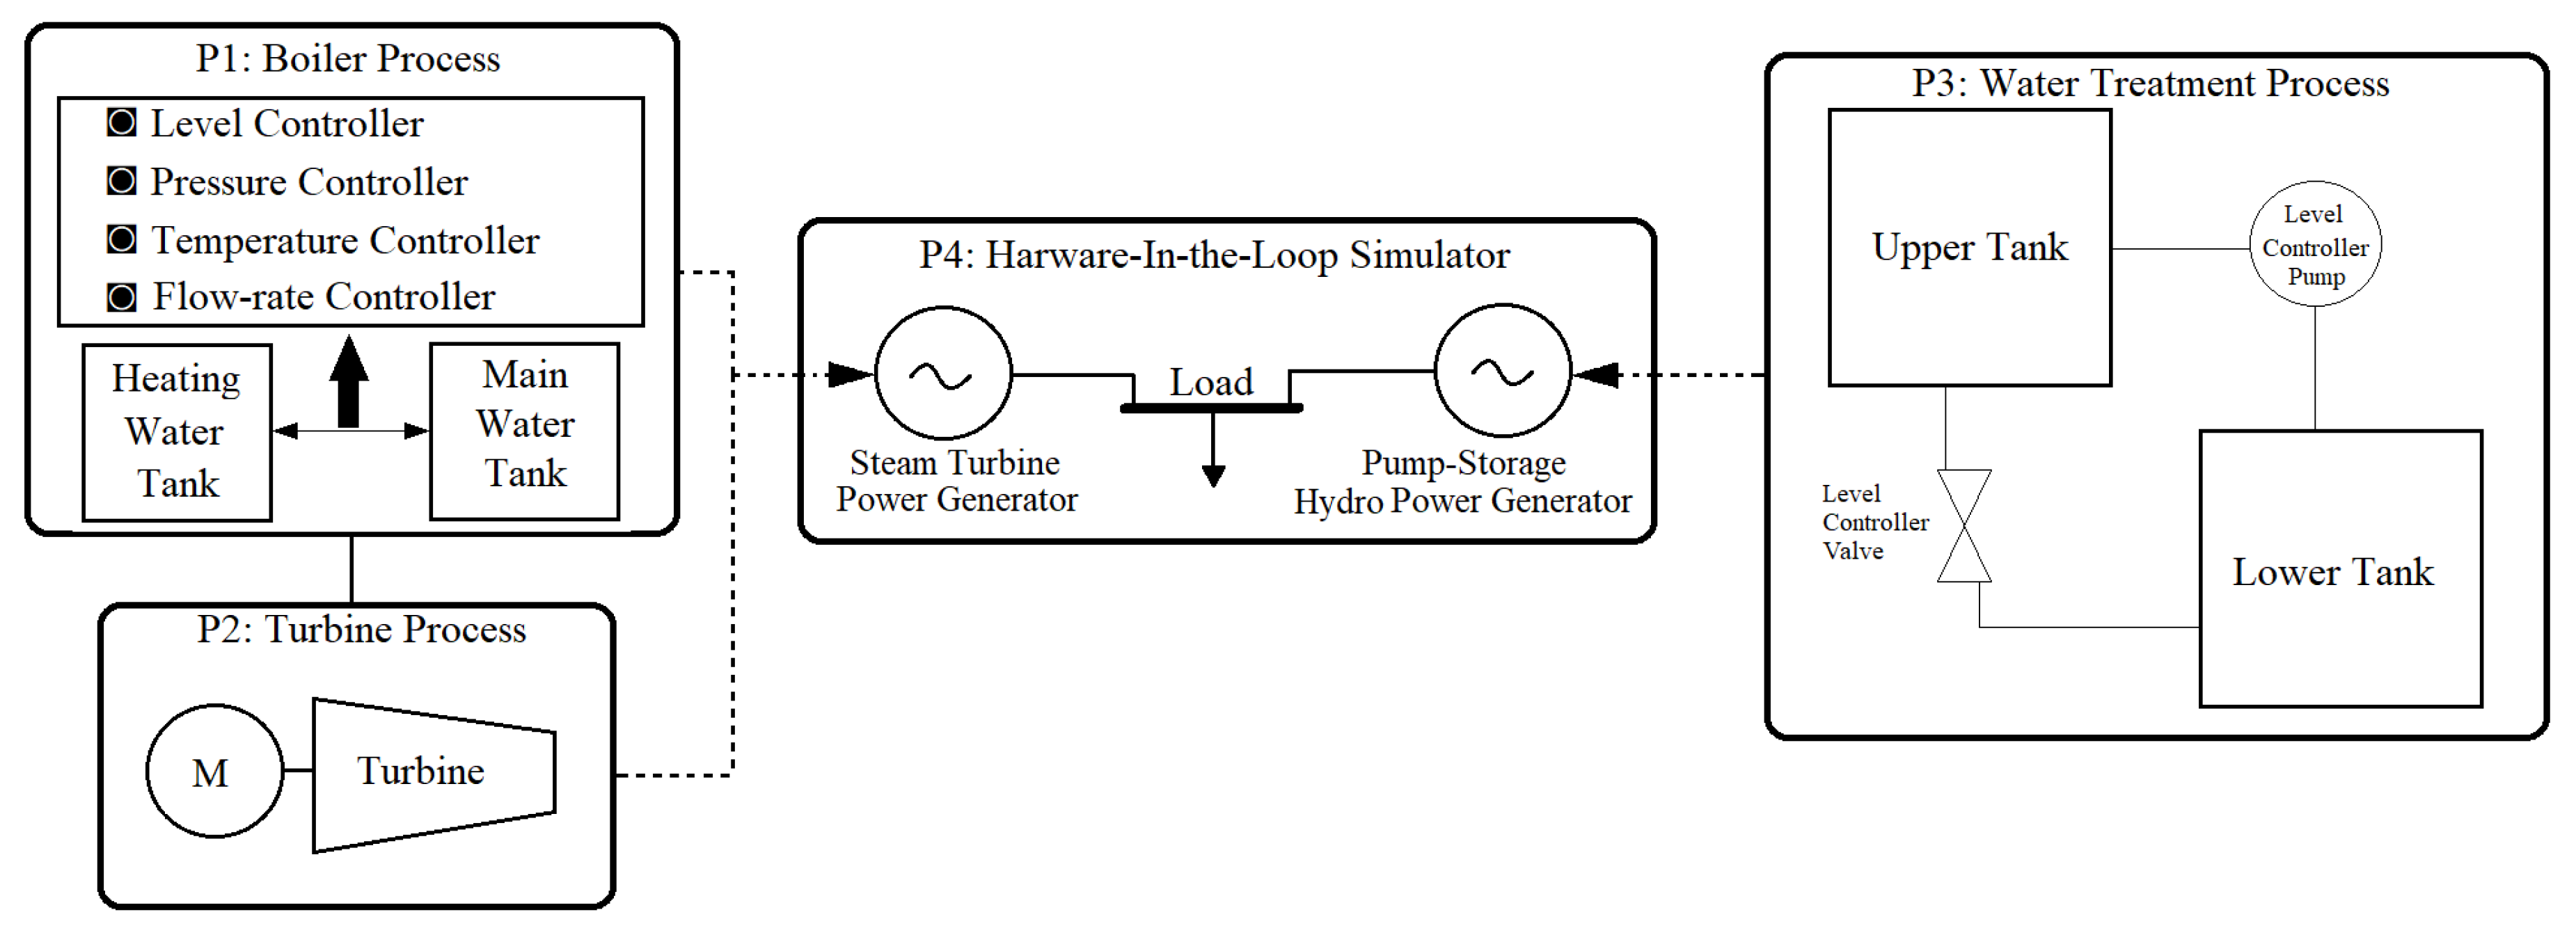
In this study, to investigate the MIDS’s efficiency in ICS fault detection, an electrical power generation testbed is employed, which is wholly explained in
Section 3. The investigation procedure includes pre-processing the data, fitting supervised learning models, and evaluating each model’s classification accuracy. The standard methods of assessing models’ effectiveness are the confusion matrix, the area under the curve (AUC), and the receiver operating characteristics (ROC) curve.
The remainder of the paper is organized as follows. In
Section 2, the methodology for building a machine learning model is described.
Section 3 includes a description of the dataset. The results and discussions of implementing the model on the dataset are proposed in
Section 4.
Section 5 presents the conclusion and future work directions.
2. Methodology
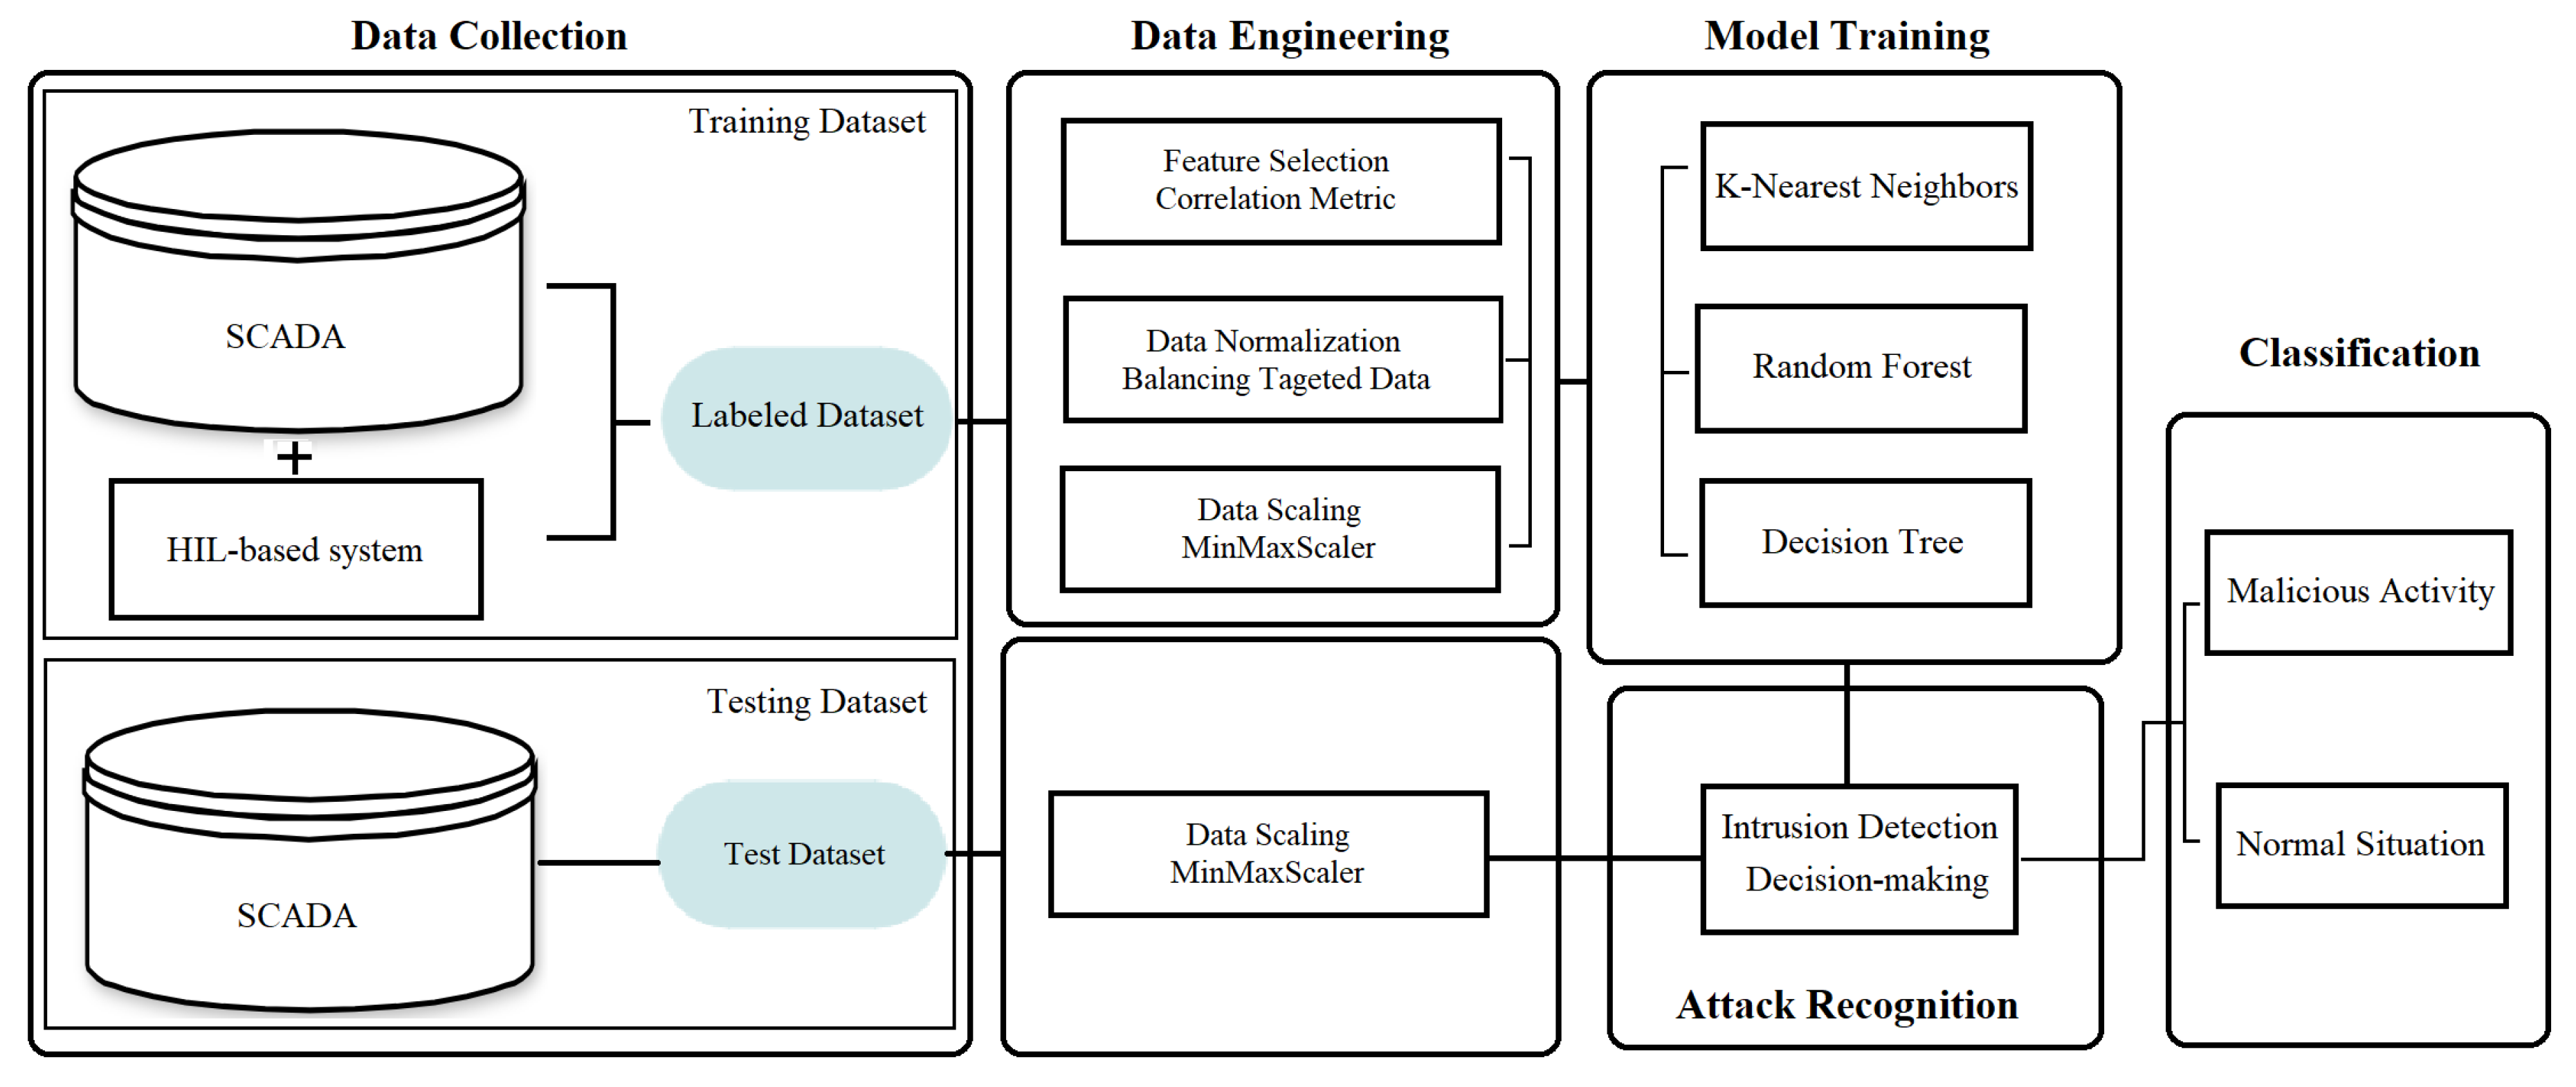
The developed attack detection procedure is described in this section. First, the most significant attacks in the ICSs are introduced; then, the approach to detect these attacks is explained. As shown in
Figure 2, after collecting the data, the most relevant features are selected, and a trained ML model based on the corresponding features classifies the output data.
2.1. Attack Description
Anomaly detection consists of various domains, such as intrusion detection, fault detection, and event detection in sensor networks. Any deviation from a normal performance could be considered an anomaly in an ICS. It could happen due to several reasons, including a malfunction in a system’s component, insider sabotage, or an intentional cyberattack. In this paper, the concept of anomaly detection based on the MIDS refers to fault detection and intrusion detection. When a malfunction or insider sabotage occurs, the MIDS tries to detect faults in the system. In addition, when an attacker attempts to intrude in the system, it is known as intrusion detection.
Anomaly detection in ICSs using the measured data captured by the SCADA system has the privilege of detecting any deviation from a normal activity even if the intrusion is not recognized in the network layer by the NIDS. Evidently, due to a deviation from the system’s normal behavior, detecting a malfunction or a simple attack that directly manipulates the system’s measurement data would not be a challenging task for the MIDS. On the other hand, the main concern about the MIDS effectiveness is its performance in the detection of stealthy attacks. These kinds of attacks occur when an attacker manipulates sensor measurements or control signals persistency by penetrating control networks without being detected until the system crashes. Normally, attackers attempt to imitate the system’s normal behavior to stay undetected. In this paper, not only the MIDS performance in the detection of malfunctions is evaluated, but also a set of stealthy attacks are injected into the system to investigate the MIDS effectiveness in the detection of this type of attack.
2.2. Data Analyzing
The problem of imbalanced datasets in IDS modeling is a critical issue. In machine learning modeling, particularly in classification problems, having access to a balanced dataset in the training stage has a significant impact on the model’s performance. In the MIDS, this problem comes from a large number of normal conditions compared to abnormal activities in the system logs.
To handle the problem of imbalanced datasets, a multitude of techniques are introduced, such as the threshold method, one-class learning, or cost-sensitive learning [
22]. In fact, all balancing methods are based on oversampling or undersampling approaches. Briefly, the undersampling method tries to decrease the number of instances from the majority class; on the other hand, the oversampling method attempts to increase the number of samples of the minority class. While undersampling has the risk of losing important data, oversampling puts the model at the stake of overfitting.
One solution to tackle this problem is the Synthetic Minority Over-sampling Technique (SMOTE) method [
23]. The SMOTE is a random oversampling approach that generates new instances using existing data from the rare classes. For this, any point from the minority class that smoothly moves an existing sample around its neighbors will be added to the dataset until the dataset reaches a balanced condition. Therefore, this method by generating new samples (which are not exactly the same as the existing samples) makes it possible to avoid the risk of overfitting problems [
24]. In this paper, due to the imbalance in the labeled data, the SMOTE method is employed to normalize the dataset targeted data. Moreover, the balanced dataset helps the normal and abnormal data be split equally during the procedure of building the train and test datasets. In this paper, the Stratified Shuffle Split (SSS) method is applied to divide the train and test data. The test data include 0.3 of the entire dataset, and the number of re-shuffling and splitting iterations is considered as 5.
2.3. Feature Engineering
In the MIDS, features are basically the measured data collected by the SCADA system from embedded sensors. In large-scale ICSs, the quantity of sensors is normally a large number. This mentions two facts. First, in the proposed problem, the feature selection method plays a significant role in the performance of the model; second, due to a large amount of measured data, the model algorithm should be capable of fast prediction to be usable in real-time applications. The goal of feature selection is to find the most effective features that lead to training more accurate models and less computation time. Feature selection techniques can be classified as filter, wrapper, embedded, and hybrid methods [
25]. In the filter method, correlation criteria are employed widely in machine learning problems. Correlation is a measure of the linear relationship between two or more parameters. In feature selection, the most correlated features with the target would be chosen to build the model. Moreover, those features should not show a high correlation with each other to avoid using redundant data. Pearson correlation technique is one of the most useful criteria in feature selection, which can be described as
where
is the
ith feature,
b is the target label, and
and
represent the covariance and the variance functions, respectively.
also indicates the Pearson correlation technique, which shows the correlation between the
ith feature and the corresponding target.
To select the features with a high correlation with the target, we need to set a threshold value for choosing the features with a higher correlation. Suppose that the selected features are correlated to each other. In that case, we can drop the one with the lowest correlation to the target. In addition, the features that show a high correlation together can be unified. To do so, the correlation of the features, two by two, are calculated, and the most correlated features are nominated for removal.
Moreover, in the pre-processing step, the input data should be scaled. This could result in a sustainable learning process. In this paper, the MinMaxScaler is employed to scale the features values. Equation (
2) describes this function, where
is the
ith feature from
mth experiment,
and
are the minimum and the maximum values of the feature among the experiments, respectively. In addition,
indicates the scaled value for the
ith feature of
mth experiment.
2.4. Machine Learning Models
Supervised anomaly detection in ICS generally uses normal activity data to build a predictive model of normal class as well as anomaly class. Then, any unforeseen data are compared with the generated model to detect its class. Several algorithms are applied in this study to train a machine learning model for detecting anomalies by the MIDS. Having access to a labeled dataset allows for applying supervised learning strategies by considering two classes of attack and normal activities. In this study, the most accurate supervised learning algorithms are chosen that are k-nearest neighbors (KNN), decision tree classifier (DTC), and random forest (RF).
The KNN algorithm uses data to classify unforeseen data points by measuring the distances from the neighbor points. This classification method classifies new data by the plurality vote of its k neighbors which are assigned to the most similar class.
The decision tree classifier uses a tree-like model of decisions and their possible outcomes. Normally, a decision tree classifier is used for discrete categorical targets, which, in this paper, the target is a binary variable that includes attack and normal situations.
The random forest algorithm is a combination of tree classifiers. This classifier tries to maximize the variance by injecting randomness in data selection and to minimize the bias by increasing the tree depth to a maximum level.
2.5. Model Evaluation Metrics
The performance of algorithms in detecting anomalies in ICSs based on supervised learning is investigated by the following metrics.
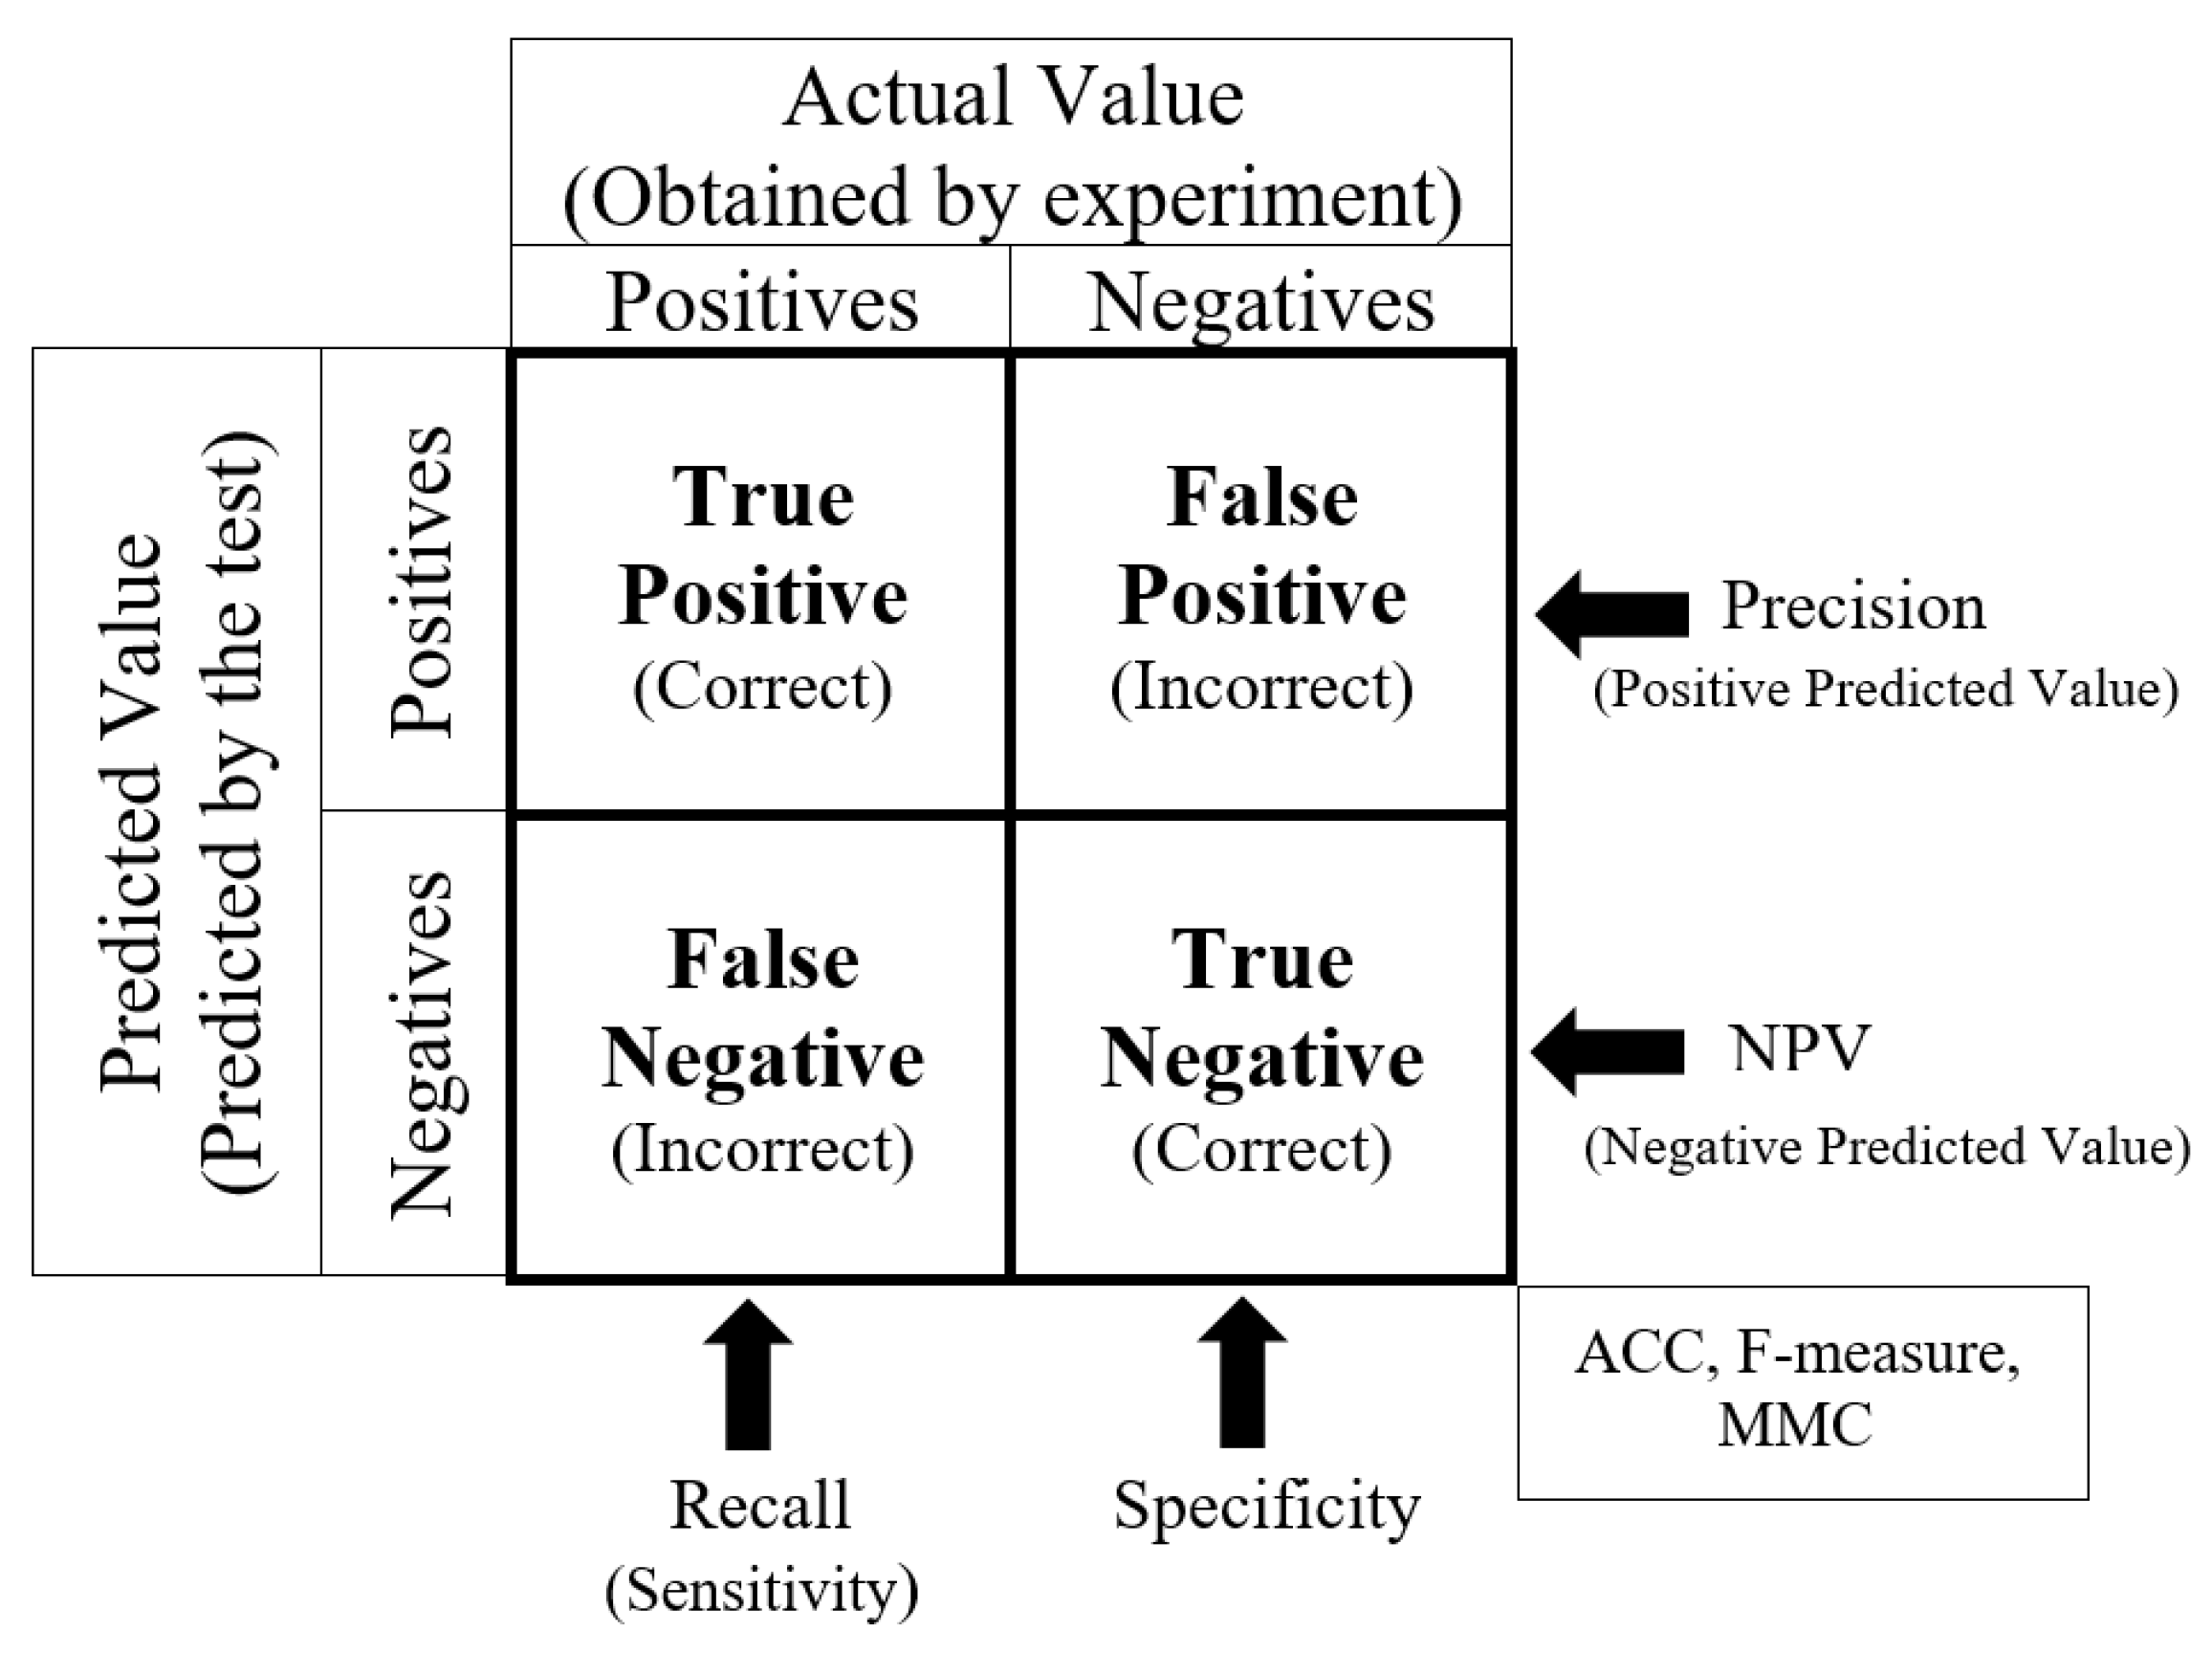
Confusion matrix: This measure is used to evaluate a classifier’s performance considering a pre-known set of labeled data. For each classifier, a confusion matrix would be generated. In addition, sensitivity, specificity, precision, and F1-score metrics are calculated regarding this matrix. The sensitivity or recall metric shows the likelihood of predicting true positive, while the specificity measures the true negative rate. In addition, the precision metric represents the accuracy of the positively predicted classes, which are actually positive. The F1-Score shows the balance between sensitivity and precision. Finally, the accuracy of the model is measured by evaluating the trueness of the results.
Figure 3 explains a confusion matrix and its associated metrics.
Receiver operator characteristic (ROC) curve and area under the curve (AUC). The ROC is a graph that illustrates the performance of the classification algorithm at all classification thresholds and includes two parameters: true-positive and false-positive rates. The ROC compares the classifiers’ performance among the whole range of class distributions and error costs. To compare the ROC curves, the area under the ROC curve is calculated, called the area under the curve (AUC) metric. More values of AUC implies more accuracy in the model prediction [
26].
4. Results and Discussion
The proposed MIDS method based on a machine learning approach is tested on the HAI dataset, and its performance in anomaly detection is evaluated. The machine learning algorithms are trained and tested by employing Python. The procedure of generating the model is shown in
Figure 2. In this paper, several classification algorithms were examined, and the most accurate ones were selected to be implemented on the MIDS model.
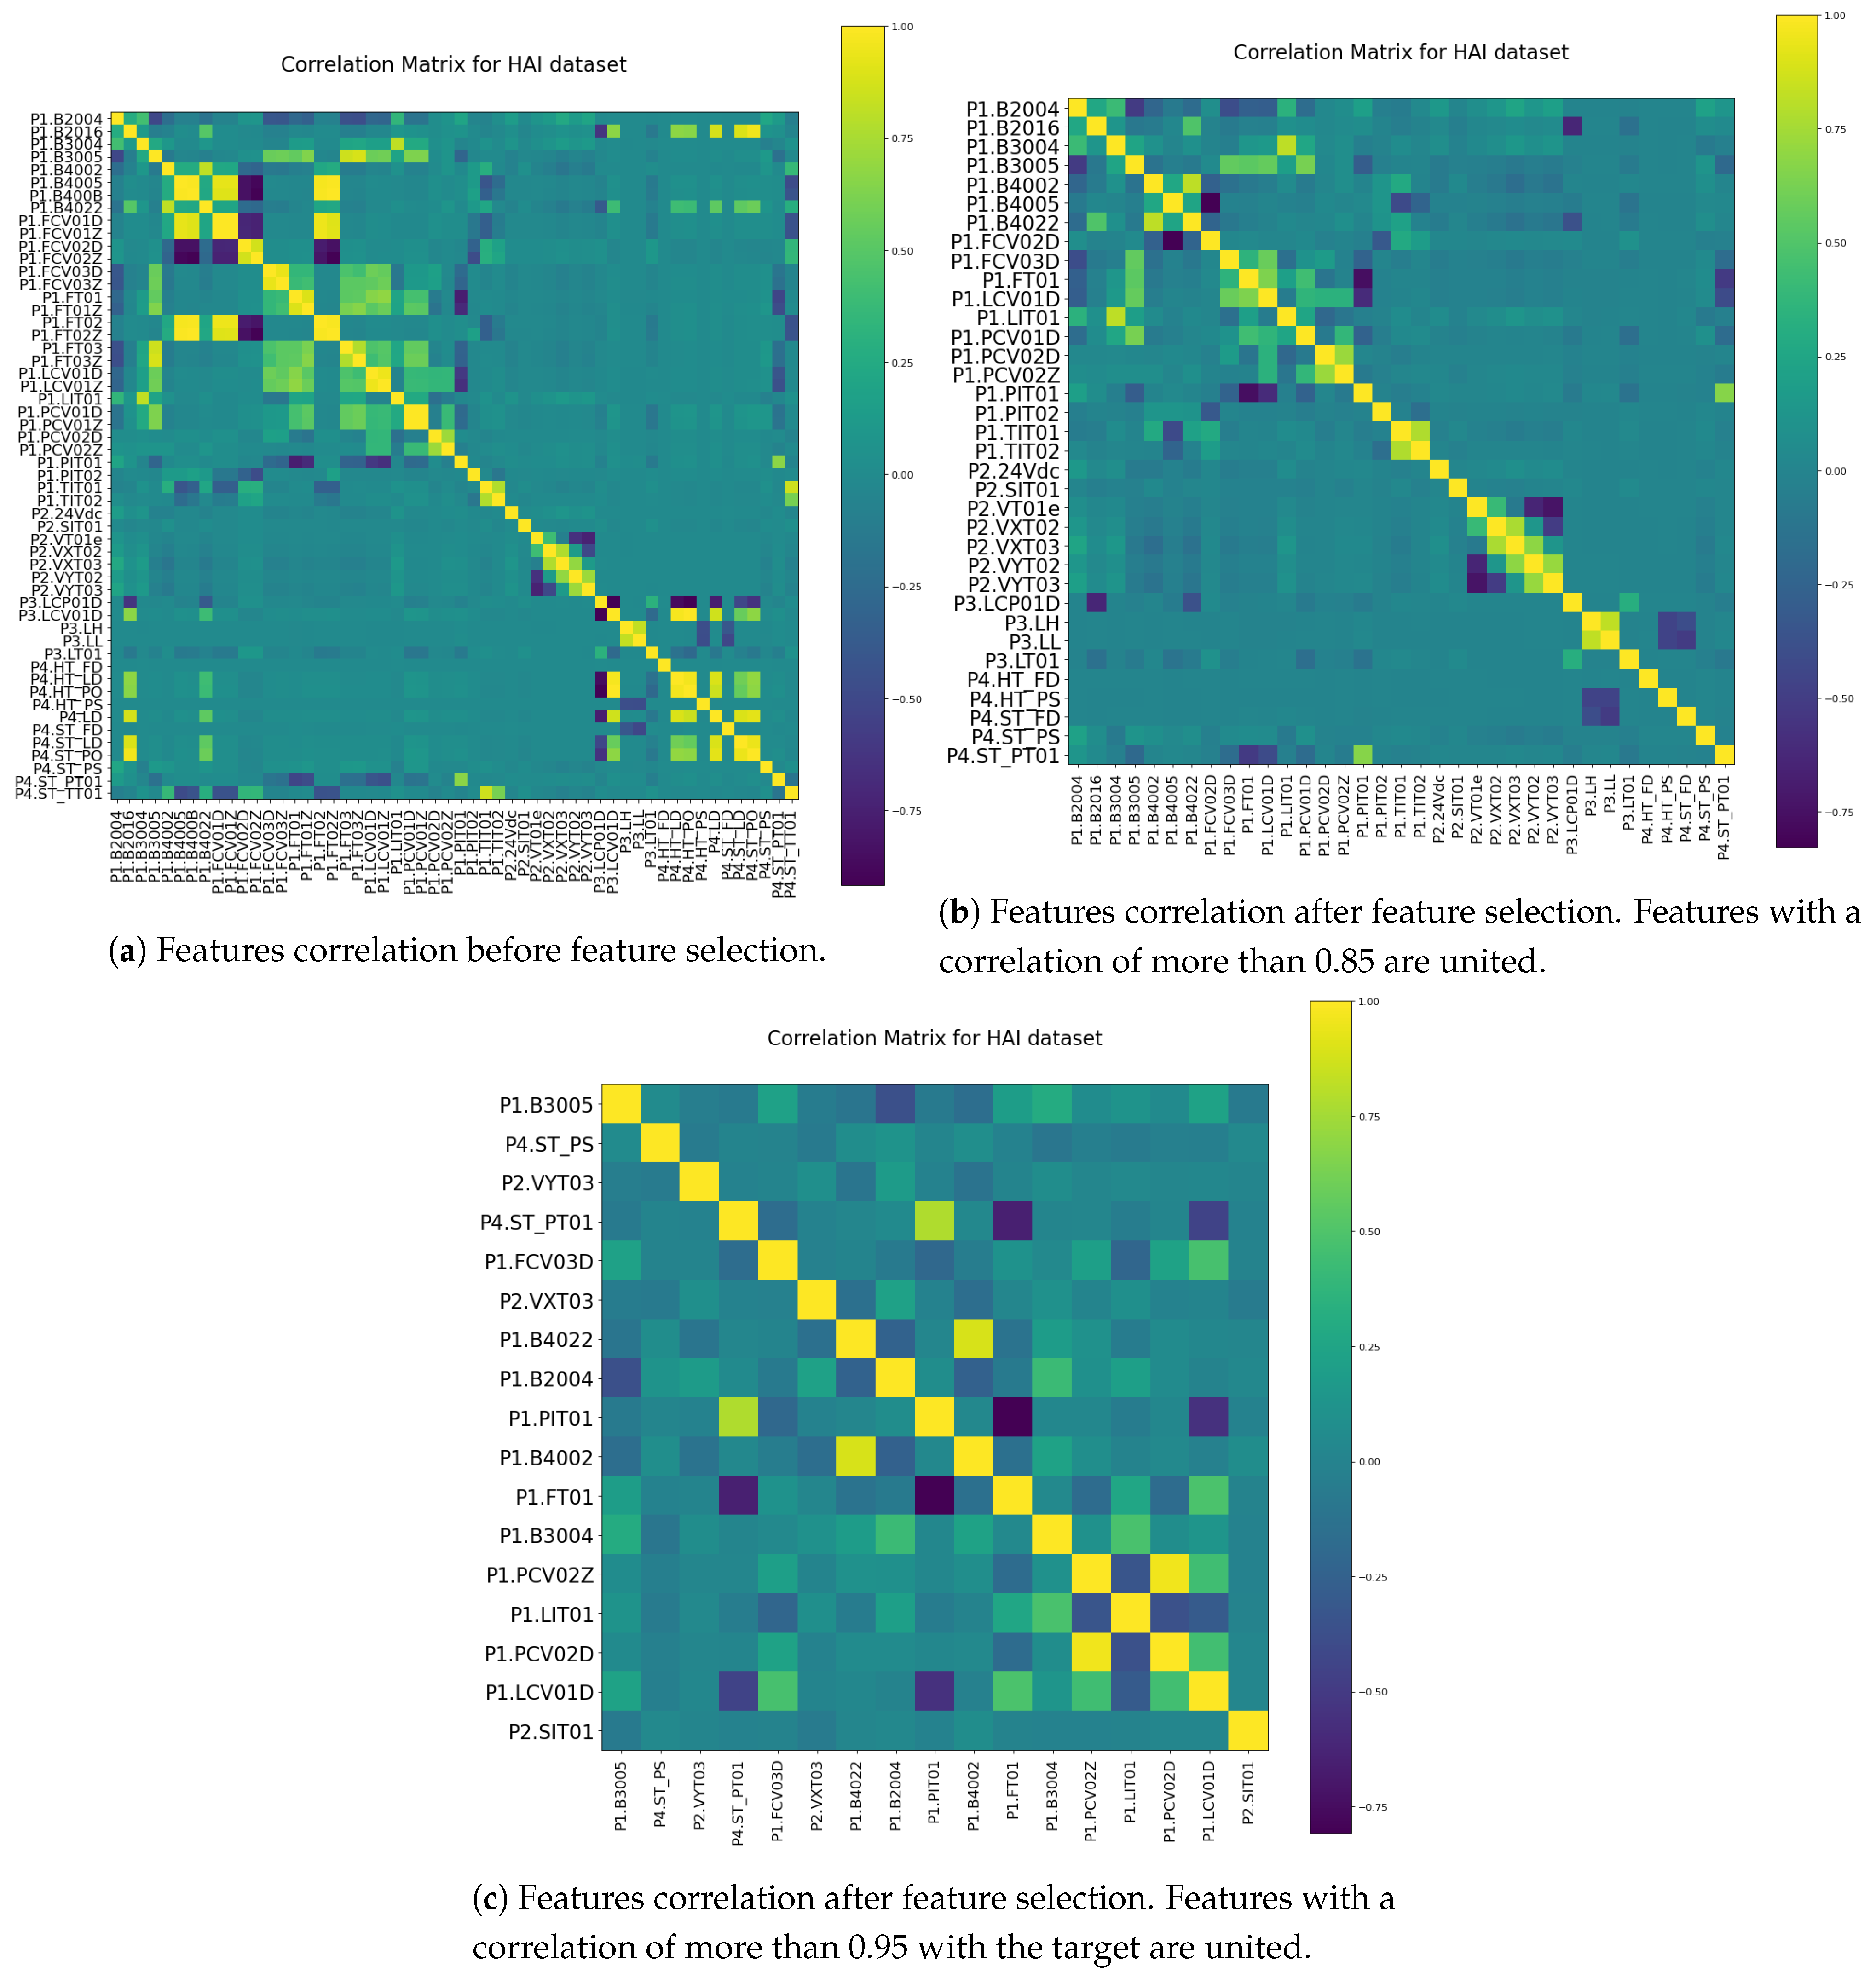
Due to the large number of measuring points in the dataset, the most important features are selected by employing a correlation metric. The feature selection process contains two steps. First, the most correlated features are identified and unified. In this step, from 59 features, 41 are selected. Then, among the residue features, the ones showing the most correlation with the target values are chosen, leading to 17 remaining features.
Figure 5 shows the correlation matrices during the feature selection process. It should be mentioned that
Figure 5b is the correlation matrix after removing the most correlated features together, and
Figure 5c is the correlation matrix after removing the least correlated feature with the target.
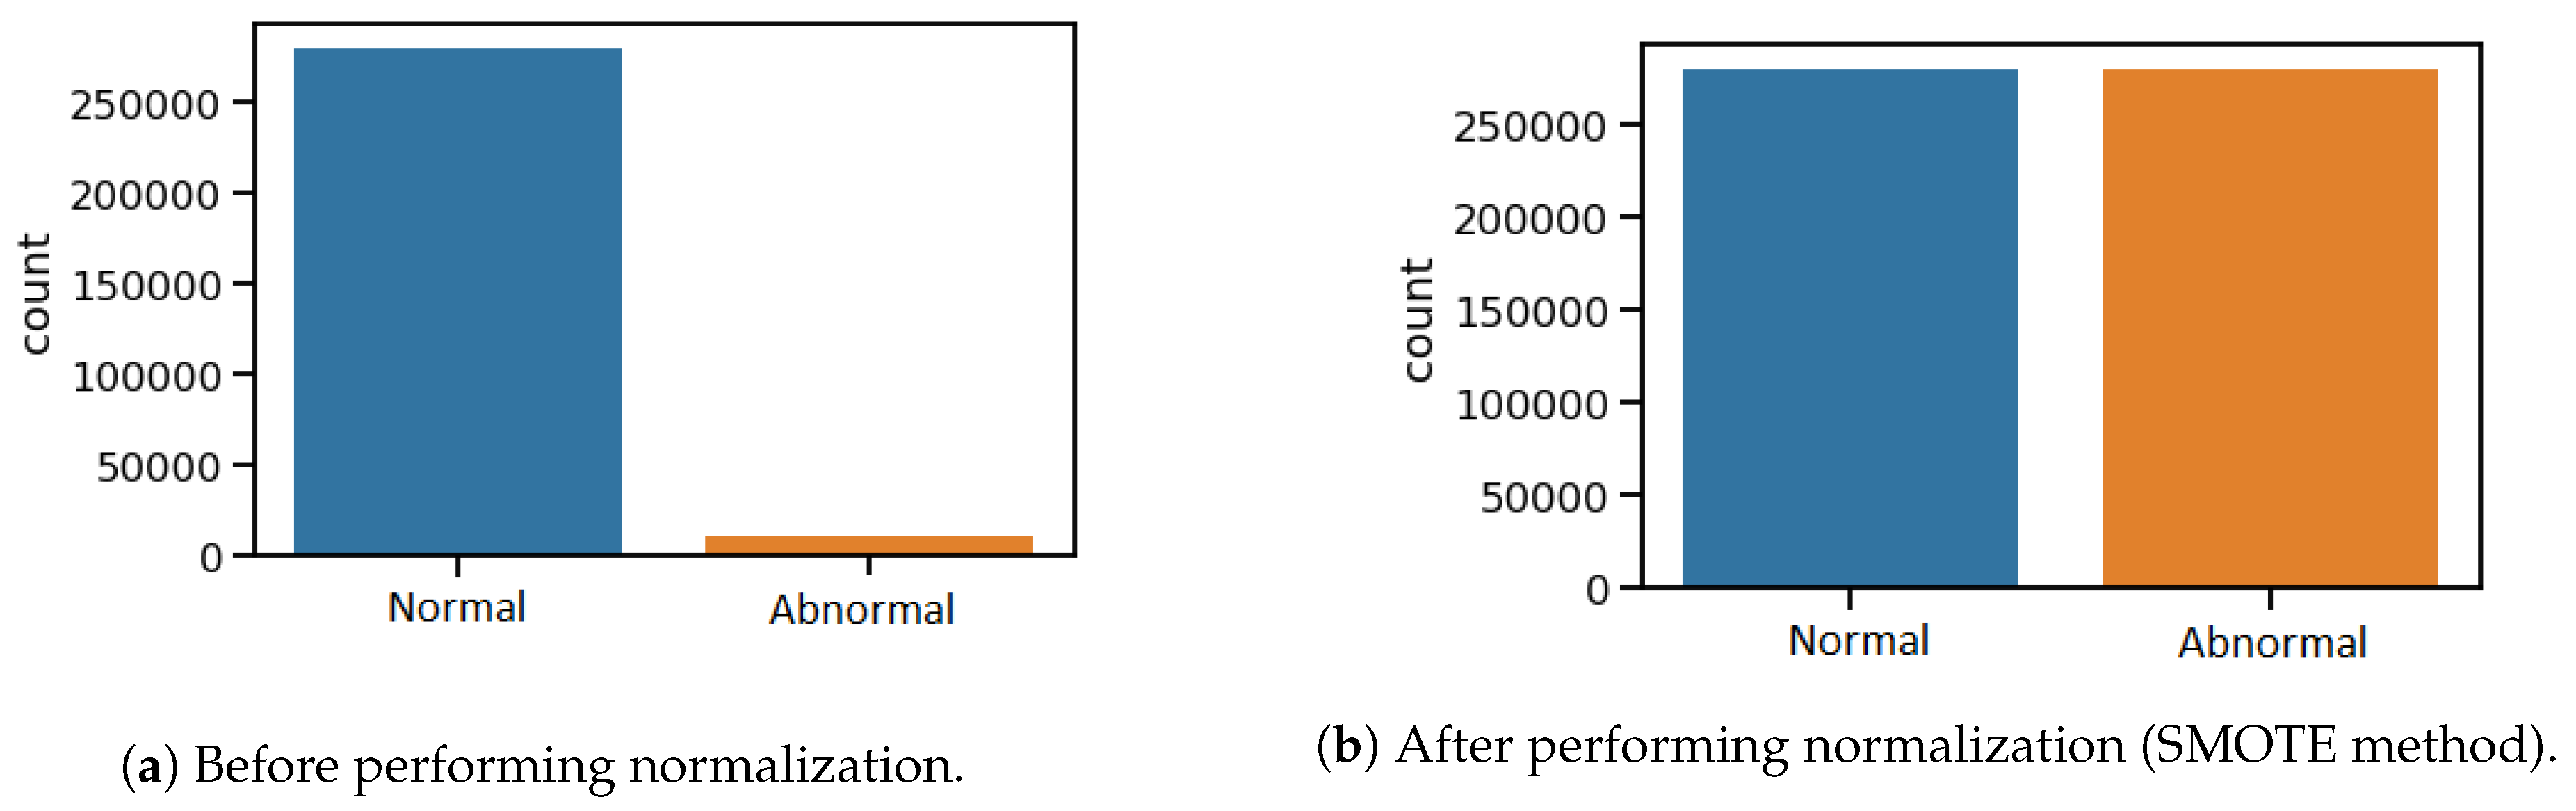
Mostly, in the intrusion detection problems, the training datasets are suffering from imbalance targeted data. This is because of the much lower duration of attack activities compared to the normal conditions. In the testbed dataset, less than 4% of the whole data are associated with abnormal activities. This imbalance of data could affect the performance evaluation of the trained models. The SMOTE method is employed to tackle this problem. This method helps to balance the dataset without a high risk of overfitting.
Figure 6 shows the target distribution in the dataset before and after normalizing.
It should be considered that the sensors’ measurements in an ICS have a wide range of values. The unscaled data could cause significant problems during the model training procedure, and lead to an unsustainable learning process. Therefore, the MinMaxScaler function explained in
Section 3 is used to scale the measurement data in an appropriate range.
After the pre-processing step, the dataset is ready to train a machine learning model. In this study, the supervised classification models that are implemented on the dataset are
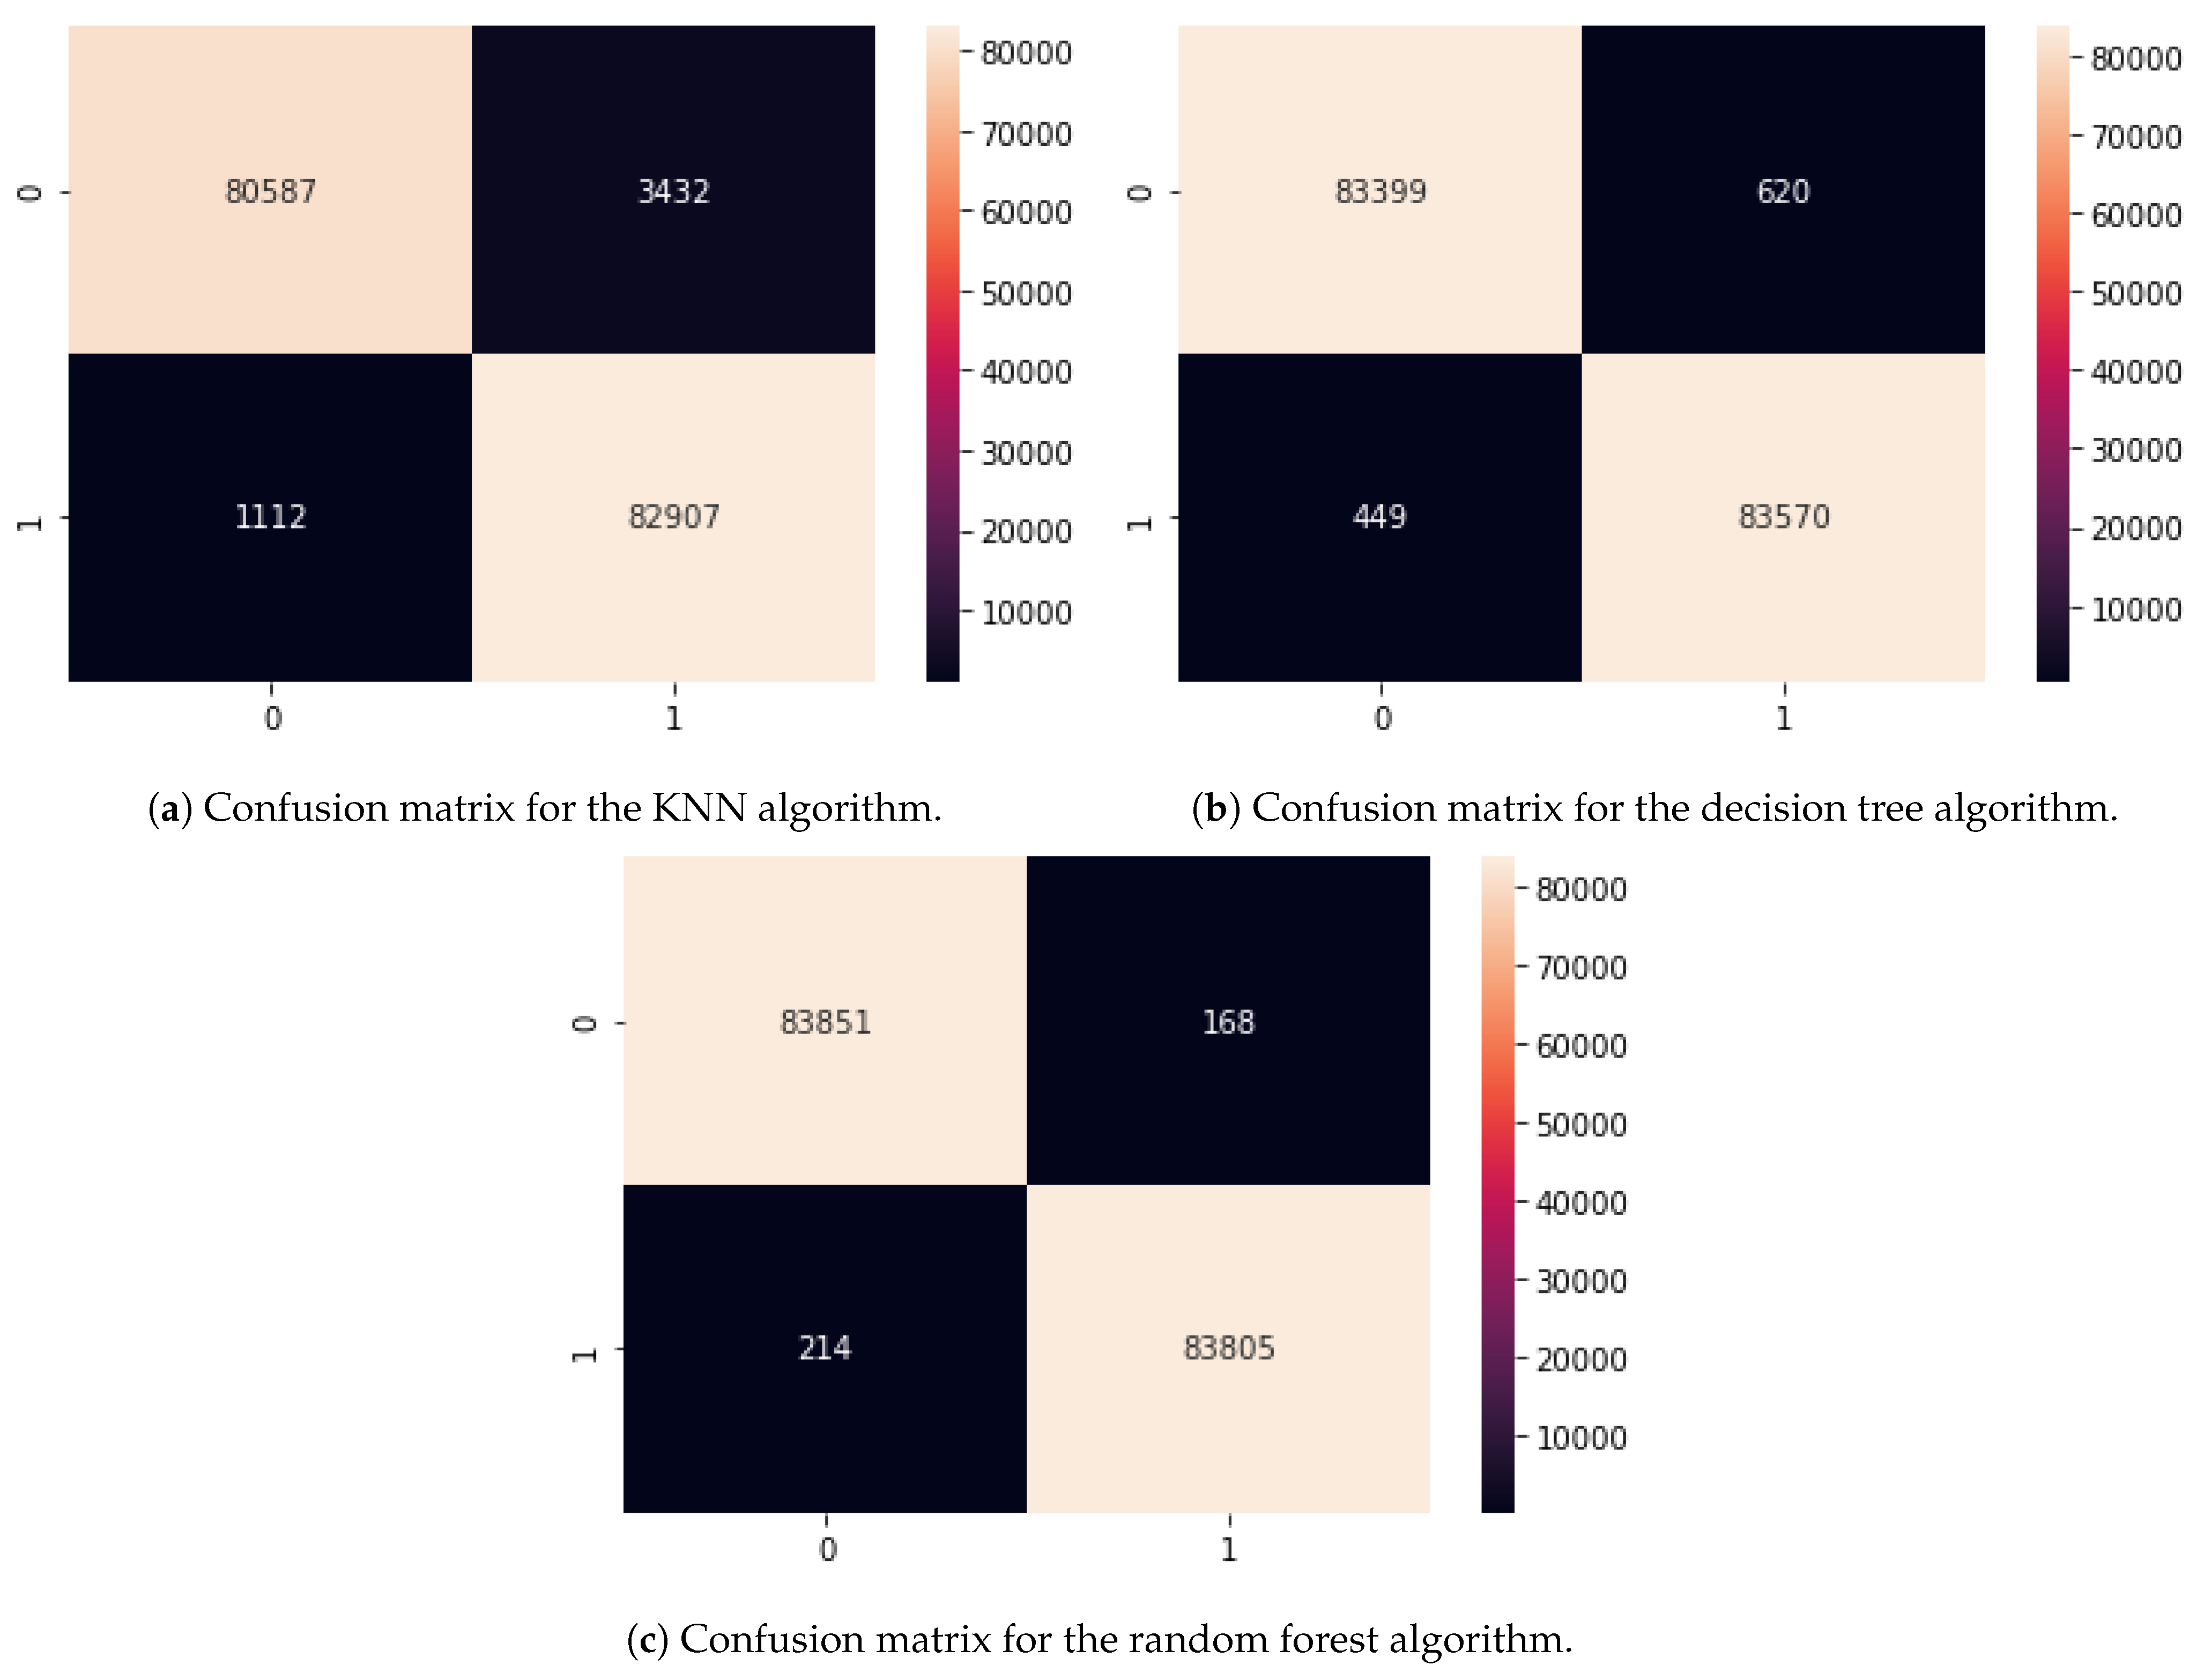
k-nearest neighbor (KNN), random forest (RF), and decision tree classifier (DTC). These algorithms are chosen based on their effectiveness on this particular problem. Two major factors are considered in the evaluation of the algorithms’ performances. First, the accuracy in classifying the targeted output. Second, the required time for fitting and predicting processes. For the first factor, the confusion matrix is computed (
Figure 7), and regarding this matrix, other metrics such as accuracy, precision, F1-score, specificity, and sensitivity are calculated. More information related to the confusion matrix concept and its metrics is available at [
29]. For the second factor, the computation time for fitting the training dataset and predicting the test dataset is captured.
Table 1 shows the confusion matrices along with the computation times for the selected algorithms.
The random forest algorithm has the best performance in detecting the anomalies in the dataset. This algorithm consumes the least time for generating the model, while the decision tree classifier has the lowest prediction computing time. This mentions that a trade-off between accuracy and prediction time should be considered for a real-life problem. Moreover, the KNN algorithm shows a lower accuracy in predicting the anomalies and requires a longer time for fitting and predicting processes. The result implies that the MIDS can be a reliable solution for the anomaly detection problem. Applying measurement data from the SCADA system to detect attacks could be considered a protection layer in ICSs. While the NIDS can protect the network traffic from malicious intrusions, the MIDS could improve the system’s reliability as the second layer of protection, especially against stealthy attacks.
Usually, stealthy attacks that intrude into the field level (level 0) of an ICS attempt to conceal the state changes by imitating a normal behavior and deceiving the protection systems. Usually, building a dataset that includes stealthy attacks is a complicated process. For the first time, by leveraging HIL systems, a real-life dataset containing stealthy attacks on sensor data measurements is provided. This dataset consists of actual data during intrusion attacks that manipulate the control parameters.
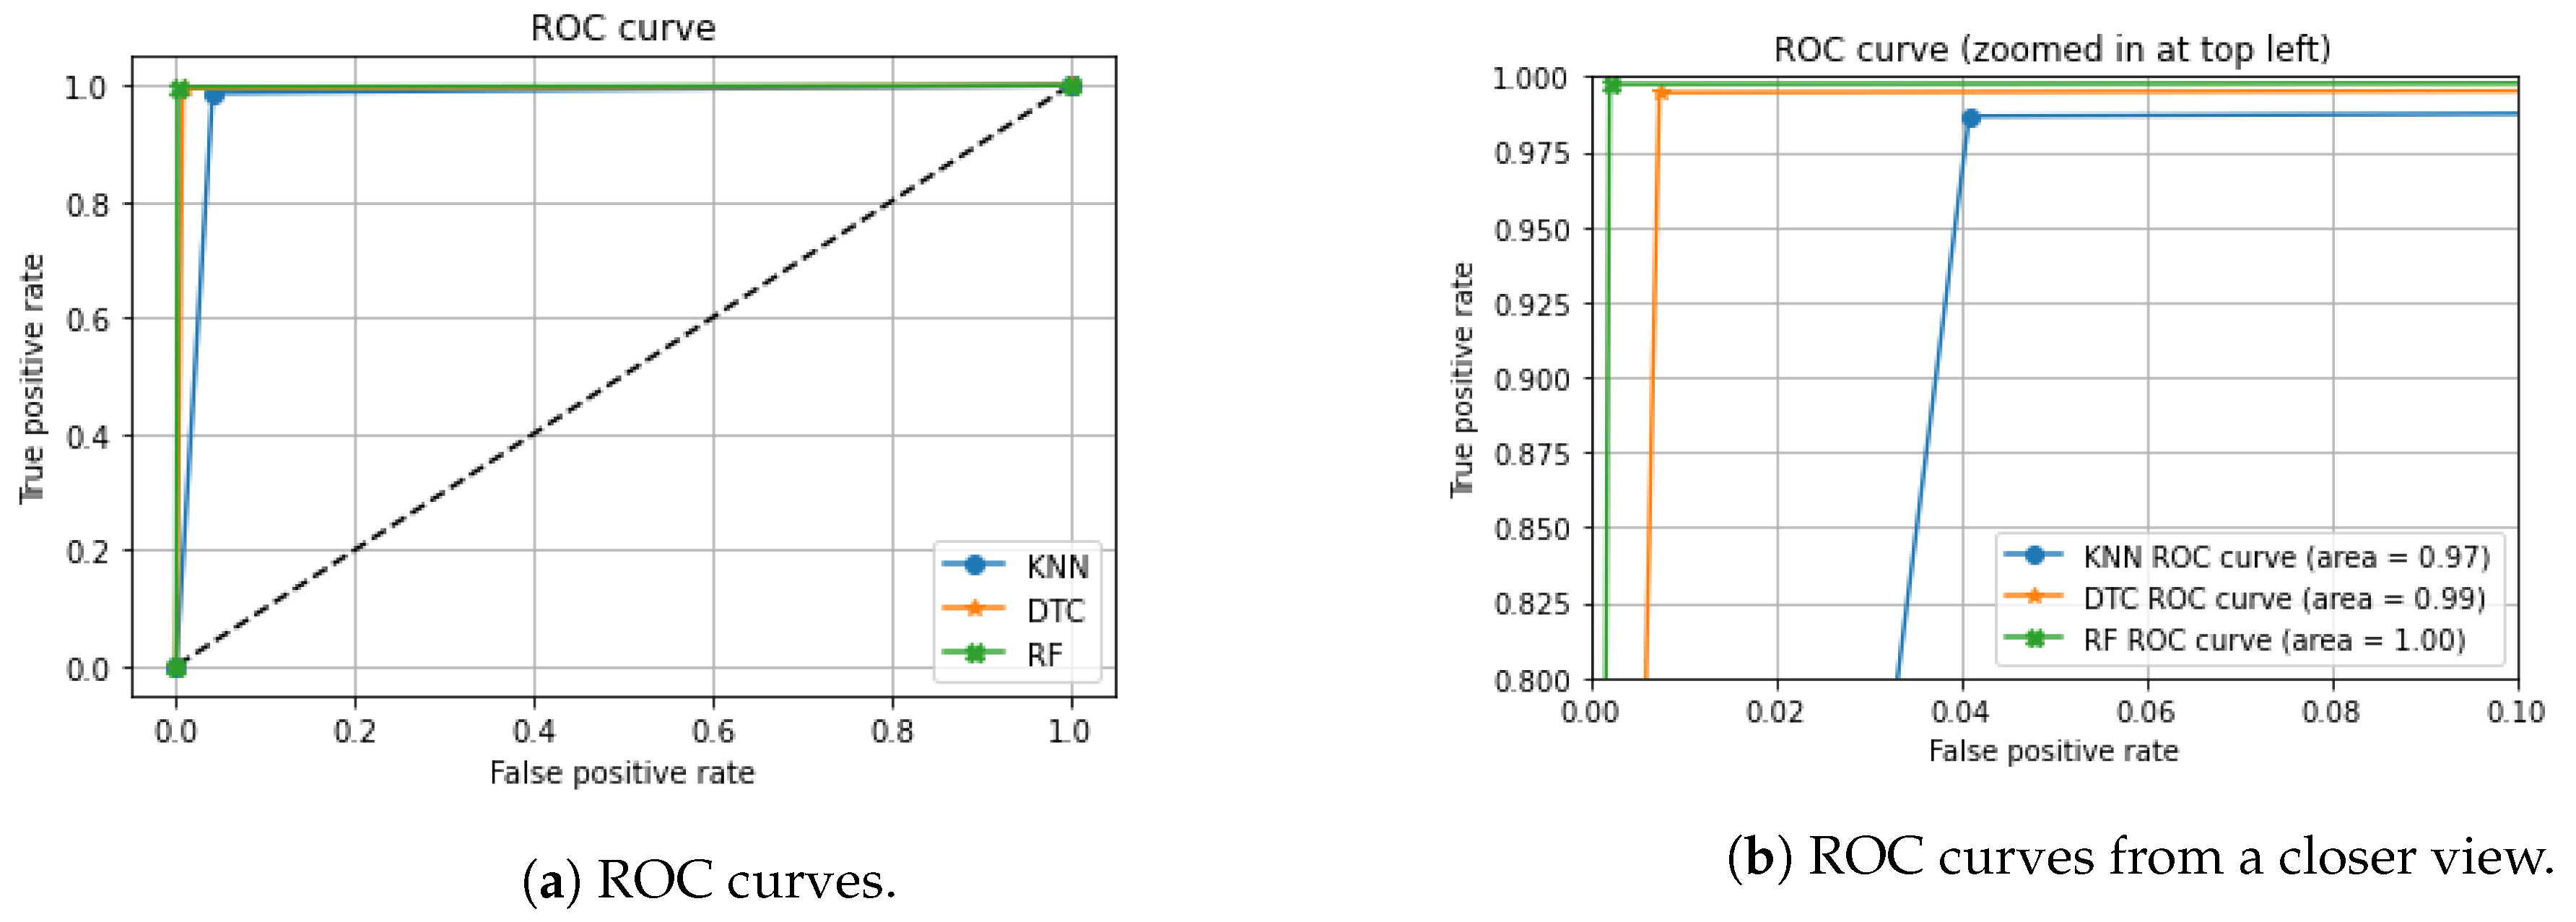
The ROC curve illustrated in
Figure 8 indicates that the random forest algorithm has a remarkable performance in detecting anomalies. This figure compares the three applied algorithms’ accuracy using the AUC of the ROC curves. The diagonal dashed line from the bottom left to the top right corner of
Figure 8a represents a non-discriminatory test points where sensitivity = 1-specificity. As shown in
Figure 8b, the random forest algorithm performs far better than the KNN and the DTC algorithms by an AUC of 1.
5. Conclusions
In this paper, the classification performance of the measurement intrusion detection system is investigated and a remarkable outcome is concluded, especially on stealthy attacks. The MIDS is working based on the measured data that the SCADA system collects from the ICS sensors. IDSs are mostly investigating network traffic to find malicious activities in the system, and stealthy attacks are hard to be detected by these strategies. Because the MIDS is investigating the measurement data, it could detect deceptive behaviors in the system better than the NIDS. The HAI dataset, including actual data from a power generation system, is applied to evaluate the MIDS performance in fault detection. The results show a very successful classification employing the random forest algorithm in the fault detection process with an accuracy of 99.76%.
Nevertheless, although the MIDS can greatly detect anomalies, especially stealthy attacks, it cannot prevent malicious intrusions in the layer of network traffic. Indeed, the MIDS could detect anomalies when they successfully deceive the NIDS by imitating a normal behavior in the system. Therefore, the MIDS cannot be a substitution of the NIDS; however, it can be embedded as the second layer of protection in the critical infrastructure of ICSs. By combining these two protection layers, if any malfunction in the system, including insider’s sabotage, systems failure, stealthy attack, or network intrusion happens, the IDS could be sufficient in detecting it successfully.
Moreover, this study leverages the supervised learning approach to build a machine learning model. The unsupervised learning methods are also a topic of interest for our future works; however, their efficiencies in comparison with supervised learning models should be investigated. In the future, we would like to investigate unsupervised learning algorithms due to the fact that they don’t require labeled data for the model training step, which leads to detecting new anomalies in the system.


