Abstract
The data generated in modern agricultural operations are provided by diverse elements, which allow a better understanding of the dynamic conditions of the crop, soil and climate, which indicates that these processes will be increasingly data-driven. Big Data and Machine Learning (ML) have emerged as high-performance computing technologies to create new opportunities to unravel, quantify and understand agricultural processes through data. However, there are many challenges to achieve the integration of these technologies. It implies making some adaptations to ML for using it with Big Data. These adaptations must consider the increasing volume of data, its variety and the transmission speed issues. This paper provides information on the use of Big Data and ML for agriculture, identifying challenges, adaptations and the design of architectures for these systems. We conducted a Systematic Literature Review (SLR), which allowed us to analyze 34 real cases applied in agriculture. This review may be of interest to computer or data scientists and electronic or software engineers. The results show that manipulating large volumes of data is no longer a challenge due to Cloud technologies. There are still challenges regarding (1) processing speed due to little control of the data in its different stages, raw, semi-processed and processed data (value data); (2) information visualization systems, which support technical data little understood by farmers.
1. Introduction
Historically, population growth and socioeconomic factors have been associated with food shortages []. The United Nations Food and Agriculture Organization estimates that the world’s population will increase by more than 30% by 2050, while an increase of 70% will be necessary for food production. Meanwhile, water pollution, climate change [], soil degradation [], sociocultural development, market fluctuations and government policies add uncertainty to food security []. This security is defined as “a condition that exists when all people, at all times, have physical and economic access to sufficient safe and nutritious food to meet their dietary needs and food preferences for a healthy and active life” by the World Food Summit []. These uncertainties create a challenge for agriculture to improve productivity and quality while reducing the environmental footprint of farming, which currently accounts for 20% of all anthropogenic emissions of greenhouse gases [].
Agritechnology and precision agriculture are known today as digital agriculture. It is a new scientific discipline with data-intensive approaches to promote agriculture productivity while minimizing its environmental impact []. The collected data in modern farming operations come from multiple sensors, photographs and satellite images. They give a better understanding of the dynamic conditions of crops, the soil and the climate, as well as the use of machinery, allowing greater precision and better decision-making [].
As smart machines and sensors appear more frequently on farms and the quantity and scope of agricultural data expand, agricultural processes will be increasingly data-guided. On the other hand, the rapid progress in the Internet of Things (IoT) and cloud computing are boosting what is known as Smart Farming []. While precision agriculture only refers to farming variability management, Smart Farming considers situations triggered by events in real-time []. All of the above allows farmers to react quickly to sudden changes in operating conditions or other circumstances, such as warnings of a weather event or a disease. These characteristics generally include smart assistance in the implementation, maintenance and use of the technology [,].
Big Data and ML have appeared as high-performance informatics technologies for creating new opportunities to unravel, quantify and understand data-intensive processes in the environment of farm operations []. Rapid advances in high-resolution remote sensing techniques, intelligent information and communication technologies and social media have contributed to the proliferation of Big Data and ML in many environmental fields, such as weather forecasting, weather management, disasters, smart water and energy management systems and remote sensing [].
The use of ML algorithms in Big Data has always been a critical point of research [,], thus evaluating the efficiency and goodness of new and existing ML algorithms has also become very important []. The processing speed, efficiency and accuracy of these algorithms were already shown. Today, however, with the complex characteristics of Big Data, new problems have emerged and we face challenges in developing and designing a new ML algorithm for Big Data [,,,].
Although Big Data and ML offer considerable advances in science and engineering [], they bring with them enormous challenges [,] that are worth exploring. An investigation of the McKinsey Global Institute has stated that ML will play a relevant role in the Big Data revolution [,]. The reason for this is its capacity to learn from the data and offer data-based prospects, decisions and predictions []. There are several solutions for the challenges mentioned above, including a series of adaptations for using ML correctly in Big Data systems for agriculture. However, information display problems have not been resolved [].
The goal of this paper is to discuss the real-life problems encountered in using ML in conjunction with Big Data in the field of Smart Farming. We want to highlight the design of the architectures of Big Data systems from the angle of data flows, as well as the ML methods adapted to solve the problems encountered. To do this we carried out a SLR, with strict application of the protocol established by []. This review may be of interest to industry professionals, specifically to computer or data scientists and electronic or software engineers, who wish to get an updated view of the extent to which ML and Big Data have been applied and validated in agriculture. We selected a set of 34 papers which explain the use of Big Data and ML in agriculture, of which only eight describe the adaptation of ML methods in real cases. We observe that a number of studies have been published in the area of Big Data and ML applied to agriculture during the last five years. It is therefore important to compile, summarize, analyze and classify the most advanced research in this area.
This paper consists of the following sections—Section 2 contains background on Big Data and ML topics. Section 3 describes the use and adaptations of ML in Big Data. Section 4 describes the methodology of SLR. Section 5 contains the analysis of the reviewed papers and the answers to the research questions. Section 6 contains the discussion of the main findings. Section 7 explains threats to validity. Finally, Section 8 presents the conclusions.
2. Background
This section provides information on the definitions and characteristics of ML and Big Data.
2.1. Machine Learning
ML is a field of investigation which focuses formally on the theory, performance and properties of learning systems and algorithms. It is highly interdisciplinary, based on different areas like artificial intelligence, optimization theory, information theory, statistics, cognitive science, optimum control and many other scientific, engineering and mathematical disciplines []. Due to its implementation in a wide field of application, ML has covered almost all areas of science, having a great impact on science and society []. ML is used within a variety of problems such as recommendation drivers, recognition systems, informatics and data mining and autonomous control systems [].
Depending on the nature of the feedback available for a learning system, ML can be classified into three main types: supervised learning, unsupervised learning and reinforced-learning. Table 1 summarizes the main ML techniques and also shows a comparison of these, considering different perspectives for data processing. The row “Data processing tasks” in the table indicates the problems that need to be solved and the row “Learning algorithms” describes the methods that can be used. Briefly, from the perspective of data processing, supervised learning and unsupervised learning focus mainly on data analysis, while reinforced-learning is preferred for decision-making problems.

Table 1.
Main Machine Learning (ML) techniques.
2.2. Big Data
Big Data is defined in three dimensions. First, it refers to the enormous volume of generated, stored and processed data. Second, it also refers to the high velocity of data transmission in interactions and the rates at which data are generated, collected and exchanged. The third dimension refers to the variety of formats and structures of data, product of the heterogeneity of data sources [].
Apart from the “4 Vs” for the Big Data dimensions (volume, velocity, variety and veracity), another dimension must also be considered, namely its value. The value is obtained by analyzing data to extract hidden patterns, trends and knowledge models using algorithms and smart data analysis techniques. Data science methods increase the value of data, giving a better understanding of their phenomena and behaviors, optimizing processes and improving the discoveries of machines, businesses and scientists. Therefore, we cannot consider the Science of Big Data without including data analysis and ML as primary steps for numbering value among the strategies of Big Data Science [].
In practice, Big Data analysis tools enable data scientists to discover correlations and patterns through the analysis of massive quantities of data from different sources. In recent years the science of Big Data has become an important modern discipline for data analysis []. It is considered an amalgam of classic disciplines like statistics, artificial intelligence, mathematics and informatics with its sub-disciplines including database systems, ML and distributed systems [].
This is the Big Data Ecosystem that handles the evolution of data, models and support infrastructure throughout its life cycle; it is a whole set of components or architecture, for storing, processing and visualizing data and delivering results to guide applications [,]. The Framework Architecture of Big Data includes 5 components which manage different aspects of the ecosystem: (1) data model, structures and types; (2) administration of Big Data; (3) analysis tools; (4) infrastructure; and (5) Big Data security. Figure 1 shows the relation between the components.
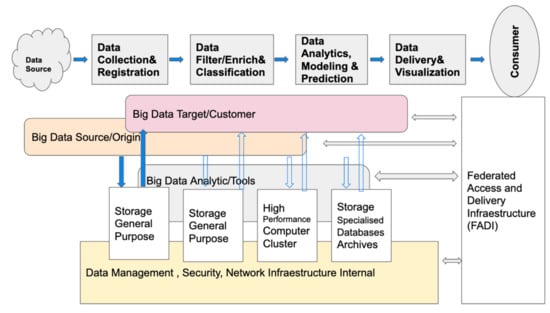
Figure 1.
General architecture of Big Data.
As shown in Figure 1, the Big Data process starts identifying the sources from which useful data are extracted []. Next, the data are stored in the designed data model, depending on whether the data are structured or not. In the following step, the data are classified and filtered according to the type of analysis required. The classified data are analyzed using appropriate tools, for example, data mining [], OLAP [] and data science in general []. The data obtained must be presented through some visualization tool. Finally, the data are analyzed by the decision-makers [].
3. Related Work
There is a constant concern in the development of ML algorithms for Big Data processing. Challenges to address the data volume, variety, speed and value are described in the literature; that is important when ML is introduced into Big Data systems architectures. For agriculture, we have found several studies that explain the ML techniques to deal with various problems, such as disease control, climate prediction, improvement of production and quality. In this section, we describe some of them. On the other hand, there are studies on Big Data in different agriculture domains, improving decision-making. We outline some challenges. Few studies analyze the use of ML in Big Data, the challenges and adaptations made. The papers explain interesting aspects in various domains. However, we have not found enough information for agriculture, which makes our work necessary and relevant.
This section describes some important aspects obtained from reviews, state of the art and surveys carried out in agriculture and other related areas. First, the use of ML and Big Data in agriculture, their challenges and opportunities are described. Second, it shows the problems that have been faced when using ML in conjunction with Big Data in general. Finally, the adaptations of ML in Big Data are identified for the cases of volume, speed, variety and veracity.
3.1. Machine Learning in Agriculture
ML has been used to solve different problems for agriculture, such as crop, herd, water and soil []. It includes yield prediction, disease detection, weed detection, crop quality, species recognition, animal welfare and production.
An example of this is that many producers say that weeds are the most serious threats to crop production. Accurate weed detection is very important for sustainable agriculture because weeds are difficult to detect and distinguish from crops. ML algorithms in conjunction with sensors now allow accurate detection and identification of weeds without causing environmental problems or secondary effects. ML for weed detection has led to the development of tools and robots to destroy weeds, minimizing the need for herbicides []. Accurate detection and classification of the characteristics of crop quality have increased product values and reduced waste. Figure 2 presents a graph showing the different ML techniques that have been used in improving agriculture.
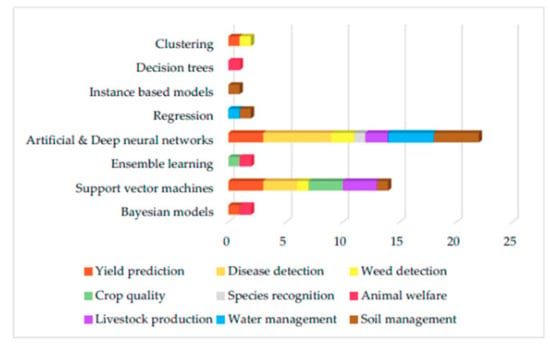
Figure 2.
ML techniques used in agriculture [].
3.2. Big Data in Agriculture
Big Data in agriculture refers to all the modern technology available combined with data analysis as a basis for making decisions based only on data []. The following typology will help us to understand the Big data evolution (see Table 2).

Table 2.
Typologies in digital agriculture [].
Big Data has been used to improve various aspects of agriculture, such as knowledge about weather and climate change, land, animal research, crops, soil, weeds, food availability and security, biodiversity, farmers’ decision-making, farmers’ insurance and finance and remote sensing []. It is also used to create platforms which allow the actors of the supply chain access to high quality products and processes; tools to improve yields and predict demand; and advice and guidance to farmers based on the response capacity of their crops to fertilizers, leading to better fertilizer use. Furthermore it has led to the introduction of plant-scanning equipment to follow up deliveries and to allow retailers to monitor consumer purchases, improving product traceability throughout the supply chain []. Big Data does not function in isolation. It has been used in conjunction with other technologies like ML, cloud-based platforms, image processing, modelling and simulation, statistical analysis, NDVI vegetation indices and geographic information systems (GIS) []. ML tools have been used in prediction, grouping and classification problems; while image processing has been used when the data are extracted from images (i.e., cameras and remote sensing) [].
Table 3 summarizes the more advanced characteristics of the application of Big Data in Smart Farming and the key problems of each stage of the Big Data chain found by Wolfert in the literature up to 2015 []. In the initial stages, the technical problems related with data formats, hardware and information standards may influence the availability of Big Data for subsequent analysis. In the later stages, governance problems—like reaching agreements on responsibilities and liabilities—become more challenging for commercial processes. The authors conclude that in 2016, Big Data in Smart Farming was still in an initial development stage. The applications discussed in the work cited come mainly from Europe and North America but a growing number of applications can be expected from other countries []. The author also concludes that Big Data will trigger important changes in the scope and organization of Smart Farming. Business analysis at a scale and velocity never seen before will be a real game-changer, leading to continuous reinvention of new business models.

Table 3.
Features of Big Data applications in Smart Farming and key issues [].
3.3. Challenges of Machine Learning in Big Data
Big Data creates numerous challenges for traditional ML in terms of scalability, adaptability and usability; it presents new opportunities to inspire novel, transformational solutions to address many technical challenges associated with Big Data to generate impacts in the real world [].
A major challenge is the design of the system architecture, as it has an impact on how learning algorithms should be executed and on how efficient their execution is; at the same time, satisfying the needs of ML could lead to the co-design of system architecture []. Big Data and ML are related through the framework shown in Figure 3, where Big Data provides the whole life cycle of the data from data entry to visualization. On the other hand, the system provides an informatics platform for data processing and analysis. ML is responsible for pre-processing data, learning and evaluation. The users can use the data provided by ML through the informatics system. All this in the domain of a specific application.
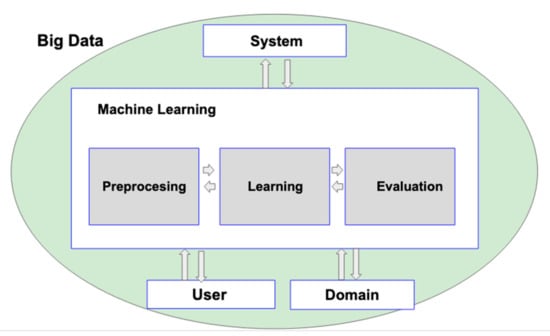
Figure 3.
A framework of Machine Learning in Big Data.
There are many challenges to be overcome in developing a new ML algorithm or adapting classic algorithms to the context of Big Data. There are several works that detail these challenges [,,,,].
Sassi and Ouaftauh [] explain that one of the adaptation methods is the coupling between new technologies (that is, GPU distributed computing, Hadoop, Spark) and ML algorithms to reduce the computational cost of data analysis. The paper highlights the main challenges of adapting ML algorithms to the Big Data context and describes a novel method to make these algorithms efficient and fast in Big Data processing using hidden Markov models as a case study using the Spark framework.
Bhatnagar [] discusses numerous issues related to the huge amount of data, its processing and analysis, the current focus of research and future trends. Also, the same author describes the use of ML approaches for Big Data processing and highlights the current scenario from different perspectives.
Chan [] presents a survey on ML approaches commonly used for affective design when using two data streams, traditional survey data and modern big data. The author provides a classification of ML technologies for traditional survey data. The limitations and advantages of ML technologies are discussed. Since big data related to affective design can be captured from social media, the authors discuss the perspectives and challenges in using Big Data to improve the affective design.
Isabella and Srinivasan [] analyze challenges and innovative ideas for big data analysis in conjunction with ML applied in different fields from 2007 to 2017. The authors identified research projects based on discussions on ML techniques for Big Data analysis providing suggestions for developing new projects.
Mahajan et al. [] compare various accelerator designs for ML algorithms. The authors present a new accelerator called TABLE, which is a framework that generates accelerators for a class of ML algorithms that can be used in Big Data.
Rathor and Gyanchandani [] and Divya, Bhargavi and Jyothi [] present a comparative analysis of ML algorithms to better reconcile Big Data challenges based on optimized performance for time and the precision obtained in the prediction.
There is little contribution from the state of the art to understanding software architectures and the use of ML in Big Data []. On the other hand, applying and using ML techniques developed for real-world problems has potential as a research area [].
3.4. ML Adaptations in Big Data
In response to the challenges presented by several authors, several adaptations of ML techniques have been developed for using in Big Data. One of the possibilities is the design of entirely new algorithms as this may be a suitable solution but most researchers have preferred other methods, such as adapting existing techniques [].
Table 4 presents a summary of the possible solutions that have been developed for the problems described in the previous section []. The table shows various approaches versus challenges that have been implemented to tailor ML according to the requirements of data volume, variety, speed or accuracy. The symbol “√” means that the adaptation was total and “*” means a partial adaptation. Thus, for example, it was found that using the Deep Learning technique in Big Data was fully adapted to solve problems of data volume and variety. In this case, the analyzed approaches were Feature Engineering, Non-linearity and Data Heterogeneity.

Table 4.
Comparison of adaptations made in ML to be used in Big Data [].
Despite the proposals for adaptations to ML techniques, there are not reported cases applied in agriculture.
Next, the paper presents an SLR to classify proposals for Big Data systems using ML in agriculture. The principal adaptations made so that ML can be used correctly have been identified.
4. Research Methodology
An SLR was selected as the research methodology for this paper. This research aims to investigate and provide a review of the adaptations of ML for use in Big Data when applied to the real case of agriculture.
We have followed the proposals of [] to carry out impartial research in the context of information selection. The research methodology follows the steps shown in Figure 4.
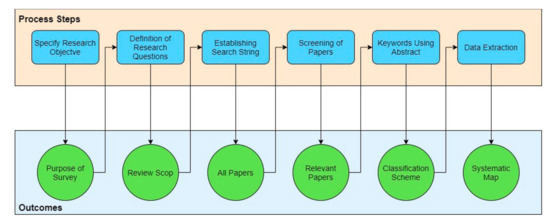
Figure 4.
Research Methodology.
4.1. Research Objetives
The objectives of this research were as follows:
O1. To identify vanguard research works in the field of Big Data and ML, focusing on uses in agriculture
O2. To characterize the Big Data and ML architectures used in agriculture.
O3. To identify the ML proposals used in Big Data to improve decision-making in agriculture.
O4. To identify the adaptations of ML for use in the context of Big Data for agriculture.
O5. To propose a framework to represent the elements necessary for the design of Big Data and ML architectures used for agriculture.
O6. To identify the research gaps in terms of challenges and unsolved issues.
4.2. Research Questions
The first step of this SLR is the definition of research questions and provision of the current research status on Big Data and ML in agriculture. This SLR addresses nine research questions with their motivations, as shown in Table 5.

Table 5.
Research questions.
4.3. Search String
The second phase of SLR is to search for relevant studies on the research topics. A search string has been defined to gather published articles related to the research topics. It is decided using “Big Data” AND “Machine Learning” AND (“Farm” OR “Agriculture”) search string. Internet research has been performed by using multiple search engines and digital libraries to collect information. The obtained results were compiled to get the best sources for information to answer the defined research questions. The selection of data sources was based on their scientific contents, closely related to the objective of this work. The chosen databases were IEEE-Xplore, ACM, Science Direct, Springer Link, MDPI and Scopus. We incorporate Scopus because it includes the most important conferences. The next step is to identify the consistent procedures and search terms to look for technical and scientific documentation in search engines and digital libraries. Table 6 shows the set of keywords selected to define the search string from the research questions.

Table 6.
Search String.
4.4. Screening of Relevant Papers
All the papers were not precisely relevant to the research questions. Therefore, these papers needed to be assessed according to the actual relevance. For this purpose, we used the search process defined by Dybå and Dingsøyr [] for a screening of relevant papers. In the first screening phase, papers were selected based on their titles and we excluded those studies that were irrelevant to the research area. In the second screening, we read the abstract of each selected paper in the first screening phase. Furthermore, inclusion and exclusion criteria were also used to screen the papers.
We exclude the following types of papers:
- Articles that do not used Big Data and ML system.
- Application in real cases in the field of agriculture.
- Papers published other than conferences, journals and technical reports.
- Articles without defining data sources.
- Articles not published in the English language.
- Papers published before 2015.
- Papers that are not relevant to the search string.
Papers have been selected based on the given exclusion criteria and after examining the abstract of selected studies, we have decided to include them in the next screening phase.
4.5. Keywording Using Abstract
To find the relevant papers through keywording using the abstract, we used a process defined by Petersen et al. []. Keywording was done in two phases. First, we examined the abstract and identified the concepts and keywords that reflected the contribution of the studies. The concepts and keywords found in this phase were ML techniques, Type of problem and Domain.
In the second phase, the results and conclusions sections were reviewed. New concepts such as the adaptation of the ML and characteristics of the architecture appeared.
4.6. Quality Assessment
An SLR quality assessment (QA) is carried out to assess the quality of selected papers. In this SLR, a questionnaire has been designed to measure the quality of the selected papers. The QA in this SLR is carried out by following the study of Farooq et al. [].
(a) The study contributes to Big Data and ML in agriculture. The possible answers for this research question were “Yes (+1)” and “No (0).”
(b) The study represents a clear solution in the field of agriculture by using Big Data and ML. The possible answers for this research question were “Yes (+1),” “partially (0.5)” and “No (0).”
(c) The published studies that have been cited by other articles and possible answers for this research question were: “partially (0)” if the citation count is 1 to 5, “No (−1)” if paper is not being cited by any author and “Yes (+1)” if citation count is more than five.
(d) The published study is from a stable and recognized publication source. The answer to this question has been evaluated by considering the Journal Citation Reports (JCR) lists and CORE ranking computer science conferences.
Possible answers for journals and conferences are presented in Table 7.

Table 7.
Quality criteria. JCR: Journal Citation Reports.
Selected studies have a score for each question and the calculated sum of scores is presented in the form of an integer between −1 and 5.
4.7. Study Selection Process
Table 8 shows the results of the selection and search processes. Initially, 1980 articles were selected when the search protocol was applied in the selected repositories. The selection process has been applied based on the inclusion and exclusion criteria, keywords, titles, abstracts and full articles of the retrieved articles. Three research assistants selected papers based on searching through the designed search string. Then, the same assistants applied the selection criteria based on the title of the paper, obtaining a set of 1168 papers. Eliminating duplicate papers, a new set of 873 papers was obtained. We analyzed the abstracts of each paper, selecting those that showed the use of Big Data or ML. A Cohen’s kappa coefficient of 0.86 was used to determine an acceptable level of agreement between the authors []. Furthermore, after reading the full abstracts of the 873 articles selected in the duplication phase, we have selected 224 papers based on their abstracts. After reading the full paper, we have selected 34 pertinent papers that contain the necessary data to answer the research questions.

Table 8.
Primary selection process for retrieved articles.
4.8. Data Extraction Method
The data extraction strategy was applied to provide a set of possible answers to the research questions defined. Table 9 contains the Key words that we have defined per research question.

Table 9.
Key words.
5. Analysis
Once the relevant papers have been selected, they are analyzed to find information that allows us to answer the research questions related to the adaptations made in ML techniques when they are included in Big Data systems. It is important to understand the design of the architectures, application domains and the issues addressed.
5.1. Selection of Results
Analysis of studies on Big Data and ML in agriculture is a key challenge because their multiple domains of application must be covered. To answer our research questions, we brought together 34 primary studies in this section. After analyzing the studies selected, we tried to answer each question with the information extracted. Table 10 presents the quality evaluation for the selected articles and the results of their general classification.

Table 10.
Classification and quality assessment scores.
5.1.1. Answer for RQ1: What Are the Major Targeted Primary Publication Channels for Big Data and Machine Learning Research in Agriculture?
The text continues here. Proofs must be formatted as follows:
Table 11 shows the different publications channels and several articles that have been published on these channels. Of the 34 selected papers, 25 papers (76.4%) were published in journals. Of the remaining papers, 9 (23.6%) were presented in conferences.

Table 11.
Principal Publication Sources.
It is observed that most of the conferences and journals have one or two papers that meet the inclusion and exclusion criteria used. Only the journal “Computers and Electronics in Agriculture” contributes five relevant papers to this study, which implies being a relevant communication channel in the field of Agriculture.
5.1.2. Answer for RQ2: How Has the Frequency of Architectures Been Changed of Big Data in Agriculture over Time?
Figure 5 shows the selected articles published between 2015 and 2020. There was a maintained pace of publications from 2015 to 2017. During 2018 and 2020, there was a significant increase in publications. This increase may indicate the growing interest in Big Data and ML in agriculture.
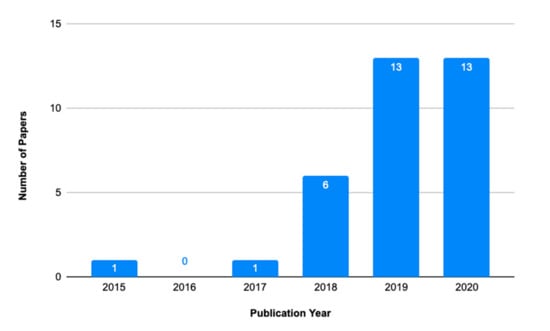
Figure 5.
Distribution of papers selected by year.
5.1.3. Answer for RQ3: What Type of Problems Are Solved Using Big Data and Machine Learning in the Field of Agriculture?
There are many types of problems that are attempted to be solved through Big Data and ML technologies as shown in Figure 6. Each of those found is detailed below:
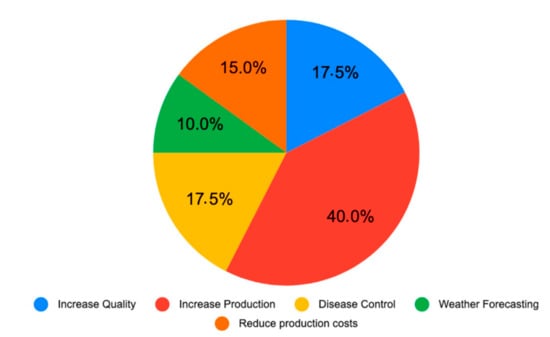
Figure 6.
Distribution of papers selected by Problem type.
(a) Increase Quality: This type of problem refers to the need to improve the quality of products (17.5% of papers).
(b) Increase Production: Refers to the need to increase the quantity of products. In the studies, aspects to be considered were mentioned, such as the search for new land for cultivation, the improvement of the quality of the land, the use of sensors to eliminate bugs (40% of papers).
(c) Disease control: In the case of agricultural products, sensors, images and robots are used in order to control the state of the plant or fruit as it grows. On the other hand, analyzes were used to predict future diseases. (17.5%)
(d) Climate prediction: Different weather variables are analyzed to predict rainfall, possible floods and frost (10%).
(e) Reduce production costs: Sensors are used and in other cases animals, to control diseases and pests. They indicate that they reduce the cost of maintenance (15%).
5.1.4. Answer for RQ4: What Is the Area of Agriculture in Which Big Data Machine Learning Is Used?
We have found the following agricultural items: Farmer, Crops, Animals, Land, Soil, Weed; among others. This category coincides with the work of [] published in 2017. The graph below shows the number of articles analyzed by each item.
It is observed that there is a large number of papers in the Crops area (see Figure 7). These papers describe the use of ML techniques to solve problems with the quantity and quality of products. On the other hand, the ML techniques mainly used allow the traceability of crop and prediction systems.
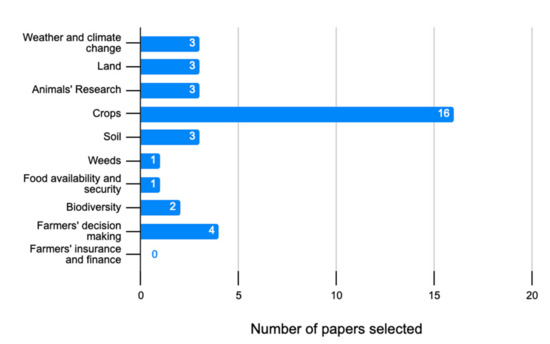
Figure 7.
Distribution of papers selected by agriculture heading.
5.1.5. Answer for RQ5: What Big Data and Machine Learning Architectures Are Used to Solve Problems in Agriculture?
Few works explain the complete characteristics of the architectures used. Table 12 shows a summary of the layers used for each agricultural item.

Table 12.
Layers of ML Big Data architectures used in agriculture.
The architectures of Big Data ML systems in agriculture found in this SLR are described below.
(a) Big Data Architecture for Environmental Analytics: Developed Big Data based knowledge recommendation framework architecture for sustainable precision agricultural decision support system using Computational Intelligence (Machine Learning Analytics) and Semantic Web Technology (Ontological Knowledge Representation). Capturing domain knowledge about agricultural processes, understanding about soil, climatic condition-based harvesting optimization and undocumented farmers’ valuable experiences are essential requirements to develop a suitable system. Architecture to integrate data and knowledge from various heterogeneous data sources, combined with domain knowledge captured from the agricultural industry has been proposed [].
Figure 8 shows the architecture of the system that has been proposed and implemented. The feature extraction process was applied to the metadata to create a feature database from the individual data sources. This processing was carried out using data mining and text mining techniques; in addition to unsupervised ML techniques. On the other hand, several supervised ML techniques were used in order to extract the base of characteristics. The uniqueness of the architecture in this context was the selection of the ML methodology to extract the basis of specific characteristics. The specifics base was determined on the basis of the actual application and also on the basis of expert knowledge of the available domain, generally undocumented and owned by individuals (i.e. farmers) as long-term field experience. Domain-guided extraction by ML was called semantic extraction, therefore it produced a base of semantic characteristics. The meta-feature base and semantic feature were integrated to form an enriched feature space, which was a more meaningful representation of heterogeneous big data. Furthermore, in this architecture, it is shown that dimension reduction can be done in a significant and domain-specific way to increase system efficiency and also to increase system precision by enriching the data semantically.
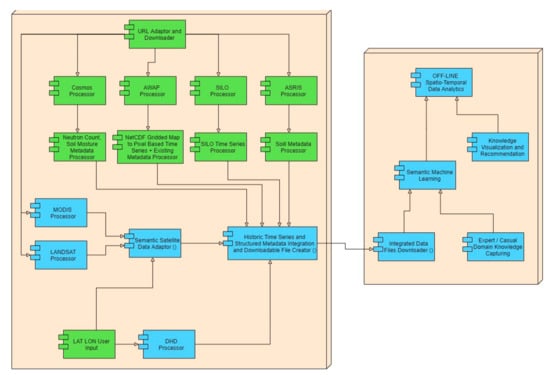
Figure 8.
Big Data Architecture for Environmental Analytics.
(b) Precision agriculture Big Data architecture: This work presents a precision agriculture model to suggest to the farmers which crop to cultivate according to field conditions. Focusing mainly on the agriculture in Telangana region, the model uses a Naïve Bayes classifier to recommend the crop to the farmers. It also suggests which crop can be grown in a specific given environment []. In the architecture, a programming paradigm named MapReduce functionality is used. MapReduce functionality is a variant of the Hadoop Distributed File Systems (HDFS), which provides the parallel processing operation for various parameters collected from different agricultural repositories. It works in a parallel and distributed manner to process the large volume of data.
(c) System architecture of AgroConsultant: Developed an intelligent system, called AgroConsultant, which intends to assist the Indian farmers in making an informed decision about which crop to grow depending on the sowing season, his farm’s geographical location, soil characteristics as well as environmental factors such as temperature and rainfall. AgroConsultant considers all the appropriate parameters, including temperature, rainfall, location and soil condition, to predict crop suitability []. Two subsystems were used (see Figure 9). Subsystem1: CropSuitabilityPredictor. This subsystem is fundamentally concerned with performing the primary function of AgroConsultant, which is, providing crop recommendations to farmers. Subsystem2: RainfallPredictor, predicts the rainfall (in mm) for each month of the current year, depending on the location of the user’s farm. The predicted output of this subsystem can be fed to subsystem1 for predicting the crop suitability.
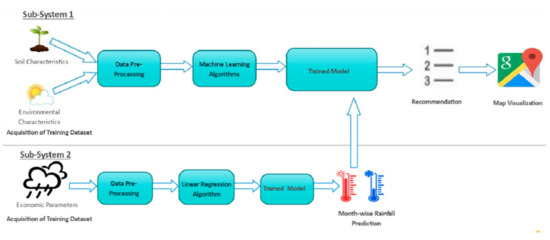
Figure 9.
System architecture of AgroConsultant [].
(d) Big Data Architecture for the crop classification system: a four-level architecture for classification task solving with multitemporal satellite imagery is used. These levels are data preprocessing, classification (supervised) and postprocessing of classification results and visualization of the results (including geospatial analysis) (see Figure 10) []. To decrease the time of downloading satellite imagery, it makes sense to deploy a classification system in the cloud environment, for example, Amazon, where Sentinel-1 data are already available for free. Figure 11 shows an architecture component diagram of the proposed classification system. With such cloud-based approach, geospatial research can be moved from data to analysis with a way smaller delay from the beginning of the study.
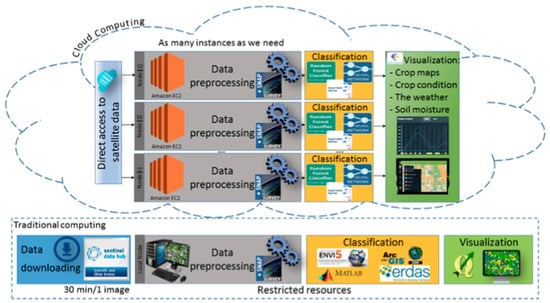
Figure 10.
Workflow of satellite data processing four-level architecture for classification task [].
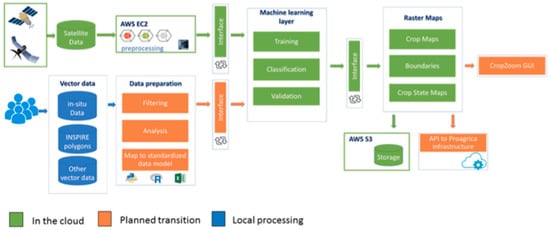
Figure 11.
Big Data Architecture for the crop classification system [].
(e) Architecture for animal monitoring based on IoT technologies: proposed a platform for monitoring animal behavior, based on IoT technologies. It includes a local IoT network to collect animal data and a cloud platform, with processing and storage capabilities, to graze sheep autonomously within vineyard areas []. The cloud platform also incorporates ML functions, allowing the extraction of relevant information from the data collected by the IoT network. Figure 12 depicts the overall architecture of the implemented platform. The left part of this figure shows the devices of the IoT network implemented to run local tasks. Such local infrastructure is in turn interconnected through a wide-band connection (e.g., 3G, 4G, LTE) to a cloud platform, represented in the right part of Figure 12. The Cloud platform is composed of five different interconnected modules, responsible for the aggregation, analysis and processing of stream data, being the base of the architecture configuration.
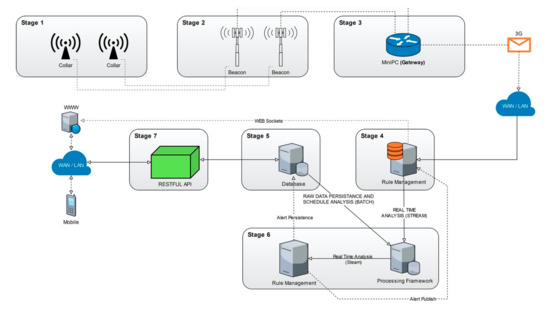
Figure 12.
Architecture for Animal monitoring based on Internet of Things (IoT) technologies.
(f) DSS LANDS Architecture for Forecasting Crop Disease: This is a prototype agricultural DSS developed in collaboration with Laore Sardinia Agency []. Laore Sardinia Agency deals with providing advisory, education, training and assistance services in the regional agricultural sector. The DSS is designed to help Laore technicians and Sardinian farmers in decision-making. The purposes of LANDS are: (i) to optimize resource management by reducing certain inputs (for example, chemical and natural resources, etc.); (ii) to predict crop risk situations (for example, diseases, weather alerts, etc.); (iii) increase the quality of decisions for field management (iv) reduce environmental impact and production costs. To address the objectives, LANDS is divided into three steps: (i) collects, organizes and integrates a large amount of data from different sources; (ii) analyzes and interprets the information; and (iii) uses the analysis to recommend the best action to take. The authors structured the DSS LANDS into three components: (i) an integrated system for monitoring the crop components and store their data; (ii) a data analysis modules system which performs through several mathematical and forecasting models across and dynamic analysis of different types of data; (iii) a cross-platform application used by farmers to upload crop data collected during the field survey and to visualize the up-to-date information for managing the cultivation. Figure 13 shows the DSS LANDS Architecture for Forecasting Crop Disease.
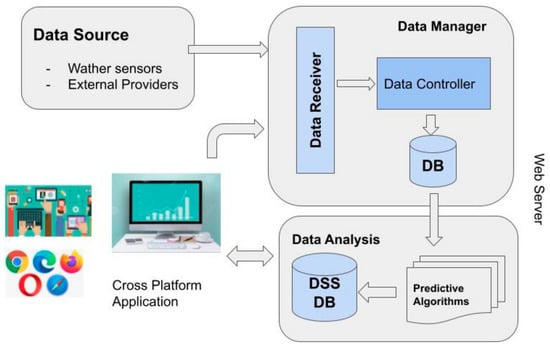
Figure 13.
DSS LANDS Architecture for Forecasting Crop Disease.
5.1.6. Answer for RQ6: What Approaches Were Used to Solve the Problems?
There are several approaches found in the field of Big Data and ML in Agriculture, as shown in Figure 14. Each approach has been investigated in this section.
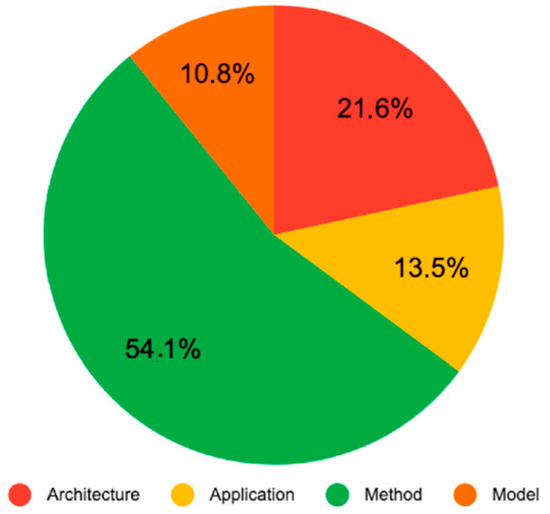
Figure 14.
Research Approaches in Big Data and ML Agriculture.
(a) Architecture: Only 8 papers (21.6%) describe the architectures used and how ML is integrated for data analysis. The characteristics of these are described in Section 5.1.5.
(b) Application: 13.5% of the analyzed works describe the development of an application. Wang, Yang and Liu [], used IoT technology, Big Data and ML algorithms, to create an application that includes data collection, data storage, data analysis and visualization management, we present a complete scheme. Through the agricultural Big Data system, they reduce the cost of production and improve production efficiency. On the other hand, Yang et al. [], created an IoT and M2M system that directs a new trend for agricultural development. They use the parallel extension capacity, so that the system can gradually connect to large-scale indoor farms to make these farms blend with each other organically.
(c) Method: 54.1% of the papers describe the development of a method for data analysis. Balducci, Impedovo and Pirlio [] created a method to manage heterogeneous information and data from real data sets that collect physical, biological and sensory values. The method includes the design and implementation of practical tasks, ranging from crop harvest forecasting to reconstructing missing or incorrect sensor data, exploiting and comparing various machine learning techniques to suggest in which direction to employ efforts and investments. On the other hand, Taghizadeh-Mehrjardi et al. [] created a method to assess the suitability of land for two main crops (i.e., wheat and rainfed barley) according to the Organization’s “Land Suitability Assessment Framework” for Agriculture and Food (FAO). Wei et al. [] developed a method to generate a carrot yield map applying a random forest regression algorithm on a database composed of satellite spectral data and ground carrot yield sampling. Mosavi et al. [] propose a method that includes new ML models for the susceptibility mapping of soil water erosion. The weighted subspace random forest, the Gaussian process with a radial basis function kernel and Bayes naive ML methods were used in predicting susceptibility to soil erosion. The method consisted of five sections: preparation and compilation of the relevant factors for modeling soil erosion; extraction of eroded and non-eroded locations through field observations; selection of essential factors; modeling of water erosion; and evaluate the performance of the models. Tarik and Mohammed [] used a methodology using methodological data to prevent the rate of cereal production in an area characterized by an unstable climate using artificial neural networks.
(d) Model: 10.8% of the papers describe the development of a model. Rehman et al. [] created a model that uses different ML algorithms to improve pesticide use. On the other hand, Sagi and Jain [] created a model of H2O to be used in a validation framework of the use of ML algorithms.
5.1.7. Answer for RQ7: What Are the Main Application Domains of Big Data and Machine Learning in Agriculture?
Big Data and ML solutions for agriculture consist of multiple tracing, control and prediction applications, which measure various types of variables such as climate (temperature, humidity), soil, water, fertilization, control of pests and location tracking. The main application domain selected in this SLR is prediction, as shown in Figure 15. Most studies have focused on prediction (67.6%), control (11.8%) and Tracing (20.6%).
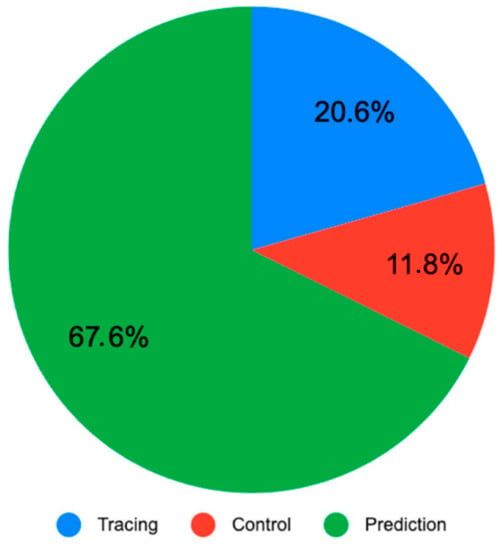
Figure 15.
Application Domains.
5.1.8. Answer for RQ8: What Machine Learning Techniques Have Been Used in the Big Data Architectures Found?
In the reviewed articles, a variety of ML techniques have been used, as shown in the graph in Figure 16.
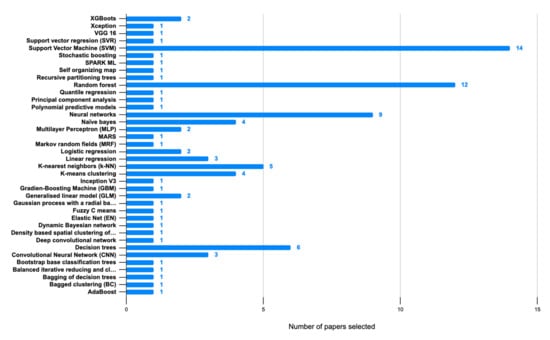
Figure 16.
ML Techniques used in Big Data for Agriculture.
The most widely used ML techniques are support vector machine (SVM), Random Forest and Neural Networks. SVM has been used for text analysis when a diversity of dimensions is available. This is the case of the comments from experts that were introduced to Big Data systems, in addition to a set of data from sensors, images and weather. On the other hand, Random Forest was appropriate for cases in which a large volume of data is available and therefore greater efficiency in data processing is required. For the cases analyzed, the technique was appropriate when a large amount of information is available from satellite images. Finally, Neuronal Networks was used for image recognition, which is widely used for disease prediction. On the other hand, the technique seemed appropriate when the Big Data system delivered recommendations to farmers.
5.1.9. Answer for RQ9: What Are the Adaptations That ML Uses in Big Data in the Field of Agriculture?
In Section 3.4, a series of adaptations of ML were mentioned to be used in conjunction with Big Data. In this section, we describe the adaptations mentioned in the 8 papers that describe the system architecture. An ML module for data analysis is included in the architectures.
For the architecture “Big Data Architecture for Environmental Analytics” they used a set of ML techniques []. The authors indicated that it was necessary to solve the problem of carrying out learning, inference and prediction tasks using Linked Open Data. To do this, the authors proposed incorporating various learning algorithms into the cloud-based computing infrastructure to provide the analytical power necessary to capture and integrate interesting patterns from heterogeneous data sources. Another important aspect is the use of an ontology translator for automatic reasoning from dynamic time-series data from environmental sensors and sensor networks. The pre-processed time series data were batch processed and represented as daily averaged data for this study.
In “Smart Farming Architecture for Sustainable Agriculture” [], the authors explain the need to adapt ML in Big Data when it is used in precision agriculture. On the other hand, smart agriculture extends beyond management activities, not only in location but also in data, context and understanding of the situation triggered by events in real-time. The authors empirically validated the efficacy and robustness of deep learning in the analysis and representation of features in the context of interpreting scenes from remote sensing images. They used a generic computer vision technique for image feature analysis and its representation that is based on deep neural networks for smart agricultural applications.
In “Crop Prediction Architecture” [], they used the prediction through different factors, determining the type of crop most apt to grow in a certain sector. The authors adapted ML techniques to use data with a low computational cost. They explain that the model can be further improved to find the yield of each crop and to recommend pesticides. It can also be modified to suggest fertilizers and the need for irrigation of crops.
Also, in “AgroConsultant Architecture” [], they faced the problem of identifying appropriate ML models for crop classification and implementing the workflow for large-scale crop mapping on a cloud platform. To reduce the download time of satellite images, it makes sense to implement a classification system in the cloud environment, for example, Amazon, where Sentinel-1 data is already available for free. As a result, they developed a crop classification workflow and CropZoom web to handle automated data visualization tasks, which are based on ML techniques. Such a web service enables the end-user to get the basic GIS functionality that is flexible in terms of data management and ease of keeping the products up to date.
Another problem faced was the development of the architecture in “Cloud Approach to Automated Crop Classification” [], in which the satellite data is too large to process. The authors used the Google Earth Engine cloud computing platform for image processing.
In the architecture of “Animal monitoring based on IoT technologies” [], they used various supervised learning techniques, such as Random Forest, Decision Trees (DT) using C50 and rpart packages, XGBoost, K-Neighbors Neighbors (KNN), Support Vector Machine (SVM) and Naïve Bayes. The authors used data from videos of the animals, as metadata is required to be added to the positions of the animals (i.e., standing, resting, eating) versus data extracted from sensors placed on the same animal. The data from the videos was extracted using complex algorithms that they developed for this particular case.
In the architecture of “Agricultural cropland extent” [], they developed a high spatial resolution baseline cropland land area product from South Asia, using Landsat satellite time series on Google. The problem they faced is that the satellite data is too large to process, so they used the Google Earth Engine cloud computing platform for image processing.
Finally, for the architecture of the application of the “machine learning Technique in Forecasting Crop Disease” [], they had to adapt the data used from DSS LANDS, used to support Sardinian farmers in making decisions, managing different big data to forecast crop diseases, yield productivity and reduce the costs of farm operations. The authors modified the regional meteorological variables they need to predict the risk of potato late blight in southern Sardinia using a machine learning approach.
Table 13 summarizes the adaptations made on ML techniques that can be used in Big Data architectures for agriculture. The type of adaptation indicates if it is in volume, velocity, veracity, variety or value.

Table 13.
ML adaptations for Big Data architectures in agriculture.
6. Discussion
The findings are discussed in various aspects, such as the technologies used and the ML techniques considering the problems to be solved. On the other hand, it is important to analyze the contributions of new technologies for agriculture, such as the recent Data Lake and Business Intelligence.
6.1. Big Data and ML in Agriculture
Figure 17 and Figure 18 show a graph representing an XY scatter diagram. The size of each bubble is proportional to the number of papers that are in the pair of categories that correspond to the coordinates in which the bubble is located.
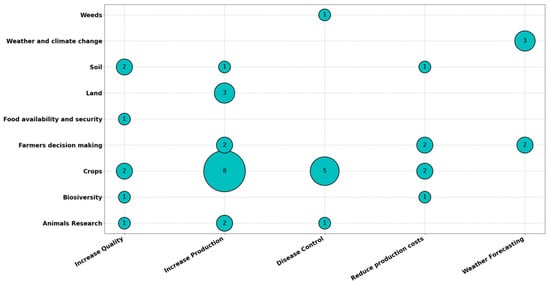
Figure 17.
Agriculture types versus the types of problems encountered.
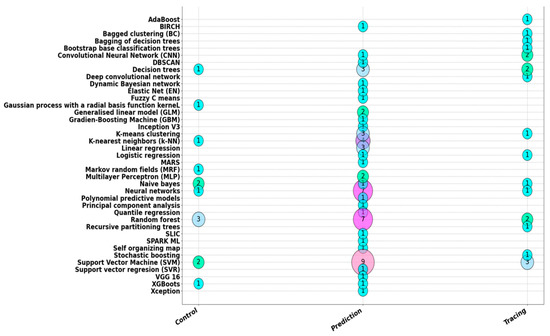
Figure 18.
ML techniques used versus the application domains.
Figure 17 presents the number of papers by agriculture heading versus the type of problem it solves.
We found few papers describing the use of Big Data and ML for weeds, food availability and security and biodiversity problems. Greater advances are observed in the Crops area to solve production problems and diseases. ML and Big Data are being used to analyze a large volume of historical data from sensors, satellite images, photos, climate studies and data from expert farmers, using cloud tools. Quality and cost reduction of production seem less important. These research topics are likely to increase in the coming years.
On the other hand, Figure 18 shows the number of papers by ML technique versus application domains in agriculture. It is observed that the most used techniques are Random Forest, Support Vector Machine and Neural Networks.
The main ML techniques used are explained in Section 5.1.8. On the other hand, Figure 18 shows that ML has been used mainly for prediction.
6.2. Technologies Used in Big Data and ML Architectures for Agriculture
Figure 19 presents a cloud of concepts about the technologies used in Big Data and ML architectures in agriculture. Technologies for data acquisition are used in data collection systems for the environment, soil, plant data, animals; through sensors, satellite images and videos. On the other hand, data from experts, data from other systems and the cloud are collected.
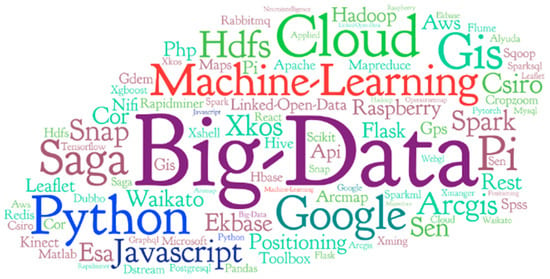
Figure 19.
Cloud of Concepts of the Technologies used.
Big Data enables remote sensing for land mapping to grow large-scale crops. That is essential to monitor agricultural impacts in various countries and areas concerning achieving their productivity and environmental sustainability goals, providing a basis for the establishment of platforms for policymakers, helping in decision-making towards the sustainability of physical ecosystems, quantitative analysis of the interaction between plants and their environment, with high precision and accuracy. All of the aforementioned is possible thanks to satellite image data and its availability in the cloud. On the other hand, cloud technologies are suitable for the required analytics. That facilitates the development of new Big Data architectures, which also include the proper use of ML.
ML is used to do classifications and predictive analytics by finding the internal links between data collected by processing the data into information and other resources. Furthermore, it provides data support for new operations and performs multiple processing techniques such as image processing, statistical analysis, simulation, prediction, early warning and modeling.
Cloud Computing provides software services, hardware services, infrastructure services and platform services for different Big Data agricultural applications. The cloud platform offers farmers cheap data storage services such as images, text, videos and other agricultural data, making it easier for businesses by reducing the cost of storage.
In terms of data visualization, the systems allow monitoring environmental conditions, crop and plant growth, diseases, soil and location of the animals. On the other hand, the visualization allows the control of different agricultural parameters such as pests and fertilization.
6.3. A Framework of Technological Challenges for the Use of ML and Big Data in Agriculture
The adaptations of ML in Big Data for agriculture have been implemented to solve problems of processing a volume of data and aspects of variety. The cloud largely solves the problem thanks to the different applications and resources available (i.e., treatment of satellite images and videos).
The speed of data ingestion is still a challenge considering data sources such as sensors, drones, cameras and other systems. Regarding data processing, speed depends on factors such as data volume and selected technologies. The cloud has technologies, such as Data Lake, to process data and store it in different areas according to the level of processing or detail. The use of these Data Lake is a challenge for developers since there are not enough trained human resources for their implementation.
Data Lake is defined as “a large, heterogeneous, raw data storage system, powered by multiple data sources and allowing users to explore, extract and analyze data” []. The positive aspects of its users consider the improvement in data quality since it is provided by a set of metadata; data control and traceability according to data governance policies; the integration of data of all types and formats; the organization of data logically and physically. Data Lake integrates with Big Data to store and control the data in its different states, raw data, semi-processed and processed (value data), thus improving the speed of processing in the analysis for ML.
Another technological challenge is data visualization since platforms and applications for agriculture still have traditional designs. It is necessary to incorporate the use of Business Intelligence tools and intelligent platforms, such as those of Microsoft, IBM (Watson) and those of the cloud, to display data dynamically, allowing decision-makers to manipulate data and reports according to the needs of the moment in real-time []. In the context of Big Data, traditional data visualization methods cannot meet the needs of data visualization and analysis. How to handle this data and extract its potential value has become increasingly important for competition and organizational development [].
Figure 20 presents a framework with the technological challenges of the use of ML and Big Data in agriculture.
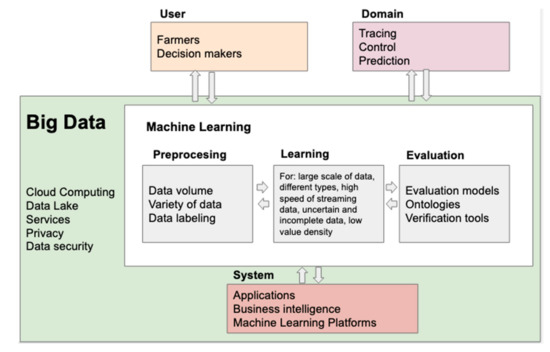
Figure 20.
A framework of Machine Learning and Big Data challenges in agriculture.
From the analyzed papers we find several challenges that must be solved to use ML in Big Data in the area of agriculture. The main ones are the following:
(a) Redundancy in the data: It is also known as data duplication and leads to inconsistent data that can be detrimental to the ML based system. There are techniques to identify duplicates in a given data set [] but these traditional methods are not effective in the case of Big Data. In the cases analyzed, we have found redundancy problems when using various data sources, such as sensors, satellite images and expert judgment.
(b) Data discretization: is the process of translating quantitative data into qualitative data that results in a non-overlapping division of continuous domain. In the case of agriculture, the challenge remains to use adequate data visualization systems for this. In most cases graphs of the data are shown and the profile of the users as farmers is not considered.
(c) Data labeling: In this regard, data labeling tools have not been used to improve understanding of the data obtained from data sources. This challenge is important so that Big Data can be used with new technologies such as Data Lake.
(d) Privacy and data security: quality, which has always been a key issue in agricultural management information systems but is more challenging with volume of real-time data. On the other hand, data privacy and security have not been mentioned in the analyzed papers.
(e) Interoperability due to the growing number of platforms and services: There is still little concern about using standards and formats that allow the exchange of information, in addition to interoperability.
(f) Bandwidth for data transmission: It is still a problem due to the increasing volume of data [].
(g) Fault tolerance: It is still a challenge because data processing is done in batches, faults are possible and the process or information must be recovered [].
(h) Using ML tools in the cloud: Some papers describe the challenge of using ML tools in the cloud. Some examples are: Microsoft Azure Machine Learning, now part of Cortana Intelligence Suite []; Google Cloud ML Platform []; Amazon ML []; and IBM Watson Analytics []. Because these services are backed by powerful cloud providers, they offer not only scalability but also integration with other cloud platform services. With Big Data, this results in high network traffic and can even become unfeasible due to time or bandwidth requirements. Because these ML services are proprietary, information about their underlying technologies is very limited [].
7. Threats to Validity
There have been four kinds of threats to validity identified in this section [].
7.1. Construct Validity
In SLR, threats to construct validity are relevant to the classification of selected studies []. The search keywords have been proposed and identified by one of the authors and three terms related to Big Data and ML in agriculture have been used for the search string. However, the list is not complete some alternative and additional terms may alter the list of final selected works. A search string was performed using IEEE Xplore, Science Direct, Springer, MDPI and Scopus. Based on search engine statistics, we have found most of the research papers related to Big Data and ML in agriculture. To mitigate the risk of losing essential and related publications, we have searched the related articles from state of the art reports and surveys.
7.2. Internal Validity
This type of validity handles the extraction data analysis process, in which two authors have identified the classification of the selected articles and the data extraction process, while one author reviewed the final results []. Two research assistants collected the data and then classified the papers. The value of the Kappa coefficient was 0.86, indicating that there has been a reasonable level of agreement between the authors and significantly reduces the threats of dissimilarity by showing a similar understanding of relevance.
7.3. External Validity
External validity is related to the generalizability of this study []. The results of the SRL have been considered concerning the domain of Big Data and ML and the validity of the results presented in this document refers only to the domain of agriculture. The classification of the articles and the search string presented in this research can help professionals as a starting point for agricultural research and the use of Big Data and ML.
7.4. Conclusion Validity
The threat of the validity of the conclusion is related to the identification of inappropriate relationships that can generate an incorrect conclusion. In the mapping study, a conclusion validity threat refers to the different elements, such as incorrect data extraction and missing studies. To lessen this threat, the data extraction and selection process has been clearly defined in the previous paragraph on internal validity. Traceability between the extracted data and the conclusion has been strengthened through the direct generation of frequency diagrams and bubble diagrams generated from the data collected through the application of statistical analysis [].
8. Conclusions
This paper presented an SLR about the use of Big Data and ML in agriculture. The RSL methodology was used to search and classify papers related to this topic. We included papers that explained ML techniques and their adaptations for their use as part of the Big Data system. A total of 34 papers were selected, of which 8 detailed characteristics of the system architecture.
A common assumption in ML is that algorithms can learn better with more data, providing more accurate results []. However, massive data sets pose a set of challenges because traditional algorithms were not designed to meet such requirements []. For agriculture, the use of sensors and satellite images is becoming common, which generates large volumes of data that are currently stored in the cloud. The use of Big Data and ML has been possible thanks to the tools available in the cloud and the adaptations created for ML.
ML and Big Data are becoming an active research area, so architecture design and software system development plays a vital role. In the case of agriculture, Big Data architectures working in conjunction with ML techniques have been proposed. These proposals were adapted for use in the cloud, favoring the manipulation of large volumes of data and fast processing. Then it is possible to affirm that the volume of data is no longer a problem, not so the transmission of data for visualization and analysis in real-time.
There is still a challenge about processing speed due to little control of the data in its different stages, raw data, semi-processed and processed (value data). Data Lake promises to be the technology that allows managing traceability in a transparent and fast way for the user.
On the other hand, visualizing information is a key challenge for data analysis. With increasing amounts of data to be interpreted, using the correct visualizations is crucial to understanding the underlying patterns and the results obtained by ML algorithms. Despite its importance, defining the correct visualization remains a challenging task. System users are seldom information visualization experts and perhaps they do not know the most suitable visualization tools or patterns for their needs. Consequently, misinterpreted graphs and incorrect results can be obtained, leading farmers to miss opportunities. The new Business Intelligence tools can be a suitable solution for farmers to make more complex decisions in real-time.
As future work, we plan to develop the ML and Big Data for an agriculture framework in more detail and later implement it in a small smart-type project.
Author Contributions
A.C. contributed to the planning, organization and direction of the SRL; paper writing and formatting; S.S. contributed to the methodological support and expert judgement; figures and tables. Both authors have read and agreed to the published version of the manuscript.
Funding
This research was funded by Universidad de La Frontera, Vicerrectoría de Investigación y Postgrado. Dra. Ania Cravero thanks to research project DIUFRO DI21-0014. Samuel Sepúlveda thanks to research project DIUFRO DI20-0060.
Acknowledgments
Special thanks to Felipe Vásquez, Sebastian Pardo and Mauricio Campos for their useful technical support on this work.
Conflicts of Interest
The authors declare no conflict of interest.
References
- Slavin, P. Climate and famines: A historical reassessment. Wiley Interdiscip. Rev. Clim. Chang. 2016, 7, 433–447. [Google Scholar] [CrossRef]
- El Bilali, H.; Bassole, I.H.N.; Dambo, L.; Berjan, S. Climate change and food security. Agric. For. 2020, 66, 197–210. [Google Scholar]
- Pozza, L.E.; Field, D.J. The science of Soil Security and Food Security. Soil Secur. 2020, 1, 100002. [Google Scholar] [CrossRef]
- Gebbers, R.; Adamchuk, V.I. Precision Agriculture and Food Security. Science 2010, 327, 828–831. [Google Scholar] [CrossRef] [PubMed]
- WFS. Declaration on World Food Security and World Food Summit Plan of Action; WFS: Rome, Italy, 1996. [Google Scholar]
- Kamilaris, A.; Kartakoullis, A.; Prenafeta-Boldú, F.X. A review on the practice of big data analysis in agriculture. Comput. Electron. Agric. 2017, 143, 23–37. [Google Scholar] [CrossRef]
- Liakos, K.G.; Busato, P.; Moshou, D.; Pearson, S.; Bochtis, D. Machine learning in agriculture: A review. Sensors 2018, 18, 2674. [Google Scholar] [CrossRef] [PubMed]
- Sundmaeker, H.; Verdouw, C.; Wolfert, S.; Pérez Freire, L. Internet of Food and Farm. In Digitising the Industry—Internet of Things Connecting the Physical, Digital and Virtual Worlds; Vermesan, O., Friess, P., Eds.; River Publishers: Gistrup/Delft, Denmark, 2017. [Google Scholar]
- Wolfert, S.; Ge, L.; Verdouw, C.; Bogaardt, M.-J. Big data in smart farming—A review. Agric. Syst. 2017, 153, 69–80. [Google Scholar] [CrossRef]
- Nandyala, C.S.; Kim, H.-K. Big and Meta Data Management for U-Agriculture Mobile Services. Int. J. Softw. Eng. Appl. 2016, 10, 257–270. [Google Scholar] [CrossRef]
- Sun, A.Y.; Scanlon, B.R. How can Big Data and machine learning benefit environment and water management: A survey of methods, applications, and future directions. Environ. Res. Lett. 2019, 14, 073001. [Google Scholar] [CrossRef]
- Prudius, A.A.; Karpunin, A.A.; Vlasov, A.I. Analysis of machine learning methods to improve efficiency of big data processing in Industry 4.0. J. Phys. Conf. Ser. 2019, 1333, 032065. [Google Scholar] [CrossRef]
- Ryan, I.; Li-Minn, A.; Phooi, S.K.; Broster, J.C.; Pratley, J.E. Big data and machine learning for crop protection. Comput. Electron. Agric. 2018, 151, 376–383. [Google Scholar]
- Wu, H.; Meng, F.J. Review on Evaluation Criteria of Machine Learning Based on Big Data. J. Phys. Conf. Ser. 2020, 1486, 052026. [Google Scholar] [CrossRef]
- Sassi, I.; Ouaftouh, S.; Anter, S. Adaptation of Classical Machine Learning Algorithms to Big Data Context: Problems and Challenges: Case Study: Hidden Markov Models Under Spark. In Proceedings of the 2019 1st International Conference on Smart Systems and Data Science (ICSSD), Rabat, Morocco, 3–4 October 2019; IEEE: Piscataway, NJ, USA, 2019; pp. 1–7. [Google Scholar]
- Al-Jarrah, O.Y.; Yoo, P.D.; Muhaidat, S.; Karagiannidis, G.K.; Taha, K. Efficient Machine Learning for Big Data: A Review. Big Data Res. 2015, 2, 87–93. [Google Scholar] [CrossRef]
- Che, D.; Safran, M.; Peng, Z. From Big Data to Big Data Mining: Challenges, Issues, and Opportunities. In Proceedings of the Medical Image Computing and Computer-Assisted Intervention—MICCAI 2010, Beijing, China, 20–24 September 2010; Springer: Berlin, Germany, 2013; pp. 1–15. [Google Scholar]
- Chen, X.-W.; Lin, X. Big Data Deep Learning: Challenges and Perspectives. IEEE Access 2014, 2, 514–525. [Google Scholar] [CrossRef]
- Slavakis, K.; Giannakis, G.B.; Mateos, G. Modeling and Optimization for Big Data Analytics: (Statistical) learning tools for our era of data deluge. IEEE Signal Process. Mag. 2014, 31, 18–31. [Google Scholar] [CrossRef]
- Qiu, J.; Wu, Q.; Ding, G.; Xu, Y.; Feng, S. A survey of machine learning for big data processing. EURASIP J. Adv. Signal Process. 2016, 2016. [Google Scholar] [CrossRef]
- Bhatnagar, R. Machine Learning and Big Data Processing: A Technological Perspective and Review. Adv. Intell. Syst. Comput. 2018, 468–478. [Google Scholar] [CrossRef]
- James, M.; Michael, C.; Brad, B.; Jacques, B. Big Data: The Next Frontier for Innovation, Competition and Productivity; McKinsey Global Institute: New York, NY, USA, 2011. [Google Scholar]
- Neethirajan, S. The role of sensors, big data and machine learning in modern animal farming. Sens. Bio Sens. Res. 2020, 29, 100367. [Google Scholar] [CrossRef]
- L’Heureux, A.; Grolinger, K.; El Yamany, H.F.; Capretz, M.A.M. Machine Learning with Big Data: Challenges and Approaches. IEEE Access 2017, 5, 7776–7797. [Google Scholar] [CrossRef]
- Keele, S. Guidelines for Performing Systematic Literature Reviews in Software Engineering; Technical Report, Ver. 2.3; EBSE: Durham, UK, 2007. [Google Scholar]
- Cherkassky, V.; Mulier, F. Learning from Data: Concepts, Theory and Methods; Wiley: Hoboken, NJ, USA, 2007. [Google Scholar]
- Rudin, C.; Wagstaff, K.L. Machine learning for science and society. Mach. Learn. 2013, 95, 1–9. [Google Scholar] [CrossRef]
- Elshawi, R.; Sakr, S.; Talia, D.; Trunfio, P. Big Data Systems Meet Machine Learning Challenges: Towards Big Data Science as a Service. Big Data Res. 2018, 14, 1–11. [Google Scholar] [CrossRef]
- Haig, B.D. Big data science: A philosophy of science perspective. Big Data Psychol. Res. 2020, 15–33. [Google Scholar] [CrossRef]
- De Mauro, A.; Greco, M.; Grimaldi, M. A formal definition of Big Data based on its essential features. Libr. Rev. 2016, 65, 122–135. [Google Scholar] [CrossRef]
- Demchenko, Y.; De Laat, C.; Membrey, P. Defining architecture components of the Big Data Ecosystem. In Proceedings of the 2014 International Conference on Collaboration Technologies and Systems (CTS), Minneapolis, MN, USA, 19–23 May 2014; pp. 104–112. [Google Scholar] [CrossRef]
- Santos, M.Y.; Sá, J.O.E.; Costa, C.; Galvão, J.; Andrade, C.; Martinho, B.; Lima, F.V.; Costa, E. A Big Data Analytics Architecture for Industry 4.0. Adv. Intell. Syst. Comput. 2017, 175–184. [Google Scholar] [CrossRef]
- Sowmya, R.; Suneetha, K. Data mining with big data. In Proceedings of the 2017 11th International Conference on Intelligent Systems and Control. (ISCO), Coimbatore, India, 5–6 January 2017; IEEE: Piscataway, NJ, USA; pp. 246–250. [Google Scholar]
- Ordonez, C.; Garcia-Alvarado, C.; Song, I.-Y. Special issue on DOLAP 2015: Evolving data warehousing and OLAP cubes to big data analytics. Inf. Syst. 2017, 68, 1–2. [Google Scholar] [CrossRef]
- Song, I.-Y.; Zhu, Y. Big data and data science: What should we teach? Expert Syst. 2015, 33, 364–373. [Google Scholar] [CrossRef]
- Sarker, M.N.I.; Islam, M.S.; Ali, M.A.; Islam, M.S.; Salam, M.A.; Mahmud, S.H. Promoting digital agriculture through big data for sustainable farm management. Int. J. Innov. Appl. Stud. 2019, 25, 1235–1240. [Google Scholar]
- Zhou, L.; Pan, S.; Wang, J.; Vasilakos, A.V. Machine learning on big data: Opportunities and challenges. Neurocomputing 2017, 237, 350–361. [Google Scholar] [CrossRef]
- Chan, K.Y.; Kwong, C.; Wongthongtham, P.; Jiang, H.; Fung, C.K.; Abu-Salih, B.; Liu, Z.; Wong, T.; Jain, P. Affective design using machine learning: A survey and its prospect of conjoining big data. Int. J. Comput. Integr. Manuf. 2018, 33, 645–669. [Google Scholar] [CrossRef]
- Isabella, S.J.; Srinivasan, S. An understanding of machine learning techniques in big data analytics: A survey. Int. J. Eng. Technol. 2018, 7, 666–672. [Google Scholar] [CrossRef]
- Mahajan, D.; Park, J.; Amaro, E.; Sharma, H.; Yazdanbakhsh, A.; Kim, J.K.; Esmaeilzadeh, H. TABLA: A unified template-based framework for accelerating statistical machine learning. In Proceedings of the 2016 IEEE International Symposium on High Performance Computer Architecture (HPCA), Barcelona, Spain, 12–16 March 2016. [Google Scholar] [CrossRef]
- Rathor, A.; Gyanchandani, M. A review at Machine Learning algorithms targeting big data challenges. In Proceedings of the 2017 International Conference on Electrical, Electronics, Communication, Computer, and Optimization Techniques (ICEECCOT), Mysuru, India, 15–16 December 2017; pp. 1–7. [Google Scholar] [CrossRef]
- Divya, K.S.; Bhargavi, P.; Jyothi, S. Machine Learning Algorithms in Big data Analytics. Int. J. Comput. Sci. Eng. 2018, 6, 63–70. [Google Scholar] [CrossRef]
- Swathi, R.; Seshadri, R. Systematic survey on evolution of machine learning for big data. In Proceedings of the 2017 International Conference on Intelligent Computing and Control Systems (ICICCS), Madurai, India, 15–16 June 2017; pp. 204–209. [Google Scholar] [CrossRef]
- Dybå, T.; Dingsøyr, T. Empirical studies of agile software development: A systematic review. Inf. Softw. Technol. 2008, 50, 833–859. [Google Scholar] [CrossRef]
- Petersen, K.; Feldt, R.; Mujtaba, S.; Mattsson, M. Systematic mapping studies in software engineering. In Proceedings of the 12th International Conference on Evaluation and Assessment in Software Engineering (EASE), Bari, Italy, 26–27 June 2008; pp. 1–10. [Google Scholar]
- Farooq, M.S.; Riaz, S.; Abid, A.; Umer, T.; Bin Zikria, Y. Role of IoT Technology in Agriculture: A Systematic Literature Review. Electronics 2020, 9, 319. [Google Scholar] [CrossRef]
- Landis, J.R.; Koch, G.G. The Measurement of Observer Agreement for Categorical Data. Biometrics 1977, 33, 159–174. [Google Scholar] [CrossRef] [PubMed]
- Dutta, R.; Li, C.; Smith, D.; Das, A.; Aryal, J. Big Data Architecture for Environmental Analytics. New Trends Nonlinear Control Theory 2015, 578–588. [Google Scholar] [CrossRef]
- Balducci, F.; Impedovo, D.; Pirlo, G. Machine Learning Applications on Agricultural Datasets for Smart Farm Enhancement. Machines 2018, 6, 38. [Google Scholar] [CrossRef]
- Gómez, D.; Salvador, P.; Sanz, J.; Casanova, J.L. Potato Yield Prediction Using Machine Learning Techniques and Sentinel 2 Data. Remote Sens. 2019, 11, 1745. [Google Scholar] [CrossRef]
- Taghizadeh-Mehrjardi, R.; Nabiollahi, K.; Rasoli, L.; Kerry, R.; Scholten, T. Land Suitability Assessment and Agricultural Production Sustainability Using Machine Learning Models. Agronomy 2020, 10, 573. [Google Scholar] [CrossRef]
- Wei, M.C.F.; Maldaner, L.F.; Ottoni, P.M.N.; Molin, J.P. Carrot Yield Mapping: A Precision Agriculture Approach Based on Machine Learning. AI 2020, 1, 229–241. [Google Scholar] [CrossRef]
- Mosavi, A.; Sajedi-Hosseini, F.; Choubin, B.; Taromideh, F.; Rahi, G.; Dineva, A.A. Susceptibility Mapping of Soil Water Erosion Using Machine Learning Models. Water 2020, 12, 1995. [Google Scholar] [CrossRef]
- Abbas, F.; Afzaal, H.; Farooque, A.A.; Tang, S. Crop Yield Prediction through Proximal Sensing and Machine Learning Algorithms. Agronomy 2020, 10, 1046. [Google Scholar] [CrossRef]
- Tombe, R. Computer Vision for Smart Farming and Sustainable Agriculture. In Proceedings of the 2020 IST-Africa Conference (IST-Africa), Kampala, Uganda, 18–22 May 2020; IEEE: Piscataway, NJ, USA, 2020. [Google Scholar]
- Diaz, C.A.M.; Castaneda, E.E.M.; Vassallo, C.A.M. Deep Learning for Plant Classification in Precision Agriculture. In Proceedings of the 2019 International Conference on Computer, Control, Informatics and its Applications (IC3INA), Tangerang, Indonesia, 23–24 October 2019; IEEE: Piscataway, NJ, USA, 2019; pp. 9–13. [Google Scholar]
- Priya, R.; Ramesh, D.; Khosla, E. Crop Prediction on the Region Belts of India: A Naïve Bayes MapReduce Precision Ag-ricultural Model. In Proceedings of the 2018 Int. Conf. Adv. Comput. Commun. informatics (ICACCI), Bangalore, India, 19–22 September 2018; IEEE: Piscataway, NJ, USA, 2018; pp. 99–104. [Google Scholar]
- Doshi, Z.; Nadkarni, S.; Agrawal, R.; Shah, N. AgroConsultant: Intelligent Crop Recommendation System Using Machine Learning Algorithms. In Proceedings of the 2018 Fourth International Conference on Computing Communication Control and Automation (ICCUBEA), Pune, India, 16–18 August 2018; pp. 1–6. [Google Scholar] [CrossRef]
- Shelestov, A.; Lavreniuk, M.; Vasiliev, V.; Shumilo, L.; Kolotii, A.; Yailymov, B.; Kussul, N.; Yailymova, H. Cloud Approach to Automated Crop Classification Using Sentinel-1 Imagery. IEEE Trans. Big Data 2020, 6, 572–582. [Google Scholar] [CrossRef]
- Nobrega, L.; Tavares, A.; Cardoso, A.; Goncalves, P. Animal monitoring based on IoT technologies. In Proceedings of the 2018 IoT Vertical and Topical Summit on Agriculture—Tuscany (IOT Tuscany), Monteriggioni, Italy,, 8–9 May 2018; IEEE: Piscataway, NJ, USA, 2018; pp. 1–5. [Google Scholar]
- Lee, W.; Ham, Y.; Ban, T.-W.; Jo, O. Analysis of Growth Performance in Swine Based on Machine Learning. IEEE Access 2019, 7, 161716–161724. [Google Scholar] [CrossRef]
- Garcia, M.B.; Ambat, S.; Adao, R.T. Tomayto, Tomahto: A Machine Learning Approach for Tomato Ripening Stage Identification Using Pixel-Based Color Image Classification. In Proceedings of the 2019 IEEE 11th International Conference on Humanoid, Nanotechnology, Information Technology, Communication and Control, Environment, and Management (HNICEM), Laoag, Philippines, 29 November–1 December 2019; IEEE: Piscataway, NJ, USA, 2019; pp. 1–6. [Google Scholar]
- Alsahaf, A.; Azzopardi, G.; Ducro, B.; Hanenberg, E.; Veerkamp, R.F.; Petkov, N. Estimation of Muscle Scores of Live Pigs Using a Kinect Camera. IEEE Access 2019, 7, 52238–52245. [Google Scholar] [CrossRef]
- Kumar, C.S.; Sharma, V.K.; Yadav, A.K.; Singh, A. Perception of Plant Diseases in Color Images Through Adaboost. In Advances in Intelligent Systems and Computing; Springer: Berlin, Germany, 2020; pp. 506–511. [Google Scholar]
- Amani, M.; Kakooei, M.; Moghimi, A.; Ghorbanian, A.; Ranjgar, B.; Mahdavi, S.; Davidson, A.; Fisette, T.; Rollin, P.; Brisco, B.; et al. Application of Google Earth Engine Cloud Computing Platform, Sentinel Imagery, and Neural Networks for Crop Mapping in Canada. Remote Sens. 2020, 12, 3561. [Google Scholar] [CrossRef]
- Rehman, A.; Liu, J.; Keqiu, L.; Mateen, A.; Yasin, M.Q. Machine learning prediction analysis using IoT for smart farming. Int. J. Emerg. Trends Eng. Res. 2020, 8, 6482–6487. [Google Scholar]
- Gumma, M.K.; Thenkabail, P.S.; Teluguntla, P.G.; Oliphant, A.; Xiong, J.; Giri, C.; Pyla, V.; Dixit, S.; Whitbread, A.M. Agricultural cropland extent and areas of South Asia derived using Landsat satellite 30-m time-series big-data using random forest machine learning algorithms on the Google Earth Engine cloud. GIScience Remote Sens. 2020, 57, 302–322. [Google Scholar] [CrossRef]
- Gnanasankaran, N.; Ramaraj, E. The effective yield of paddy crop in Sivaganga district—An initiative for smart farming. Int. J. Sci. Technol. Res. 2020, 9, 6452–6455. [Google Scholar]
- Tarik, H.; Mohammed, O.J. Big Data Analytics and Artificial Intelligence Serving Agriculture. In Advances in Intelligent Systems and Computing; Springer: Berlin, Germany, 2020; pp. 57–65. [Google Scholar]
- Swain, M.; Singh, R.; Thakur, A.K.; Gehlot, A. A machine learning approach of data mining in agriculture 4.0. Int. J. Emerg. Technol. 2020, 11, 257–262. [Google Scholar]
- Wang, X.; Yang, K.; Liu, T. The Implementation of a Practical Agricultural Big Data System. In Proceedings of the 2019 IEEE 5th International Conference on Computer and Communications (ICCC), Chengdu, China, 6–9 December 2019; IEEE: Piscataway, NJ, USA, 2019; pp. 1955–1959. [Google Scholar]
- Fenu, G.; Malloci, F.M. An Application of Machine Learning Technique in Forecasting Crop Disease. In Proceedings of the 2019 3rd International Conference on Big Data Research, Paris, France, 20–22 November 2019. [Google Scholar] [CrossRef]
- Moon, T.; Hong, S.; Choi, H.Y.; Jung, D.H.; Chang, S.H.; Son, J.E. Interpolation of greenhouse environment data using multilayer perceptron. Comput. Electron. Agric. 2019, 166, 105023. [Google Scholar] [CrossRef]
- Aiken, V.C.F.; Dórea, J.R.R.; Acedo, J.S.; De Sousa, F.G.; Dias, F.G.; Rosa, G.J.D.M. Record linkage for farm-level data analytics: Comparison of deterministic, stochastic and machine learning methods. Comput. Electron. Agric. 2019, 163, 104857. [Google Scholar] [CrossRef]
- Ochoa, K.S.; Guo, Z. A framework for the management of agricultural resources with automated aerial imagery detec-tion. Comput. Electron. Agric. 2019, 162, 53–69. [Google Scholar] [CrossRef]
- Sathiaraj, D.; Huang, X.; Chen, J. Predicting climate types for the Continental United States using unsupervised clustering techniques. Environmetrics 2019, 30, e2524. [Google Scholar] [CrossRef]
- Vasumathi, M.T.; Kamarasan, M. Fruit disease prediction using machine learning over big data. Int. J. Recent Technol. Eng. 2019, 7, 556–559. [Google Scholar]
- Saggi, M.K.; Jain, S. Reference evapotranspiration estimation and modeling of the Punjab Northern India using deep learning. Comput. Electron. Agric. 2019, 156, 387–398. [Google Scholar] [CrossRef]
- Yang, J.; Liu, M.; Lu, J.; Miao, Y.; Hossain, M.A.; Alhamid, M.F. Botanical Internet of Things: Toward Smart Indoor Farming by Connecting People, Plant, Data and Clouds. Mob. Netw. Appl. 2017, 23, 188–202. [Google Scholar] [CrossRef]
- Yahata, S.; Onishi, T.; Yamaguchi, K.; Ozawa, S.; Kitazono, J.; Ohkawa, T.; Yoshida, T.; Murakami, N.; Tsuji, H. A hybrid machine learning approach to automatic plant phenotyping for smart agriculture. In Proceedings of the 2017 International Joint Conference on Neural Networks (IJCNN), Anchorage, AK, USA, 14–19 May 2017; IEEE: Piscataway, NJ, USA, 2017; pp. 1787–1793. [Google Scholar]
- Khine, P.P.; Wang, Z.S. Data lake: A new ideology in big data era. ITM Web Conf. 2018, 17, 03025. [Google Scholar] [CrossRef]
- Hirve, S.; Reddy, C.H.P. A Survey on Visualization Techniques Used for Big Data Analytics. Adv. Intell. Syst. Comput. 2019, 447–459. [Google Scholar] [CrossRef]
- Jun, S. Business Intelligence Visualization Technology and Its Application in Enterprise Management. In Proceedings of the 2020 2nd International Conference on Big Data Engineering and Technology; Association for Computing Machinery (ACM), Singapore, 3–5 January 2020; pp. 45–48. [Google Scholar]
- Chen, Q.; Zobel, J.; Verspoor, K. Evaluation of a machine learning duplicate detection method for bioinformatics data-bases. In Proceedings of the ACM Ninth International Workshop on Data and Text. Mining in Biomedical Informatics, Melbourne, Australia, 23 October 2015; pp. 4–12. [Google Scholar]
- Barga, R.; Fontama, V.; Tok, W.H. Cortana Analytics. Predict. Anal. Microsoft Azure Mach. Learn. 2015, 279–283. [Google Scholar] [CrossRef]
- Google. Google Cloud Machine Learning. 2016. Available online: https://cloud.google.com/products/machine-learning/ (accessed on 15 November 2016).
- A.W.S. Amazon. Machine Learning. 2016. Available online: https://aws.amazon.com/machine-learning/ (accessed on 7 June 2016).
- IBM. IBM Watson Ecosystem Program. 2014. Available online: http://www-03.ibm.com/innovation/us/watson/ (accessed on 8 January 2014).
- Padhi, B.K.; Nayak, S.; Biswal, B. Machine Learning for Big Data Processing: A Literature Review. Int. J. Innov. Res. Technol. 2018, 5, 359–368. [Google Scholar]
- Al-Fuqaha, A.; Guizani, M.; Mohammadi, M.; Aledhari, M.; Ayyash, M. Internet of Things: A survey on enabling technologies, protocols and applications. IEEE Commun. Surv. Tutor. 2015, 17, 2347–2376. [Google Scholar] [CrossRef]
- Grolinger, K.; Hayes, M.; Higashino, W.A.; L’Heureux, A.; Allison, D.S.; Capretz, M.A. Challenges for MapReduce in Big Data. In Proceedings of the 2014 IEEE World Congress on Services, Anchorage, AK, USA, 27 June–2 July 2014; IEEE: Piscataway, NJ, USA, 2014; pp. 182–189. [Google Scholar]
Publisher’s Note: MDPI stays neutral with regard to jurisdictional claims in published maps and institutional affiliations. |
© 2021 by the authors. Licensee MDPI, Basel, Switzerland. This article is an open access article distributed under the terms and conditions of the Creative Commons Attribution (CC BY) license (http://creativecommons.org/licenses/by/4.0/).