Article

Ensemble-Based Out-of-Distribution Detection

1
Department of Data and HPC Science, University of Science and Technology, Daejeon 34113, Korea
2
Department of Intelligent Infrastructure Technology Research, Korea Institute of Science and Technology Information, Daejeon 34141, Korea
3
Research Data Sharing Center, Korea Institute of Science and Technology Information, Daejeon 34141, Korea
4
Department of ICT, University of Science and Technology, Daejeon 34113, Korea
5
High Performance Embedded SW Research Section, Electronics and Telecommunications Research Institute, Daejeon 34129, Korea
*
Author to whom correspondence should be addressed.
Electronics 2021, 10(5), 567; https://doi.org/10.3390/electronics10050567
Submission received: 4 February 2021 / Revised: 22 February 2021 / Accepted: 23 February 2021 / Published: 28 February 2021

Abstract

:
To design an efficient deep learning model that can be used in the real-world, it is important to detect out-of-distribution (OOD) data well. Various studies have been conducted to solve the OOD problem. The current state-of-the-art approach uses a confidence score based on the Mahalanobis distance in a feature space. Although it outperformed the previous approaches, the results were sensitive to the quality of the trained model and the dataset complexity. Herein, we propose a novel OOD detection method that can train more efficient feature space for OOD detection. The proposed method uses an ensemble of the features trained using the softmax-based classifier and the network based on distance metric learning (DML). Through the complementary interaction of these two networks, the trained feature space has a more clumped distribution and can fit well on the Gaussian distribution by class. Therefore, OOD data can be efficiently detected by setting a threshold in the trained feature space. To evaluate the proposed method, we applied our method to various combinations of image datasets. The results show that the overall performance of the proposed approach is superior to those of other methods, including the state-of-the-art approach, on any combination of datasets.

1. Introduction

Deep learning has achieved state-of-the-art performance in various tasks, such as speech recognition [1,2], image classification [3,4], video prediction [5,6] and medical diagnosis [7,8]. Nevertheless, several problems with deep learning remain. This study is focused on two of them. The first is the closed-world assumption. Contemporary deep learning models are designed under the static and closed-world assumption that training and testing datasets have the same distribution [9]. However, in the real-world, data distributions may undergo complex and dynamic shifts over time, and even a novel dataset with an unseen distribution might be presented to the model during the test. These shifted and unseen data distributions may cause critical failures because the model attempts to predict the results under the closed-world assumption [10]. The second is the high confidence problem. It is generally known that modern deep learning models may yield improper predictions with high confidence even for unseen data distributions [11]. These problems, which are called out-of-distribution (OOD) problems [12], cause overfitting and complicate the calibration of deep learning models [13,14]. Therefore, to design an efficient deep learning model that can be used in the real-world, it is important to detect the OOD data well.
Various studies have been conducted to solve the OOD problem. A baseline model has been proposed to detect OOD data using a neural network’s softmax value as a confidence score [12]. As an extension of the baseline method, the out-of-distribution detector for neural networks (ODIN) has been proposed to improve performance using temperature scaling and input preprocessing [15]. ODIN outperformed the baseline method; however, this method required hyperparameters to be tuned appropriately for each dataset. Additionally, approaches based on generative models and auxiliary datasets have been proposed [16,17,18]. The current state-of-the-art method uses confidence scores based on the Mahalanobis distance in a feature space [19]; however, its results are sensitive to the dataset complexity and the quality of the trained model. In that respect, we proposed the OOD detection method based on distance metric learning (DML) in our previous research [20]. This method can train a clumped feature space (in which data with the same label are located closely) by class using a DML-based network (instead of the softmax-based classifier) and can detect OOD samples efficiently in that feature space. Our previous method outperformed the state-of-the-art approach in 1-channel image datasets having relatively simple structures. However, it could not detect OOD well in the 3-channel image datasets having complex structures.
Herein, we propose a novel OOD detection method that uses not only DML-based networks but also softmax-based classifiers, as an extended version of our previous work. The proposed method can obtain more efficient feature space for OOD detection by an ensemble of the features trained using the softmax-based classifier and the DML-based networks, including Siamese and triplet networks [21,22]. The trained feature space has a more clumped distribution and can fit better on the Gaussian distribution by class, compared with using the state-of-the-art approach and our previous method. An example of the trained feature spaces is shown in Figure 1. Moreover, in the testing phase, the OOD data can be detected as follows: (1) measure the distance between the features of the input data and each class distribution as a confidence score and (2) set a threshold in that distance.
To evaluate the proposed OOD detection module, we applied our method to various combinations of 1-channel and 3-channel image datasets. Subsequently, we verified the performance of the OOD detection by comparing it with the previous approaches.
The remainder of this paper is organized as follows. Section 2 presents the related studies, Section 3 describes the proposed OOD detection method and Section 4 details our experiment. The paper is concluded in Section 5.

2. Related Work

In this section, we introduce several OOD detection methods and DML-based networks used in the proposed method and our previous approach.

2.1. OOD Detection Methods

This study mainly focuses on the OOD detection method based on the confidence score and threshold (among various OOD-related studies). Therefore, this section reviews some threshold-based OOD detection methods relevant for this study. The baseline method of OOD detection [12] was proposed based on the tendency of a well-trained neural network to assign a higher softmax score to in-distribution examples rather than OOD examples. In this approach, the OOD data can be detected using softmax as a confidence score and applying a threshold to it. The softmax function is shown in Equation (1); it comprises f i ( x ) for the logit of class i.
S b a s e l i n e ( x ) = max i exp ( f i ( x ) ) j = 1 C exp ( f j ( x ) )
The ODIN method [15] was proposed to improve the performance of the baseline by using temperature scaling and adding small controlled perturbations to the input data. The temperature scaling T was applied to the baseline confidence scoring function, as shown in Equation (2). The ODIN method outperformed the baseline method; however, it required hyperparameters to be tuned appropriately for each dataset.
S O D I N ( x ) = max i exp ( f i ( x ) / T ) j = 1 C exp ( f j ( x ) / T )
Mahalanobis-based Approach [19], which demonstrates the state-of-the-art performance, uses the confidence score based on the Mahalanobis distance in a feature space. This approach was designed under the assumption that the well-trained output features of the softmax-based neural classifier can be fitted well to the class-conditional Gaussian distribution. The confidence score can be defined by calculating the Mahalanobis distance using the class mean and covariance of the feature map, thereby enabling the effective detection of OOD samples. Although this method outperformed the previous approaches, the results were sensitive to the dataset complexity and the quality of the trained model.
The DML-based approach [20] was proposed in our previous research. To train a more efficient feature space than the state-of-the-art approach, this method uses DML-based networks (as described in the next section) instead of the softmax-based classifier. The trained feature space has a more clumped distribution by class, and OOD samples can be detected by applying a threshold to this feature space. This method performed well in 1-channel image datasets with relatively simple structures. However, it could not detect OOD well in 3-channel image datasets with complex structures.

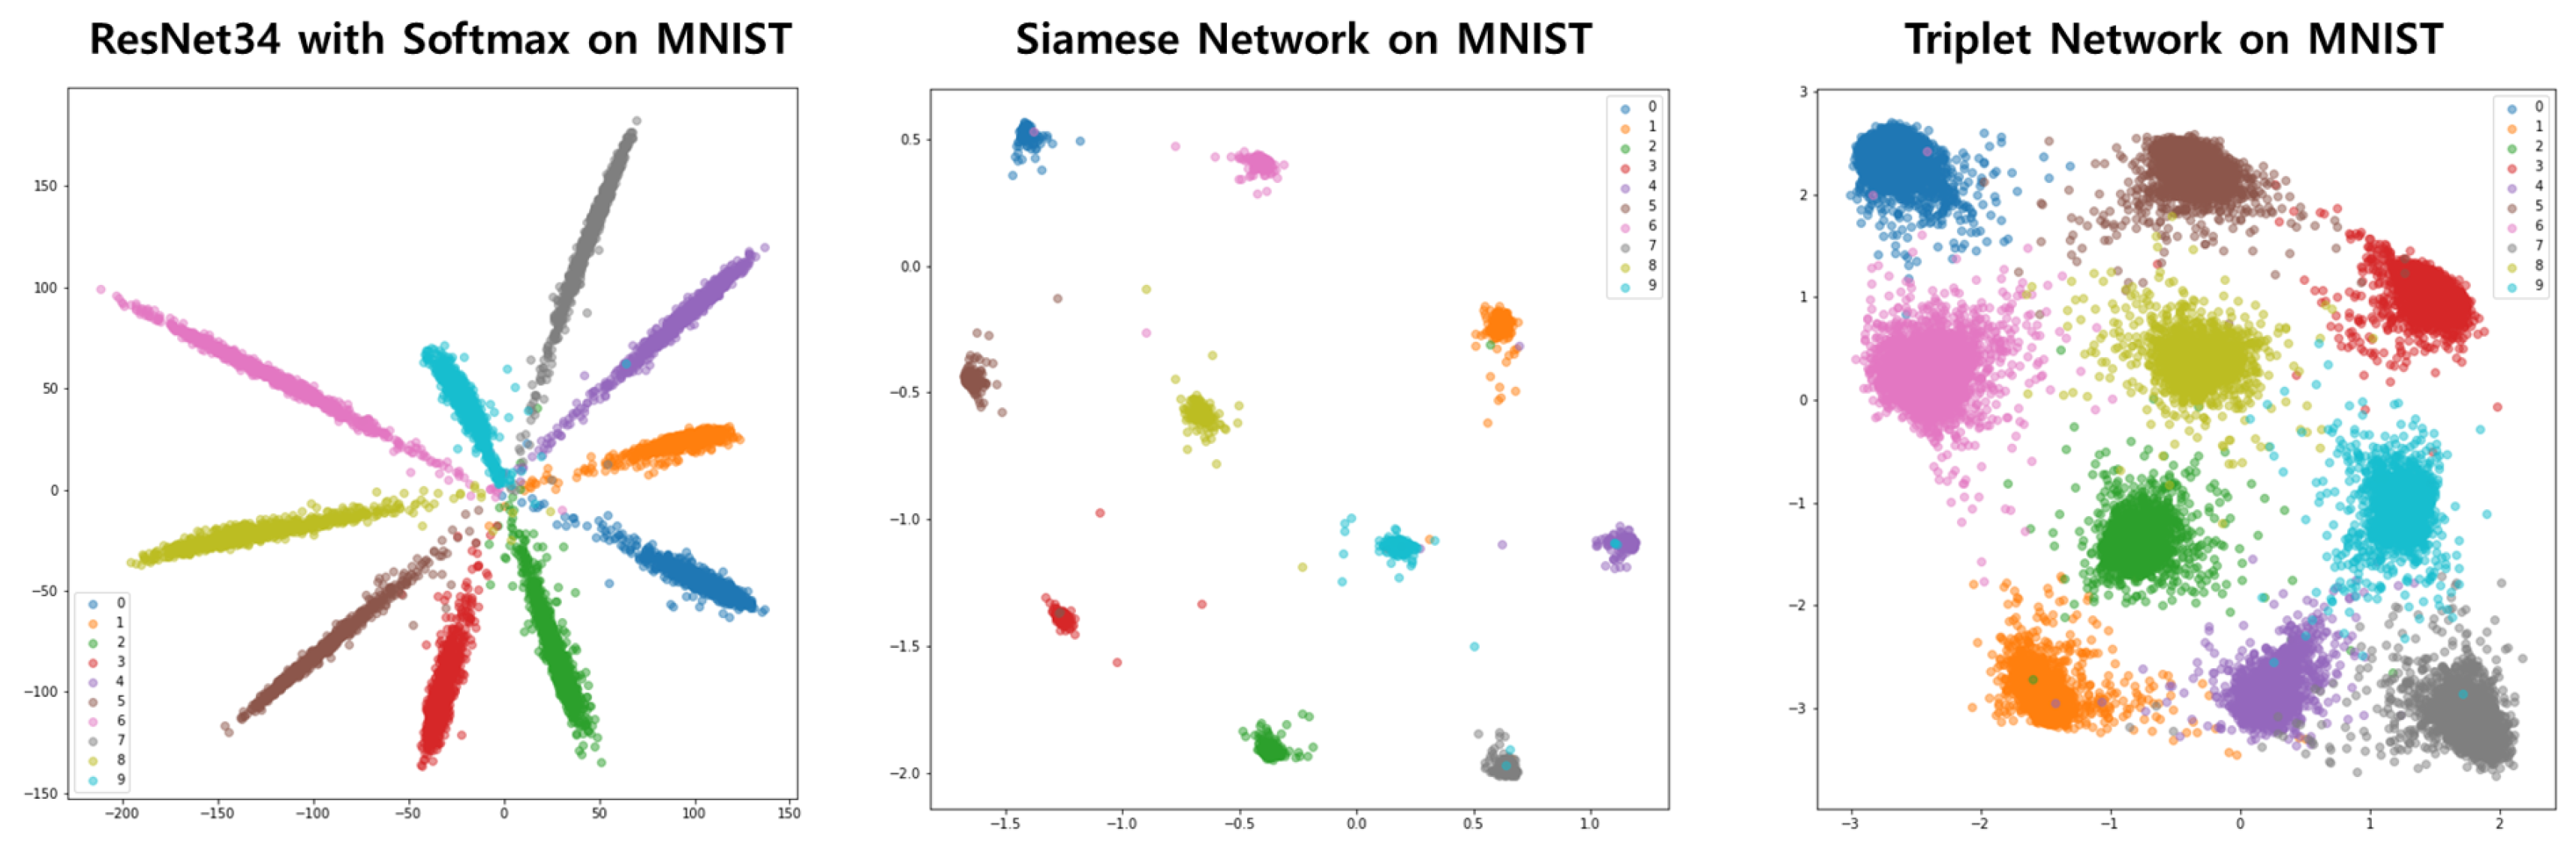
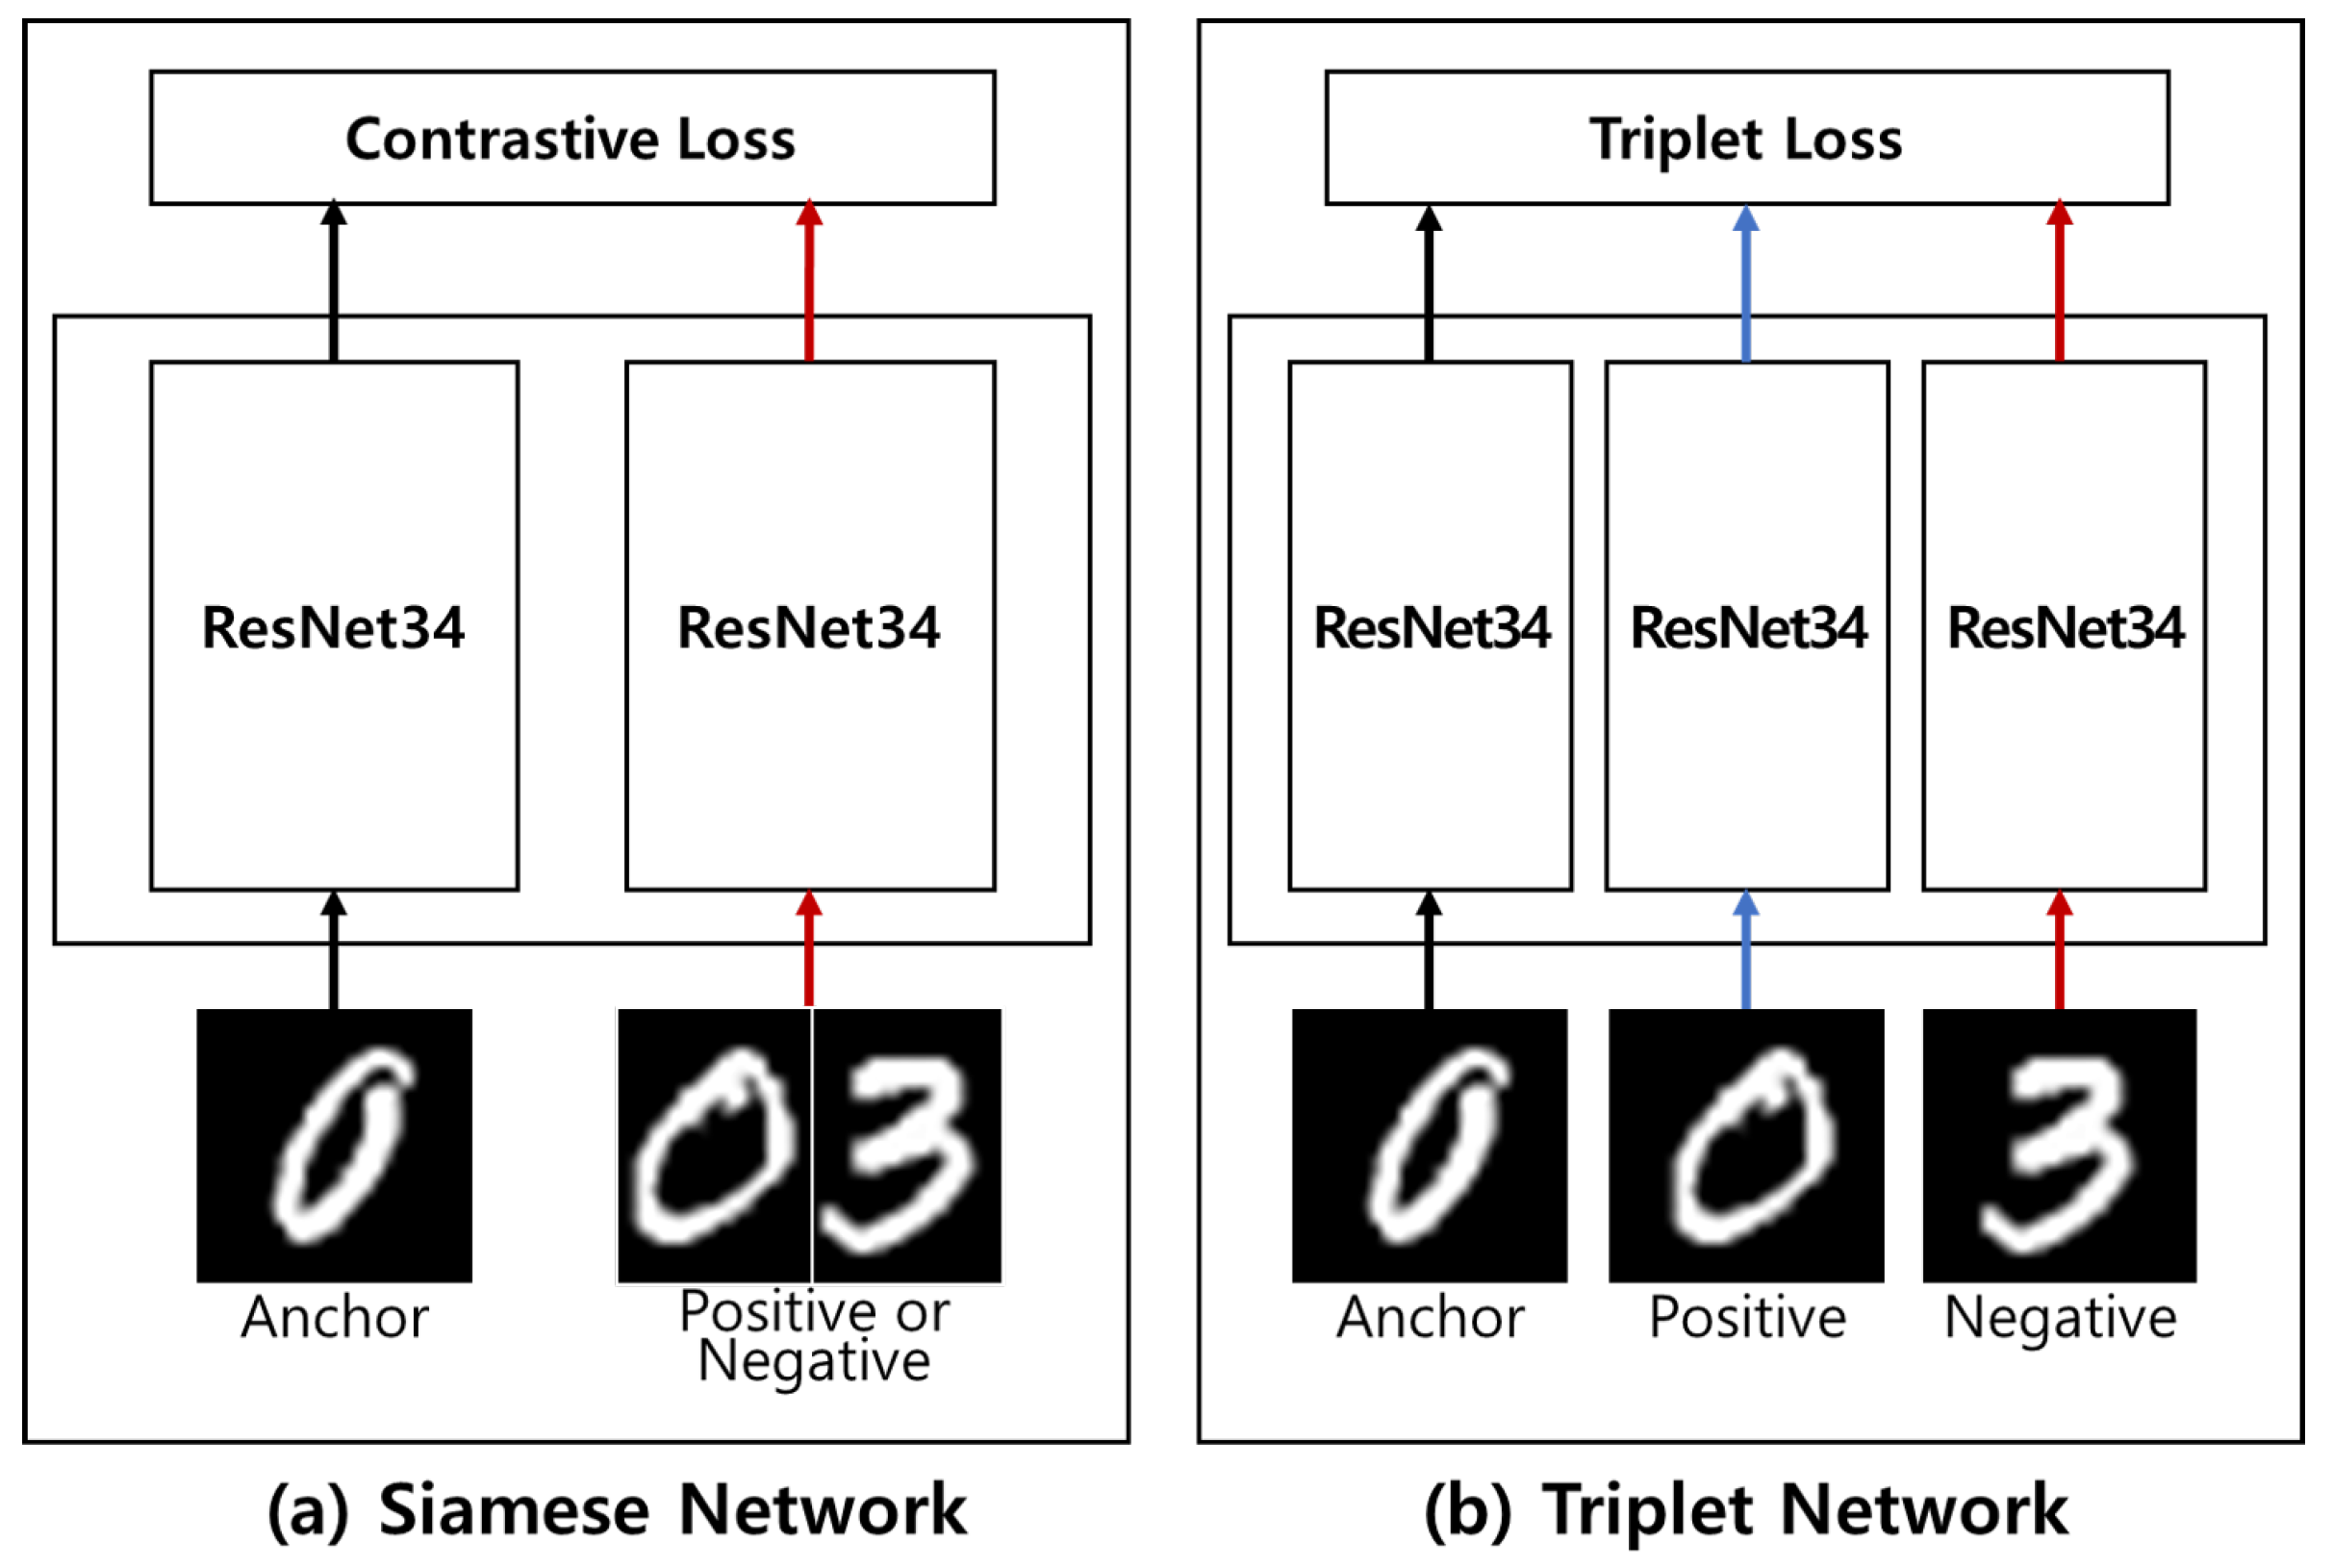
2.2. Networks Based on Distance Metric Learning (DML)
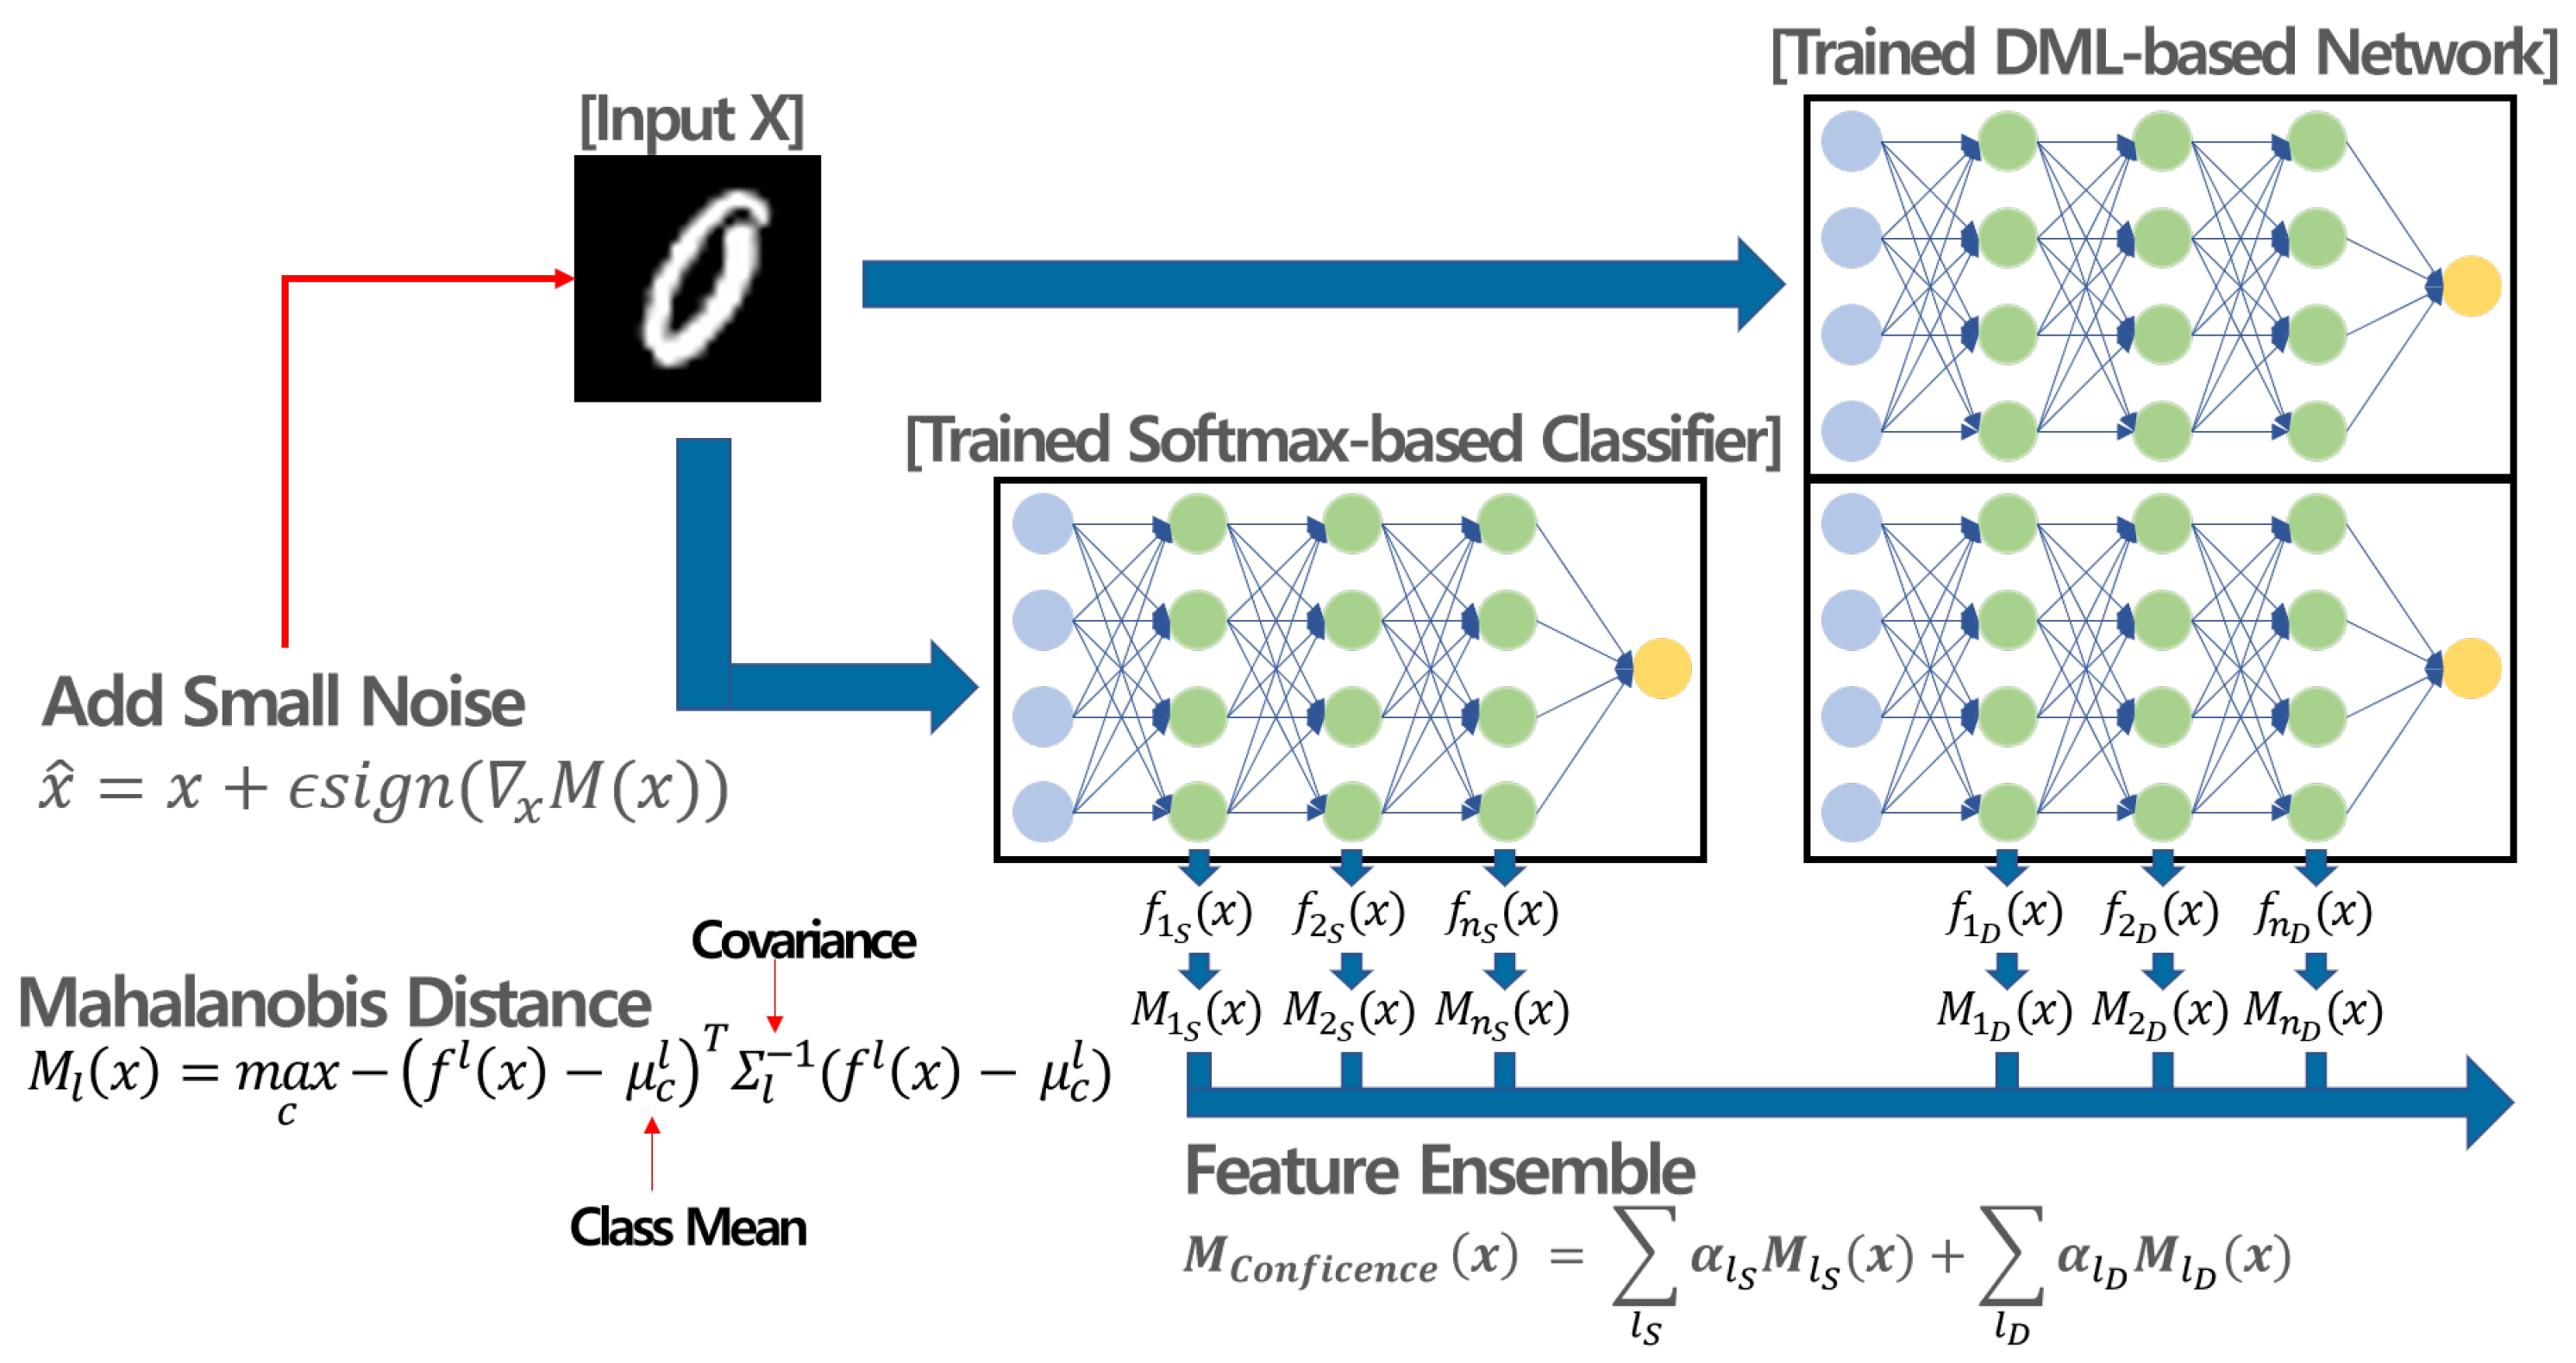
DML is a branch of machine learning algorithms that aims to learn similarities between data samples using a distance-based loss function [23]. As this method embeds similar data samples closer, DML-based networks can train more clumped feature spaces by class. In this section, we introduce two DML-based networks used in the proposed method and our previous research.
The Siamese network [21] comprises one cost function and two sub-networks that share parameters and have the same structure. When training the Siamese network, two inputs are passed through the sub-networks. One is an anchor input x a , and the other can be a positive input x p with the same label as the anchor or a negative input x n with a different label. After the sub-networks, the distance between two output features is calculated using the cost function. The Siamese network uses contrastive loss as a cost function; hence, inputs with the same label are embedded closely in the feature space. In the opposite case, they can be distant from one another when training the network. The contrastive loss function is shown in Equation (3), where M is a constant value
L c o n t r a s t i v e = | | x a x p | | 2 2 if P o s i t i v e P a i r m a x ( 0 , M | | x a x n | | 2 2 ) if N e g a t i v e P a i r
In the testing phase, the test dataset is entered into one of the trained sub-networks; subsequently, the clumped vectors can be obtained by class. The Siamese network structure is shown in Figure 2a.
The triplet Network [22] is a network based on the Siamese network. It comprises a triplet loss function and three sub-networks. The triplet loss function is shown in Equation (4).
L t r i p l e t = m a x ( 0 , | | x a x p | | 2 2 | | x a x n | | 2 2 + M )
When training the triplet network, three inputs are provided: the anchor input x a , positive input x p and negative input x n . Using these three inputs and the triplet loss function, the anchor input can be embedded farther from the negative input than the positive input. After training, the test can be performed as in the Siamese network. The structure of the triplet network is shown in Figure 2b.

3. Methodology

In this section, we present our proposed method for detecting OOD samples. Our method is proposed to improve the Mahalanobis-based approach [19], which is the current state-of-the-art method, and the DML-based approach [20], which is our previous work. The state-of-the-art approach uses only a softmax-based classifier, and our previous approach uses only a DML-based network to train the feature space. Figure 1 shows well-trained feature spaces with a softmax-based classifier and DML-based networks. In these feature spaces, we may detect OOD well using these approaches. However, there is no guarantee that the networks are always trained well. If the networks are not trained well, we cannot detect the OOD well in that feature space. Therefore, in this study, we used both networks together—not only softmax-based classifier but also DML-based network—to train more efficient feature space for OOD detection. In the proposed method, the feature space is trained by an ensemble of the features trained using the softmax-based classifier and the DML-based network. With complementary interaction between the two networks by the ensemble, the trained feature space has a more clumped distribution, and it can better fit on the Gaussian distribution by class. Thus, OOD samples can be efficiently detected in that feature space. Figure 3 shows the overall structure of our proposed method.
Except for the networks that train feature spaces, the state-of-the-art protocols (such as input preprocessing, Mahalanobis-based confidence score and feature ensemble) were also used to efficiently detect OOD samples in this study.
Input Preprocessing [15]. In the testing phase, to increase the confidence score based on the Mahalanobis distance, the input preprocessing technique is applied, in which a small controlled noise is added to the test samples. This technique results in a more separable in-distribution and OOD samples. The preprocessed test samples are obtained by Equation (5), where x represents the test sample, ϵ is the magnitude of noise and M ( x ) is the confidence score based on the Mahalanobis distance
x ^ = x + ϵ s i g n ( x M ( x ) )
Confidence Score based on Mahalanobis Distance [19]. The Mahalanobis distance between the test sample and the closest class distribution is used as a confidence score. The Mahalanobis distance of the l-th layer, M l ( x ) , is calculated using Equation (6), where c is the class index and f l ( x ) is the feature of the test sample at the l-th layer; μ and Σ are the class mean and covariance matrix, respectively
M l ( x ) = max c ( f l ( x ) μ c l ) T Σ l 1 ( f l ( x ) μ c l )
Feature Ensemble [19]. In the state-of-the-art approach, the feature ensemble technique was used to calculate the weighted sum of confidence scores from the feature set in some layers. Using this technique, we can ensemble the features trained using the softmax-based classifier and the DML-based network. Moreover, we can also measure and combine the confidence scores of the final feature and the other low-level features in the two networks. This means that effective layers can be assigned a higher weight, and ineffective layers can be assigned a lower weight. This is expressed as Equation (7), where M l S and α l S are the confidence score and its weight obtained from the feature set of the l-th layer in the softmax-based classifier, and M l D and α l D are the confidence score and its weight obtained from the feature set of the l-th layer in the DML-based network. In the experiments of this study, both weights were trained by logistic regression using a small validation dataset that consisted of 1000 images from each in- and out-of-distribution pair, similar to [19]. Here, M ( x ) is the total confidence score based on the Mahalanobis distance.
M ( x ) = l S α l S M l S ( x ) + l D α l D M l D ( x )
Figure 4 shows the overall process of the proposed method. In the training phase, features are extracted from the training samples using both the softmax-based classifier and DML-based network trained on in-distribution dataset. Subsequently, the mean and covariance are calculated for each class from the extracted features.
In the testing phase, features are extracted from the test samples consisting of the same ratio of in- and out-of-distribution datasets, with a small amount of controlled noise added. Thereafter, the Mahalanobis distance between the test samples and the closest class distribution is calculated using the class mean and covariance. The calculated Mahalanobis distances from the output features of several layers in the two networks are ensembled. Finally, OOD samples can be detected by applying a threshold to the ensembled Mahalanobis distance.

4. Experiments

In this section, the performance of the proposed OOD detection method is evaluated, analyzed and compared with the previous approaches on various combinations of datasets.

4.1. Experimental Setup

First of all, in order to fairly benchmark our method, we selected various standard datasets which have been most actively used for evaluating and comparing OOD detection methods until now [15,16,17,18,19,20]. For 1-channel image datasets, we chose Fashion-MNIST [24] and MNIST [25]. For 3-channel image datasets, we chose CIFAR-10 [4], CIFAR-100 [4], SVHN [26], Tiny ImageNet [27] and LSUN [28]. These datasets reflect real-world scenarios, such as handwriting, fashion, street signs and so on. Especially, the CIFAR and ImageNet datasets can be thought as collections containing most of the real-life images.
All proposed methods were implemented using Python 3.7 and PyTorch 1.5 on NVIDIA TITAN RTX 24 GB × 2. In the case of experiments for 1-channel image datasets, we used ResNet34 [3] for the softmax-based classifier and the ResNet34-based Siamese or triplet network (described in Section 2) for the DML-based network. These networks were trained with a learning rate of 0.001, a batch size of 32 and an Adam optimizer. For the experiments on 3-channel image datasets, we used the trained ResNet34 on each dataset, provided in the state-of-the-art approach (https://github.com/pokaxpoka/deep_Mahalanobis_detector (accessed on 27 February 2021)), as a softmax-based classifier. ResNet34-based Siamese or triplet network was also used for DML-based network. We trained these DML-based networks with a batch size of 256 and an Adam optimizer. The learning rate was initialized at 0.001 and decreased to 0 by a cosine scheduler [29]. In addition, we used an early stopping method to prevent overfitting [30]. Subsequently, we applied our method to various combinations of standard datasets mentioned above.
For performance comparison, we considered the baseline model, ODIN, the Mahalanobis-based approach, and our previous method (as described in Section 2). Our previous method was trained using DML-based networks, and the other models were trained using ResNet34 in the same way as the proposed method. In the case of experiments for 3-channel image datasets, the trained ResNet34 (provided in the state-of-the-art approach (https://github.com/pokaxpoka/deep_Mahalanobis_detector (accessed on 27 February 2021)) for each dataset was used for those models, excluding our previous approach.
To evaluate the performance, the following metrics were used: the true negative rate (TNR) at a 95% true positive rate (TPR), the area under the receiver operating characteristic curve (AUROC), the detection accuracy (DTACC) and the area under the precision–recall curve (AUPR). Using these metrics, the performance of OOD detection methods can be evaluated without selecting a specific threshold [15]. Our source code is available on GitHub (https://github.com/yangdonghun3/Ensemble_based_OOD_Detection (accessed on 27 February 2021)).
We detail our experimental results on 1-channel and 3-channel image datasets in the next subsections.

4.2. Experimental Results on 1-Channel Image Datasets

Figure 5 presents the average performances of the proposed method and the other methods, in 10 experiments, from the 10th to the 50th epoch on 1-channel image datasets. In the case of (In) Fashion-MNIST/(Out) MNIST, our proposed method (ensemble-based) and previous method (DML-based) were superior to the others at all epoch points and metrics, as shown in Figure 5a. Furthermore, the ensemble-triplet (navy line) version of the proposed method showed the best performance among all methods. In addition to their better performance, the triplet-based approaches (purple and navy lines) consistently demonstrated robust states during the entire training phase. Meanwhile, the other models demonstrated unstable performances depending on the epoch. Consequently, the proposed method and our previous method can be considered as less sensitive when selecting hyperparameters for OOD detection in this experiment. Comparing ours, triplet-based approaches (purple and navy lines) performed better than the Siamese-based approaches (yellow and green lines). Table 1 presents the average performance at the epoch point, showing the best TNR in several experiments on 1-channel image datasets. Table 1a also shows that the proposed method and our previous method outperformed the other methods, including the state-of-the-art approach.
Turning to the experiment of (In) MNIST/(Out) Fashion-MNIST, except for the baseline method and ODIN, all other models showed nearly 100% OOD detection performance and stable states at all epoch points and all metrics, as shown in Figure 5b. This means that the three methods detected OOD samples perfectly during the entire training phase. Consequently, we considered that the proposed method, the previous method and the Mahalanobis-based approach could completely separate in-distribution samples and OOD samples because the structure of the MNIST dataset is simple. Table 1b also shows that the three methods detected the OOD samples perfectly.

4.3. Experimental Results on 3-Channel Image Datasets

To further verify the performance of the proposed method, additional experiments were performed on various combinations of 3-channel image datasets having more complex structures than 1-channel image datasets, and the results are reported in Table 2, Table 3 and Table 4. The tables show the average performance at the epoch point, showing the best TNR in 10 experiments on 3-channel image datasets. In the case of (In) SVHN, the proposed method, our previous approach and the Mahalanobis-based approach performed well on all combinations of datasets. In contrast, other models could not detect OOD well, as shown in Table 2. This table also shows that the overall performance of the proposed approaches (ensemble-Siamese, ensemble-triplet) was superior to the others, and the ensemble-triplet method achieved the best TNR, approximately 0.16–1.40% higher than the state-of-the-art approach, among all methods. Moreover, except for OnlySiamese on (Out) CIFAR-10, our previous methods (OnlySiamese, OnlyTriplet) detected OOD well in most cases, compared with other combinations of 3-channel image datasets that have more complex structures.
In the case of (In) CIFAR-10, the proposed method and the Mahalanobis-based approach detected OOD samples well. Meanwhile, the other models did not perform well, as shown in Table 3. Furthermore, our proposed methods (ensemble-Siamese, ensemble-triplet) showed the best performances for all combinations of datasets. Specifically, their TNR values were approximately 0.01–0.61% higher than the state-of-the-art approach’s. In the case of experiments on (In) CIFAR-100, similarly, the proposed method and the Mahalanobis-based approach outperformed other methods, as shown in Table 4. This table also presents that the proposed methods (ensemble-Siamese, ensemble-triplet) were superior to the others, and showed the best TNR, approximately 1.80–7.17% higher than the state-of-the-art approach. However, our previous methods (OnlySiamese, OnlyTriplet) showed similar or worse performance to the ODIN method in both cases of (In) CIFAR-10 and (In) CIFAR-100. It was considered that these poor results came about because CIFAR-10 and CIFAR-100 have more complex structures than SVHN.
In summary, our previous method trained using only a DML-based network outperformed other models, including the state-of-the-art approaches trained using only a softmax-based classifier, on simple datasets (such as 1-channel image datasets). However, OOD could not be detected well in complex image datasets (such as 3-channel datasets). In contrast, the proposed method trained by the ensemble of the two networks outperformed all other methods for the combinations of simple image datasets and combinations of complex datasets, showing up to 7% higher TNR than the state-of-the-art approach.

5. Conclusions

This study proposed a novel OOD detection method that can train more efficient feature space. The proposed method uses an ensemble of the features trained using the softmax-based classifier and the DML-based network. With a complementary interaction between these two networks, the trained feature space has a more clumped distribution, and it can be better fitted to the Gaussian distribution by class. Thus, OOD samples can be efficiently detected by setting a threshold in this feature space. To verify the proposed method, we applied our OOD detection approach to various combinations of standard datasets which have been most actively used for evaluating and comparing OOD detection methods. After that, we compared its performance with previous approaches. The results showed that the overall performance of the proposed approach made it superior to other methods, including the state-of-the-art approach trained using only a softmax-based classifier and our previous method trained using only a DML-based network. We believe that the proposed approach has the potential to be applied to designing various machine learning models that can be efficiently used in the real-world, where data distributions undergo complex changes.

Author Contributions

Conceptualization, D.Y.; methodology, D.Y., I.S. and K.-H.L.; software, D.Y., K.M.N. and I.S.; validation, D.Y., K.M.N., K.-H.L. and M.H.; investigation, D.Y.; resources, M.H.; data curation, D.Y.; writing—original draft preparation, D.Y.; writing—review and editing, D.Y., I.S., K.M.N., K.-H.L. and M.H.; visualization, D.Y. and I.S.; supervision, M.H.; project administration, M.H.; funding acquisition, M.H. All authors have read and agreed to the published version of the manuscript.

Funding

This research was funded by Korea Institute of Science and Technology Information (KISTI).

Acknowledgments

This research was supported by Korea Institute of Science and Technology Information (KISTI).

Conflicts of Interest

The authors declare no conflict of interest.

References

  1. Hannun, A.; Case, C.; Casper, J.; Catanzaro, B.; Diamos, G.; Elsen, E.; Prenger, R.; Satheesh, S.; Sengupta, S.; Coates, A.; et al. Deep speech: Scaling up end-to-end speech recognition. arXiv 2014, arXiv:1412.5567. [Google Scholar]
  2. Bahdanau, D.; Cho, K.; Bengio, Y. Neural machine translation by jointly learning to align and translate. arXiv 2014, arXiv:1409.0473. [Google Scholar]
  3. He, K.; Zhang, X.; Ren, S.; Sun, J. Deep residual learning for image recognition. In Proceedings of the IEEE Conference on Computer Vision and Pattern Recognition, Las Vegas, NV, USA, 27–30 June 2016; pp. 770–778. [Google Scholar]
  4. Krizhevsky, A.; Hinton, G. Learning Multiple Layers of Features from Tiny Images. Master’s Thesis, University of Toronto, Toronto, ON, Canada, 2009. [Google Scholar]
  5. Villegas, R.; Yang, J.; Zou, Y.; Sohn, S.; Lin, X.; Lee, H. Learning to generate long-term future via hierarchical prediction. In Proceedings of the International Conference on Machine Learning, Sydney, Australia, 6–11 August 2017; pp. 3560–3569. [Google Scholar]
  6. Tulyakov, S.; Liu, M.Y.; Yang, X.; Kautz, J. Mocogan: Decomposing motion and content for video generation. In Proceedings of the IEEE Conference on Computer Vision and Pattern Recognition, Salt Lake City, UT, USA, 18–23 June 2018; pp. 1526–1535. [Google Scholar]
  7. Caruana, R.; Lou, Y.; Gehrke, J.; Koch, P.; Sturm, M.; Elhadad, N. Intelligible models for healthcare: Predicting pneumonia risk and hospital 30-day readmission. In Proceedings of the 21th ACM SIGKDD International Conference on Knowledge Discovery and Data Mining, Sydney, Australia, 10–13 August 2015; pp. 1721–1730. [Google Scholar]
  8. Wu, N.; Phang, J.; Park, J.; Shen, Y.; Huang, Z.; Zorin, M.; Jastrzębski, S.; Févry, T.; Katsnelson, J.; Kim, E.; et al. Deep neural networks improve radiologists’ performance in breast cancer screening. IEEE Trans. Med. Imaging 2019, 39, 1184–1194. [Google Scholar] [CrossRef] [PubMed] [Green Version]
  9. Hsu, Y.C.; Shen, Y.; Jin, H.; Kira, Z. Generalized ODIN: Detecting out-of-distribution image without learning from out-of-distribution data. In Proceedings of the IEEE/CVF Conference on Computer Vision and Pattern Recognition, Seattle, WA, USA, 13–19 June 2020; pp. 10951–10960. [Google Scholar]
  10. Amodei, D.; Olah, C.; Steinhardt, J.; Christiano, P.; Schulman, J.; Mané, D. Concrete problems in AI safety. arXiv 2016, arXiv:1606.06565. [Google Scholar]
  11. Nguyen, A.; Yosinski, J.; Clune, J. Deep neural networks are easily fooled: High confidence predictions for unrecognizable images. In Proceedings of the IEEE Conference on Computer Vision and Pattern Recognition, Boston, MA, USA, 7–12 June 2015; pp. 427–436. [Google Scholar]
  12. Hendrycks, D.; Gimpel, K. A baseline for detecting misclassified and out-of-distribution examples in neural networks. arXiv 2016, arXiv:1610.02136. [Google Scholar]
  13. Davis, J.; Goadrich, M. The relationship between Precision-Recall and ROC curves. In Proceedings of the 23rd International Conference on Machine Learning, Pittsburgh, PA, USA, 25–29 June 2006; pp. 233–240. [Google Scholar]
  14. Szegedy, C.; Vanhoucke, V.; Ioffe, S.; Shlens, J.; Wojna, Z. Rethinking the inception architecture for computer vision. In Proceedings of the IEEE Conference on Computer Vision and Pattern Recognition, Las Vegas, NV, USA, 27–30 June 2016; pp. 2818–2826. [Google Scholar]
  15. Liang, S.; Li, Y.; Srikant, R. Enhancing the reliability of out-of-distribution image detection in neural networks. arXiv 2017, arXiv:1706.02690. [Google Scholar]
  16. Lee, K.; Lee, H.; Lee, K.; Shin, J. Training confidence-calibrated classifiers for detecting out-of-distribution samples. arXiv 2017, arXiv:1711.09325. [Google Scholar]
  17. Papadopoulos, A.A.; Rajati, M.R.; Shaikh, N.; Wang, J. Outlier exposure with confidence control for out-of-distribution detection. arXiv 2019, arXiv:1906.03509. [Google Scholar]
  18. Hendrycks, D.; Mazeika, M.; Dietterich, T. Deep anomaly detection with outlier exposure. arXiv 2018, arXiv:1812.04606. [Google Scholar]
  19. Lee, K.; Lee, K.; Lee, H.; Shin, J. A simple unified framework for detecting out-of-distribution samples and adversarial attacks. In Proceedings of the 32nd International Conference on Neural Information Processing Systems, Montreal, QC, Canada, 3–8 December 2018; pp. 7167–7177. [Google Scholar]
  20. Yang, D.; Shin, I.; Ngoc, K.M.; Kim, H.; Yu, C.; Hwang, M. Out-of-Distribution Detection Based on Distance Metric Learning. In Proceedings of the 9th International Conference on Smart Media and Applications (SMA 2020), Jeju Island, Korea, 17–19 September 2020. [Google Scholar]
  21. Koch, G.; Zemel, R.; Salakhutdinov, R. Siamese Neural Networks for One-Shot Image Recognition. Master’s Thesis, University of Toronto, Toronto, ON, Canada, 2015. Available online: http://www.cs.toronto.edu/~gkoch/files/msc-thesis.pdf (accessed on 27 February 2021).
  22. Hoffer, E.; Ailon, N. Deep metric learning using triplet network. In International Workshop on Similarity-Based Pattern Recognition; Springer: Berlin/Heidelberg, Germany, 2015; pp. 84–92. [Google Scholar]
  23. Suárez, J.L.; García, S.; Herrera, F. A Tutorial on Distance Metric Learning: Mathematical Foundations, Algorithms, Experimental Analysis, Prospects and Challenges. Neurocomputing 2021, 425, 300–322. [Google Scholar] [CrossRef]
  24. Xiao, H.; Rasul, K.; Vollgraf, R. Fashion-mnist: A novel image dataset for benchmarking machine learning algorithms. arXiv 2017, arXiv:1708.07747. [Google Scholar]
  25. LeCun, Y. The MNIST Database of Handwritten Digits. 1998. Available online: http://yann.lecun.com/exdb/mnist/ (accessed on 27 February 2021).
  26. Netzer, Y.; Wang, T.; Coates, A.; Bissacco, A.; Wu, B.; Ng, A. Reading Digits in Natural Images with Unsupervised Feature Learning. NIPS 2011. Available online: http://ufldl.stanford.edu/housenumbers/ (accessed on 27 February 2021).
  27. Deng, J.; Dong, W.; Socher, R.; Li, L.J.; Li, K.; Li, F.-F. Imagenet: A large-scale hierarchical image database. In Proceedings of the 2009 IEEE Conference on Computer Vision and Pattern Recognition, Miami, FL, USA, 20–25 June 2009; pp. 248–255. [Google Scholar]
  28. Yu, F.; Seff, A.; Zhang, Y.; Song, S.; Funkhouser, T.; Xiao, J. Lsun: Construction of a large-scale image dataset using deep learning with humans in the loop. arXiv 2015, arXiv:1506.03365. [Google Scholar]
  29. Loshchilov, I.; Hutter, F. Sgdr: Stochastic gradient descent with warm restarts. arXiv 2016, arXiv:1608.03983. [Google Scholar]
  30. Prechelt, L. Early stopping-but when. In Neural Networks: Tricks of the Trade; Springer: Berlin/Heidelberg, Germany, 1998; pp. 55–69. [Google Scholar]
Figure 1. Examples of feature spaces trained using the softmax-based classifier and distance metric learning (DML)-based networks.
Electronics 10 00567 g001
Figure 2. Structures of DML-based networks.
Electronics 10 00567 g002
Figure 3. Overall structure of the proposed out-of-distribution (OOD) detection method.
Electronics 10 00567 g003
Figure 4. Overall process of the proposed OOD detection method.
Electronics 10 00567 g004
Figure 5. Average performances in 10 experiments from 10 to 50 epochs on 1-channel image datasets.
Electronics 10 00567 g005
Table 1. Average performances at the epoch point, showing the best true negative rates (TNR) in 10 experiments on 1-channel image datasets (mean ± standard deviation).
(a) In: Fashion-MNIST/Out: MNIST
MetricBaselineODINMahal.OnlySiamese
(Our Previous)
OnlyTriplet
(Our Previous)
Ensemble-Siamese
(Ours)
Ensemble-Triplet
(Ours)
TNR at TPR 95%.43.08 ± 8.4576.84 ± 7.1694.53 ± 2.8497.22 ± 3.6199.90 ± 0.1099.37 ± 0.5099.96 ± 0.04
AUROC.86.75 ± 5.3293.87 ± 1.8598.18 ± 0.5398.97 ± 0.6399.76 ± 0.0999.48 ± 0.2199.82 ± 0.11
DTACC.83.23 ± 3.4587.71 ± 3.0195.23 ± 1.0096.57 ± 1.2798.63 ± 0.2897.85 ± 0.6999.03 ± 0.34
AUPRin.79.74 ± 9.2392.12 ± 4.5998.57 ± 0.4799.22 ± 0.4699.80 ± 0.0899.58 ± 0.1999.87 ± 0.08
AUPRout.86.18 ± 4.0394.64 ± 1.4898.74 ± 1.0198.04 ± 1.1599.62 ± 0.1398.92 ± 0.3499.61 ± 0.35
(b) In: MNIST/Out: Fashion-MNIST
MetricBaselineODINMahal.OnlySiamese
(Our Previous)
OnlyTriplet
(Our Previous)
Ensemble-Siamese
(Ours)
Ensemble-Triplet
(Ours)
TNR at TPR 95%.98.42 ± 1.0799.51 ± 0.25100.0 ± 0.00100.0 ± 0.00100.0 ± 0.0099.99 ± 0.03100.0 ± 0.00
AUROC.99.04 ± 0.1899.55 ± 0.14100.0 ± 0.00100.0 ± 0.01100.0 ± 0.0099.99 ± 0.0399.99 ± 0.00
DTACC.96.92 ± 0.6497.86 ± 0.4099.98 ± 0.0199.94 ± 0.0399.94 ± 0.0399.95 ± 0.0399.94 ± 0.02
AUPRin.98.71 ± 0.4599.64 ± 0.1099.99 ± 0.0099.99 ± 0.0099.99 ± 0.0099.91 ± 0.2499.99 ± 0.00
AUPRout.98.74 ± 0.2699.42 ± 0.2099.99 ± 0.0499.95 ± 0.0599.99 ± 0.0099.96 ± 0.0499.98 ± 0.03
Table 2. Average performances at the epoch point, showing the best TNR in 10 experiments on (In) SVHN/(Out) CIFAR-10, Tiny ImageNet and LSUN (mean ± standard deviation).
In-Dist.Out-Dist.MetricBaselineODINMahal.OnlySiamese
(Our Previous)
OnlyTriplet
(Our Previous)
Ensemble-Siamese
(Ours)
Ensemble-Triplet
(Ours)
SVHNCIFAR-10TNR at TPR 95%.78.2679.8397.6382.46 ± 6.1791.12 ± 3.7298.45 ± 0.2899.00 ± 0.45
AUROC.92.9292.0999.0496.34 ± 1.3198.08 ± 0.5999.20 ± 0.0899.46 ± 0.19
DTACC.90.0389.4496.3791.10 ± 1.8793.80 ± 1.2096.85 ± 0.1797.42 ± 0.66
AUPRin.95.0693.9699.5898.38 ± 0.9199.26 ± 0.2499.65 ± 0.1199.79 ± 0.10
AUPRout.85.6686.8396.1589.04 ± 3.1093.85 ± 1.7596.55 ± 0.1397.59 ± 0.78
SVHNTiny ImageNetTNR at TPR 95%.79.0282.1099.7899.34 ± 0.3499.76 ± 0.1199.90 ± 0.0499.94 ± 0.02
AUROC.93.5191.9999.8299.73 ± 0.1299.89 ± 0.0499.87 ± 0.0499.94 ± 0.03
DTACC90.4489.3598.7098.18 ± 0.4299.00 ± 0.2698.98 ± 0.1399.21 ± 0.14
AUPRin.95.6893.8899.8799.88 ± 0.0799.95 ± 0.0399.92 ± 0.0399.97 ± 0.03
AUPRout.86.1888.1299.0698.99 ± 0.4699.31 ± 0.3399.23 ± 0.1799.48 ± 0.31
SVHNLSUNTNR at TPR 95%.74.2977.3499.7799.75 ± 0.1899.93 ± 0.0499.94 ± 0.0699.98 ± 0.01
AUROC.91.5889.4399.7599.81 ± 0.1699.93 ± 0.0399.87 ± 0.0599.95 ± 0.02
DTACC.88.9687.1999.2898.89 ± 0.3999.41 ± 0.2699.23 ± 0.1999.58 ± 0.13
AUPRin.94.1992.1299.6499.84 ± 0.2599.97 ± 0.0299.92 ± 0.0799.98 ± 0.01
AUPRout.83.9585.4799.0599.27 ± 0.3399.22 ± 0.3398.93 ± 0.4399.38 ± 0.37
Table 3. Average performances at the epoch point, showing the best TNR in 10 experiments on (In) CIFAR-10/(Out) SVHN, Tiny ImageNet and LSUN (mean ± standard deviation).
In-Dist.Out-Dist.MetricBaselineODINMahal.OnlySiamese
(Our Previous)
OnlyTriplet
(Our Previous)
Ensemble-Siamese
(Ours)
Ensemble-Triplet
(Ours)
CIFAR-10SVHNTNR at TPR 95%.32.4786.6096.9350.69 ± 5.6951.77 ± 7.8496.94 ± 0.1897.01 ± 0.26
AUROC.89.8896.6599.2390.75 ± 1.2990.39 ± 2.0199.21 ± 0.0599.22 ± 0.04
DTACC.85.0691.0995.9984.41 ± 1.5884.24 ± 2.3096.04 ± 0.1196.06 ± 0.17
AUPRin.85.4092.5398.4481.68 ± 3.1879.35 ± 6.1198.23 ± 0.1598.29 ± 0.24
AUPRout.93.9698.5299.6595.01 ± 0.5495.01 ± 0.9599.65 ± 0.0499.65 ± 0.03
CIFAR-10Tiny ImageNetTNR at TPR 95%.44.7272.5197.1072.86 ± 3.9878.92 ± 4.1897.69 ± 0.1197.51 ± 0.10
AUROC.91.0294.0499.4791.82 ± 1.5093.90 ± 1.2299.51 ± 0.0499.48 ± 0.02
DTACC.85.0586.4896.3286.08 ± 1.5188.28 ± 1.4896.60 ± 0.0996.52 ± 0.09
AUPRin.92.4994.2199.4887.99 ± 2.3790.71 ± 1.7899.47 ± 0.0799.41 ± 0.12
AUPRout.88.4094.0999.4892.82 ± 1.3294.67 ± 1.1399.51 ± 0.0499.44 ± 0.08
CIFAR-10LSUNTNR at TPR 95%.45.4473.8398.5780.09 ± 4.9982.73 ± 3.9399.01 ± 0.0798.94 ± 0.07
AUROC.91.0494.1499.7094.32 ± 1.4295.40 ± 0.9199.65 ± 0.0299.67 ± 0.03
DTACC.85.2686.6997.4188.95 ± 1.9390.08 ± 1.3297.89 ± 0.1097.78 ± 0.11
AUPRin.92.4594.2199.7091.97 ± 1.7593.52 ± 1.2599.18 ± 0.1399.33 ± 0.18
AUPRout.88.5594.3499.7094.84 ± 1.3395.74 ± 0.9599.69 ± 0.0499.71 ± 0.02
Table 4. Average performances at the epoch point, showing the best TNR in 10 experiments on (In) CIFAR-100/(Out) SVHN, Tiny ImageNet and LSUN (mean ± standard deviation).
In-Dist.Out-Dist.MetricBaselineODINMahal.OnlySiamese
(Our Previous)
OnlyTriplet
(Our Previous)
Ensemble-Siamese
(Ours)
Ensemble-Triplet
(Ours)
CIFAR-100SVHNTNR at TPR 95%.20.2562.7691.9445.91 ± 5.1548.11 ± 7.1693.60 ± 0.9493.80 ± 0.54
AUROC.79.4593.9498.3688.43 ± 1.4888.91 ± 2.1398.47± 0.1098.46 ± 0.10
DTACC.73.2088.0493.6682.12 ± 1.6082.22 ± 2.1294.44 ± 0.4094.54 ± 0.20
AUPRin.64.8388.9796.4174.74 ± 3.9076.63 ± 6.0196.57 ± 0.3896.63 ± 0.38
AUPRout.89.0296.9199.3494.19 ± 0.7994.61 ± 0.8999.24 ± 0.0999.21 ± 0.06
CIFAR-100Tiny ImageNetTNR at TPR 95%.20.4049.1990.1263.45 ± 8.5965.20 ± 6.8692.24 ± 0.3092.22 ± 0.35
AUROC.77.1787.6298.0688.32 ± 2.6288.98 ± 2.1298.43 ± 0.0898.39 ± 0.10
DTACC.70.8280.1193.0282.86 ± 2.6082.99 ± 2.1693.79 ± 0.1793.77 ± 0.14
AUPRin.79.7487.0698.1182.67 ± 3.1484.41 ± 2.8098.39 ± 0.1598.21 ± 0.29
AUPRout.73.3087.3998.0289.89 ± 2.6390.43 ± 2.1798.42 ± 0.0798.42 ± 0.08
CIFAR-100LSUNTNR at TPR 95%.18.7845.5990.7175.23 ± 8.8872.73 ± 7.1397.21 ± 0.3997.08 ± 0.28
AUROC.75.7585.6498.1392.36 ± 2.5392.10 ± 2.1699.20 ± 0.0999.17 ± 0.06
DTACC.69.8978.2693.4787.06 ± 3.0386.40 ± 2.5596.26 ± 0.2396.24 ± 0.24
AUPRin.77.6284.4998.3489.58 ± 2.9089.49 ± 2.4698.89 ± 0.1198.81 ± 0.12
AUPRout.71.9885.7097.7493.13 ± 2.6192.64 ± 2.2499.22 ± 0.1099.20 ± 0.10
Publisher’s Note: MDPI stays neutral with regard to jurisdictional claims in published maps and institutional affiliations.

