Abstract
To cope with the growing trend of asymmetric data traffic, we introduce a novel network assisted full duplex (NAFD) for a millimeter wave system. NAFD can dynamically allocate the number of remote radio heads in the uplink mode or in the downlink mode, which can facilitate simultaneous uplink and downlink communications. In this manuscript, we use stochastic geometry to analyze the distribution of the signal-to-interference-plus-noise ratio and the data rate in a NAFD system. The numerical results verify the analysis and show that the NAFD outperforms the dynamic time division duplex system and the traditional flexible duplex system in terms of spectral efficiency.
1. Introduction
Network densification by using small cells in fifth generation cellular communication systems (5G) could increase the traffic load between different cells significantly [1,2]. In addition, as the popularization of various wireless smart devices and the surge of the user’s mobility, the traffic asymmetry between the uplink and downlink will continue to increase [3,4]. Therefore, future communication systems need more flexible technologies to cope with the situation of huge traffic volumes and asymmetric uplink and downlink services.
Traditional frequency division duplex (FDD) systems usually employ the paired frequency bands for uplink and downlink transmissions [5], which is difficult to meet the demand of asymmetry data services. Asymmetric FDD carrier aggregation can solve the problem, whereas leads to increased cost and power consumption [6,7]. In contrast, time division duplex (TDD) systems do not require paired frequencies. It can use an asymmetric time slot configuration in the uplink and downlink according to the actual situation [8,9]. Due to the asymmetry of spatio-temporal traffic, the synchronization slot configuration is extremely inefficient for small cellular networks. Xin et al. [10] proposed a method of adjusting the number of base stations in the uplink or the downlink modes in a flexible manner to solve the traffic asymmetry problem. In the system proposed by Xin et al., each base station can flexibly adjust its working state (uplink or downlink) without strict synchronization with other base stations; thus, reducing the overhead of the synchronization signal.
Recently, a unified duplex technique called network assisted full duplex (NAFD) has been presented to combine flexible duplex, hybrid-duplex, full duplex and other duplex methods by using cell-free massive MIMO network method [11]. By taking advantage of the virtue of joint processing, such as the downlink-to-uplink interference cancellation in the digital domain and genetic algorithm based user scheduling, cross-link interference has been alleviated to a large extent. NAFD technique could fully exploit the spatial degree-of-freedom of distributed networks and triggers further research interests. Millimeter wave (mmWave) propagation is a key enabling technique for 5G system. In mmWave band, phased array technique could be used to reduce implementation complexity of the transceiver. With narrow beam, spatial domain duplex could be possible. In this paper, we introduce NAFD to mmWave system with phased array. For mmWave systems, we can use narrow beams to reduce the cross-link interference which is the main challenge for sub-6GHz systems with NAFD.
In [11], the spectral efficiency analysis have been given by using random matrix theory. However, the system-level performance of NAFD has not been studied. Stochastic geometry is a useful tool for analyzing the performance of traditional cellular network systems [12,13]. The total signal-to-interference-plus-noise ratio (SINR) coverage probability was derived in a simple form by modeling the location of the base station in a traditional cellular network as a poisson point process (PPP) on a two-dimensional Euclidean plane [14]. In addition, it has been verified that the SINR coverage probability derived from the stochastic geometry tool is the lower bound of the SINR coverage probability derived from the actual cellular network location deployment [14,15]. The application of stochastic geometry is not limited to conventional cellular networks but also mmWave cellular networks. A general framework was proposed to evaluate the coverage and rate performance in mmWave cellular networks that leverages concepts from stochastic geometry [16].
This study analyzes the SINR coverage probability and spectral efficiency of a mmWave system with NAFD based on a stochastic geometry framework. The results show that the NAFD outperforms the dynamic TDD system and the traditional flexible duplex system in spectral efficiency.
The remainder of this paper is organized as follows. Section 2 introduces the NAFD system model, which includes the concept of NAFD, the remote radio head (RRH) and user location deployment, directional antenna models, and channel fading. Section 3 mathematically derives the distribution of the downlink and uplink SINR based on the conclusions of stochastic geometry. Section 4 mathematically derives the coverage probability of the instantaneous achievable rate and the average achievable rate. Section 5 provides the numerical results and discussions. Finally, Section 6 concludes this paper.
2. System Model
2.1. Concept of NAFD for mmWave System
In this paper, we consider a mmWave system with NAFD, which is composed of a baseband unit (BBU) and several RRHs. The RRHs are connected to the BBU through a high-speed optical cable, and multiple BBUs are grouped together for real-time signal processing by the cloud computing platform. The RRH could be with half-duplex or full-duplex. To reduce the hardware implementation, we consider half-duplex RRH. In NAFD systems, both uplink and downlink transmission use the same resource blocks, and the BBU determines whether the RRH works in the uplink mode or the downlink mode [11]. Cross-link interferences, including downlink-to-uplink and uplink-to-downlink interferences will be a main challenge in NAFD. Since all the RRHs are connected to the BBU, downlink-to-uplink interference can be cancelled in digital domain. The spectral efficiency of NAFD could be better than that of dynamic TDD with downlink-to-uplink interference cancellation [11].
2.2. RRH and User Deployment
This study assumed that the RRHs are located according to a homogeneous PPP of density in the Euclidean plane. The probabilities of RRH in the downlink mode and the uplink mode are denoted by and respectively, where . By the thinning theorem of the PPP [12,13], the locations of the RRHs in the downlink mode and the uplink mode can be modeled as two independent homogeneous PPPs and with densities and , respectively.
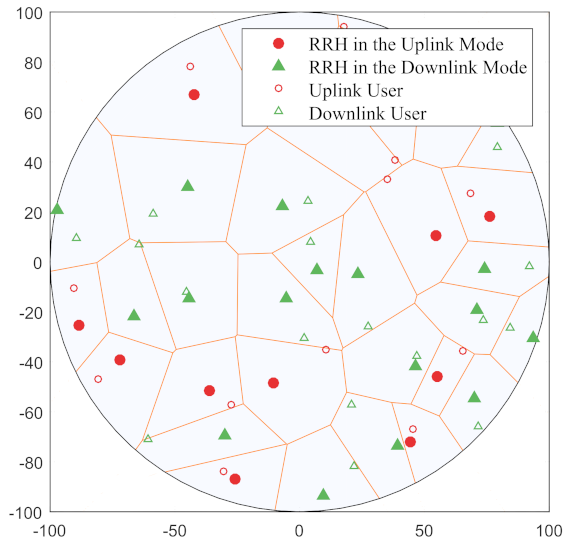
Before associating with a particular RRH, the mobile user locations follow a homogeneous PPP with density . It is assumed that each user is associated with the nearest base station; hence, the users of each RRH are uniformly distributed in the Voronoi cell of the RRH [17]. It is also assumed that each RRH serves a single active user on a given time-frequency resource, which is randomly selected from all users in its Voronoi cell. Figure 1 shows a schematic diagram of the RRH and user deployment of the NAFD system when and .
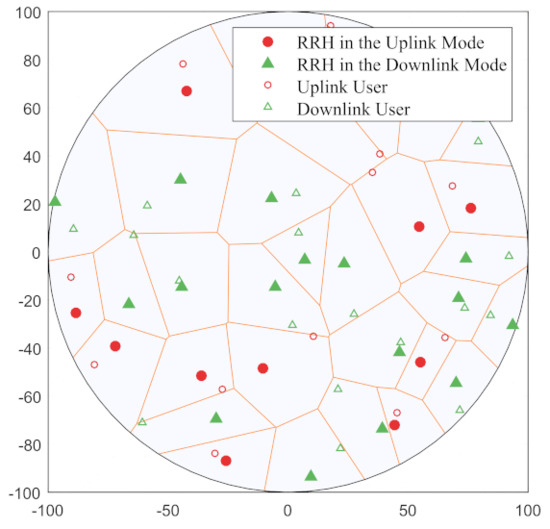
Figure 1.
A diagram of the RRH and user deployment of the NAFD system.
2.3. Directional Beamforming
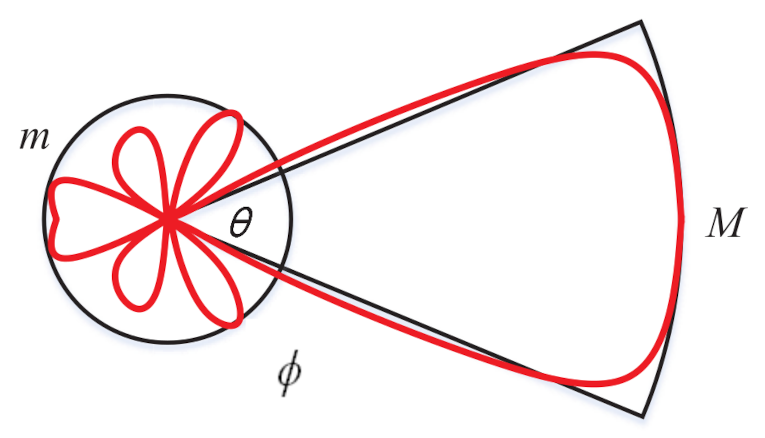
In this paper, both RRHs and user terminals use phased array technique to perform directional beamforming. For tractability of the analysis, a sectored antenna model is exploited to approximate the array patterns [16] and perfect beam alignment is also adopted. Let denote the sector antenna model in Figure 2, where M is the main lobe directivity gain, m is the back lobe gain, is the beamwidth of the main lobe, and is the angle off the boresight direction. The antenna gain is assumed to be constant M when the angle is in the main lobe and constant m when the angle is in the back lobe. Without loss of generality, the antenna’s boresight direction is assumed to be , then:
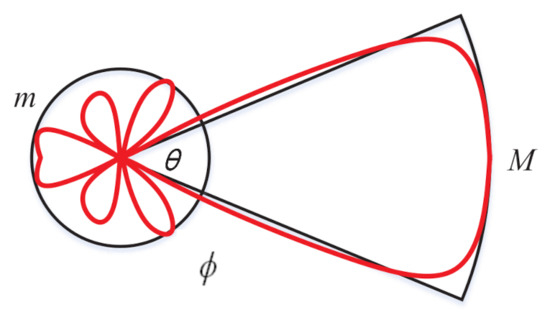
Figure 2.
A sectored model to approximate the beamforming patterns.
Let , , and be the main lobe gain, side lobe gain, and half beamwidth of the RRH antenna, respectively. In addition, , , and are the corresponding parameters of the user’s antenna.
In the downlink, the total antenna gain from the i-th RRH in the downlink mode to the typical downlink user can be denoted by , where and indicate the angle of departure and the angle of arrival, respectively. Since the typical downlink user is associated with the nearest RRH, both the typical user and its serving RRH will estimate the downlink channel. This includes the angle of arrival and fading, and then it adjusts the antenna steering direction accordingly to exploit the maximum directional gain. This study ignored the error in the channel estimation and the synchronization error of the time and carrier frequency. Therefore, the directional gain for the desired downlink is . For the i-th interfering link, the angles and are assumed to be independently and uniformly distributed in (0, 2]. As a result, the directional gain is a discrete random variable with the probability distribution as with the probability . The probability mass function of is shown in Table 1.

Table 1.
Probability mass function of .
Let denote the total antenna gain from the i-th interfering uplink user to the typical downlink user, where and indicate the angle of departure and the angle of arrival, respectively. The angles and are assumed to be independently and uniformly distributed in (0, 2]. As a result, the directional gain is a discrete random variable with the probability distribution as with the probability . The probability mass function of is shown in Table 2.
Table 2.
Probability mass function of .
In the uplink, let denote the total antenna gain from the i-th typical uplink user to the tagged RRH, which is in the uplink mode and is the serving RRH of the typical uplink user, where and indicate the angle of departure and the angle of arrival, respectively. Similar to the downlink transmission, the directional gain for the desired uplink is . For the i-th interfering link, the angles and are assumed to be independently and uniformly distributed in (0, 2]. Therefore, the discrete random variable has the same probability mass function as .
Let denote the total antenna gain from the i-th interfering RRH in the downlink mode to the tagged RRH in the uplink mode, where and indicate the angle of departure and the angle of arrival, respectively. The angles and are assumed to be independently and uniformly distributed in (0, 2]. As a result, the directional gain is a discrete random variable with the probability distribution as with the probability . The probability mass function of is shown in Table 3.
Table 3.
Probability mass function of .
2.4. Channel Fading and Power Allocation
Channel fading includes large-scale fading and small-scale fading. Regarding large-scale fading, assuming that the path loss model is , where represents the path loss exponents, while K represents the path loss at the reference distance . It is assumed that the small-scale fading is modeled as Rayleigh fading; hence, the channel power gain is subject to exponential distribution. Without loss of generality, supposing that the mean of the exponential distribution is 1. This study used g, h, , and to denote the channel power gain of the RRH-to-user link, user-to-user link, RRH-to-RRH link, and user-to-RRH link, respectively. As a result, g, h, , and are independent and identically distributed (i.i.d) random variables.
In the downlink, the RRH transmission powers are assumed to be a constant . In the uplink, mobile users use distance-proportional fractional power control [14]. For example, the transmission power of the uplink user is , where R is the distance from the uplink user to its serving RRH, and is the power control factor. This includes the special case of fixed transmission power and perfect channel inversion . In the case of power control, as the user approaches the desired RRH, the transmission power required to maintain the same received signal power is reduced.
3. SINR Coverage Analysis
The SINR coverage probability is defined as the probability that the received SINR is larger than some threshold , i.e., the complementary cumulative distribution function (CCDF) of SINR:
In this sections, we firstly consider the performance of traditional flexible duplex, and then study the performance of NAFD.
3.1. Downlink SINR Coverage Analysis
For downlink transmission, we do not consider the interference cancellation at user terminal side, and we also do not perform the scheduling [11] or user selection [18] to alleviate the uplink-to-downlink interference. Then, in this case, the downlink performance of NAFD is the same as traditional flexible duplex. Without loss of generality, all analysis is for a typical user at the origin, which is denoted by X. It is assumed that the typical user is associated to the nearest RRH, which is in the downlink mode and is denoted by . Therefore, the downlink SINR for the typical user can be expressed as:
where is the noise power at the typical user. denotes the channel power gain from to the typical user, and . is the distance between and the typical user. Note that denotes the distance between the nodes at and . denotes the interference received at the typical user from all of the other RRHs in the downlink mode except , which can be defined as:
where denotes the channel power gain from the i-th interfering RRH in the downlink mode to the typical user and . denotes the effective antenna gain. denotes the interference received at the typical user from all of the uplink users, which can be defined as:
where denotes the channel power gain from the i-th interfering uplink user to the typical user, and . denotes the i-th RRH in the uplink mode, and its associated user is . denotes the effective antenna gain.
For convenience and tractability, it is assumed that the distance between the interfering uplink user at and the typical user at the origin can be approximated to the distance between the RRH at and the typical user at the origin:
Section 5 will verify the accuracy of the distance approximation in (6). Hence, the interference received at the typical user from all of the uplink users can be approximated to:
Theorem 1.
For the flexible duplex system and the NAFD system, the downlink SINR coverage probability can be computed as:
where:
Proof of Theorem 1.
By using (2), (3), and (7), the probability of the downlink coverage relative to the SINR threshold y can be written as:
Because the locations of the RRHs follow a homogeneous PPP with density and the users are associated to the nearest RRH [14], the probability density function of can be found as (13). Let , and using the fact that , the inner probability term in (14) can be expressed as:
where is the Laplace transform of the total interference. Since and are independent PPPs, can be rewritten as:
First, calculate the ,
where is obtained using the probability generating functional (PGFL) of PPP [12,13]. is obtained using . Note that the lower extreme of the integration is r as the distance between the closest interfering RRH in the downlink mode and the typical user is greater than r. This is the distance between the typical user and its serving RRH. is from the probability mass function of . is the hypergeometric function and [19].
Following similar steps, the expression of can be obtained in (12).
Assuming no power control, i.e., , (12) can be rewritten as:
where and .
3.2. Uplink SINR Coverage Analysis for Traditional Flexible Duplex
It is assumed that the typical user is at the origin denoted by and it is associated to the nearest RRH, which is in the uplink mode and is denoted by . Therefore, the uplink SINR at the tagged RRH can be expressed as:
where is the noise power at the tagged RRH. denotes the channel power gain from the typical user to the tagged RRH, and . denotes the interference received at the tagged RRH from all RRHs in the downlink mode. This can be defined as:
where denotes the channel power gain from the i-th interfering downlink RRH, and . denotes the effective antenna gain. denotes the interference received at the tagged RRH from all of the other uplink users except the typical user, which can be defined as:
where denotes the channel power gain from the i-th interfering uplink user, and . denotes the i-th RRH in the uplink mode, and its associated user is . denotes the effective antenna gain.
For convenience and tractability, it is assumed that the distance between the interfering RRH in the downlink mode at and the tagged RRH at can be approximated to the distance between and the typical user at the origin, i.e.,
Hence, the interference received at the tagged RRH from all of the RRHs in the downlink mode can be approximated to:
Similarly, it is assumed that the distance between the interfering uplink user at and the tagged RRH at can be approximated to the distance between the RRH at and the typical user at the origin:
Section 5 will verify the accuracy of the distance approximation in (22) and (24). Using (24), the interference received at the tagged RRH from all of the other uplink users, except the typical user, can be approximated to:
Theorem 2.
For the flexible duplex system, the uplink SINR coverage probability can be computed as:
where:
Proof of Theorem 2.
By using (2), (19), (23), and (25), the probability of the uplink coverage relative to the SINR threshold y can be written as:
where is similar to the downlink analysis. Let
and using the fact that , the inner probability term in (32) can be further simplified as:
where is the Laplace transform of the total interference. Since and are independent PPPs, can be rewritten as:
First, similar to the calculation of in the proof of Theorem 1, can be calculated as:
where .
Following the similar steps, the expression of can be obtained in (30).
Assuming no power control, (30) can be rewritten as:
where and .
3.3. Uplink SINR Coverage Analysis for NAFD
It is assumed that a perfect downlink-to-uplink interference cancellation can be performed for the NAFD system.
Theorem 3.
For the NAFD system, the uplink SINR coverage probability can be computed as:
where the expressions of , , and are in Theorem 2.
Proof of Theorem 3.
The proof can be obtained following similar steps in Theorem 2. □
4. Rate Analysis
4.1. Instantaneous Rate Analysis
The instantaneous achievable rate (bits/s) can be defined as:
where W is the bandwidth. The exact rate distribution can be derived using the rate coverage probability [16]. Given the SINR coverage probability, the instantaneous achievable rate coverage probability can be computed as:
4.2. Average Rate Analysis
The average achievable rate (bits/s/Hz) can be defined as:
Because the expectation of a positive random variable X can be calculated as
we have
Hence, the average downlink rate and the average uplink rate of the flexible duplex system and the NAFD system are given by:
5. Numerical Results and Discussion
5.1. System Parameters
This section first uses the Monte Carlo simulations to verify the accuracy of the analytical results of the SINR coverage probability in Theorems 1 and 2. Subsequently, we compare the uplink SINR coverage probability in the flexible duplex system and the NAFD system. We also compare the overall SINR coverage performance in the flexible duplex system under different RRH antenna parameters. Finally, we discuss the advantage of the rate performance of the NAFD system.
Consider a circular area with radius 500 m, the RRH density is . Unless otherwise specified, the values of the network parameters are set as follows: bandwidth , , , and . The transmission power of RRHs in the downlink mode and the uplink users are and , respectively. The noise signal power is . The RRH antenna pattern is , , and while the user antenna pattern is , , and .
5.2. Numerical Results
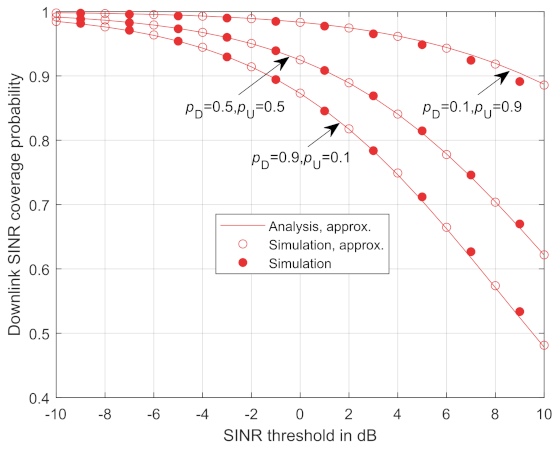
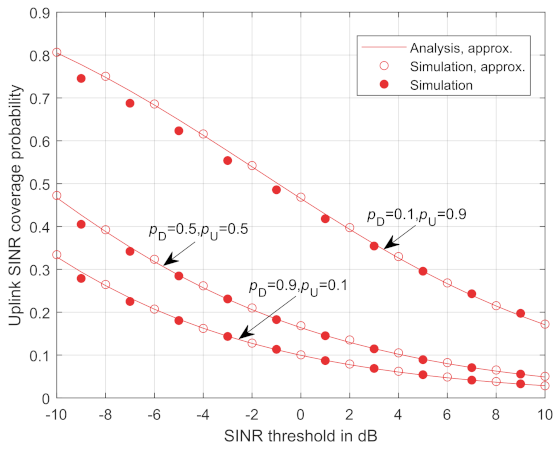
The flexible duplex system has the flexibility to adjust and () to meet the different demands for the uplink and downlink traffic needs. Figure 3 and Figure 4 validate the accuracy of the derived analytical downlink and uplink SINR coverage probability respectively shown in Theorems 1 and 2. The lines correspond to the theoretical results with the distance approximation. A hollow circle marker and a solid circle marker correspond to the Monte Carlo simulation results with and without the distance approximation, respectively. It is shown that the theoretical results match well with the Monte Carlo simulation results whether the distance approximation is used or not. In addition, as can be seen from Figure 3, a lower achieves a lower downlink SINR coverage probability. With a decrease of , the interference from the uplink user to the target downlink user decreases while the interference from the RRHs in the downlink mode increases. Since the transmission power of the RRHs in the downlink mode is larger than the uplink users, the total interference increases and the coverage probability decreases. Similarly, as shown in Figure 4, a better uplink SINR performance is achieved by increasing .

Figure 3.
Downlink SINR coverage probability for flexible duplex and NAFD.
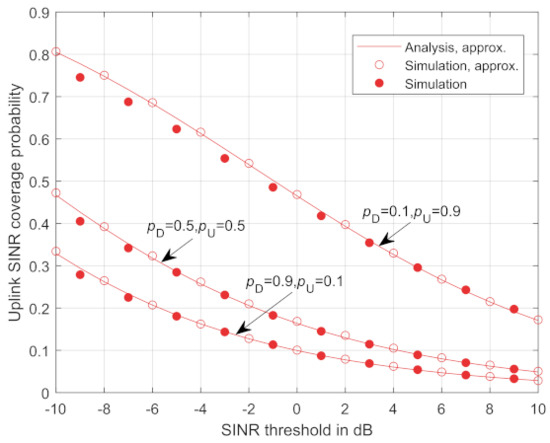
Figure 4.
Uplink SINR coverage probability for flexible duplex.
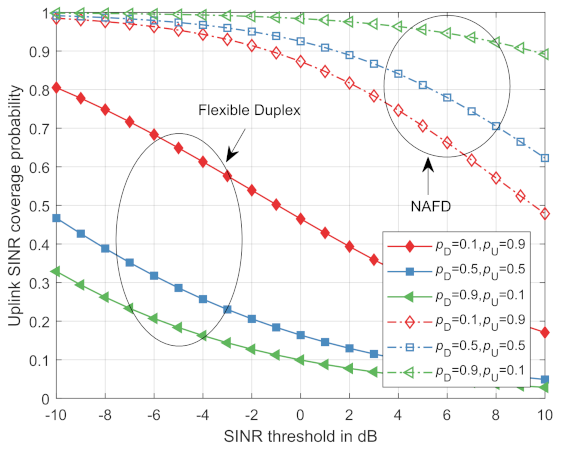
Figure 5 compares the uplink SINR coverage probability in the traditional flexible duplex system and the NAFD system. As demonstrated from Figure 5, the coverage probability of the uplink SINR will increase with the downlink interference cancellation. In addition, the higher the proportion of RRHs in the downlink mode, the greater the increase of the uplink SINR coverage probability. Since there is a larger proportion of RRHs in the downlink mode, more downlink interference will be eliminated; hence, there will be a smaller total interference for the tagged RRH in the uplink mode.
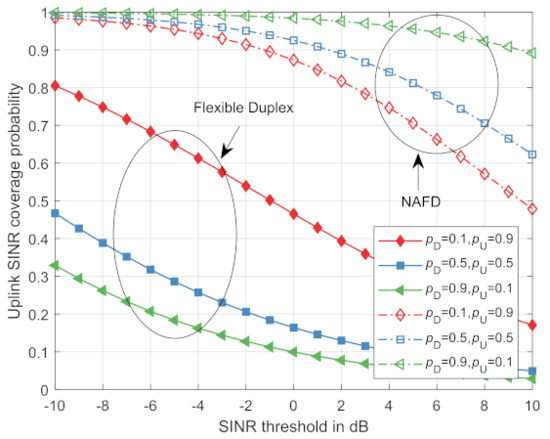
Figure 5.
The comparison of uplink SINR coverage probability between the traditional flexible duplex system and the NAFD system.
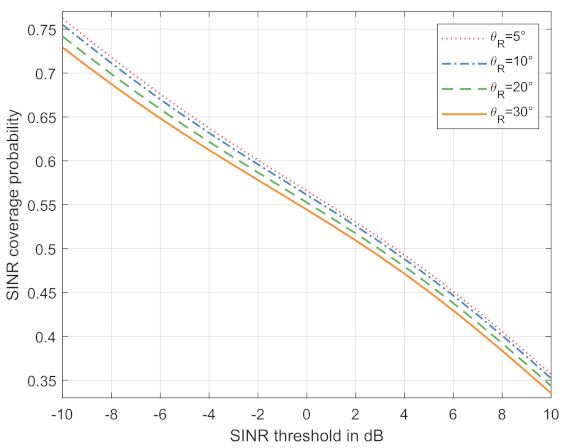
The total SINR coverage probability for this flexible duplex system can be defined as . Figure 6 compares the total SINR coverage probability of the flexible duplex system under different with . Intuitively, when the main lobe gain and the back lope gain is fixed, a better SINR performance is achieved by decreasing the main lobe beamwidth .
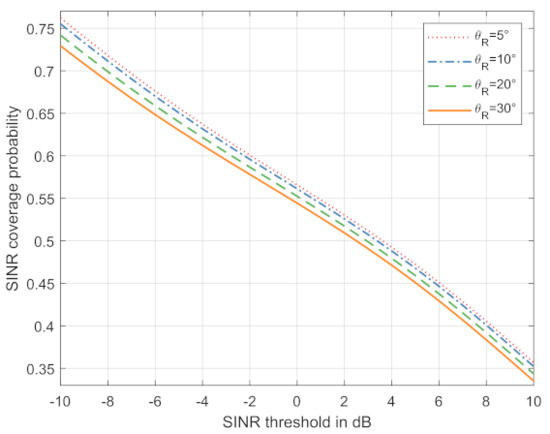
Figure 6.
SINR performance with different .
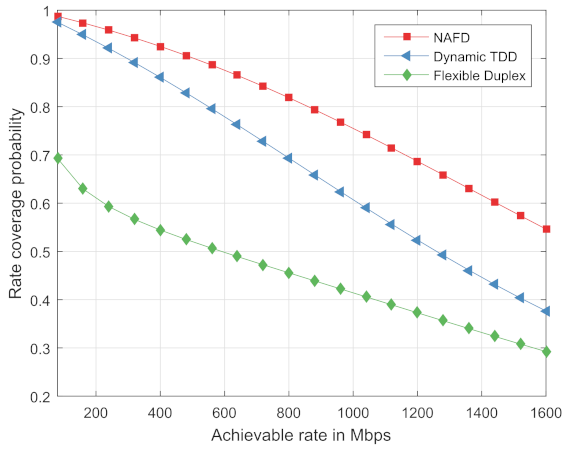
Figure 7 compares the instantaneous achievable rate coverage probability of the traditional flexible duplex system, the NAFD system and the dynamic TDD system. For the dynamic TDD system, all RRHs perform an uplink transmission or a downlink transmission during a certain time period. Supposing that the time is divided into the frames with a length of T seconds, all RRHs simultaneously receive uplink signals in time period and transmit signals in the time interval , where . To some extent, let to ensure the fairness of the comparison. As illustrated in Figure 7, the NAFD system has a better performance for the instantaneous achievable rate coverage probability than both the flexible duplex system and the dynamic TDD system.
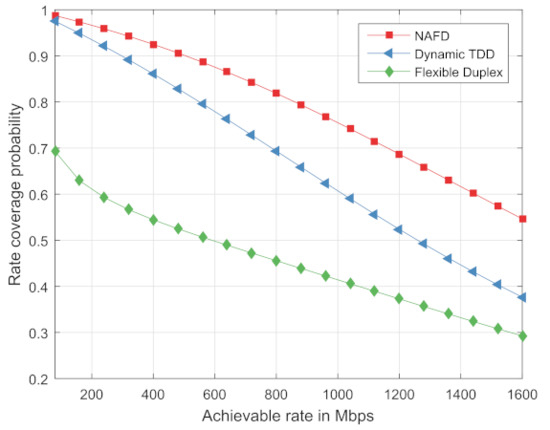
Figure 7.
Instantaneous achievable rate performance.
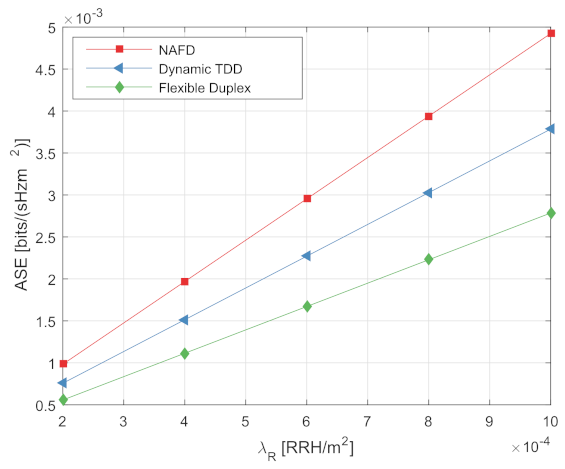
Figure 8 compares the average achievable rate per unit area of the traditional flexible duplex system, the NAFD system, and the dynamic TDD system under different . Figure 8 shows that with the increase of , the area spectral efficiency for both systems increase, and the area spectral efficiency of the NAFD system is higher than both the flexible duplex system and the dynamic TDD system.
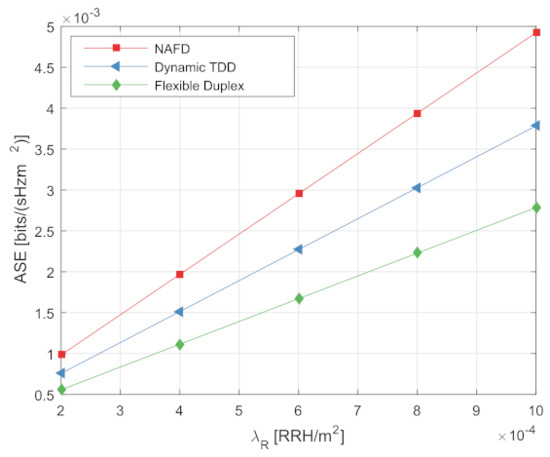
Figure 8.
Average achievable rate performance.
5.3. Discussion
From the above numerical results, we have the following remarks. Firstly, the derived analytical downlink and uplink SINR coverage probability respectively shown in Theorems 1 and 2 match well with the Monte Carlo simulation results, which means our theoretical results could be used to demonstrate the system-level performance of mmWave systems with NAFD. Secondly, when all the users use the same frequency bands, the mode selection of RRH is very important for both flexible duplex system and NAFD system. We should optimize the transmitting or receiving mode of each RRH to improve the system-level performance. Thirdly, the numerical results have also demonstrated that when we use large number of antenna elements and reduce beam-width, the probability of cross-link interference will decrease and the performance of the system will be improved. Finally, the we also see that with the ability of cooperative interference cancellation, NAFD has much better performance compared with both the flexible duplex system and the dynamic TDD system.
6. Conclusions
This study analyzed the SINR coverage probability and the spectral efficiency in the flexible duplex system and the NAFD system based on a stochastic geometry framework. We derived the downlink and uplink SINR coverage probability, the instantaneous achievable rate coverage probability, and the average achievable rate. The accuracy of the analytical expressions was verified by Monte Carlo simulations. The numerical results show that the NAFD system outperforms both the flexible duplex system and the dynamic TDD system in spectral efficiency. Since the future communication networks are becoming denser and more heterogeneous, further extensions to our study could include heterogeneous wireless networks.
Author Contributions
Conceptualization, Y.H. and D.W.; writing—original draft preparation, D.Z.; writing—review and editing, Y.H., D.Z., X.X. and D.W.; supervision, Y.H., Z.F., A.L., X.X. and D.W.; project administration, D.W. All authors have read and agreed to the published version of the manuscript.
Funding
This work was supported by the Science and Technology Project of State Grid Corporation of China under Grant SGZJXT00JSJS2000454.
Institutional Review Board Statement
Not applicable.
Informed Consent Statement
Not applicable.
Data Availability Statement
Not applicable.
Acknowledgments
In this section you can acknowledge any support given which is not covered by the author contribution or funding sections. This may include administrative and technical support, or donations in kind (e.g., materials used for experiments).
Conflicts of Interest
The authors declare no conflict of interest.
References
- Shafi, M.; Molisch, A.F.; Smith, P.J.; Haustein, T.; Zhu, P.; De Silva, P.; Tufvesson, F.; Benjebbour, A.; Wunder, G. 5G: A Tutorial Overview of Standards, Trials, Challenges, Deployment, and Practice. IEEE J. Sel. Areas Commun. 2017, 35, 1201–1221. [Google Scholar] [CrossRef]
- Zhu, J.; Zhao, M.; Zhou, S. An Optimization Design of Ultra Dense Networks Balancing Mobility and Densification. IEEE Access 2018, 6, 32339–32348. [Google Scholar] [CrossRef]
- Sun, H.; Wildemeersch, M.; Sheng, M.; Quek, T.Q.S. D2D Enhanced Heterogeneous Cellular Networks With Dynamic TDD. IEEE Trans. Wirel. Commun. 2015, 14, 4204–4218. [Google Scholar] [CrossRef]
- You, X.; Wang, C.; Huang, J.; Gao, X.; Zhang, Z. Towards 6G wireless communication networks: Vision, enabling technologies, and new paradigm shifts. Sci. China Inf. Sci. 2021, 64, 110301. [Google Scholar] [CrossRef]
- Agustin, A.; Lagen, S.; Vidal, J.; Munoz, O.; Pascual-Iserte, A.; Guo, Z.; Wen, R. Efficient Use of Paired Spectrum Bands through TDD Small Cell Deployments. IEEE Commun. Mag. 2017, 55, 210–211. [Google Scholar] [CrossRef] [Green Version]
- Yuan, G.; Zhang, X.; Wang, W.; Yang, Y. Carrier aggregation for LTE-advanced mobile communication systems. IEEE Commun. Mag. 2010, 48, 88–93. [Google Scholar] [CrossRef]
- Zhong, B.; Chen, L.; Tang, Z. Ergodic rate analysis for full-duplex NOMA networks with energy harvesting. Sci. China Inf. Sci. 2021, 64, 189303. [Google Scholar] [CrossRef]
- Jeon, W.S.; Jeong, D.G. Comparison of time slot allocation strategies for CDMA/TDD systems. IEEE J. Sel. Areas Commun. 2000, 18, 1271–1278. [Google Scholar] [CrossRef]
- Nomikos, N.; Trakadas, P.; Hatziefremidis, A.; Voliotis, S. Full-Duplex NOMA Transmission with Single-Antenna Buffer-Aided Relays. Electronics 2019, 8, 1482. [Google Scholar] [CrossRef] [Green Version]
- Xin, Y.; Yang, L.; Wang, D.; Zhang, R.; You, X. Bidirectional dynamic networks with massive MIMO: Performance analysis. IET Commun. 2017, 11, 468–476. [Google Scholar] [CrossRef]
- Wang, D.; Wang, M.; Zhu, P.; Li, J.; Wang, J.; You, X. Performance of Network-Assisted Full-Duplex for Cell-Free Massive MIMO. IEEE Trans. Commun. 2020, 68, 1464–1478. [Google Scholar] [CrossRef] [Green Version]
- Francois Baccelli, B.B. Stochastic Geometry and Wireless Networks, Part I: Theory; Now Publishers Inc.: Paris, France, 2009. [Google Scholar]
- Chiu, S.N.; Stoyan, D.; Kendall, W.S.; Mecke, J. Stochastic Geometry and Its Applications, 3th ed.; Wiley Series in Probability and Statistics; John, Wiley & Sons: Noida, India, 2013. [Google Scholar]
- Andrews, J.G.; Gupta, A.K.; Dhillon, H.S. A Primer on Cellular Network Analysis Using Stochastic Geometry. arXiv 2016, arXiv:1604.03183. [Google Scholar]
- Andrews, J.G.; Baccelli, F.; Ganti, R.K. A Tractable Approach to Coverage and Rate in Cellular Networks. IEEE Trans. Commun. 2011, 59, 3122–3134. [Google Scholar] [CrossRef] [Green Version]
- Bai, T.; Heath, R.W. Coverage and Rate Analysis for Millimeter-Wave Cellular Networks. IEEE Trans. Wirel. Commun. 2015, 14, 1100–1114. [Google Scholar] [CrossRef]
- Singh, S.; Zhang, X.; Andrews, J.G. Joint Rate and SINR Coverage Analysis for Decoupled Uplink-Downlink Biased Cell Associations in HetNets. IEEE Trans. Wirel. Commun. 2015, 14, 5360–5373. [Google Scholar] [CrossRef] [Green Version]
- Xia, X.; Zhu, P.; Li, J.; Wang, D.; Xin, Y.; You, X. Joint sparse beamforming and power control for large-scale DAS with network assistant full duplex. IEEE Trans. Veh. Technol. 2020, 69, 7569–7582. [Google Scholar] [CrossRef]
- Gradshteyn, I.; Ryzhik, I. Table of Integrals, Series, and Products, 7th ed.; Academic Press: San Diego, CA, USA, 2007. [Google Scholar]
Publisher’s Note: MDPI stays neutral with regard to jurisdictional claims in published maps and institutional affiliations. |
© 2021 by the authors. Licensee MDPI, Basel, Switzerland. This article is an open access article distributed under the terms and conditions of the Creative Commons Attribution (CC BY) license (https://creativecommons.org/licenses/by/4.0/).