Article

Path Load Adaptive Migration for Routing and Bandwidth Allocation in Mobile-Aware Service Function Chain

1
School of Information and Communications Engineering, Beijing University of Posts and Telecommunications, Beijing 100876, China
2
School of Electronic Engineering, Beijing University of Posts and Telecommunications, Beijing 100876, China
3
College of Electronics and Information Engineering, Shanghai University of Electric Power, Shanghai 201306, China
*
Author to whom correspondence should be addressed.
Electronics 2022, 11(1), 57; https://doi.org/10.3390/electronics11010057
Submission received: 27 November 2021 / Revised: 17 December 2021 / Accepted: 20 December 2021 / Published: 25 December 2021
(This article belongs to the Section Networks)

Abstract

:
With network function virtualization (NFV) expanding from network center to edge, the service function chain (SFC) will gradually approach users to provide lower delay and higher-quality services. User mobility seriously affects the quality of service (QoS) provided by the mobile-aware SFC. Therefore, we must migrate the SFC to provide continuous services. In the user estimable movement scenario with a known mobile path and estimable arrival time, we establish the estimation model of user arrival time to obtain the estimated arrival time. Then, to reduce the time that the user is waiting for the migration completion, we propose a softer migration strategy migrating mobile-aware SFC before the user arrives at the corresponding access node. Moreover, for the problem of routing and bandwidth allocation (RBA), to reduce the migration failure rate, the paper proposes a path load adaptive routing and bandwidth allocation (PLARBA) algorithm adjusting the migration bandwidth according to the path load. The experimental results show that the proposed algorithm has significant advantages in reducing the user’s waiting time by more than 90%, decreasing migration failure rate by up to 75%, and improving QoS compared to the soft migration strategy and two RBA algorithms.

1. Introduction

With the development of network virtualization, researchers have proposed network function virtualization (NFV) technology. NFV technology is usually combined with cloud computing, fog computing [1], Internet of things [2], etc. to form a new network structure. Service function chains (SFCs) decouple network services with high resource consumption into a group of virtual network functions (VNFs) connected in a specific order [3,4]. VNFs can be isolated from each other instead of the traditional network functions realized by proprietary hardware to reduce the deployment of dedicated hardware and network operation cost. To provide service with lower delay and higher QoS, SFCs are closer to users geographically. User mobility significantly affects the QoS provided by SFCs and even causes service interruption. Therefore, service providers must migrate related SFCs to maintain service connectivity. The challenges of SFC migration include migrating which VNFs [5], migrating to which virtual servers [6,7], choosing which migration path [8,9], and how to allocate migration bandwidth. The SFC migration strategy not only determines the migration time and success rate, but also affects the user’s QoS. Therefore, with more and more mobile users, SFC migration has gradually become a new research direction.
In a mobile scenario where users move from one network node to another, they access their services anytime and anywhere using mobile devices. Existing research on migration in mobile networks considers random and deterministic user movement (i.e., the arrival time and destination node are random, and both are certain). The well-studied challenges include maintaining service continuity and minimizing objective functions. For SFC deployment and migration in mobile edge computing networks, Chen et al. [10] designed a redeployment algorithm based on soft migration, which improves user satisfaction to a certain extent. For SFC migration in a distributed mobile network, based on locator/identifier separation protocol and software defined networking technology, Taleb et al. [11] achieved the tradeoff between migration cost and user experience under the condition of service continuity and user mobility. For SFC migration/remapping in cloud–fog computing environments, Zhao et al. [12] proposed the two-step migration strategy employing pre-copy and post-copy strategies to improve the success rate of SFC mapping. The above papers optimized the objective functions (QoS/migration cost/migration success rate) in the network where user mobility leads to migration.
Since resource allocation of migration significantly affects the QoS, some studies are currently devoted to the RBA problem of virtual machine (VM)/VNF migration. By using the consolidated middlebox, where each VM hosting VNF provides a service for a network service class, Xia et al. [13] formulated the path selection and capacity allocation as integer programming problems to minimize the migration cost; then, experiments showed the effectiveness of the algorithm. Yang et al. [14] studied bandwidth allocation among multiple live VM migrations in edge clouds to maximize the average QoS while meeting the migration time constraints; the method obtained a better QoS and convergence speed. For live VM migration in cross-data-center networks, Ayoub et al. [15] provided the distance adaptive RBA algorithm for the VM migration request according to the path length to minimize resource usage, and the algorithm achieved efficient network utilization.
The user’s movement path is certain, and the time user arriving at the destination node is estimable, which is called the user estimable movement scenario in the paper. This scenario is common in real life, such as buses [16,17]. It is worthy of attention and research to maintain continuous service in mobile networks involving vehicles. However, the existing migration strategy studies do not consider the user estimable movement scenario. Therefore, we address this gap in this study. In addition, instead of the existing soft migration strategy [12] migrating after the user reaches the corresponding access node, we propose a softer migration strategy migrating in advance to reduce user waiting time. For softer migration utilizing the estimable movement characteristics, we establish the prepared chain in advance to reserve resources, then transfer data by pre-copy, and finally resume the prepared chain to provide services for users. Moreover, when solving routing and bandwidth allocation problems, whether the migration is successful has a significant impact on the users’ QoS. However, few studies aimed to reduce the failure rate of SFC migration, and they did not fully consider available bandwidth resources of the migration path. Hence, to reduce the migration failure rate and let more users get timely and continuous services, in this paper, we propose the PLARBA algorithm adjusting the migration bandwidth according to the path load.
The main contributions of the paper are summarized below.
  • We consider the user estimable movement scenario with known mobile paths and estimable arrival time. There is no research on migration in this scenario.
  • Utilizing the estimable movement characteristics, we propose a softer migration strategy migrating before the user reaches the corresponding access node to reduce the user waiting time.
  • We propose the PLARBA algorithm adjusting the migration bandwidth according to the path load to reduce the migration failure rate.
The related work is introduced in Section 2. We describe the system model and formulate the problem in Section 3. The strategy and algorithm are described in Section 4. The results are analyzed in Section 5. Finally, the paper is concluded in Section 6.

2. Related Work

2.1. Service Continuity for Mobile User

When users change their location [18,19], services follow the mobile users to ensure they always access the service from the best node. Otherwise, the user’s service will be interrupted. Thus, to maintain service continuity and reduce data transmission time in the link, the related SFC should be redeployed, and data from the original server should be copied to the new server, which triggers the SFC migration.
On the basis of network congestion, Nasrin et al. [20] proposed a virtual machine migration strategy migrating the tasks from the original congested edge server to the edge server with rich resources to improve the user’s QoS. Ding et al. [21] proposed task offloading and service migration strategies to optimize energy consumption or latency of user equipment with different mobility types. Islam et al. [22] took user mobility and cloud server load into account to select the best cloud server for the mobile VM and optimize the VM migration effectiveness.
Although [10,11,12,19,20,21] studied the migration problems caused by user mobility, they only focused on user determined and random mobility scenarios. Existing research scenarios are not comprehensive, and regular movements are common. Hence, the migration issue in the scenario with regular movement is worthy of further study.

2.2. Live Migration

Live migration [13,14] can significantly shorten the service interruption time during migration. To avoid service disruption, researchers need to address both memory data migration and service continuity. Live migration, which is also soft migration, is the leading migration method. The key aspect of live migration is the step-by-step copy.
The soft migration strategy has three modes to migrate memory data according to the handover time during migration: pre-copy [15], post-copy [12], and hybrid-copy [23]. Due to the strong robustness of pre-copy, most studies on VNF migration in dynamic network scenarios adopted this mode to balance resource consumption and operation overhead [24,25,26]. Addya et al. [27] proposed a modified serial migration strategy to migrate multiple VMs in a staggered pre-copy phase, thus balancing migration time and downtime. Kherbache et al. [28] proposed a scalable migration scheduler, which parallelly and sequentially migrates multiple VMs according to the memory workload and network topology to achieve the least completion time.
Although [12,13,14,15,23,24,25,26,27,28] fully studied the soft migration algorithm, the soft migration still has the possibility of downtime, which can affect the QoS of users. It is essential to propose other migration strategies in specific scenarios.

3. System Model

In this section, we mainly describe the system model of the paper. Firstly, we discuss the problem solved by the proposed RBA algorithm. Secondly, the physical network model, the user estimable movement scenario, and the SFC migration request model are introduced. Lastly, the mathematical expression of this problem is given. Table 1 summarizes the notations used in this paper.

3.1. Problem Statement

In this paper, we study the routing and bandwidth allocation of mobile-aware SFC migration in the user estimable movement scenario. In mobile user networks, we need to migrate SFC in time to follow the movement of users to maintain service continuity. Moreover, it is necessary to improve the migration performance by using the user movement characteristics and designing the RBA algorithm. Given a physical network topology, several mobile-aware SFCs (i.e., SFC parameters), several mobile users (i.e., users’ known path and actual arrival time), and the normal distribution of user arrival time and confidence level (i.e., migration completion time constraint), we decide (1) VNFs to migrate, (2) migration routing, and (3) migration bandwidth, intending to (1) reduce the user waiting time for the migration completion and (2) reduce the migration failure rate. Via the known information, we put forward the softer migration migrating the mobile-aware SFC before the user reaches the corresponding access node. Combined with several constraints, the RBA problem is solved through path load adaptation to make multiple SFC migrations completed in the estimated time section and realize a low failure rate of migration. Below, we conclude all the assumptions in the paper.
  • Physical network: We assume that each node has the same attributes, and each link has the same bandwidth [10].
  • Mobile user: According to the central limit theorem [29], we assume that the user arrival time to the destination node follows the normal distribution. We also assume that users entering the network follow a Poisson distribution [12]. In most cases, users only request one service; thus, we assume that one SFC provides services for one user.
  • Mobile-aware SFC: Because the migration time is affected by the memory of VNFs, we assume that the memory of VNFs obeys a uniform distribution [13,14]. To simplify, we assume that each migrated VNF of the same SFC starts to migrate at the same time. Although sharing a VNF instance (VNFI) among SFCs can save resources and reduce the number of migrations, the limited location of VNFIs can lead to the SFC having a larger delay and occupying more links. The authors of [10,12] did not consider sharing VNFI; thus, we assume that VNFI cannot be shared by more than one SFC.
Several assumptions can simplify the problem proposed in the paper without considering the complex situation. We will further study the complex scenarios for these assumptions in our future work.

3.2. Physical Network Model

The physical network model consisting of nodes and links is represented as G P = ( N P , E P ) , as shown in Figure 1. The set of physical nodes is N p = { n 1 , n 2 , , n | P N | } , where | P N | is the number of physical nodes, and the set of physical links is E p = { e 1 , e 2 , , e | P E | } , where |PE| is the total number of physical links.
Each n i N P has specific node attributes, consisting of CPU P ( n i ) , memory M ( n i ) , and storage S ( n i ) . The remaining CPU, storage, and memory resources of n i are R P ( n i ) , R S ( n i ) , and R M ( n i ) . SFC deployment must meet the requirement that the allocated node resource cannot exceed the maximum available resource.
The attributes of e i E P are link bandwidth B ( e i ) and delay d ( e i ) . The remaining bandwidth of e i is R B ( e i ) . If the link cannot provide the deployment or migration bandwidth, the SFC cannot be deployed or migrated, resulting in a migration failure. Similarly, the deployment fails if the physical link does not meet the delay constraint when deploying the SFC.

3.3. User Estimable Movement Scenario

The set of mobile users in the network is U = { u 1 , u 2 , , u | M U | } . In Figure 1, the user is connected to the physical network by the physical node n 1 ; thus, the user’s current access node is n 1 , and the user’s movement path is { n 1 , n 5 , n 6 } , corresponding to the set of access nodes of SFC. However, the time when the user arrives at the access node is uncertain.
We discuss the user estimable movement scenario, characterized by the following:
  • The user’s movement path is known;
  • The user’s arrival time is regular and estimable.
For mobile users, the arrival time is affected by many factors which are independent and not decisive. The normal distribution is an excellent description of some variables in human society. Moreover, user arrival time is a continuous random variable. According to the central limit theorem, user arrival time is approximately a normal distribution. As shown in Figure 2, the mean of the user arrival time to the destination node T u is 150 T , the standard deviation is 30, and the actual arrival time T a N ( 150 T , 30 2 ) .
Moreover, pre-copy mode transfers dirty pages to the destination server via multiple rounds to ensure the latest data when using the destination server. Even if the migration meets the stop-and-copy condition before the user arrives, we still need to continue the migration and wait for the user arrival to make sure the data are up to date, which results in unnecessary resource occupation. When the user arrives, if the migration does not meet the downtime condition, the user needs to wait for the migration completion, causing loss to QoS. Therefore, it is essential to narrow the actual user arrival time and migration completion time. In the user estimable movement scenario, we establish the estimation model of user arrival time to obtain the estimated arrival time [ T C 1 , T C 2 ] . Applying confidence interval of normal distribution, we calculate T C 1 and T C 2 as follows:
T C 1 = T u Z ( C ) σ ,
T C 2 = T u + Z ( C ) σ ,
where T u and σ are the mean and standard deviation of normal distribution, C is the confidence level (possibility of the actual arrival time within the confidence interval), and Z ( C ) is the value determined by C . Set C = 30, 50, 70, and 90, where a higher confidence level results in a greater estimated arrival time (i.e., confidence interval of arrival time) in Figure 2. Using the estimation model of user arrival time, we set the migration time within the estimated time section to reduce the user waiting time for the migration completion.

3.4. SFC Migration Request Model

The set of SFCs is S = { s 1 , s 2 , , s | S F | } , where the number of SFCs is | S F | . | S F | is equal to | M U | . We express s i S as G i , S = ( N i , S , E i , S , A i , S ) , where N i , S = { v 1 , v 2 , , v | S N | } represents the set of VNFs, E i , S = { l 1 , l 2 , , l | S N | 1 } represents the set of links, and A i , S = { a 1 , a 2 , , a | S A | } depicts the set of access nodes corresponding to the movement path of the user. In Figure 1, the set of access nodes consists of n 1 , n 5 , and n 6 , | S A | = 3 .
Moreover, the SFC migration request involves multiple VNF migrations belonging to the same SFC, and each VNF is migrated in a pre-copy way. We express the set of migrated VNFs for s i in one movement as N m i . S = { v 1 , v 2 , , v | S M | } . According to the pre-copy characteristics, the VNF migration request is expressed as ( M s , M d , D , G , Q , C ) , where M s is the source node, M d is the destination node, D is the memory dirtying rate, G is the memory size of the migrated VNF, Q is the distribution of user arrival time, and C is the confidence level. Given the migration request, we perform the RBA algorithm to decide migration routing and bandwidth; then, the migration begins.

3.5. Problem Formulation

We express the problem of routing and bandwidth allocation of mobile-aware SFC migration in the user estimable movement scenario with the mathematical model below. The mathematical model applies to each migration caused by the user movement.
(1)
Objective function: The first objective is to reduce the user waiting time for the migration completion. To simply, when the user’s access node is changed, the extended link is not considered to provide service. If the corresponding SFC is not migrated to the changed node, the service will be interrupted; hence, the user waiting time for migration completion is also the service downtime. Then, the second objective function is the failure rate of SFC migration. Reducing the migration failure rate can effectively maintain service stability and improve users’ QoS in the user estimable movement scenario.
min T d ( s i ) = min ( T e ( s i ) T a ( u i ) ) , s i S , u i U ,
min F = min ( F n | S F | ) ,
where T d ( s i ) , T e ( s i ) , and T a ( u i ) are the user waiting time, the migration completion time of si, and the actual time when the corresponding user ui reaches the target node, respectively. F is the failure rate of SFC migrations, Fn is the migration failure number, and |SF| is the number of SFCs. In one migration, si migration involves multiple VNF migrations. T e ( s i ) is subject to the maximum completion time of VNF migration in Equation (5),
T e ( s i ) = max v y N m i , S T e ( v y ) ,
where T e ( v y ) is the completion time of VNF v y migration. Each v y N m i , S migration needs to satisfy the constraints below.
(2)
Constraints: Different deployment locations of the original chain and the prepared chain trigger the mobile-aware SFC migration. In Figure 1, the original SFC’s VNFs are deployed in n1, n2, n3, and n4, the prepared SFC’s VNFs are deployed in n5, n2, n3, and n4, and VNF1 is migrated from n1 to n5. Although this paper focuses on migration strategy, the original and prepared chains of the SFC still need to be deployed in the algorithm. Thus, we need to consider the constraints of deployment and migration.
Node resource constraints of deployment: When the VNFs of the original and prepared chains are deployed on the physical nodes, the CPU, storage, and memory for each VNF must be less than the remaining CPU, storage, and memory of the physical node.
ε z x P ( v z ) R P ( n x ) , v z N i , S , n x N P ,
ε z x S ( v z ) R S ( n x ) , v z N i , S , n x N P ,
ε z x M ( v z ) R M ( n x ) , v z N i , S , n x N P ,
where binary variable ε z x is set to 1 if VNF v z is deployed on the physical node n x . The CPU, storage, and memory resources of v z are P ( v z ) , S ( v z ) , and M ( v z ) . The remaining CPU, storage, and memory resources of node n x are R P ( n x ) , R S ( n x ) , and R M ( n x ) , respectively.
Bandwidth and delay constraints of deployment: While the links of original and prepared chains are deployed to the physical links, the deployed bandwidth of each virtual link cannot exceed the remaining bandwidth of the corresponding physical link. Moreover, the SFC’s delay should be less than the specified maximum delay.
ε j i b ( l j )     R B ( e i ) ,   l j E i , S , e i E P ,
j = 1 | S N | 1 d ( e l j ) d max ,
where binary variable ε j i is set to 1 if virtual link l j is deployed on the physical link e i ,   b ( l j ) is the deployed bandwidth of l j , R B ( e i ) is the remaining bandwidth of e i , d ( e l j ) is the delay of physical link e i where l j is deployed, and d max is the maximum delay allowed by the corresponding service.
Bandwidth constraint of migration: A migration bandwidth greater than the memory dirtying rate is the convergence condition of pre-copy, and bandwidth must be less than the maximum available bandwidth of migration path,
D < B ( v y ) B ( v y ) max , v y N m i , S ,
B ( v y ) max = min e z M P ( v y ) R B ( e z ) , v y N m i , S ,
where B ( v y ) is denoted as the VNF v y migration bandwidth, M P ( v y ) is the migration path, and the maximum bandwidth B ( v y ) max is the minimum value among the remaining bandwidth of each path segment in M P ( v y ) .
Downtime constraint of pre-copy: The sum of the last iteration time of the pre-copy and the resume time is less than the set threshold,
T m l ( v y ) + T r δ , v y N m i , S ,
where T m l ( v y ) is the last iteration time of the VNF vy migration, and Tr is the time to stop the source server and start the target server after copy completion.
Completion time constraint of migration: We compute the migration time using Equation (14). The migration completion time must be within the estimated time section.
T m ( v y ) = G B ( v y ) 1 ( D B ( v y ) ) n + 1 1 ( D B ( v y ) ) , v y N m i , S ,
T e ( v y ) = T s ( v y ) + T m ( v y ) , v y N m i , S ,
T C 1 T e ( v y ) T C 2 , v y N m i , S ,
where T m ( v y ) is the migration time of VNF v y , n is iteration number of pre-copy, D is memory dirtying rate, and G is the VNF memory value. T s ( v y ) is the start time of VNF v y migration. T C 1 and T C 2 are the left and right limits of the estimated arrival time.

4. Approach to the Problem

4.1. Softer Migration

If using soft migration, we start to migrate the SFC to continue to provide services for users after users arrive at the corresponding access node, leading to a long time that the user waits for the migration completion. The migration starts with two conditions for soft migration: the last migration has been completed, and the user has arrived at the corresponding access node. In Figure 3a, after the user arrives at server 5′s node, we start the first migration, i.e., of VNF1 from server 1 to server 5 and of VNF2 from server 2 to server 4. Figure 4a shows network load changes for the first migration after the user’s access node (server 5’s node). Furthermore, the intervals between adjacent migrations are sometimes enormous. That is because, even after we have completed the last migration, we perform the new migration after the user reaches the access node of the current movement, e.g., starting the second migration of VNF1 after the user reaches server 7.
To provide services with short downtime, the key aspect of the softer migration strategy is establishing a prepared chain via the known mobile path before the user reaches the corresponding access node. For softer migration, migration initiation needs to meet two conditions: the last migration has been completed, and the user will reach the corresponding access node. In Figure 3b, while the user is at server 1′s node and will move to server 5′s node, we establish the prepared chain in advance to reserve resources. There exist the original chain and prepared chain of this SFC in the network. Then, we start multiple VNF migrations between the original chain and the prepared chain. Figure 4b indicates that network load changes due to the first migration when the user enters the network and is about to move. Furthermore, the intervals between adjacent migrations are minimal because the migration does not end until the user reaches the destination node, e.g., completing the migration of the VNF1 from server 1 to server 5 after the user reaches server 5.
The similarity between the two migration strategies is that they both adopt the pre-copy mode. In Figure 5, the dirtied memory data are continuously copied and transferred from the source node to the destination node. The iteration time of each round tends to decrease to convergence. After copying data, we release the VNFs on the source node and start the VNFs on the destination node.

4.2. Path Load Adaptive Routing and Bandwidth Allocation (PLARBA) Algorithm

This paper takes a mobile-aware SFC as a unit to explore multiple VNF migrations belonging to the same SFC. The migration algorithm of the overall process can be divided into four parts, as shown in Figure 6 and described in detail in Algorithm 1.
Algorithm 1. Migration algorithm of overall process
Input: Physical network G i , S = ( N i , S , E i , S , A i , S ) , the set of SFCs S , the set of users U ,
each SFC G i , S = ( N i , S , E i , S , A i , S ) , i { 1 , 2 , 3 , , | S F | } , each user’s movement path and arrival time distribution Q , confidence level C , memory dirtying rate D .
Output: Number of SFCs failed to migrate F n , failed SFC set F S F C , network migration record M r e c o r d .
1  F n 0 , F S F C { } , M r e c o r d { } .
2 for each user u i U do
3   for each movement do
4    According to Q and C, obtain estimated time section [ T C 1 , T C 2 ]
5     The last migration completion triggers the migration decision of SFC s i in this movement.
6     Call Algorithm 2 to obtain N m i , S , source and destination nodes.
7     for each migrated VNF v y N m i , S do
8      Obtain migration request ( M s , M d , D , G , Q , C ) .
9      Execute Algorithm 3 to obtain M P ( v y ) , B ( v y ) , T m ( v y ) .
10     if M P ( v y ) = then
11       F n = F n + 1 .
12       Add s i to FSFC.
13       Delete the original chain and the prepared chain.
14       break.
15      else
16       Add M P ( v y ) , B ( v y ) , T m ( v y ) to M r e c o r d .
17      Perform migration immediately.
18      if migration meets downtime condition in Equation (13) then
19       if not receive T a ( u i ) then
20        Continue the migration to wait for the user.
21        Actual migration time T e ( v y ) = T a ( u i ) + T r .
22       else
23        Actual migration time T e ( v y ) = T e ( v y ) .
24       Add T e ( v y ) to M r e c o r d .
25    Using Equations (3) and (5), calculate user waiting time T d ( s i ) in this movement, and add T d ( s i ) to M r e c o r d .
26    Release the original chain and start the prepared chain.
27  return F n , F S F C , M r e c o r d .
(1)
Establish user estimable movement scenario to obtain the estimated time section of arrival time: After the user starts moving to the corresponding access node, on the basis of the normal distribution of user arrival time and confidence level, we obtain the estimated time section of actual arrival time [ T C 1 , T C 2 ] .
(2)
Obtain migrated VNFs, source nodes, and destination nodes: When the user starts to move, on the basis of the known access node, we deploy the prepared chain on the shortest path between the next access node and the output node. According to the original and prepared chain’s VNF deployment location, we obtain the migrated VNFs in this movement, the corresponding migration source nodes, and destination nodes in Algorithm 2. If the shortest link does not meet the deployment constraints in Equations (6)–(10), we regard it as a migration failure caused by deployment.
Algorithm 2. Deploying prepared chain
Input: corresponding SFC s i   G i , S = ( N i , S , E i , S , A i , S ) ,   F n ,   F S F C .
Output: F n , F S F C , N m i , S , source and destination nodes.
1 According to A s , obtain the next access node of s i .
2 Deploy the prepared chain on the shortest path between the next access node and the output node.
3 if constraints in Equations (6)–(10) are not satisfied then
4   F n = F n + 1 .
5   Add s i to FSFC.
6   Delete the original chain.
7   break;
8 According to the original chain and prepared chain, determine which VNFs to migrate N m i , S , source nodes, and destination nodes.
9 return F n , F S F C , N m i , S , source and destination nodes.
(3)
Implement PLARBA algorithm: We acquire the migration requests including the memory dirtying rate, memory size, and user information, and then input them into PLARBA algorithm. The PLARBA in Algorithm 3 mainly has two parts.
Algorithm 3. PLARBA
Input: Migration request ( M s , M d , D , G , Q , C ) .
Output: Decision migration path M P ( v y ) , decision migration bandwidth B ( v y ) , and decision migration time T m ( v y ) .
1 Candidate migration path set H { } .
2 Find path set A between source node M s and destination node M d .
3 for each path A i A do
4   If bandwidth A i meets constraints in Equations (11), (13), and (16) then
5    Add A i to H .
6 for each path H i H do
7   Record H i ’s length.
8 The path with the least length in H is the decision migration path M P ( v y ) .
9 Using Equations (17) and (18), obtain path load P L ( v y ) and decision migration bandwidth B ( v y ) .
10 Using Equation (14), obtain decision migration time T m ( v y ) .
11 return M P ( v y ) , B ( v y ) , T m ( v y ) .
  • Routing selection: We find all the paths between the source node and the destination node of migration according to the deployment of the original chain and the prepared chain. Then, we traverse the path set. Each path meeting the constraints of migration bandwidth, migration time, and downtime in Equations (11), (13), and (16) is added to the candidate path set. After that, the migration path with the least length in the candidate path set is the decision migration path. If no migration path meets the constraints, the migration fails.
  • Bandwidth Allocation: When the path has more remaining bandwidth, more bandwidth should be allocated to make better use of resources and complete faster. Conversely, less migration bandwidth is allocated, which makes it possible to provide bandwidth for other migration tasks as they pass through the same paths, to avoid network congestion and migration failure. The authors of [15] only took the migration path length as the standard to measure the path load, where a shorter path length indicates that the allocated bandwidth is closer to the maximum bandwidth. In this paper, we propose the following indicators for measuring the path load: (i) the path length, and (ii) the bandwidth occupancy rate of each path segment. We use the normalization method to measure the path load using Equation (17),
    P L ( v y ) = L ( v y ) L ( v y ) min L ( v y ) max L ( v y ) min + e z M P ( v y ) R ( e z ) L ( v y ) , v y N m i , S ,
    where L ( v y ) represents the migration path length of VNF v y migration task, L ( v y ) min and L ( v y ) max are the shortest and longest length in the path set, respectively. R ( e z ) is the bandwidth occupation rate of each path segment in the migration path, i.e., the ratio of occupied bandwidth to total bandwidth, the minimum sum of R ( e z ) is 0, and the maximum is L ( v y ) .
Affected by the path load, the migration bandwidth is inversely proportional to the load defined by the length and occupancy rate of the migration path. The higher the path load is, the less the migration bandwidth is allocated. Otherwise, the more the migration bandwidth is allocated. Upon setting the shortest path length to 2, the longest path length to 10, and the in Equation (17) to 0.5, Table 2 shows that the calculated load in this paper is larger than that in [15]. If an available path is short but the remaining bandwidth is small, we obtain a high value using Equation (17) because of the high load. Occupied bandwidth is also an important indicator of migration path load. Therefore, we measure the path load more comprehensively to adjust migration bandwidth effectively. We calculate the decision migration bandwidth of each VNF by adjusting the path load as follows:
B ( v y ) = C B ( v y ) max min ( P L ( v y ) , 1 ) ( C B ( v y ) max C B ( v y ) min ) , v y N m i , S ,
where B ( v y ) represents the migration bandwidth of the VNF v y migration task. C B ( v y ) min and C B ( v y ) max are the minimum and maximum migration bandwidth meeting the constraints. Since migration bandwidth ranges from the maximum value to the minimum value, the adaptive coefficient needs to be 1 .
(4)
Adopt path and bandwidth, perform the migration: We execute all VNF migration tasks for the SFC. If the migration has met the stop-and-copy constraint in Equation (13) before the user arrives, the migration continues to wait for the user, and the actual migration completion time Te(vy)′ is the sum of the user’s actual arrival time and resumption time of pre-copy; otherwise, it is the decision migration completion time in Equation (14). After the user reaches the destination node and all VNF migrations are completed, we release the original chain and start the prepared chain.
T e ( v y ) = { T a ( u i ) + T r   if   migration   meet   constraint   in   Equation   ( 13 )   T e ( v y ) otherwise , v y N m i , S .
Obviously, the complexity levels of PLARBA and Algorithm 1 are O ( m A + m H ) and O ( | M U | a | S A | a | S M | ( m A + m H ) ) , respectively, where m A is the number of paths in A , m H is the number of paths in H , a | S A | is the average number of user movements (i.e., the average number of SFC access nodes), a | S M | is the average number of migrated VNFs per migration per SFC.

5. Simulation Results

5.1. Simulation Setting

We developed a migration simulation platform under the user estimable movement scenario on the basis of a general simulation platform of NFV resource allocation SFCSim [30]. We simulated the NSFNET network with 14 nodes and 21 links. The CPU, memory, and storage of each node were set to 300 GHz, 300 GB, and 300 GB, the bandwidth of each link was 4 GBps, and the link delay followed a normal distribution N ( 1 , 0.5 2 ) s.
Furthermore, we set 10 types of VNFs. The CPU and storage of each VNF were 1 GHz and 1 GB. Memory obeyed U ( 1 , 3 ) GB. The period T in the network was 0.1 s. The number of users | M U | increased from 20 to 90. The mean T u of user arrival time to the next node obeyed U ( 14 , 16 ) s. Moreover, the number of access nodes of each SFC was uniformly distributed from 3 to 7. The access and output nodes were randomly selected from 14 nodes. For each SFC, the number of VNFs followed U ( 2 , 6 ) , the bandwidth of links followed U ( 5 , 20 ) MBps, and the delay followed U ( 0.4 , 0.8 ) s. Lastly, in Equation (17) was set to 0.5, memory dirtying rate was 50 MBps, maximum downtime was 1 s, and the resumption time of pre-copy T r was 0.2 s.

5.2. Softer Migration and Soft Migration with One SFC

Firstly, to verify the advantage of softer migration in reducing user waiting time, we implemented the softer migration strategy (SEM) compared with soft migration (SM) and considered the average user waiting time for migration completion as the performance indicator. Both migration strategies adopted the PLARBA algorithm. Then, we studied the influence of confidence level and standard deviation on this indicator. In the comparison experiment of softer migration and soft migration, we ran each algorithm 10 times, set a different SFC each time, and took the average value as the final result. Because of the low network load, the decision migration time was close to the left limit of the estimated time section.
(1)
The influence of confidence level: Figure 7a depicts that, compared with SM, the user waiting time of SEM was significantly reduced by 94.3% for C = 30 , 95.4% for C = 50 , 96.5% for C = 70 , and 97.7% for C = 90 . As confidence increased, the user waiting time of the two strategies gradually decreased. For the SEM algorithm, the waiting time for C = 90 was 69.6% less than that for C = 30 . For the SM algorithm, the indicator for C = 90 was 25.7% less than that for C = 30 . This is because, as accuracy increased, T C 1 and the decision migration time decreased. However, the migration could not enter the stop-and-copy stage until the user arrived, and the actual migration time approached the user arrival time. Thus, the user waiting time approached T r gradually.
(2)
The influence of standard deviation: In Figure 7b, compared with SM, SEM reduced the user waiting time by 97.9% for σ = 1 , 98.0% for σ = 10 , 98.3% for σ = 20 , and 97.7% for σ = 30 . With standard deviation increasing, the indicators of the two strategies showed a falling trend. For the SEM algorithm, the waiting time for σ = 30 was 22.6% less than that for σ = 1 . For the SM algorithm, the waiting time at σ = 30 was 30.9% less than that for σ = 1 . Similarly, with standard deviation increasing, T C 1 also reduced, leading to the user waiting time approaching T r .
The simulation results fully prove the advantages of migration in advance in reducing user waiting time. SEM can reduce the waiting time by more than 90% at different confidence levels and standard deviations, reducing downtime and improving QoS. This section of the experiment with one SFC is the basis for PLARBA experiment with multiple SFCs. In the next section, to get a larger estimated time section, the confidence level is set to 90, and the standard deviation is 30.

5.3. PLARBA Algorithm and Two Comparison Algorithms with Multiple SFCs

To validate the advantages of the PLARBA algorithm on migration performance, we adopted the SEM strategy and the PLARBA algorithm compared with other algorithms. Furthermore, since PLARBA was an improvement of the DARBA algorithm in [15], we set DARBA and MAXRBA in [15] as the comparison algorithms. The difference among the three algorithms lies in how to allocate migration bandwidth.
DARBA: The migration bandwidth is only adjusted by the path length, P L ( v y ) = L ( v y ) L ( v y ) min L ( v y ) max L ( v y ) min , v y N m i , S , taking no account of the bandwidth occupation rate of each path segment.
MAXRBA: The maximum bandwidth value of the migration path is allocated satisfying the constraints as the migration bandwidth.
In the comparison experiment of PLARBA, DARBA, and MAXRBA, we explored the impact of the number of users on performance and considered five performance indicators:
  • Average migration bandwidth: The average migration bandwidth allocated for all requests.
  • Network load maximum: The maximum sum of occupied bandwidth in physical links from when the first user enters the network to when no users are in the network.
  • The number of SFC migrations: The total migration times of the SFCs without migration failure and the existing migration times of the SFCs with midway migration failure.
  • The number of VNF migrations: The total number of VNF migrations from when the first user enters the network to when there are no users.
  • Failure rate of SFC migration: Ratio of the number of SFCs with migration failure to the number of SFCs.
(1)
Average migration bandwidth: As shown in Figure 8a, the average migration bandwidth of PLARBA was significantly lower than that of the two comparison algorithms because it considered the path length and the path bandwidth occupancy. In addition, when the number of SFCs changed, the differences in migration bandwidth were within the range [1.5, 2.6] MB/T. When there were 80 SFCs, the bandwidth of PLARBA decreased by 2.6 MB/T compared with that of DARBA. As more and more SFCs were introduced into the network, the migration bandwidth tended to decrease. Compared with the case of 20 SFCs, the indicator of 90 SFCs was reduced by 3.5% using PLARBA, 1.3% using DARBA, and 0.3% using MAXRBA. When the number of SFCs increased, the maximum bandwidth satisfying the constraints decreased and the adaptive coefficient of PLARBA was larger, leading to less allocated bandwidth.
(2)
Network load maximum: As shown in Figure 8b, when there were 20 SFCs in the network, the indicator of PLARBA was 362.8 MB/T less than that of DARBA and 426.9 MB/T less than that of MAXRBA. When more users were set in the network, the load value of PLARBA was higher than that of the two comparison algorithms because PLARBA could migrate more SFCs successfully through load adaption. When 90 SFCs were considered, the indicator of PLARBA increased by 156.8 MB/T compared to DARBA and 472.7 MB/T compared to MAXRBA. The network load values of the three algorithms increased with the number of users. For PLARBA, the load value with 90 SFCs was 135.1% higher than that with 20 SFCs compared to 103.6% for DARBA and 90.0% for MAXRBA. Regardless of the algorithm, the increasing trend gradually slowed down due to the limited capacity of the network.
(3)
The number of SFC migrations: Figure 9a displays that PLARBA had more SFC migrations compared with the two other algorithms. When 50 SFCs were set, the value of the PLARBA algorithm increased by 25.2% and 20.7% compared with DARBA and MAXRBA, respectively. When 70 SFCs were set, the value of the PLARBA algorithm increased by 24.8% and 24% compared with DARBA and MAXRBA, respectively. When the number of SFCs increased from 20 to 90, the differences in migration times among the three algorithms increased gradually. When the network had more than 50 SFCs, the differences remained stable. More users in the network led to more SFC migrations. Similarly, the number of SFC migrations increased to the saturation point.
(4)
The number of VNF migrations: As shown in Figure 9b, the number of VNF migrations when adopting the PLARBA algorithm was 2–3 times that of the corresponding SFC migrations because each SFC migration caused two or three VNF migrations. When considering 50 SFCs, the value of the PLARBA algorithm increased by 18.9% and 17.1% compared with DARBA and MAXRBA, respectively. When considering 70 SFCs, the value of the PLARBA algorithm increased by 16.5% and 22.7% compared with DARBA and MAXRBA, respectively. As the number of SFCs increased from 20 to 50, the difference in this indicator among the three algorithms gradually increased. When considering more than 50 SFCs, the difference mainly remained in a specific range. Similar to the number of SFC migrations, compared with 20 SFCs, the number of VNF migrations for the PLARBA algorithm with 90 SFCs increased by 140.8%, the indicator for DARBA increased by 100%, and the indicator for MAXRBA increased by 123.8%.
(5)
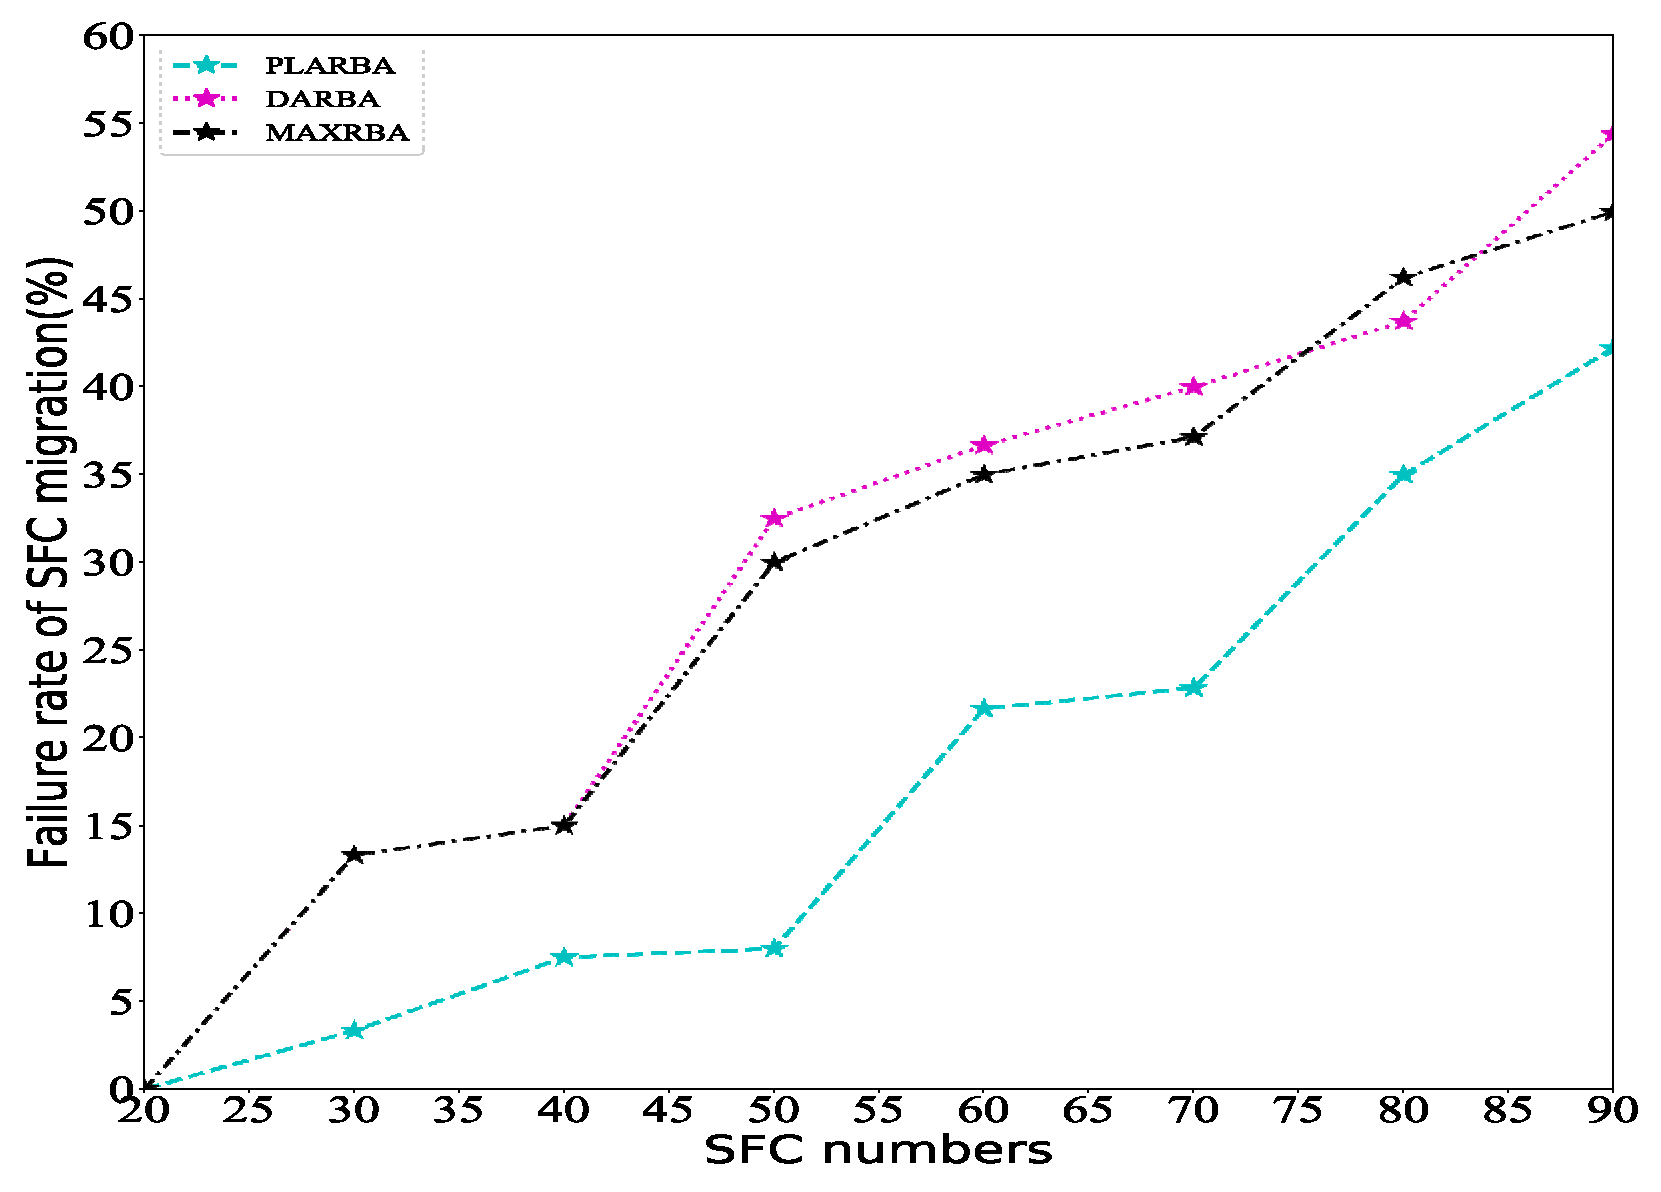
Failure rate of SFC migration: Figure 10 shows that the migration failure rate of PLARBA was always higher than that of the two comparison algorithms, indicating that considering the path length and bandwidth occupancy can significantly reduce the indicator. When considering 50 SFCs in the network, compared with DARBA, the failure rate of PLARBA decreased by 75.4%, and the decline was the most obvious. Comparing PLARBA and DARBA, the failure rate of PLARBA with 70 SFCs decreased by 42.9%, while the failure rate of PLARBA with 90 SFCs decreased by 22.4%. When the number of SFCs increased, the difference among the three algorithms first increased and then decreased. More SFCs were set when fewer users were in the network, more SFCs were migrated successfully, and the advantage of load adaptation was more pronounced. However, when the number of users was large, the remaining bandwidth of the physical link was less, and the load adaption ability of PLARBA was limited.
According to the experimental simulation under a different number of users, PLARBA allocated the bandwidth dynamically according to the path load, allowing more SFCs to migrate successfully, while better utilizing network bandwidth and obtaining a lower migration failure rate. Therefore, PLARBA can provide continuous service for more mobile users and PLARBA is especially more appropriate when there are not too many users.

6. Conclusions

In dynamic networks with mobile-aware SFCs, the user estimable movement scenario with a known movement path and estimable arrival time is common. To solve the migration problem in this scenario, utilizing the known movement information, we put forward a softer migration strategy to migrate the SFC before the user reaches the corresponding access node. Then, for routing and bandwidth allocation issues, to reduce the number of SFCs with migration failure, we proposed the PLARBA algorithm taking path load as the bandwidth allocation factor. Then, we conducted experiments to verify the superiority of the proposed algorithm in the NSFNET network. The comparison of SEM and SM showed that the softer migration strategy could significantly reduce the user waiting time by more than 90%. The comparison of PLARBA, DARBA, and MAXRBA revealed that PLARBA decreased the total migration failure rate by up to 75%, resulting in more continuous and stable services for more mobile users. The proposed algorithm in this paper can be applied to mobile networks involving vehicles to provide continuous service by using the regularity of movement.
In future work, we plan to formalize the user estimable movement model instead of using the qualitative normal distribution and apply a neural network to effectively predict users’ actual arrival time. Moreover, we will consider sharing VNFI among SFCs and decide when to start the migration. In addition, we will optimize the deployment algorithm to further improve the migration success rate. Furthermore, we will coordinate the migration bandwidth of all SFCs in the network to fully use bandwidth resources and further reduce the migration failure rate.

Author Contributions

H.H., C.Y. and L.X. conceptualized the study, designed and executed the experiments, and analyzed the results; T.S. and B.B.D. composed and edited the paper. All authors have read and agreed to the published version of the manuscript.

Funding

This work was supported by the National Natural Science Foundation of China (Nos. 61821007, 62090015).

Acknowledgments

The authors would like to thank the anonymous reviewers for their suggestions to improve the quality of this article.

Conflicts of Interest

The authors declare no conflict of interest.

References

  1. Mouradian, C.; Kianpisheh, S.; Abu-Lebdeh, M. Application Component Placement in NFV-Based Hybrid Cloud/Fog Systems with Mobile Fog Nodes. IEEE J. Sel. Areas Commun. 2019, 37, 1130–1143. [Google Scholar] [CrossRef]
  2. Wang, Z.; Sun, D.; Xue, G.; Qian, S.; Li, G.; Li, M. Ada-Things: An adaptive virtual machine monitoring and migration strategy for internet of things applications. J. Parallel Distrib. Comput. 2018, 132, 164–176. [Google Scholar] [CrossRef]
  3. Herrera, J.G.; Botero, J.F. Resource Allocation in NFV: A Comprehensive Survey. IEEE Trans. Netw. Serv. Manag. 2017, 13, 518–532. [Google Scholar] [CrossRef]
  4. Yang, S.; Li, F.; Trajanovski, S.; Yahyapour, R.; Fu, X. Recent Advances of Resource Allocation in Network Function Virtualization. IEEE Trans. Parallel Distrib. Syst. 2021, 32, 295–314. [Google Scholar] [CrossRef]
  5. Qin, J.; Wu, Y.; Chen, Y.; Xue, K.; Wei, D.S.L. Online User Distribution-aware Virtual Machine Re-Deployment and Live Migration in SDN-based Data Centers. IEEE Access 2019, 7, 11152–11164. [Google Scholar] [CrossRef]
  6. Tang, L.; He, X.; Zhao, P.; Zhao, G.; Zhou, Y.; Chen, Q. Virtual Network Function Migration Based on Dynamic Resource Requirements Prediction. IEEE Access 2019, 7, 112348–112362. [Google Scholar] [CrossRef]
  7. Shen, H.; Chen, L. A Resource Usage Intensity Aware Load Balancing Method for Virtual Machine Migration in Cloud Datacenters. IEEE Trans. Cloud Comput. 2020, 8, 17–31. [Google Scholar] [CrossRef]
  8. Paulraj, G.J.L.; Francis, S.A.J.; Peter, J.D.; Jebadurai, I.J. Route Aware Virtual Machine Migration in Cloud Datacenter. In Proceedings of the 2018 Second International Conference on Inventive Communication and Computational Technologies (ICICCT), Coimbatore, India, 20–21 April 2018; pp. 363–367. [Google Scholar] [CrossRef]
  9. Shoura, F.; Gharaibeh, A.; Alouneh, S. Optimization of Migration Cost for Network Function Virtualization Replacement. In Proceedings of the 2020 21st International Arab Conference on Information Technology (ACIT), Giza, Egypt, 28–30 November 2020; pp. 1–7. [Google Scholar] [CrossRef]
  10. Chen, Y.T.; Liao, W. Mobility-Aware Service Function Chaining in 5G Wireless Networks with Mobile Edge Computing. In Proceedings of the ICC 2019–2019 IEEE International Conference on Communications (ICC), Shanghai, China, 20–24 May 2019; pp. 1–6. [Google Scholar] [CrossRef]
  11. Taleb, T.; Ksentini, A.; Frangoudis, P. Follow-Me Cloud: When Cloud Services Follow Mobile Users. IEEE Trans. Cloud Comput. 2016, 7, 369–382. [Google Scholar] [CrossRef]
  12. Zhao, D.; Sun, G.; Liao, D.; Xu, S.; Chang, V. Mobile-aware service function chain migration in cloud-fog computing. Future Gener. Comput. Syst. 2019, 96, 591–604. [Google Scholar] [CrossRef]
  13. Xia, J.; Pang, D.; Cai, Z.; Xu, M.; Hu, G. Reasonably Migrating Virtual Machine in NFV-Featured Networks. In Proceedings of the 2016 IEEE International Conference on Computer and Information Technology (CIT), Nadi, Fiji, 8–10 December 2016; pp. 361–366. [Google Scholar] [CrossRef]
  14. Yang, L.; Yang, D.; Cao, J.; Sahni, Y.; Xu, X. QoS Guaranteed Resource Allocation for Live Virtual Machine Migration in Edge Clouds. IEEE Access 2020, 8, 78441–78451. [Google Scholar] [CrossRef]
  15. Ayoub, O.; Musumeci, F.; Tornatore, M.; Pattavina, A. Efficient Routing and Bandwidth Assignment for Inter-Data-Center Live Virtual-Machine Migrations. IEEE/OSA J. Opt. Commun. Netw. 2017, 9, B12–B21. [Google Scholar] [CrossRef]
  16. Achar, A.; Bharathi, D.; Kumar, B.A.; Vanajakshi, L. Bus Arrival Time Prediction: A Spatial Kalman Filter Approach. IEEE Trans. Intell. Transp. Syst. 2020, 21, 1298–1307. [Google Scholar] [CrossRef]
  17. Hua, X.D.; Yang, J.Q.; Wang, W. Hybrid Bus Arrival Time Prediction Models Based on Data Fusion. J. Highw. Transp. Res. Dev. 2019, 36, 112–120. [Google Scholar]
  18. Guan, Y.; Zong, Y.; Liu, Y. Virtual Network Embedding Supporting User Mobility in 5G Metro/Access Networks. In Proceedings of the ICC 2019 IEEE International Conference on Communications (ICC), Shanghai, China, 20–24 May 2019; pp. 1–7. [Google Scholar] [CrossRef]
  19. Nasrin, W.; Xie, J. SharedMEC: Sharing Clouds to Support User Mobility in Mobile Edge Computing. In Proceedings of the 2018 IEEE International Conference on Communications (ICC 2018), Kansas City, MO, USA, 20–24 May 2018; pp. 1–6. [Google Scholar] [CrossRef]
  20. Liu, L.; Liu, X.; Zeng, S. Research on virtual machines migration strategy based on mobile user mobility in mobile edge computing. J. Chongqing Univ. Posts Telecommun. (Nat. Sci. Ed.) 2019, 18, 570–584. [Google Scholar]
  21. Ding, Y.; Liu, C.; Li, K. Task Offloading and Service Migration Strategies for User Equipments with Mobility Consideration in Mobile Edge Computing. In Proceedings of the 2019 IEEE Intl. Conf. on Parallel & Distributed Processing with Applications, Big Data & Cloud Computing, Sustainable Computing & Communications, Social Computing & Networking, Xiamen, China, 16–18 December 2019; pp. 176–183. [Google Scholar]
  22. Islam, M.; Razzaque, A.; Islam, J. A genetic algorithm for virtual machine migration in heterogeneous mobile cloud computing. In Proceedings of the 2016 International Conference on Networking Systems and Security (NSysS), Dhaka, Bangladesh, 7–9 January 2016; pp. 1–6. [Google Scholar]
  23. Damania, K.; Holmukhe, S.; Singhai, V. An Overview of VM Live Migration Strategies and Technologies. In Proceedings of the 2018 Second International Conference on Electronics, Communication and Aerospace Technology (ICECA), Coimbatore, India, 29–31 March 2018; pp. 1185–1190. [Google Scholar]
  24. Mandal, U.; Chowdhury, P.; Tornatore, M.; Martel, C.U.; Mukherjee, B. Bandwidth Provisioning for Virtual Machine Migration in Cloud: Strategy and Application. IEEE Trans. Cloud Comput. 2016, 6, 967–976. [Google Scholar] [CrossRef]
  25. Li, Z.; Wu, G. Optimizing VM live migration strategy based on migration time cost modeling. In Proceedings of the 2016 ACM/IEEE Symposium on Architectures for Networking and Communications Systems (ANCS), Santa Clara, CA, USA, 17–18 March 2016; pp. 99–109. [Google Scholar]
  26. Tziritas, N.; Loukopoulos, T.; Khan, S.U. Online Live VM Migration Algorithms to Minimize Total Migration Time and Downtime. In Proceedings of the 2019 IEEE International Parallel and Distributed Processing Symposium (IPDPS), Rio de Janeiro, Brazil, 20–24 May 2019; pp. 99–109. [Google Scholar]
  27. Addya, S.K.; Turuk, A.K.; Satpathy, A.; Sahoo, B.; Sarkar, M. A Strategy for Live Migration of Virtual Machines in a Cloud Federation. IEEE Syst. J. 2018, 13, 2877–2887. [Google Scholar] [CrossRef]
  28. Kherbache, V.; Madelaine, E.; Hermenier, F. Scheduling Live Migration of Virtual Machines. IEEE Trans. Cloud Comput. 2017, 8, 282–296. [Google Scholar] [CrossRef]
  29. Gao, M.; Li, Y.; Dobre, O.A.; Al-Dhahir, N. Blind Identification of SFBC-OFDM Signals Based on the Central Limit Theorem. IEEE Trans. Wirel. Commun. 2019, 18, 3500–3514. [Google Scholar] [CrossRef]
  30. SFCSim Simulation Platform. Available online: https://github.com/SFCSim/SFCSim (accessed on 5 January 2021).
Figure 1. System model.
Electronics 11 00057 g001
Figure 2. Probability distribution of user arrival time.
Electronics 11 00057 g002
Figure 3. Two migration strategies: (a) soft migration; (b) softer migration.
Electronics 11 00057 g003
Figure 4. Change of network load (i.e., the sum of the occupied bandwidth in physical links) adopting soft migration and softer migration: (a) soft migration; (b) softer migration.
Electronics 11 00057 g004
Figure 5. Copy dirty data repeatedly adopting pre-copy mode.
Electronics 11 00057 g005
Figure 6. Migration algorithm of overall process.
Electronics 11 00057 g006
Figure 7. Average user waiting time for migration completion with respect to the estimated time section: (a) varies with the confidence level; (b) varies with the standard deviation.
Electronics 11 00057 g007
Figure 8. Occupied bandwidth resources with respect to SFC numbers: (a) average migration bandwidth; (b) network load maximum.
Electronics 11 00057 g008
Figure 9. Migration times with respect to SFC numbers: (a) the number of SFC migrations; (b) the number of VNF migrations.
Electronics 11 00057 g009
Figure 10. Failure rate of SFC migration with respect to SFC numbers.
Electronics 11 00057 g010
Table 1. Notations in the paper.
FunctionNotationDefinition
Parameter G P = ( N P , E P ) Physical network, composed of the set of physical nodes and the set of physical links.
S = { s 1 , s 2 , , s | S F | } The set of SFCs, where | S F | is the number of SFCs.
G i , S = ( N i , S , E i , S , A i , S ) One mobile-aware SFC s i , composed of the set of VNFs, the set of links, and the set of access nodes.
N m i . S = { v 1 , v 2 , , v | S M | } The set of migrated VNFs for s i , where | S M | is the number of migrated VNFs.
( M s , M d , D , G , Q , C ) VNF migration request.
U = { u 1 , u 2 , , u | M U | } The set of users, where | M U | is the number of users.
T u , T a , σ Mean of the user arrival time, actual arrival time, and standard deviation.
P ( v z ) , S ( v z ) , M ( v z ) .CPU, storage, and memory resources of v z .
R P ( n x ) , R S ( n x ) , R M ( n x ) Remaining CPU, storage, and memory resources of physical node n x .
b ( l j ) , R B ( e i ) , d ( e l j ) , d max Deployed bandwidth of l j , remaining bandwidth of physical link e i , delay of the physical link e l j , and maximum delay.
B ( v y ) max , T r , δ Maximum bandwidth, resume time, and downtime threshold.
Decision variable [ T C 1 , T C 2 ] Estimated time section.
T d ( s i ) , T e ( s i ) , T a ( u i ) Downtime, the migration completion time of s i , and actual arrival time of corresponding u i .
F n , F Migration failure rate and migration failure number.
ε z x , ε j i Binary variables.
A , H , L ( v y ) min , L ( v y ) max Migration path set, candidate migration path set, and shortest and longest length in A .
M P ( v y ) , L ( v y ) Migration path and its length.
C B ( v y ) min , C B ( v y ) max Minimum and maximum migration bandwidth meeting the constraints.
P L ( v y ) , B ( v y ) Migration path load and migration bandwidth.
T m ( v y ) , T e ( v y ) , T e ( v y ) Decision migration time, decision completion time, and actual completion time.
Table 2. Comparison of path load in this paper with that in [15].
Path LengthBandwidth Occupation RateLoad in [15]Load in the Paper
2[0.3, 0.3]00.3
2[0.6, 0.8]00.7
4[0.3, 0.3, 0.3, 0.3]0.250.55
4[0.5, 0.3, 0.1, 0.3]0.250.55
5[0.3, 0.3, 0.3, 0.3, 0.3]0.3750.675
5[0.5, 0.3, 0.3, 0.2, 0.3]0.3750.695
Publisher’s Note: MDPI stays neutral with regard to jurisdictional claims in published maps and institutional affiliations.

