
Improved LS-SVM Method for Flight Data Fitting of Civil Aircraft Flying at High Plateau


Abstract
:1. Introduction
2. Principle of Data Restoration Method
2.1. LS-SVM Principle
2.2. The Choice of Kernel Function
- (1)
- Linear kernel function:
- (2)
- Polynomial kernel function:( value is the order of the polynomial)
- (3)
- Radial basis kernel function:
- (4)
- B-spline kernel function:
- (5)
- Perceptual kernel function:
2.3. LS-SVM Principle
2.4. Principles of Principal Component Analysis (PCA)
2.5. Verification Method
3. Compensation Model and Simulation of High-Plateau Missing Data
3.1. Data Selection
3.2. Algorithm Improvement
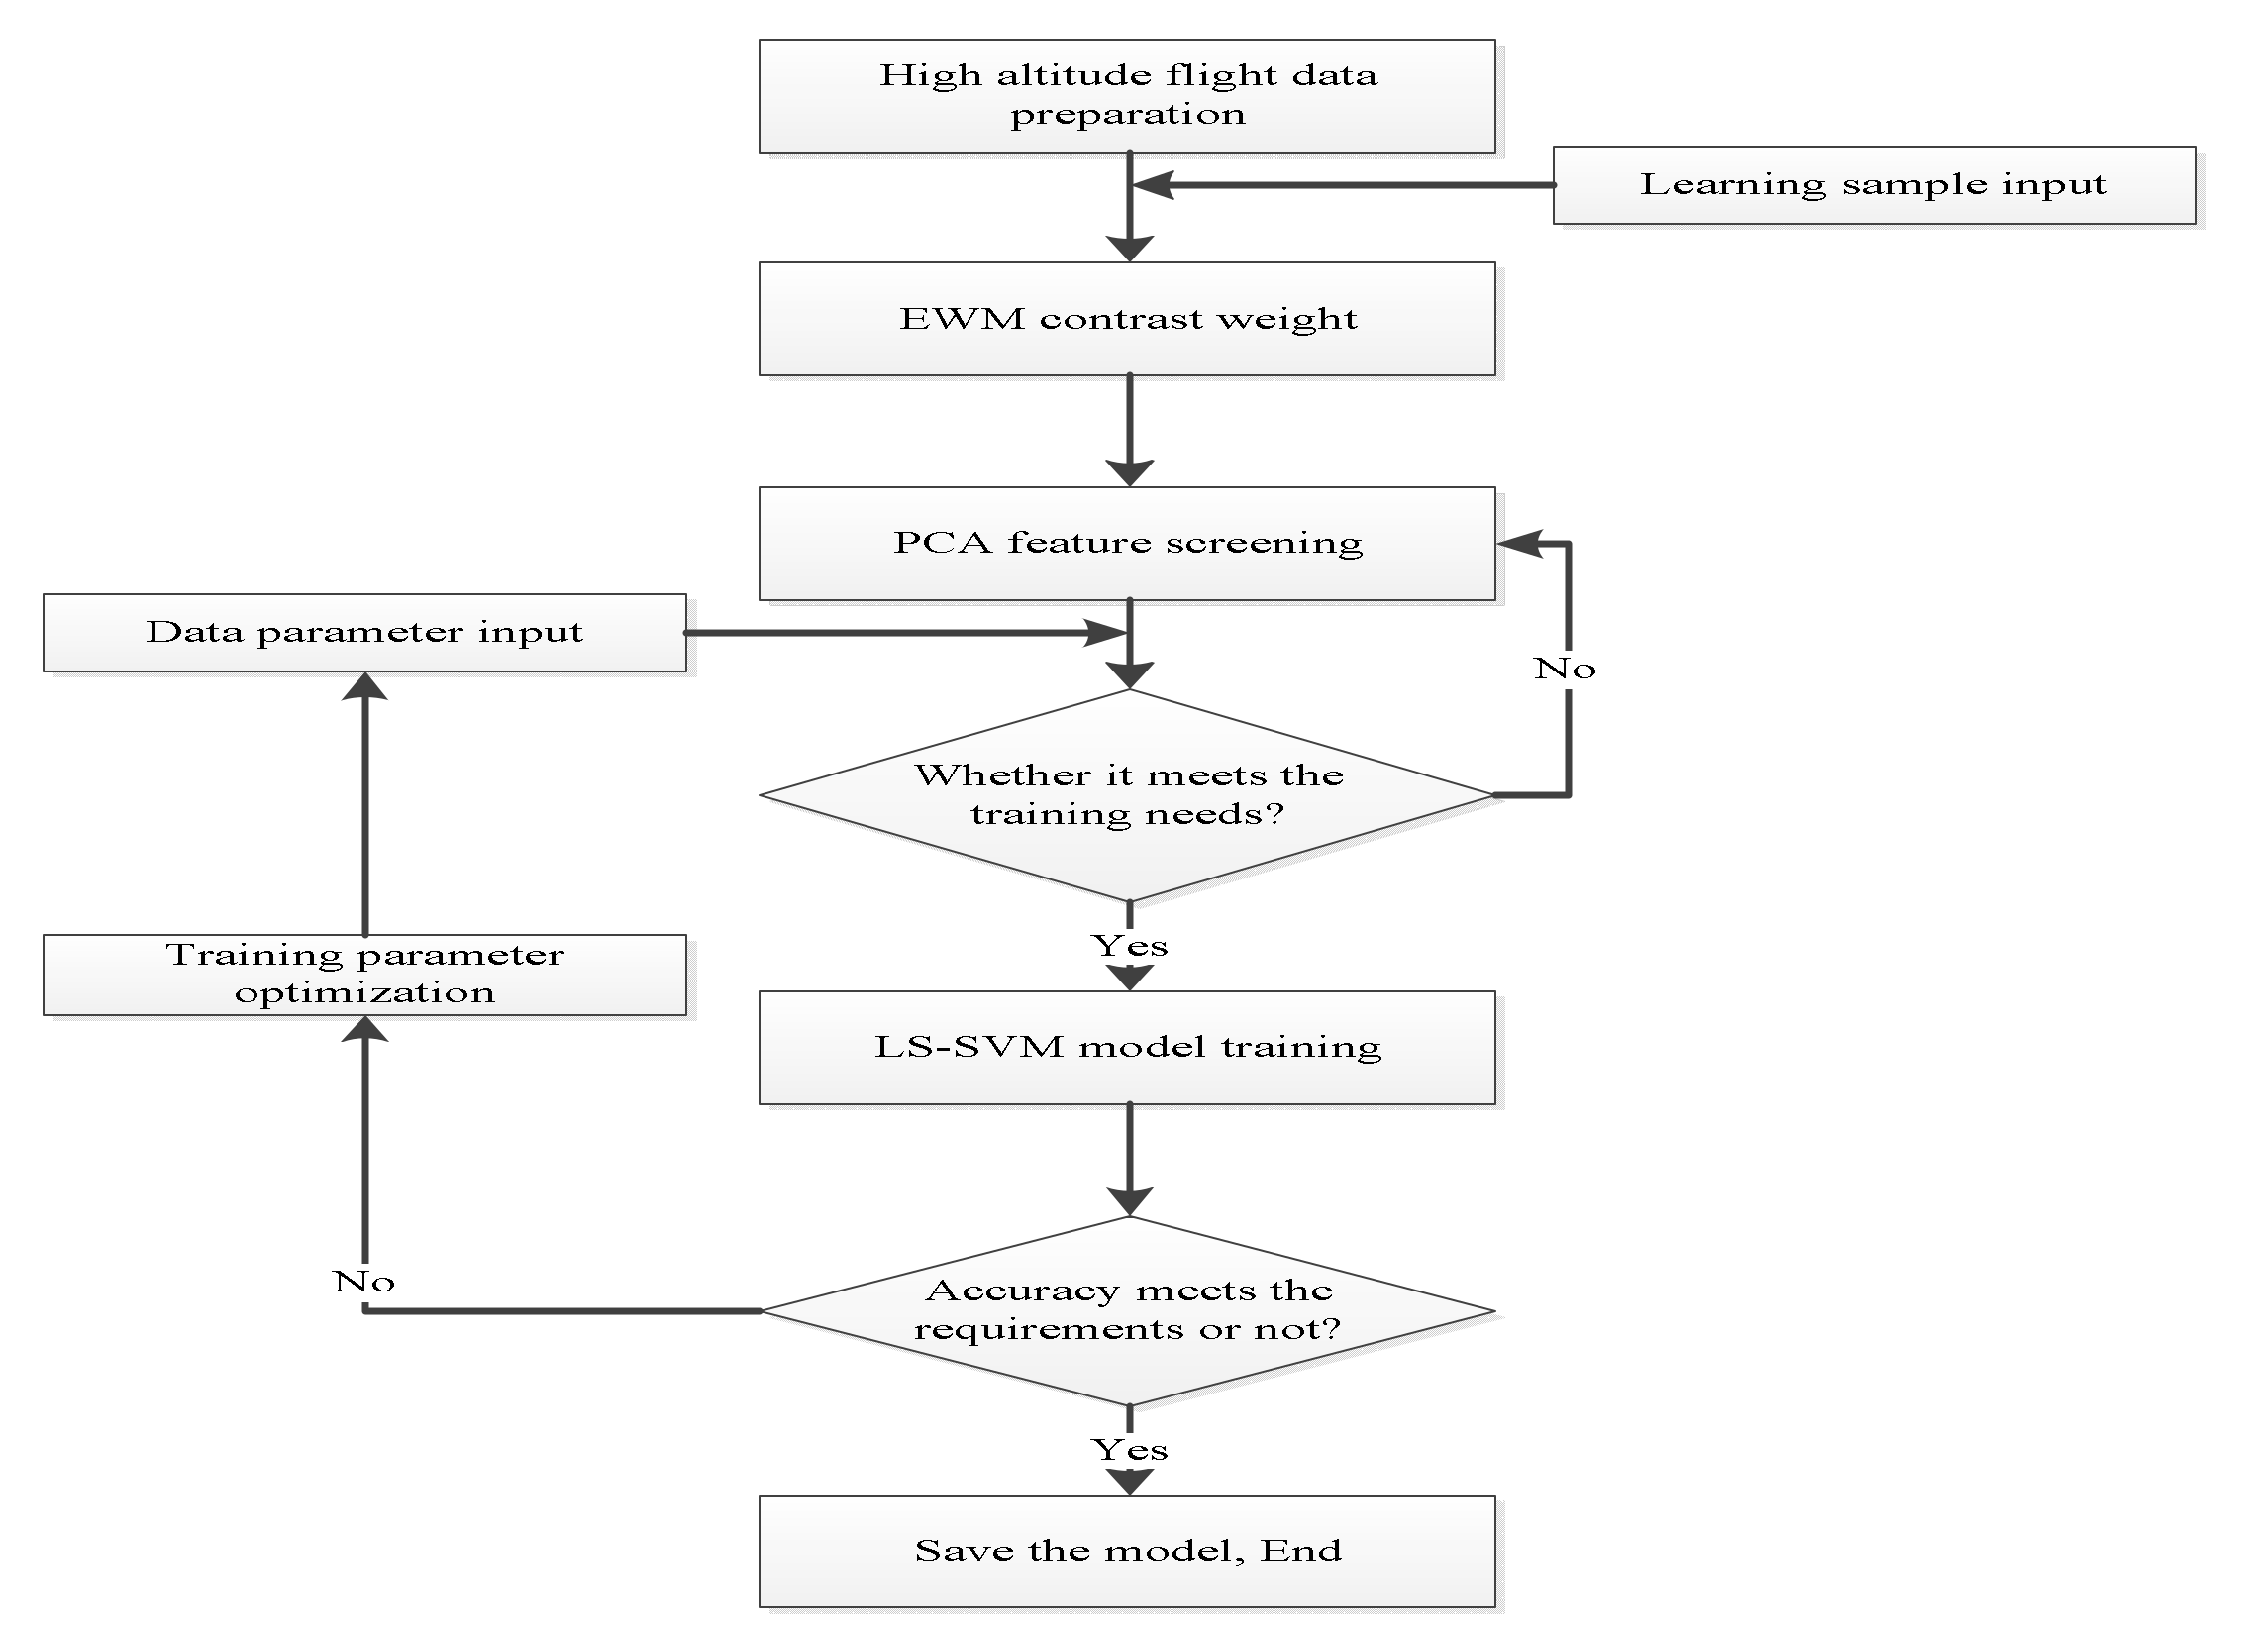
3.3. Algorithm Flow
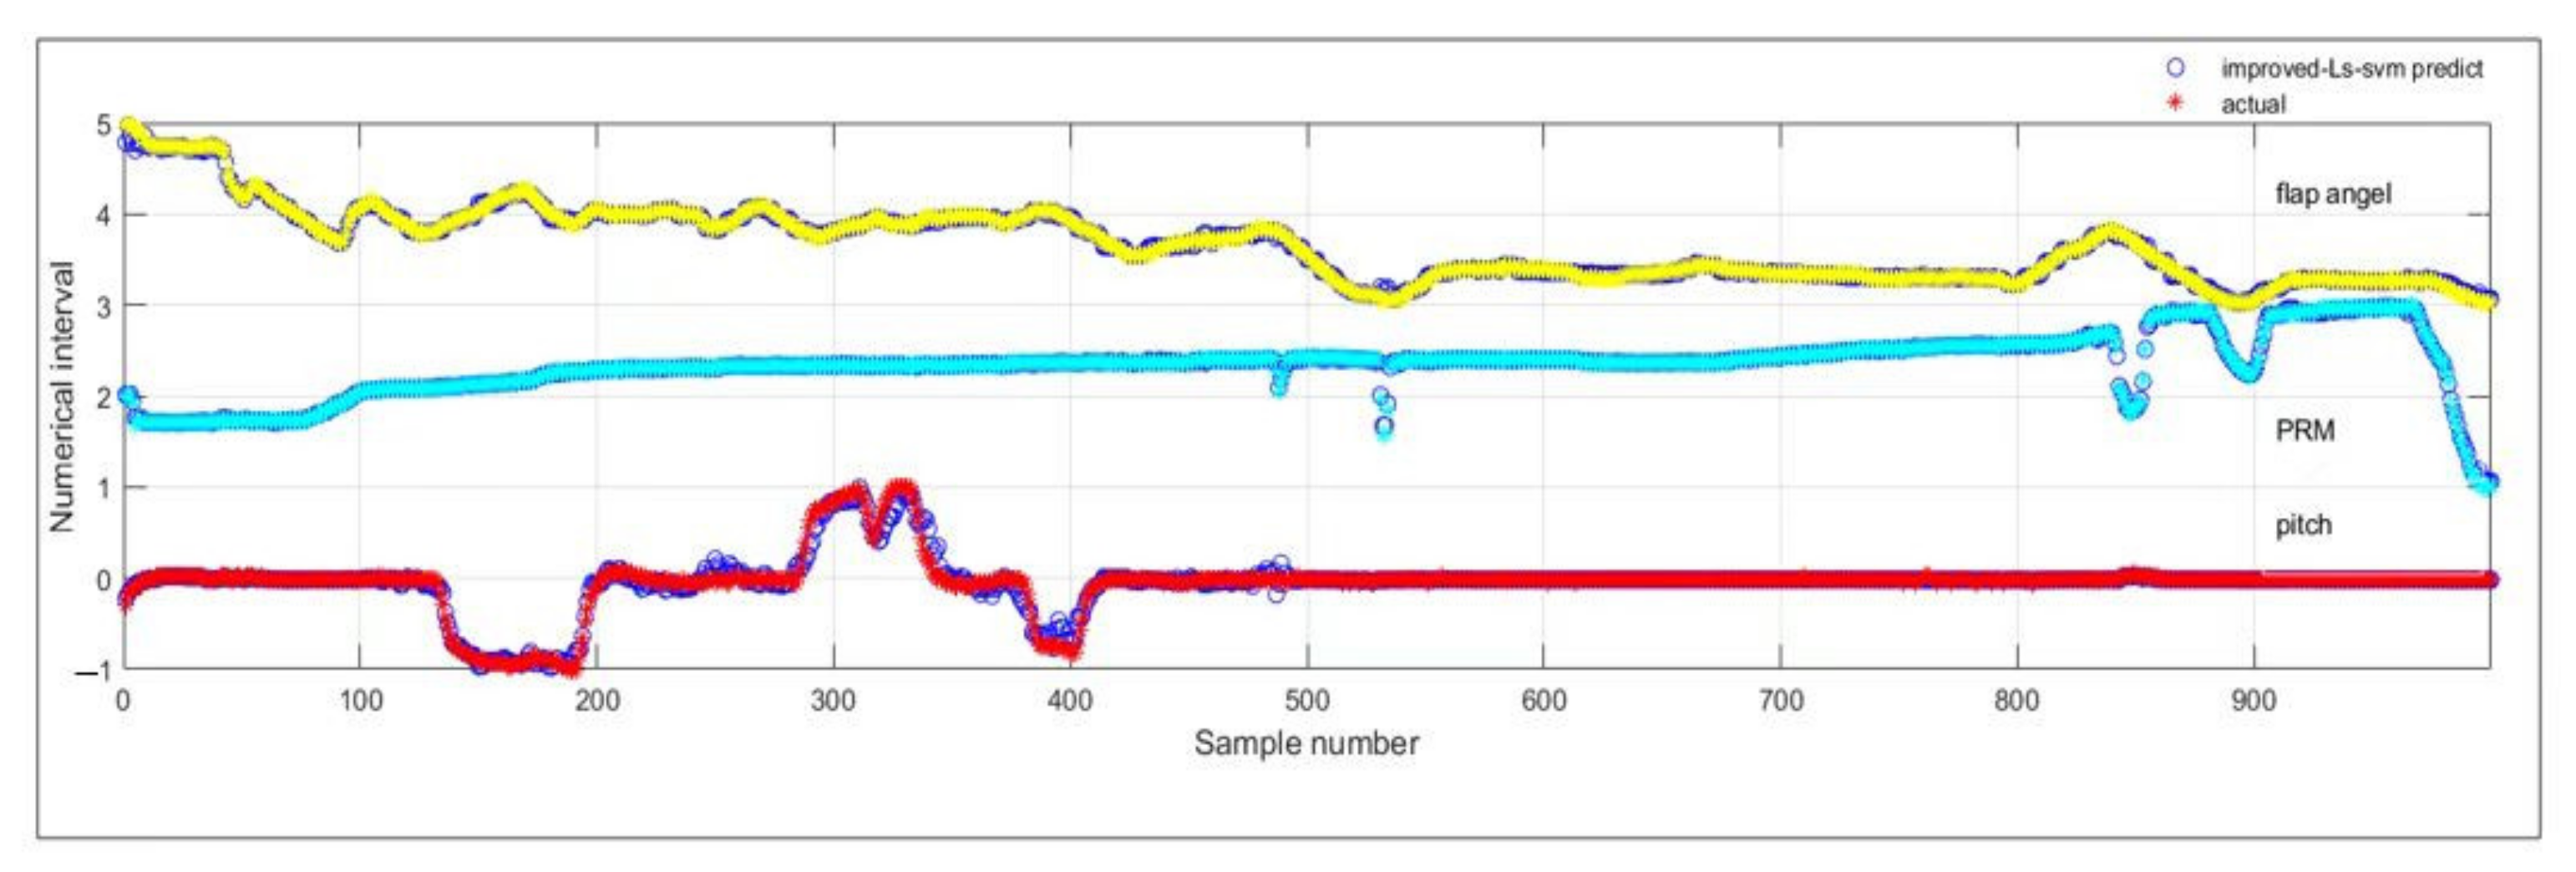
3.4. Simulation Application
4. Simulation and Discussion
5. Conclusions
Author Contributions
Funding
Data Availability Statement
Acknowledgments
Conflicts of Interest
References
- Xu, J.C.; Sun, Y.C. Airworthiness requirement of transportation category aircraft operation on high plateau airports. Aeronaut. Comput. Tech. 2018, 48, 133–138. [Google Scholar]
- Feng, Y.W.; Pan, W.H.; Lu, C. Research on Operation Reliability of Aircraft Power Plant Based on Ma-chine Learning. Acta Aeronaut. Astronaut. Sin. 2021, 42, 524732. [Google Scholar] [CrossRef]
- Ye, B.J.; Bao, X.; Liu, B. Machine learning for aircraft approach time prediction. Acta Aeronaut. Astronaut. Sin. 2020, 41, 359–370. [Google Scholar]
- Fang, G.C.; Jia, D.P.; Liu, Y.F. Military airplane health assessment technique based on data mining of flight parameters. Acta Aeronaut. Astronaut. Sin. 2020, 41, 296–306. [Google Scholar]
- Liu, J.Y.; Wang, D.Q.; Cui, J.W. Research on classification of screw locking results based on improved kernel LS-SVM algorithm. Ind. Instrum. Autom. 2020, 4, 12–15. [Google Scholar]
- Li, S.; Wang, Y.; Xue, Z.L. Grounding resistance monitoring data regression prediction method based on LS-SVM. Foreign Electron. Meas. Technol. 2019, 8, 19–22. [Google Scholar]
- Wu, H.; Li, B.W.; Zhao, S.F.; Yang, X.; Song, H. Research on initial installed power loss of a certain type of turbo-shaft engine using data mining and statistical approach. Math. Probl. Eng. 2018, 2018, 9412350. [Google Scholar] [CrossRef]
- Puranik, T.G.; Mavris, D.N. Anomaly detection in general-aviation operations using energy metrics and flight-data records. J. Aeros. Comp. Inf. Com. 2018, 15, 22–253. [Google Scholar] [CrossRef]
- Puranik, T.G.; Rodriguez, N.; Mavris, D.N. Towards online prediction of safety-critical landing metrics in aviation using supervised machine learning. Transp. Res. Part C Emerg. Technol. 2020, 120, 102819. [Google Scholar] [CrossRef]
- Yildirim, M.T.; Kurt, B. Aircraft gas turbine engine health monitoring system by real flight data. Int. J. Aerospace Eng. 2018, 2018, 9570873. [Google Scholar] [CrossRef] [Green Version]
- Yildirim, M.T.; Kurt, B. Confidence interval prediction of ANN estimated LPT parameters. Aircr. Eng. Aerosp. Technol. 2019, 9, 101–106. [Google Scholar] [CrossRef]
- Martín, F.J.V.; Sequera, J.L.C.; Huerga, M.A.N. Using data mining techniques to discover patterns in an airline’s flight hours assignments. Int. J. Data. Warehous. 2017, 13, 45–62. [Google Scholar] [CrossRef]
- Davison Reynolds, H.J.; Lokhande, K.; Kuffner, M.; Yenson, S. Human–Systems integration design process of the air traffic control tower flight data manager. J. Cogn. Eng. Decis. Mak. 2013, 7, 273–292. [Google Scholar] [CrossRef]
- Kumar, A.; Ghosh, K. GPR-based novel approach for non-linear aerodynamic modeling from flight data. Aeronaut. J. 2019, 123, 79–92. [Google Scholar] [CrossRef]
- Lan, C.E.; Wu, K.Y.; Yu, J. Flight characteristics analysis based on QAR data of a jet transport during landing at a high-altitude airport. Chin. J. Aeronaut. 2012, 25, 13–24. [Google Scholar] [CrossRef] [Green Version]
- Oehling, J.; Barry, D.J. Using machine learning methods in airline flight data monitoring to generate new operational safety knowledge from existing data. Saf. Sci. 2019, 114, 89–104. [Google Scholar] [CrossRef]
- Walker, G. Redefining the incidents to learn from: Safety science insights acquired on the journey from black boxes to flight data monitoring. Saf. Sci. 2017, 99, 14–22. [Google Scholar] [CrossRef]
- Deng, W.; Li, Z.; Li, X.; Chen, H.; Zhao, H. Compound fault diagnosis using optimized MCKD and sparse representation for rolling bearings. IEEE Trans. Instrum. Meas. 2022, 71, 1–9. [Google Scholar] [CrossRef]
- Cui, H.; Guan, Y.; Chen, H. Rolling element fault diagnosis based on VMD and sensitivity MCKD. IEEE Access 2021, 9, 120297–120308. [Google Scholar] [CrossRef]
- Wang, L.; Ren, Y.; Wu, C.X. Effects of flare operation on landing safety: A study based on ANOVA of real flight data. Saf. Sci. 2018, 102, 14–25. [Google Scholar] [CrossRef]
- Zhou, D.; Zhuang, X.; Zuo, H.; Wang, H.; Yan, H. Deep learning-based approach for civil aircraft for civil aircraft hazard identification and prediction. IEEE Access 2020, 8, 103665–103683. [Google Scholar] [CrossRef]
- Cheng, S.L.; Gao, Z.H.; Zhu, X.Q. Unsteady aerodynamic modelling of unstable dynamic process. Acta Aeronaut. Astronaut. Sin. 2020, 41, 238–249. [Google Scholar]
- Li, M.; Wu, C. A distance model of intuitionistic fuzzy cross entropy to solve preference problem on alternatives. Math. Probl. Eng. 2016, 2016, 8324124. [Google Scholar] [CrossRef] [Green Version]
- Zhang, X.; Wang, H.; Du, C.; Fan, X.; Cui, L.; Chen, H.; Deng, F.; Tong, Q.; He, M.; Yang, M.; et al. Custom-molded offloading footwear effectively prevents recurrence and amputation, and lowers mortality rates in high-risk diabetic foot patients: A multicenter, prospective observational study. Diabetes Metab. Syndr. Obes. Targets Ther. 2022, 15, 103–109. [Google Scholar] [CrossRef] [PubMed]
- Zhu, Y.; Deng, B.; Huo, Z. Key deviation source diagnosis for aircraft structural component assembly driven by small sample inspection data. China Mech. Eng. 2019, 30, 2725–2733. [Google Scholar]
- Gao, X.; Hou, J. An improved SVM integrated GS-PCA fault diagnosis approach of Tennessee Eastman process. Neurocomputing 2016, 174, 906–911. [Google Scholar] [CrossRef]
- Safaldin, M.; Otair, M.; Abualigah, L. Improved binary gray wolf optimizer and SVM for intrusion detection system in wireless sensor networks. J. Amb. Intel. Hum. Comp. 2021, 12, 1559–1576. [Google Scholar] [CrossRef]
- Abualigah, L.; Diabat, A.; Mirjalili, S.; Elaziz, M.A.; Gandomi, A.H. The arithmetic optimization algorithm. Comput. Methods Appl. Mech. Eng. 2021, 376, 113609. [Google Scholar] [CrossRef]
- Cai, J.; Bao, H.; Huang, Y.; Zhou, D. Risk identification of civil aviation engine control system based on particle swarm optimization-mean impact value-support vector machine. Proc. Inst. Mech. Eng. Part G J. Aerosp. Eng. 2022, in press. [Google Scholar] [CrossRef]
- Smart, E.; Brown, D.; Denman, J. Combining multiple classifiers to quantitatively rank the impact of abnormalities in flight data. Appl. Soft Comput. 2012, 12, 2583–2592. [Google Scholar] [CrossRef] [Green Version]
- Li, G.; Li, Y.; Chen, H.; Deng, W. Fractional-Order Controller for Course-Keeping of Underactuated Surface Vessels Based on Frequency Domain Specification and Improved Particle Swarm Optimization Algorithm. Appl. Sci. 2022, 12, 3139. [Google Scholar] [CrossRef]
- Deng, W.; Zhang, X.X.; Zhou, Y.Q.; Liu, Y.; Zhou, X.B.; Chen, H.L.; Zhao, H.M. An enhanced fast non-dominated solution sorting genetic algorithm for multi-objective problems. Inf. Sci. 2022, 585, 441–453. [Google Scholar] [CrossRef]
- Elisa, Q.M.; Lu, S.; Blazquez, C. Use of data imputation tools to reconstruct incomplete air quality datasets: A case-study in Temuco, Chile. Atmos. Environ. 2019, 200, 40–49. [Google Scholar]
- Hadeed, S.J.; O’Rourke, M.K.; Burgess, J.L.; Harris, R.B.; Canales, R.A. Imputation methods for addressing missing data in short-term monitoring of air pollutants. Sci. Total Environ. 2020, 730, 139140. [Google Scholar] [CrossRef]
- Liu, Z.J.; Wan, J.Q.; Ma, Y.W. Online prediction of effluent COD in the anaerobic wastewater treatment system based on PCA-LS-SVM algorithm. Environ. Sci. Pollut. Res. 2019, 26, 12828–12841. [Google Scholar] [CrossRef]
- Cheolmin, K.; Klabjan, D. A simple and fast algorithm for L1-norm Kernel PCA. IEEE Trans. Pattern Anal. Mach. Intell. 2019, 42, 1842–1855. [Google Scholar]


| Characteristics of Several | No Improve | Improve | Promotion |
|---|---|---|---|
| R2 | 0.991 | 0.9973 | 0.64% |
| The amount of data | 778284 | 169626 | 78.21% |
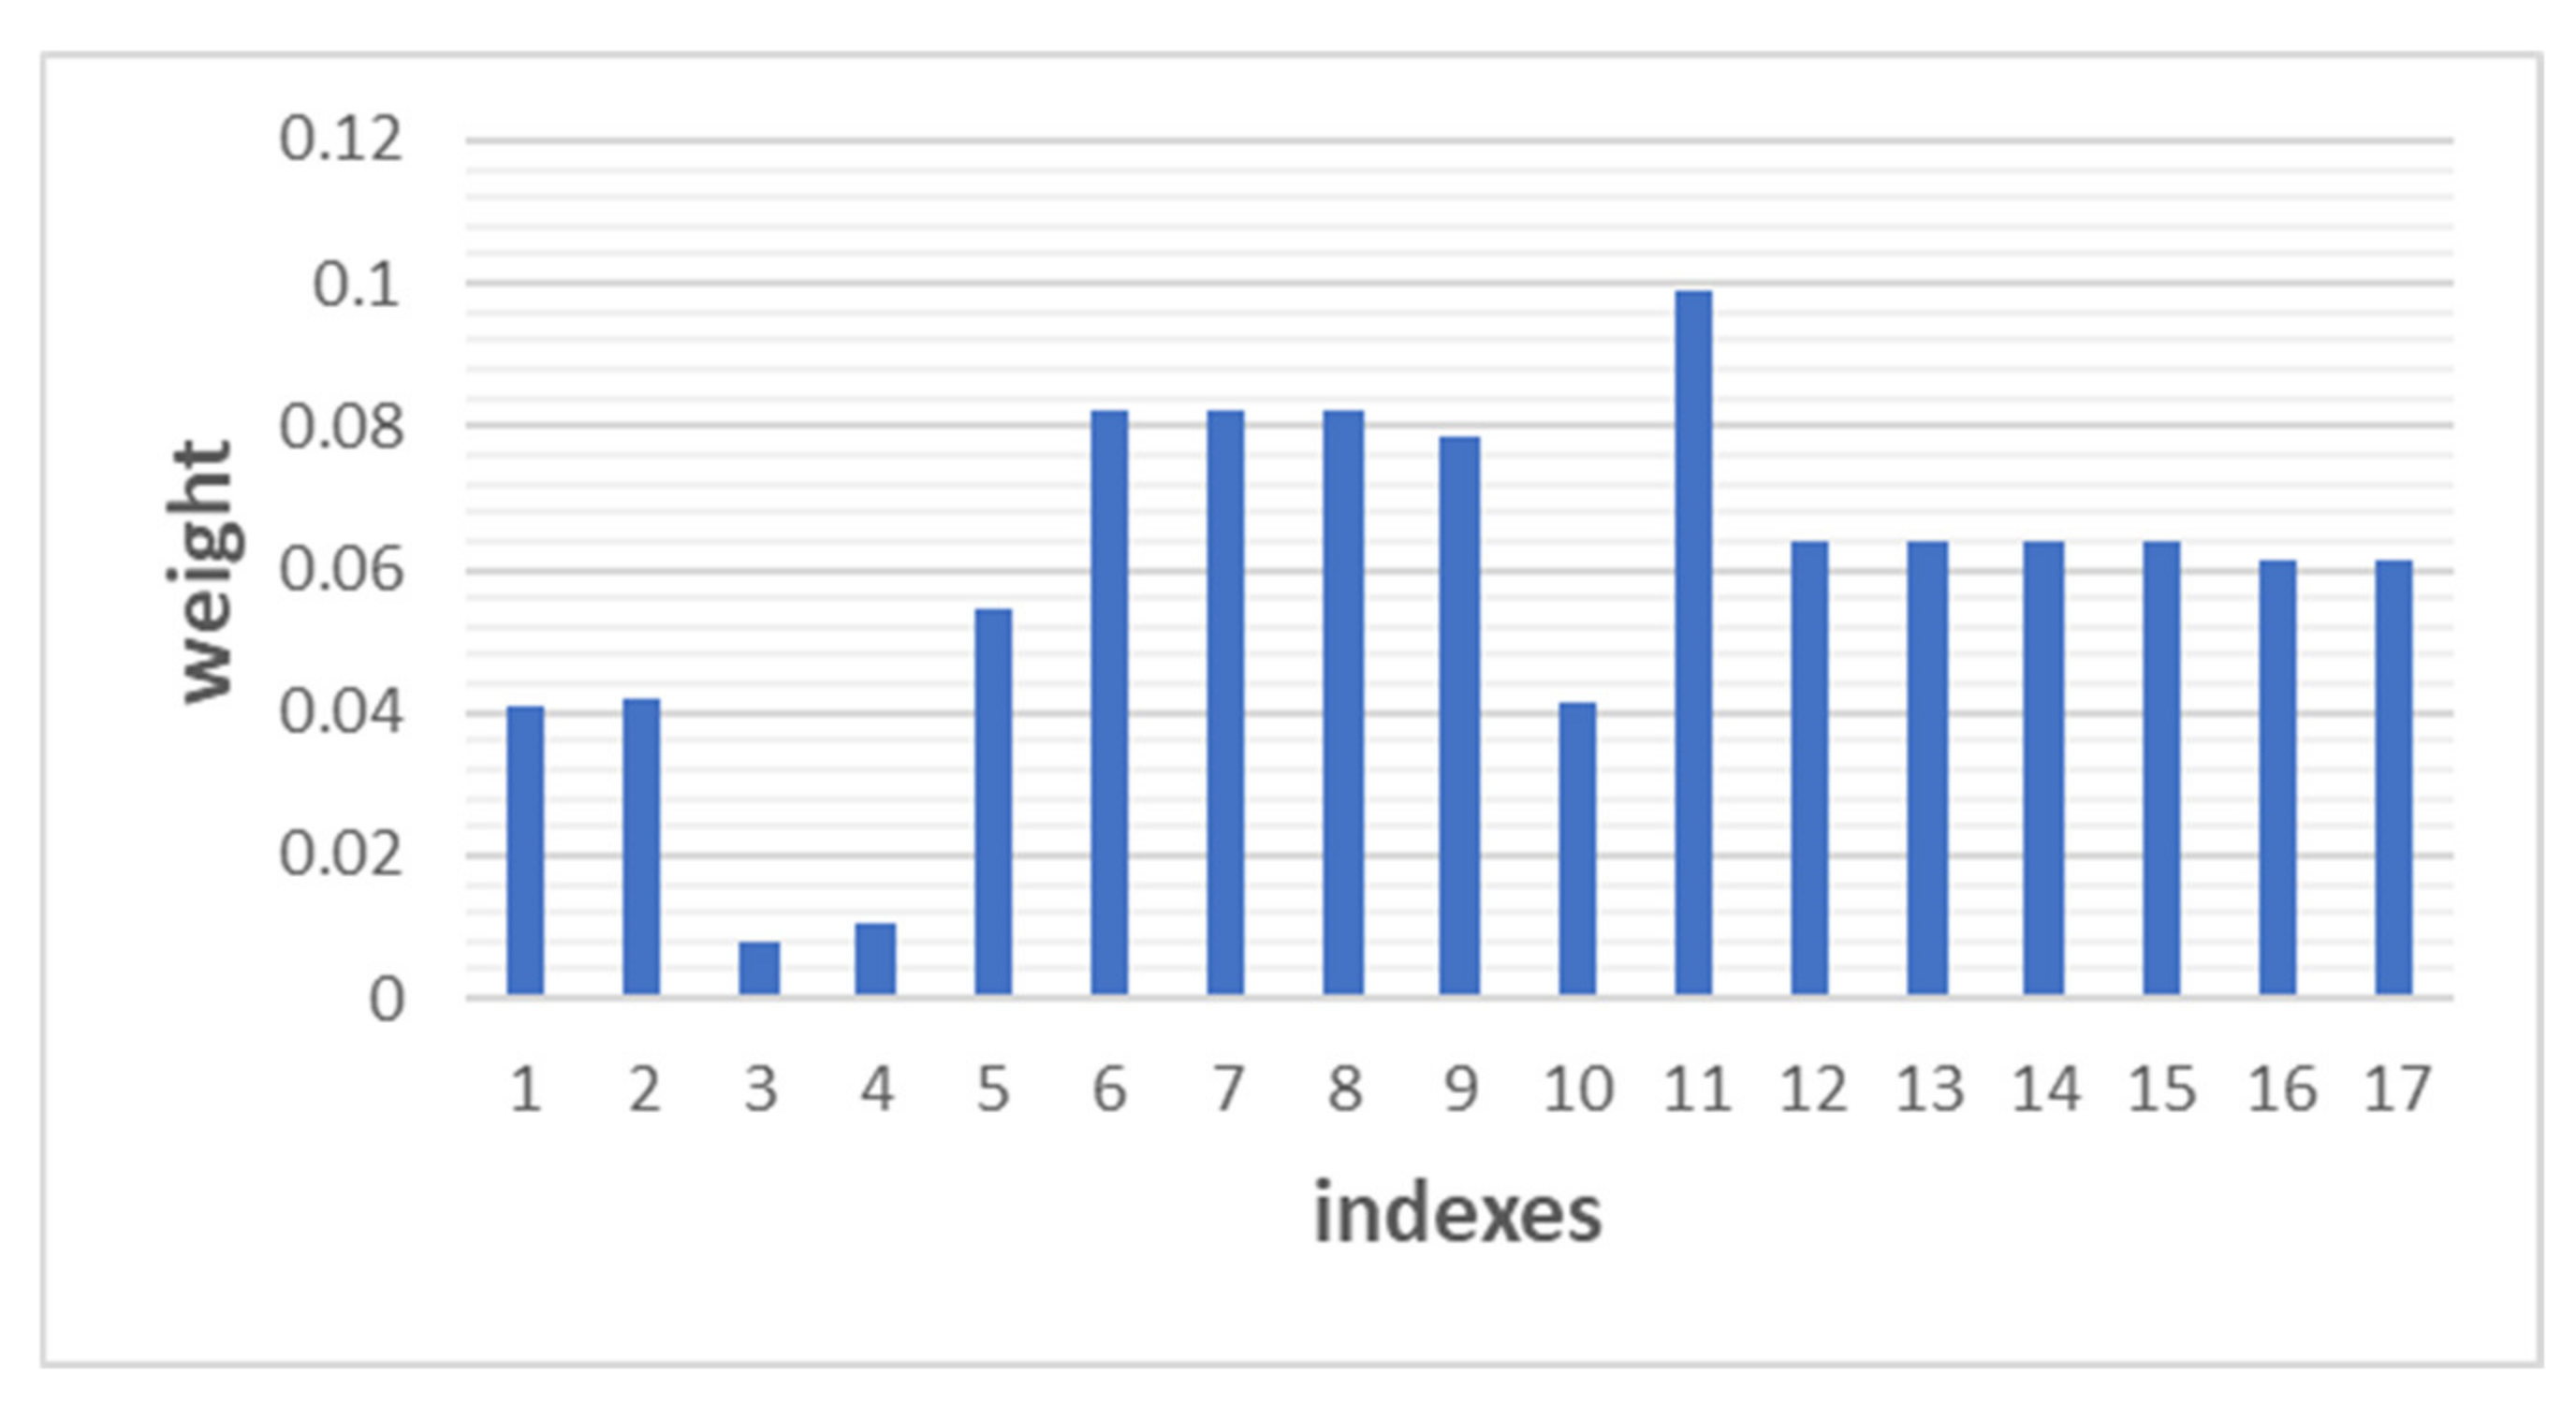
| Serial Number | Abbreviation | Name Connotation | Weight |
|---|---|---|---|
| 1 | N1_1 | Left engine speed | 0.041 |
| 2 | N1_2 | Right engine speed | 0.042 |
| 3 | N2_1 | Left engine power | 0.008 |
| 4 | N2_2 | Right engine power | 0.011 |
| 5 | FLIGHT_PHASE | Flight phase | 0.054 |
| 6 | GS1 | True ground speed | 0.082 |
| 7 | GS2 | Captain’s instrument displays ground speed | 0.083 |
| 8 | GS_FO | The co-pilot’s gauge shows ground speed | 0.082 |
| 9 | CAS | Calibrated air speed | 0.079 |
| 10 | DRIFT | Drift angle | 0.041 |
| 11 | TAS | True airspeed | 0.099 |
| 12 | PITCH11 | The captain’s instrument displays the pitch angle on the left side | 0.064 |
| 13 | PITCH12 | The captain’s instrument displays the pitch angle on the inner left side | 0.064 |
| 14 | PITCH21 | The captain’s instrument displays the pitch angle to the outer right | 0.064 |
| 15 | PITCH22 | The captain’s instrument displays the pitch angle on the inner right side | 0.064 |
| 16 | PITCH_DISP_FO1 | The assistant captain’s gauge shows the outer left side of the pitch angle | 0.061 |
| 17 | PITCH_DISP_FO2 | The assistant captain’s instrument displays the pitch angle on the inner left side | 0.061 |
| Pitch | MSE | MAE(%) | RMSE | EC |
|---|---|---|---|---|
| climb | −4.81 × 10⁻¹⁷ | 3.59% | 5.56 × 10⁻¹⁶ | 0.99 |
| approach | −5.15 × 10⁻¹⁶ | 7.70% | 5.95 × 10⁻¹⁵ | 0.99 |
| landing | −1.78 × 10⁻¹⁷ | 2.64% | 2.06 × 10⁻¹⁶ | 0.99 |
| N1 | MSE | MAE(%) | RMSE | EC |
| climb | −5.20 × 10⁻¹⁷ | 2.93% | 6.02 × 10⁻¹⁶ | 0.99 |
| approach | 3.89 × 10⁻¹⁷ | 7.43% | 4.51 × 10⁻¹⁶ | 0.99 |
| landing | 2.40 × 10⁻¹⁷ | 2.61% | 2.78 × 10⁻¹⁶ | 0.99 |
| Flap angle | MSE | MAE(%) | RMSE | EC |
| climb | −9.53 × 10⁻¹⁷ | 4.07% | 1.10 × 10⁻¹⁵ | 0.99 |
| approach | −5.15 × 10⁻¹⁶ | 9.00% | 0.99 | 0.99 |
| landing | 7.66 × 10⁻¹⁷ | 2.41% | 8.87 × 10⁻¹⁶ | 0.99 |
Publisher’s Note: MDPI stays neutral with regard to jurisdictional claims in published maps and institutional affiliations. |
© 2022 by the authors. Licensee MDPI, Basel, Switzerland. This article is an open access article distributed under the terms and conditions of the Creative Commons Attribution (CC BY) license (https://creativecommons.org/licenses/by/4.0/).
Share and Cite
Chen, N.; Sun, Y.; Wang, Z.; Peng, C. Improved LS-SVM Method for Flight Data Fitting of Civil Aircraft Flying at High Plateau. Electronics 2022, 11, 1558. https://doi.org/10.3390/electronics11101558
Chen N, Sun Y, Wang Z, Peng C. Improved LS-SVM Method for Flight Data Fitting of Civil Aircraft Flying at High Plateau. Electronics. 2022; 11(10):1558. https://doi.org/10.3390/electronics11101558
Chicago/Turabian StyleChen, Nongtian, Youchao Sun, Zongpeng Wang, and Chong Peng. 2022. "Improved LS-SVM Method for Flight Data Fitting of Civil Aircraft Flying at High Plateau" Electronics 11, no. 10: 1558. https://doi.org/10.3390/electronics11101558
APA StyleChen, N., Sun, Y., Wang, Z., & Peng, C. (2022). Improved LS-SVM Method for Flight Data Fitting of Civil Aircraft Flying at High Plateau. Electronics, 11(10), 1558. https://doi.org/10.3390/electronics11101558