Article

Reactive Voltage Control Strategy for PMSG-Based Wind Farm Considering Reactive Power Adequacy and Terminal Voltage Balance

1
College of Automation and College of Artificial Intelligence, Nanjing University of Posts and Telecommunications, Nanjing 210023, China
2
State Grid Wuxi Power Supply Co., Wuxi 214061, China
3
State Key Laboratory of Power Grid Security and Energy Conservation, China Electric Power Research Institute, Beijing 100192, China
*
Author to whom correspondence should be addressed.
Electronics 2022, 11(11), 1766; https://doi.org/10.3390/electronics11111766
Submission received: 1 May 2022 / Revised: 27 May 2022 / Accepted: 28 May 2022 / Published: 2 June 2022
(This article belongs to the Special Issue Networked Control Systems: Trends and Technique)

Abstract

:
To improve the ability of the power system to accommodate high penetration wind power, wind turbines (WTs) need to realize the mode transformation from grid-following to grid-forming, thus actively participating in the voltage regulation of the power grid with a high proportion of wind power. In this work, a reactive voltage control strategy for wind farms considering reactive power adequacy and terminal voltage balance is proposed. Firstly, the expression of the maximum reactive power regulation capacity of WT, namely reactive power adequacy, is derived under the complete wind condition based on the mathematical model and operating characteristics of WT, to study the influence of wake effect on reactive power adequacy of a wind farm. Then, the point of common coupling (PCC) voltage and terminal voltage are expressed analytically based on the radiative topology equivalent model of a wind farm, to analyze the influence of electrical distance on active power loss of wind farm. Finally, the calculation method of the adaptive gain coefficient of WT is put forward, which comprehensively considers the input wind speed and the electrical distance, to regulate the PCC voltage and terminal voltage simultaneously. The comprehensive effectiveness of the proposed strategy is demonstrated on a permanent magnet synchronous generator (PMSG)-based wind farm integration simulation model. While supporting the PCC voltage, the proposed strategy maintains the balance of the terminal voltage in the wind farm, thereby improving the friendliness of wind power grid connection.

1. Introduction

Influenced by the fluctuation and intermittency of wind speed, the voltage stability problem of the power system with a high proportion of wind power is becoming more and more serious, which has become the critical factor affecting the safe and stable operation of the power grid [1]. Large-scale wind farms are often connected to the end of the power grid, far away from the load center, and the power grid is not capable of supporting the point of common connection (PCC) voltage of wind farms [2]. To maintain the PCC voltage stability of wind farms, a large amount of reactive power is needed [3]. There have been a large number of studies and reports on the voltage stability of the PCC of wind farms, mainly focusing on the coordinated control of reactive power among various reactive compensation devices and the joint management of reactive power among WTs. Relevant studies are summarized in Table 1.
The use of an external reactive power compensation device to control the reactive power voltage of wind farms has achieved a good control effect in practice [4,5,6]. VAR compensator mainly includes a capacitor, on-load tap changers (OLTC), static var compensator (SVC), and static var synchronous (SVG). In reference [7], the reactive power output of SVC, SVG, and OLTC is distributed hierarchically and optimally based on the model predictive control considering their response speed to ensure that the PCC voltage can be restored to a feasible range after being disturbed. Reference [8] first uses the fast and dynamic reactive power compensation device such as SVG to compensate for the fluctuation of the PCC voltage. After the disturbance is eliminated, the fast and active reactive power compensation device is replaced by the slow and static reactive power such as the capacitor. Thereby, the reserve capacity of rapid and dynamic reactive power in the farm is maximized to deal with the occurrence of the next disturbance. The above research also shows that capacitors and OLTC are slow in voltage regulation and cannot meet the needs of fast reactive power compensation of the system. However, the cost of configuration and use of short reactive power compensation devices such as SVC and SVG is high, so the application scale is limited [9].
At present, variable-speed constant-frequency WTs such as doubly-fed induction generators (DFIG) and permanent magnet synchronous generators (PMSG) as the reactive power source of wind farms to provide reactive power compensation has become the consensus of research [10,11,12]. Therefore, the reactive power regulation capability of the WTs needs to be further considered. Reference [13] analyzes the reactive power regulation limit of DFIG and comprehensively utilizes the reactive power regulation capabilities of SVC and DFIG to meet the reactive power demand of the PCC. Reference [14] proposed a coordinated power control strategy for the PMSG-based wind farm that adjusts the pitch angle of the WT to reduce the active power output and increase the reactive power output, which can effectively maintain the stability of the PCC voltage under significant disturbances. Reference [15] further studied the mechanism of the active power output by the wind farm on the reactive power adequacy of the wind farm. It proposed a multi-time scale active and reactive power coordinated control strategy, which adjusted and allocated the dynamic power of the wind farm in advance according to the wind speed forecast and reactive power. The results show that the proposed strategy can significantly suppress the influence of wind speed changes on the voltage fluctuation of the PCC and maximize the economic benefits of the system. However, the studies mentioned above often focus on the voltage control at the PCC of the wind farm or the voltage control of the cluster collection station. The root of the safe and stable operation of the wind farm after grid-connection lies in the interior of the wind farm [16]. Since large-scale wind farms often consist of dozens or even hundreds of WTs through the collection system, affected by factors such as the impedance of the feeder of the collection system, the voltage at the end of the feeder is too high, and it is straightforward to get off the grid at high voltage. Therefore, when studying the reactive voltage control strategy of a wind farm, it is necessary to consider further the balance of the terminal voltage in the farm. Reference [17] proposes a droop gain voltage control method for WTs, which inputs the terminal voltage deviation into the PI controller to adjust the reactive power output of the WTs. Reference [18] further proposes a droop gain controller that considers the communication delay and the changes in the external grid strength, to improve the closed-loop stability and reactive power utilization of WTs, thus enhancing the robustness of the controller. However, at present, the reactive power voltage controller of each WT converter often adopts a fixed droop gain. Improper droop gain setting will result in an unsatisfactory control effect of the PCC voltage and the terminal voltage. Given that a more considerable droop gain can ensure the improvement of the PCC voltage, it may cause the WT converter to reach the maximum operating limit often, increasing the terminal voltage difference and converter wear. A smaller droop gain can ensure the regular operation of the WT converter, but the improvement of the PCC voltage and the terminal voltage is limited.
Table 1. Previous papers’ proposed reactive methods.
research direction1. reactive power coordination control among various reactive power compensation devices2. reactive power coordinated control between wind turbines in wind farms3. wind turbine droop gain voltage control method
research method
(1)
hierarchical optimal control based on model predictive control [7]
(2)
slow, static reactive power replaces fast, dynamic reactive power [8]
(1)
tap the reactive power regulation potential of doubly-fed induction fans or permanent magnet direct-drive fans [13,14]
(2)
multi-time scale wind turbine active and reactive power coordinated control strategy [15]
(1)
controller with fixed droop gain [17]
(2)
droop gain controller considering communication delay [18]
advantages
(1)
good anti-interference performance (to ensure that the voltage of the grid connection point returns to the feasible range after being disturbed)
(2)
good anti-interference performance (increase the reserve capacity of fast dynamic reactive power in the field)
(1)
maximize fan utilization to maximize system economic benefits
(2)
significantly suppresses the effect of wind speed changes on voltage fluctuations at grid-connected points
(1)
input the terminal voltage deviation to the controller to adjust the reactive power output by the fan
(2)
improve the closed-loop stability and reactive power utilization of the fan, and enhance the robustness of the controller
defectsslow and static reactive power regulation speed is slow, while the device is high, and the application scale is limitedfocus on the voltage control of the wind farm grid connection point or the voltage control of the cluster collection station.fixed droop gain, improper gain setting will lead to unsatisfactory control effect of grid-connected point and terminal voltage
The research gap of this paper is reflected in the following three aspects:
(1)
Compared with the main research method 1 in Table 1, based on the mathematical model and operating characteristics of the fan, this paper deduces the expression of the maximum reactive power regulation capacity of the fan under full wind conditions, that is, the reactive power slack, so as to fully exploit the fan’s unavailability and work regulation potential.
(2)
Compared with the main research method 2 in Table 1, based on the equivalent model of wind farm radial topology, in this paper, the grid-connected voltage and terminal voltage of the wind farm are analytically expressed, and the key factors affecting the voltage stability of the grid-connected point and the balance of the terminal voltage are analyzed.
(3)
Compared with the main research method 3 in Table 1, this paper studies the adaptive adjustment of the droop gain coefficient of the wind turbine reactive power controller according to the reactive power slack of each wind turbine in the field and the electrical distance from the grid connection point. This makes it possible to maintain the balance of the terminal voltage in the field and reduce the active power loss in the field while supporting the voltage of the grid connection point with the spatiotemporal changes of the input wind speed and electrical distance.
Given the deficiencies of the above research, this paper proposes a reactive voltage control strategy for PMSG-based wind farms considering reactive power adequacy and terminal voltage balance, which can regulate the PCC voltage of wind farms while maintaining the balance of the terminal voltage in the farm. Due to its low maintenance cost, high operational reliability, and flexible converter control, PMSG has been widely used in the power system with wind power, which is an example for analyzing the comprehensive effectiveness of the proposed strategy. Firstly, the expression of the maximum reactive power regulation capacity of the WT, namely reactive power adequacy, is derived under the complete wind condition, to study the influence of the wake effect on the reactive power adequacy of the wind farm based on the mathematical model and operating characteristics of the WT. Then, the PCC voltage and terminal voltage are expressed analytically based on the radiative topology equivalent model of a wind farm. The key factors affecting the voltage stability of PCC and terminal voltage balance are analyzed. Finally, the reactive voltage gain coefficient of the WT is adjusted adaptively combined with the above two influences to deal with the disturbance of wind speed fluctuation and load disturbance.
The main contributions of this paper are mainly reflected in the following three aspects:
(1)
Combined with the difference in the spatial and temporal distribution of wind energy, the reactive power sufficiency of permanent magnet direct-drive wind turbines under full wind conditions is analyzed, and the influence of wake effect on the reactive power sufficiency of wind farms is studied.
(2)
Combined with the difference in the spatial distribution of wind farms, the voltage distribution characteristics of permanent magnet direct drive wind farms are deduced, and the influence of electrical distance on active power loss in wind farms is studied.
(3)
A reactive power and voltage control strategy with adaptive gain for permanent magnet direct-drive wind farms is proposed. According to the reactive power sufficiency of each wind turbine and its electrical distance from the grid-connected point, the reactive power and voltage gain coefficient of the wind turbine is adaptively set. The coefficient makes it change with the input wind speed and electrical distance in time and space, so as to reduce the influence of wind speed fluctuation and load mutation on the wind farm terminal voltage and grid-connected point voltage. Therefore, while supporting the voltage of the grid connection point, the balance of the terminal voltage in the field is maintained, to improve the friendliness of wind power grid connection.

2. Distribution Characteristics of Reactive Power and Voltage for the PMSG-Based Wind Farm

2.1. Reactive Power Adequacy of PMSG under the Complete Wind Condition

The basic structure of PMSG is shown in Figure 1, including a wind turbine, a permanent magnet synchronous generator, a full-power converter (machine-side and grid-side), and related control modules [19].
According to Baez theory [20], the output mechanical power of the WT is:
P m = 1 2 π R 2 ρ v 3 C p ( λ , β )
where Pm is the output mechanical power of the WT, R is the radius of the WT blade, ρ is the air density, v is the input wind speed, and Cp is the wind energy utilization coefficient. It is a function of the blade tip speed ratio λ and pitch angle β, and the approximate expression is as follows:
C p ( λ , β ) C p ( λ , β ) = 0.22 ( 116 λ i 0.4 β 5.0 ) e 12.5 λ i λ i = 1 / ( 1 λ + 0.08 β 0.035 β 3 + 1 )
where the λ is defined as:
λ = ω m R v
where ωm is the angular velocity of the WT.
Then, the characteristic curves of wind energy utilization coefficient Cp, blade tip speed ratio λ, and pitch angle β are shown in Figure 2.
It demonstrates that for any given pitch angle β, there is only one optimal blade tip speed ratio λopt, which can make the maximum wind energy utilization coefficient Cpmax. Combined with Equation (3), the optimal blade tip speed ratio that maximizes the wind energy utilization coefficient can be obtained by adjusting the pitch angle under different input wind speeds, to maximize the wind power captured by the WT.
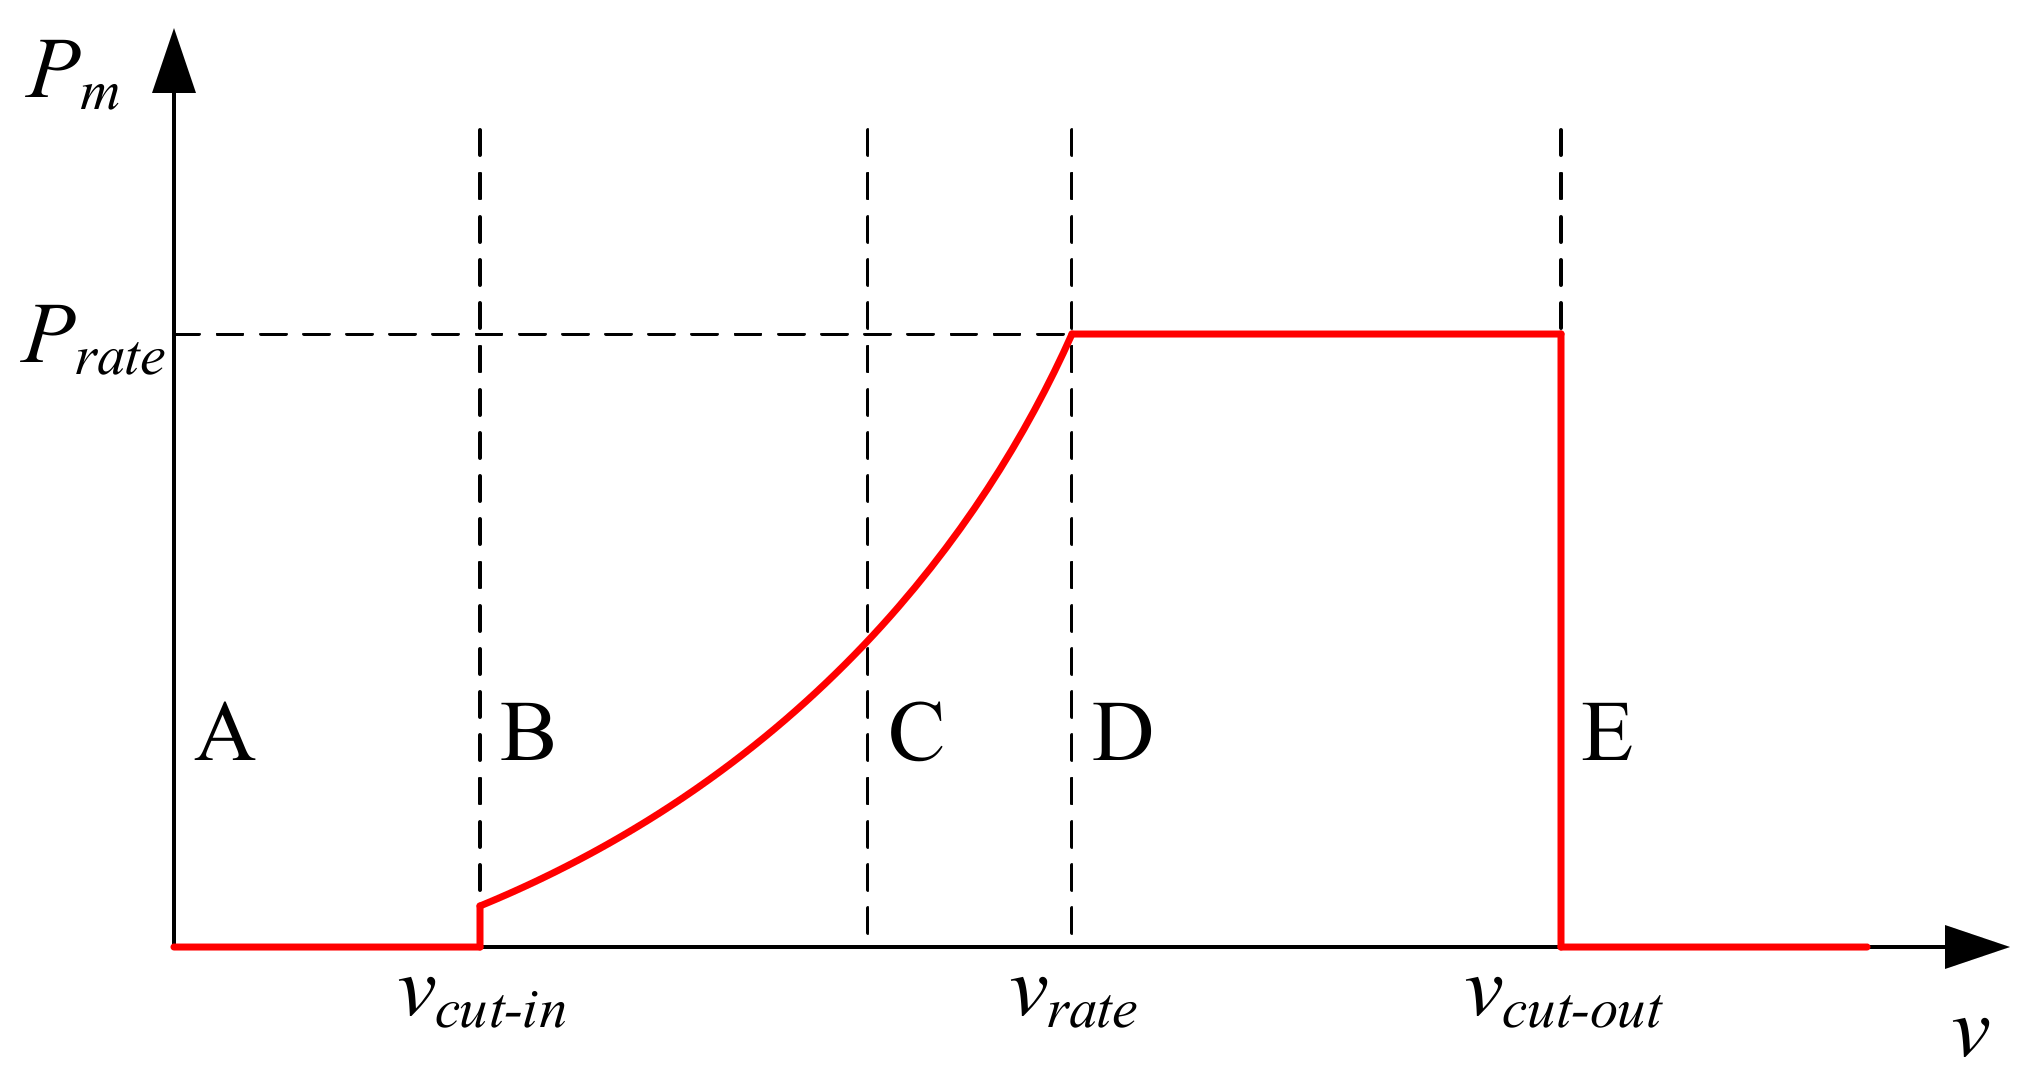
Therefore, the operation process of the WT can be divided into the following three stages: start-up stage, variable power output stage, and constant power output stage according to the wind speed, as shown in Figure 3 [21].
A~B is the start-up stage. Before starting, the WT is in a static state, and the pitch angle is maintained at 90°. Thus, the WT does not produce any torque. When the input wind speed gradually increases to the starting wind speed, the pitch angle gradually changes to 0°, and the WT begins to start. However, the output power of the WT is zero because the input wind speed is still low. When the input wind speed reaches the cut-in wind speed, the WT enters the variable power output stage.
B~D is the variable power output stage. In this stage, the grid-connected output power of WT has not reached the rated output power, which can be divided into the variable rotating speed operation stage and constant rotating speed operation stage. B~C is the variable rotating speed operation stage, and the maximum power point tracking (MPPT) control is adopted for the WT. Here, the output power of the WT can be expressed as:
P m = 1 2 π R 2 ρ C p max v 3 = k o p t v 3
where Kopt is the equivalent coefficient to obtain the maximum wind power, which is determined by the characteristics of the WT at different wind speeds.
When the speed of the PMSG rises to the rated rotate speed, the output power of the WT has not reached the rated capacity, and it will enter the constant rotate speed operation stage, that is, C~D. At this time, the WT will no longer carry out the MPPT control, but limit the rotation speed of the generator near the rated rotation speed.
D~E is the constant power output stage. The input wind speed is between the rated wind speed and the cut-out wind speed. The output power of the WT is kept constant through the pitch angle control. It cannot be increased without limit due to the limitations of electrical characteristics and physical characteristics.
After E, the input wind speed is greater than the cut-out wind speed. Usually, the pitch angle is adjusted to 90°, and the machine is stopped to protect the WT.
In summary, if the active power loss of the WT converter is neglected, the expression of the active power output PWT by the WT under the complete wind condition concerning the input wind speed v is:
P W T = 0 k o p t v 3 P r a t e 0 , v < v c u t - i n , v c u t - i n v v r a t e , v r a t e < v < v c u t - o u t , v v c u t - o u t
where vcut-in is the cut-in wind speed, vrate is the rated wind speed, vcut-out is the cut-out wind speed, and Prate is the rated active power of WT.
In this paper, the reactive power adequacy of PMSG is defined as the maximum reactive power regulation capacity of the WT, which is determined by the apparent power of the WT converter and the active power output by the WT. Combining the above Equation (5), the reactive power adequacy of PMSG is expressed as:
Q W T , a d e = ± S W T 2 P W T 2 = ± S W T , v < v c u t - i n S W T 2 k o p t 2 v 6 , v c u t i n v < v r a t e S W T 2 P r a t e 2 , v r a t e v < v c u t - o u t 0 , v v c u t - o u t
where SWT is the apparent power of the WT converter, and QWT,ade is the reactive power adequacy of the WT. When QWT,ade is more significant than zero, it means the WT output inductive reactive power, and when it is less than zero, it means the WT output capacitive reactive power. The reactive power output QWT by the WT needs to be limited to the range of reactive power adequacy QWT,ade, namely:
Q W T Q W T , a d e
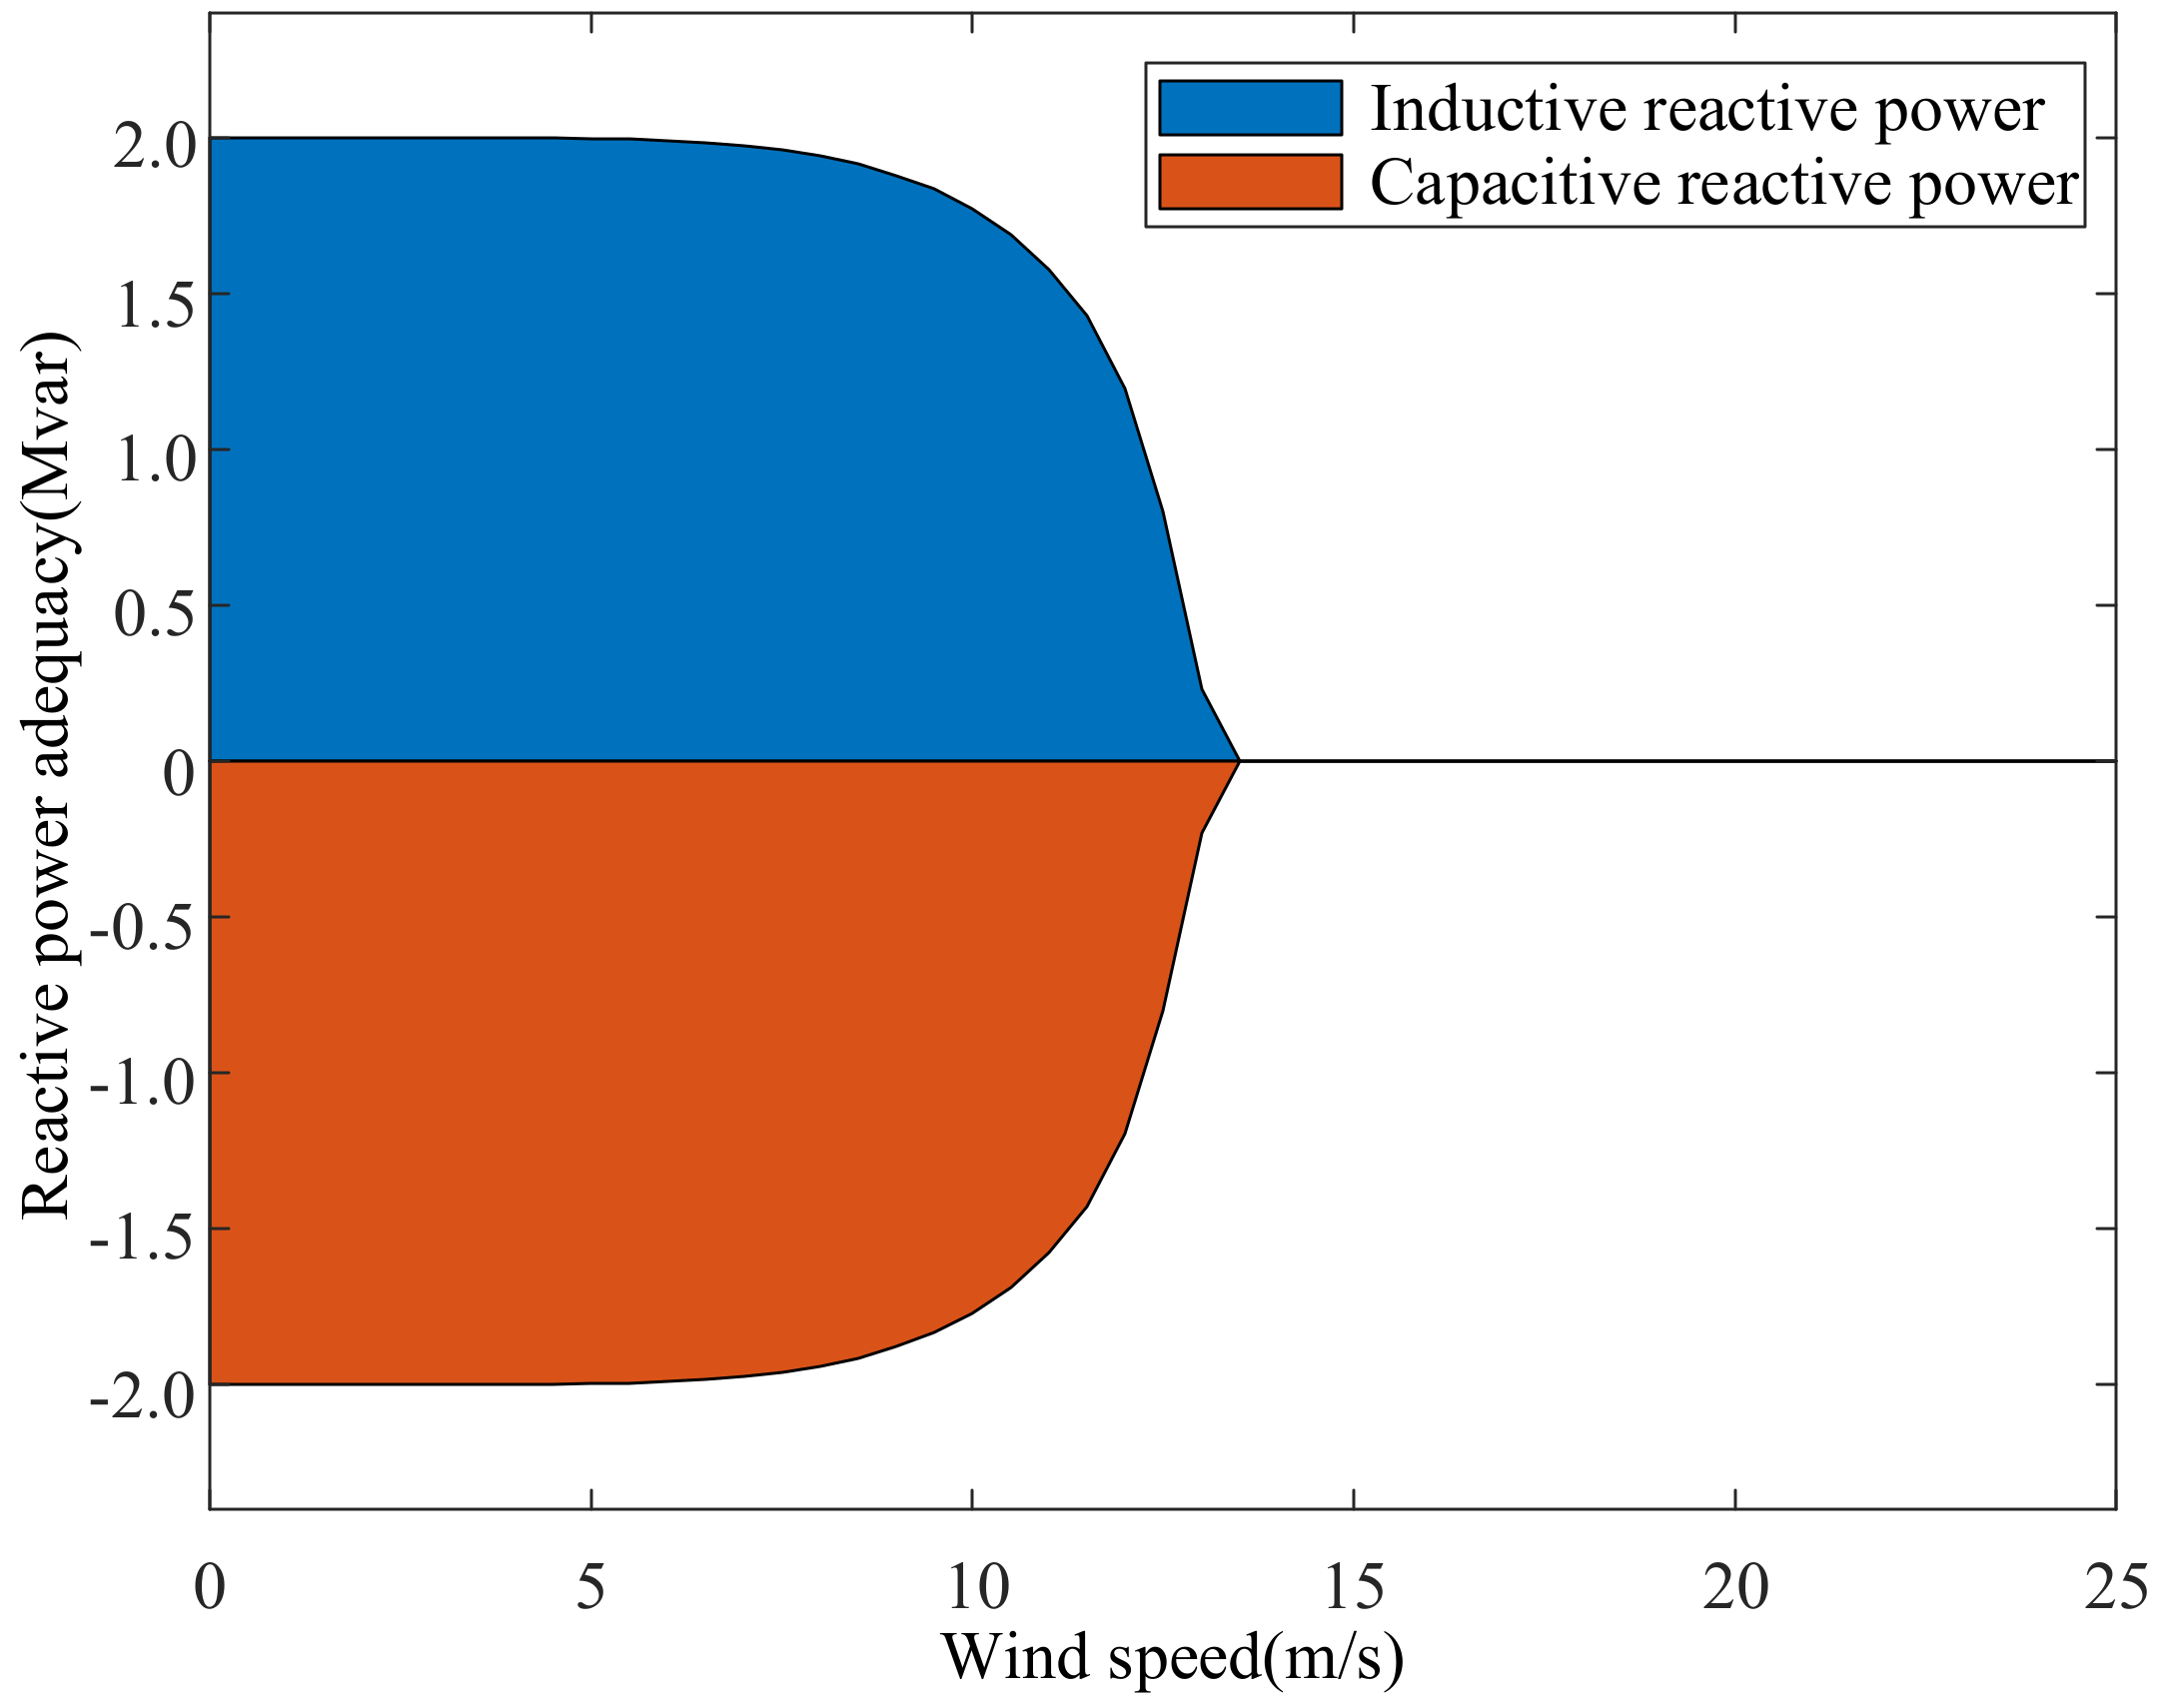
The relevant parameters of a 2MVA PMSG are shown in Table 2 [22]. When the cut-in wind speed, rated wind speed, and cut-out wind speed is 4 m/s, 13.2 m/s, and 22 m/s, respectively, the reactive power adequacy of the WT under the complete wind condition is shown in Figure 4.
Figure 4 states that when the input wind speed is low, the reactive power capacity range that WT can adjust is higher. Therefore, a WT with a low input wind speed has higher reactive power adequacy than a WT with a high input wind speed. When the input wind speed of WT is greater than or equal to the rated wind speed, if WT does not reduce the active power output, WT will not be able to output reactive power, and it will not have the ability to regulate voltage.

2.2. Distribution Characteristics of Voltage inside the PMSG-Based Wind Farm

A single WT has a small capacity, and a large wind farm is usually formed by multiple WTs through a collection system. Among them, the collection system of a PMSG-based wind farm is mainly a radial structure, as shown in Figure 5a, composed of n feeders, each of which is connected in series with m series of WTs [23]. Thus, there is n × m WTs in total. The WT is boosted by a 0.69/35 kV box-type transformer and connected to the feeder. After the feeder is collected, it is connected to the low-voltage side of the main transformer. Finally, it is boosted by the 35/230 kV main transformer and merged into the power grid. Among them, the serial number of column j (1 ≤ j ≤ m) WT on the i-th (1 ≤ i ≤ n) feeder line is WTij, and the box-type transformer serial number of this WT is Tij. The equivalent model of Figure 5a after unitization is shown in Figure 5b.The impedance values are shown in Table 3.
In Figure 5b, PWTij and QWTij are the active and reactive power output by the WTij. The low-voltage side voltage of the box-type transformer Tij is UWTijL, and the high-voltage side voltage of the box-type transformer Tij is UWTijH. Assuming that the equivalent impedances of all WTs’ box-type transformers are equal, set to Zt = Rt + jXt. Assuming that the distances between adjacent WTs are equal, the equivalent impedance of lines between adjacent WTs can be set to Zl = Rl + jXl. The low-voltage side PCC voltage of the wind farm is UPCCL, the equivalent impedance of the main transformer is set to ZT = RT + jXT, the PCC voltage is UPCC, the power grid voltage is U, and the equal impedance of the transmission line between the wind farm and the power grid is Zk = Rk + jXk.
Taking the power grid voltage U as the reference and ignoring the horizontal component of the voltage drop, the wind farm PCC voltage UPCC can be expressed as:
U P C C = U + i = 1 n j = 1 m P W T i j Δ P R k + i = 1 n j = 1 m Q W T i j Δ Q X k U
where ΔP and ΔQ are the sums of active power loss and reactive power loss in the wind farm, respectively.
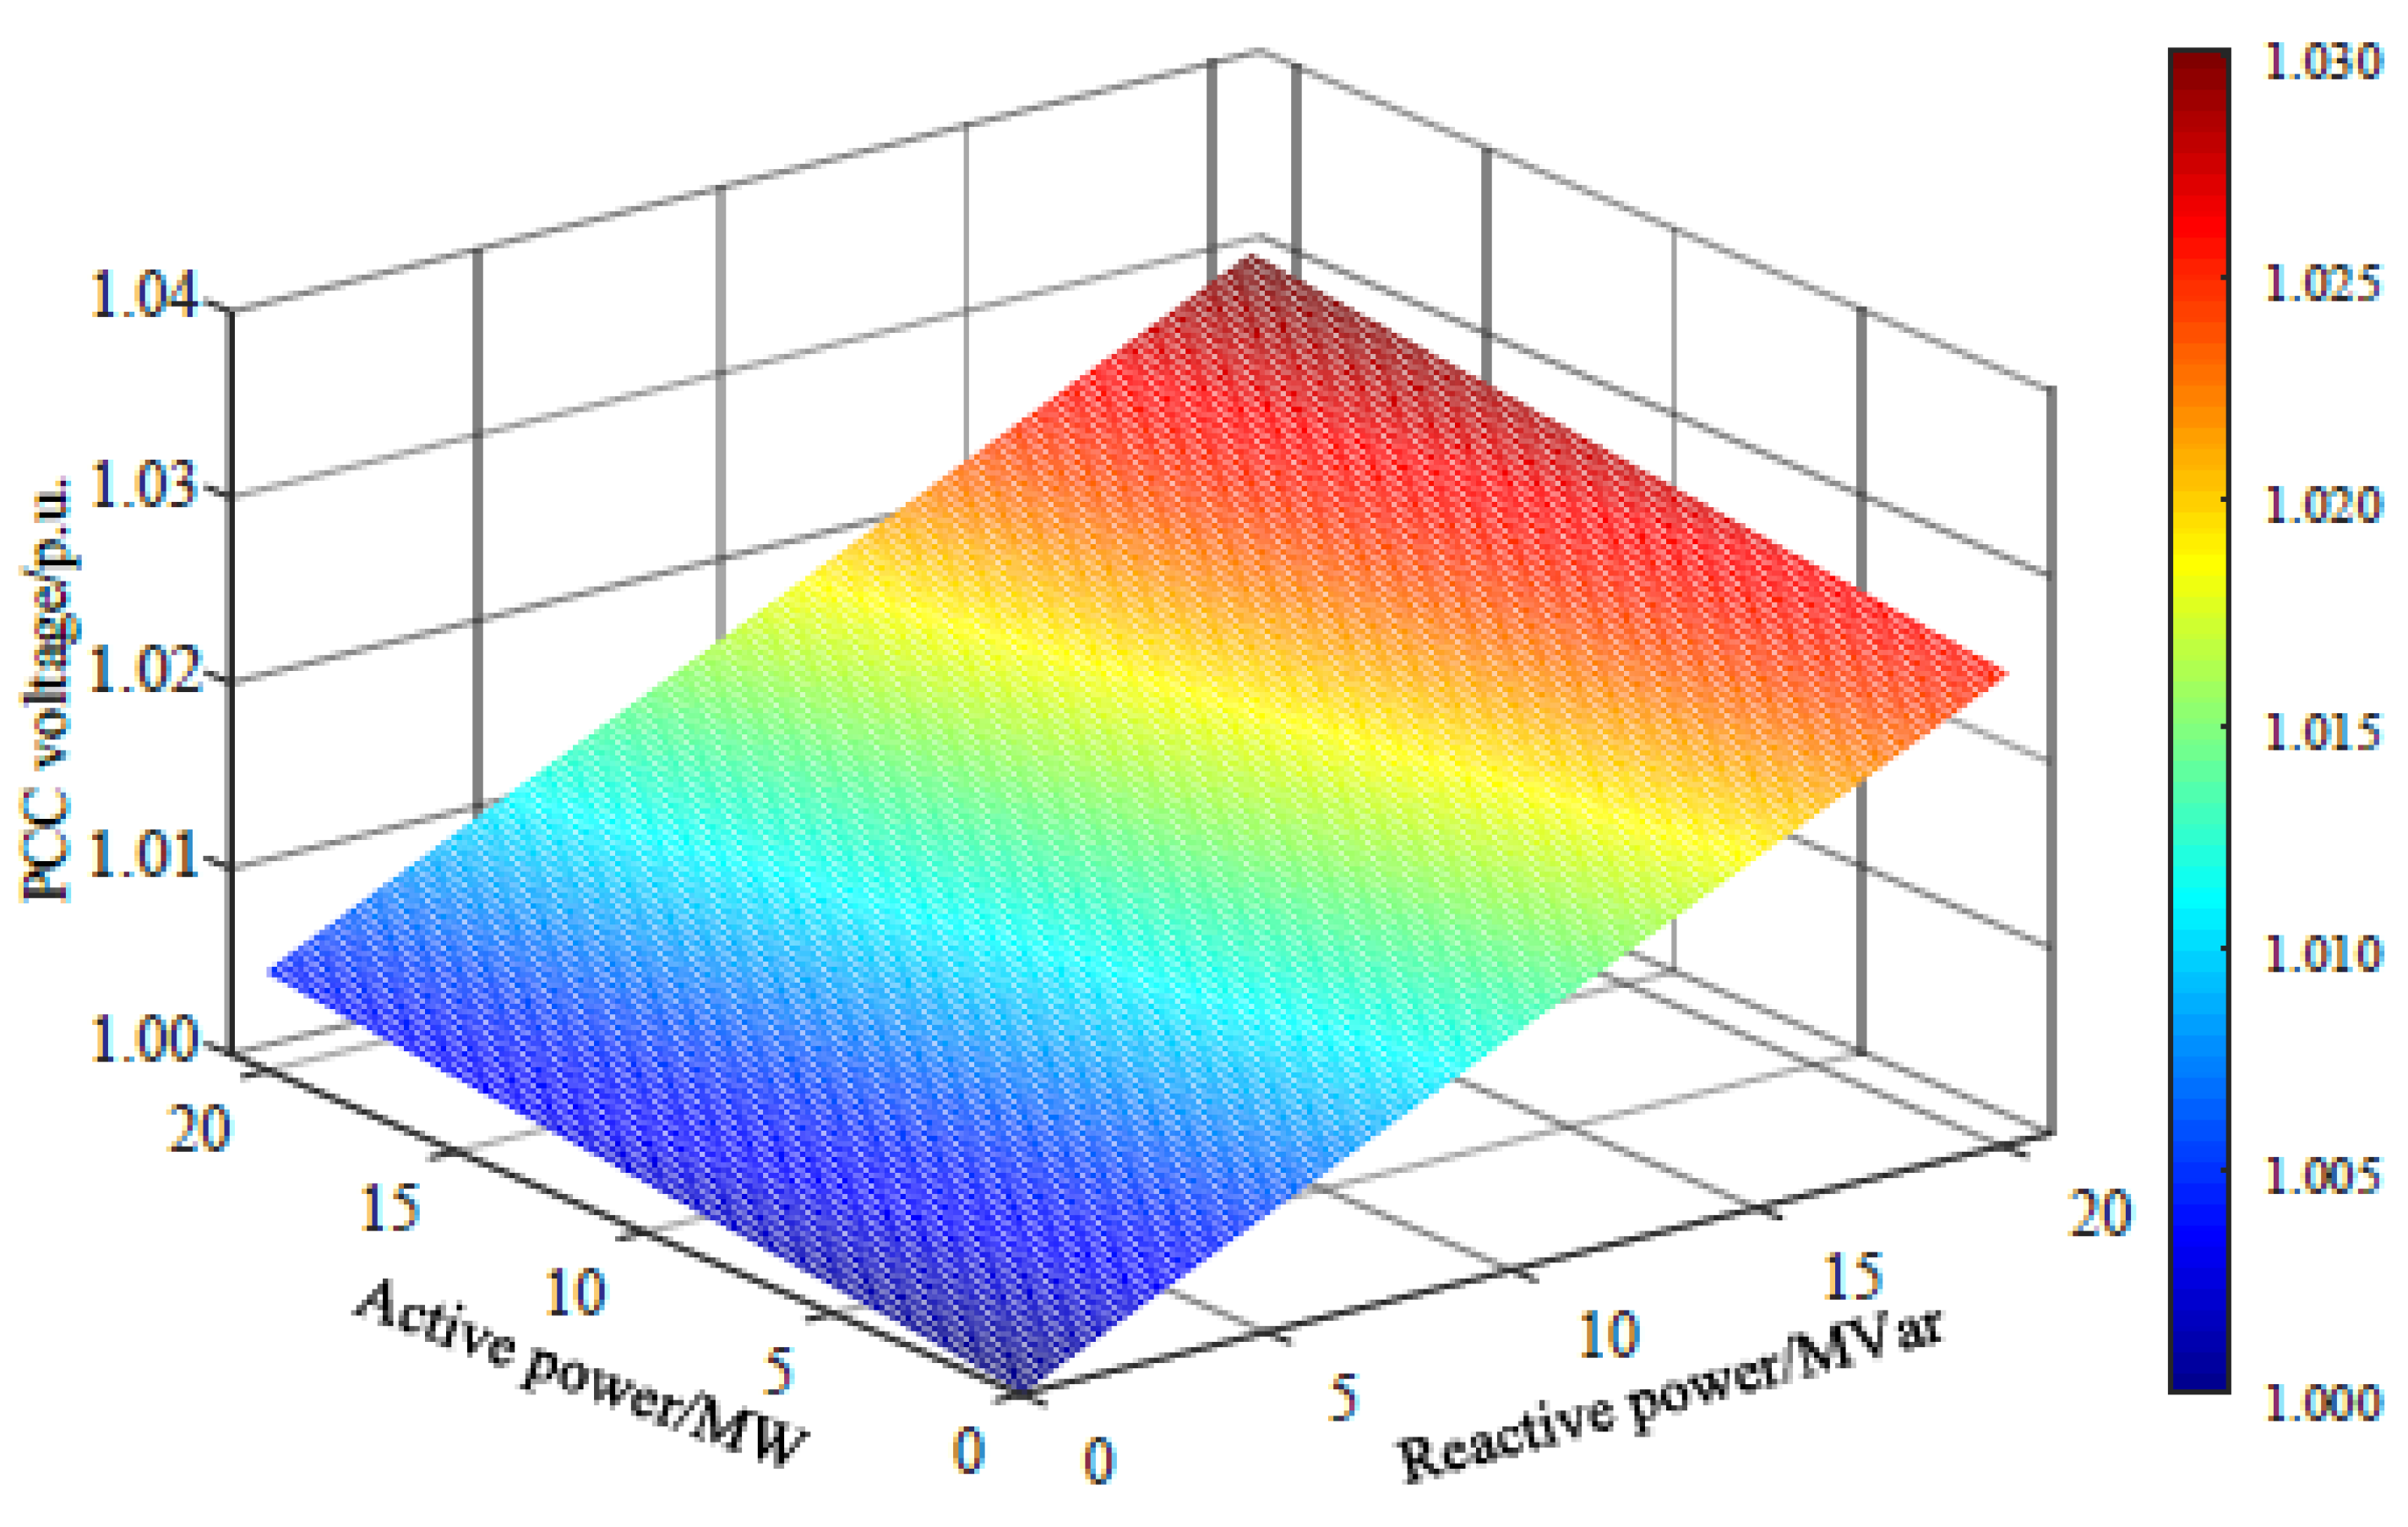
Equation (8) demonstrates that the PCC voltage of the wind farm is mainly affected by the active power and reactive power output by the wind farm, the equivalent impedance of the transmission line, and the power grid voltage. When the equal impedance of the transmission line and the power grid voltage is constant, the relationship between the PCC voltage of the wind farm and the output active and reactive power of the wind farm is shown in Figure 6.
The reactance of the high-voltage transmission lines in the wind farm is greater than the resistance, but the active power output of the wind farm is often much larger than the reactive power output. Therefore, the influence of the fluctuation of the active power output of the wind farm on the voltage at the grid connection point should be considered.
Currently, wind turbines usually operate with constant power factor, adjustable within 0.95 lead and lag power factor. According to Formula (8), the variation law of the voltage at the grid-connected point of the wind farm can be obtained:
U P C C P W F = R k + X k tan φ U + j X k R k tan φ U
where PWF is the active power output by the wind farm, and φ is the power factor angle of the wind farm. According to Formula (9), the variation law of the voltage at the grid connection point of the wind farm with the fluctuation of the active power output of the wind farm is related to the impedance of the transmission line of the wind farm and the operating power factor of the wind farm.
If the WT converter rated apparent power is not considered to limit the reactive output power of WTs, the more active and reactive power output by the wind farm, the higher the PCC voltage. Among them, the influence of the reactive output power of wind farms dominates.
Take the i-th feeder as an example to analyze the terminal voltage of the j-th column WT on this feeder. That is, the expression of the low-voltage side voltage UWTijL of the box-type transformer is:
U W T i j L U W T i j H + P W T i j R t + Q W T i j X t U W T i j H U W T i j H U W T i j 1 H + ( k = j m P W T i k ) R l + ( k = j m Q W T i k ) X l U W T i j 1 H U W T i 1 H U P C C L + ( k = 1 m P W T i k ) R l + ( k = 1 m Q W T i k ) X l U P C C L U P C C L U P C C + i = 1 n j = 1 m P W T i j Δ P R T + i = 1 n j = 1 m Q W T i j Δ Q X T U P C C
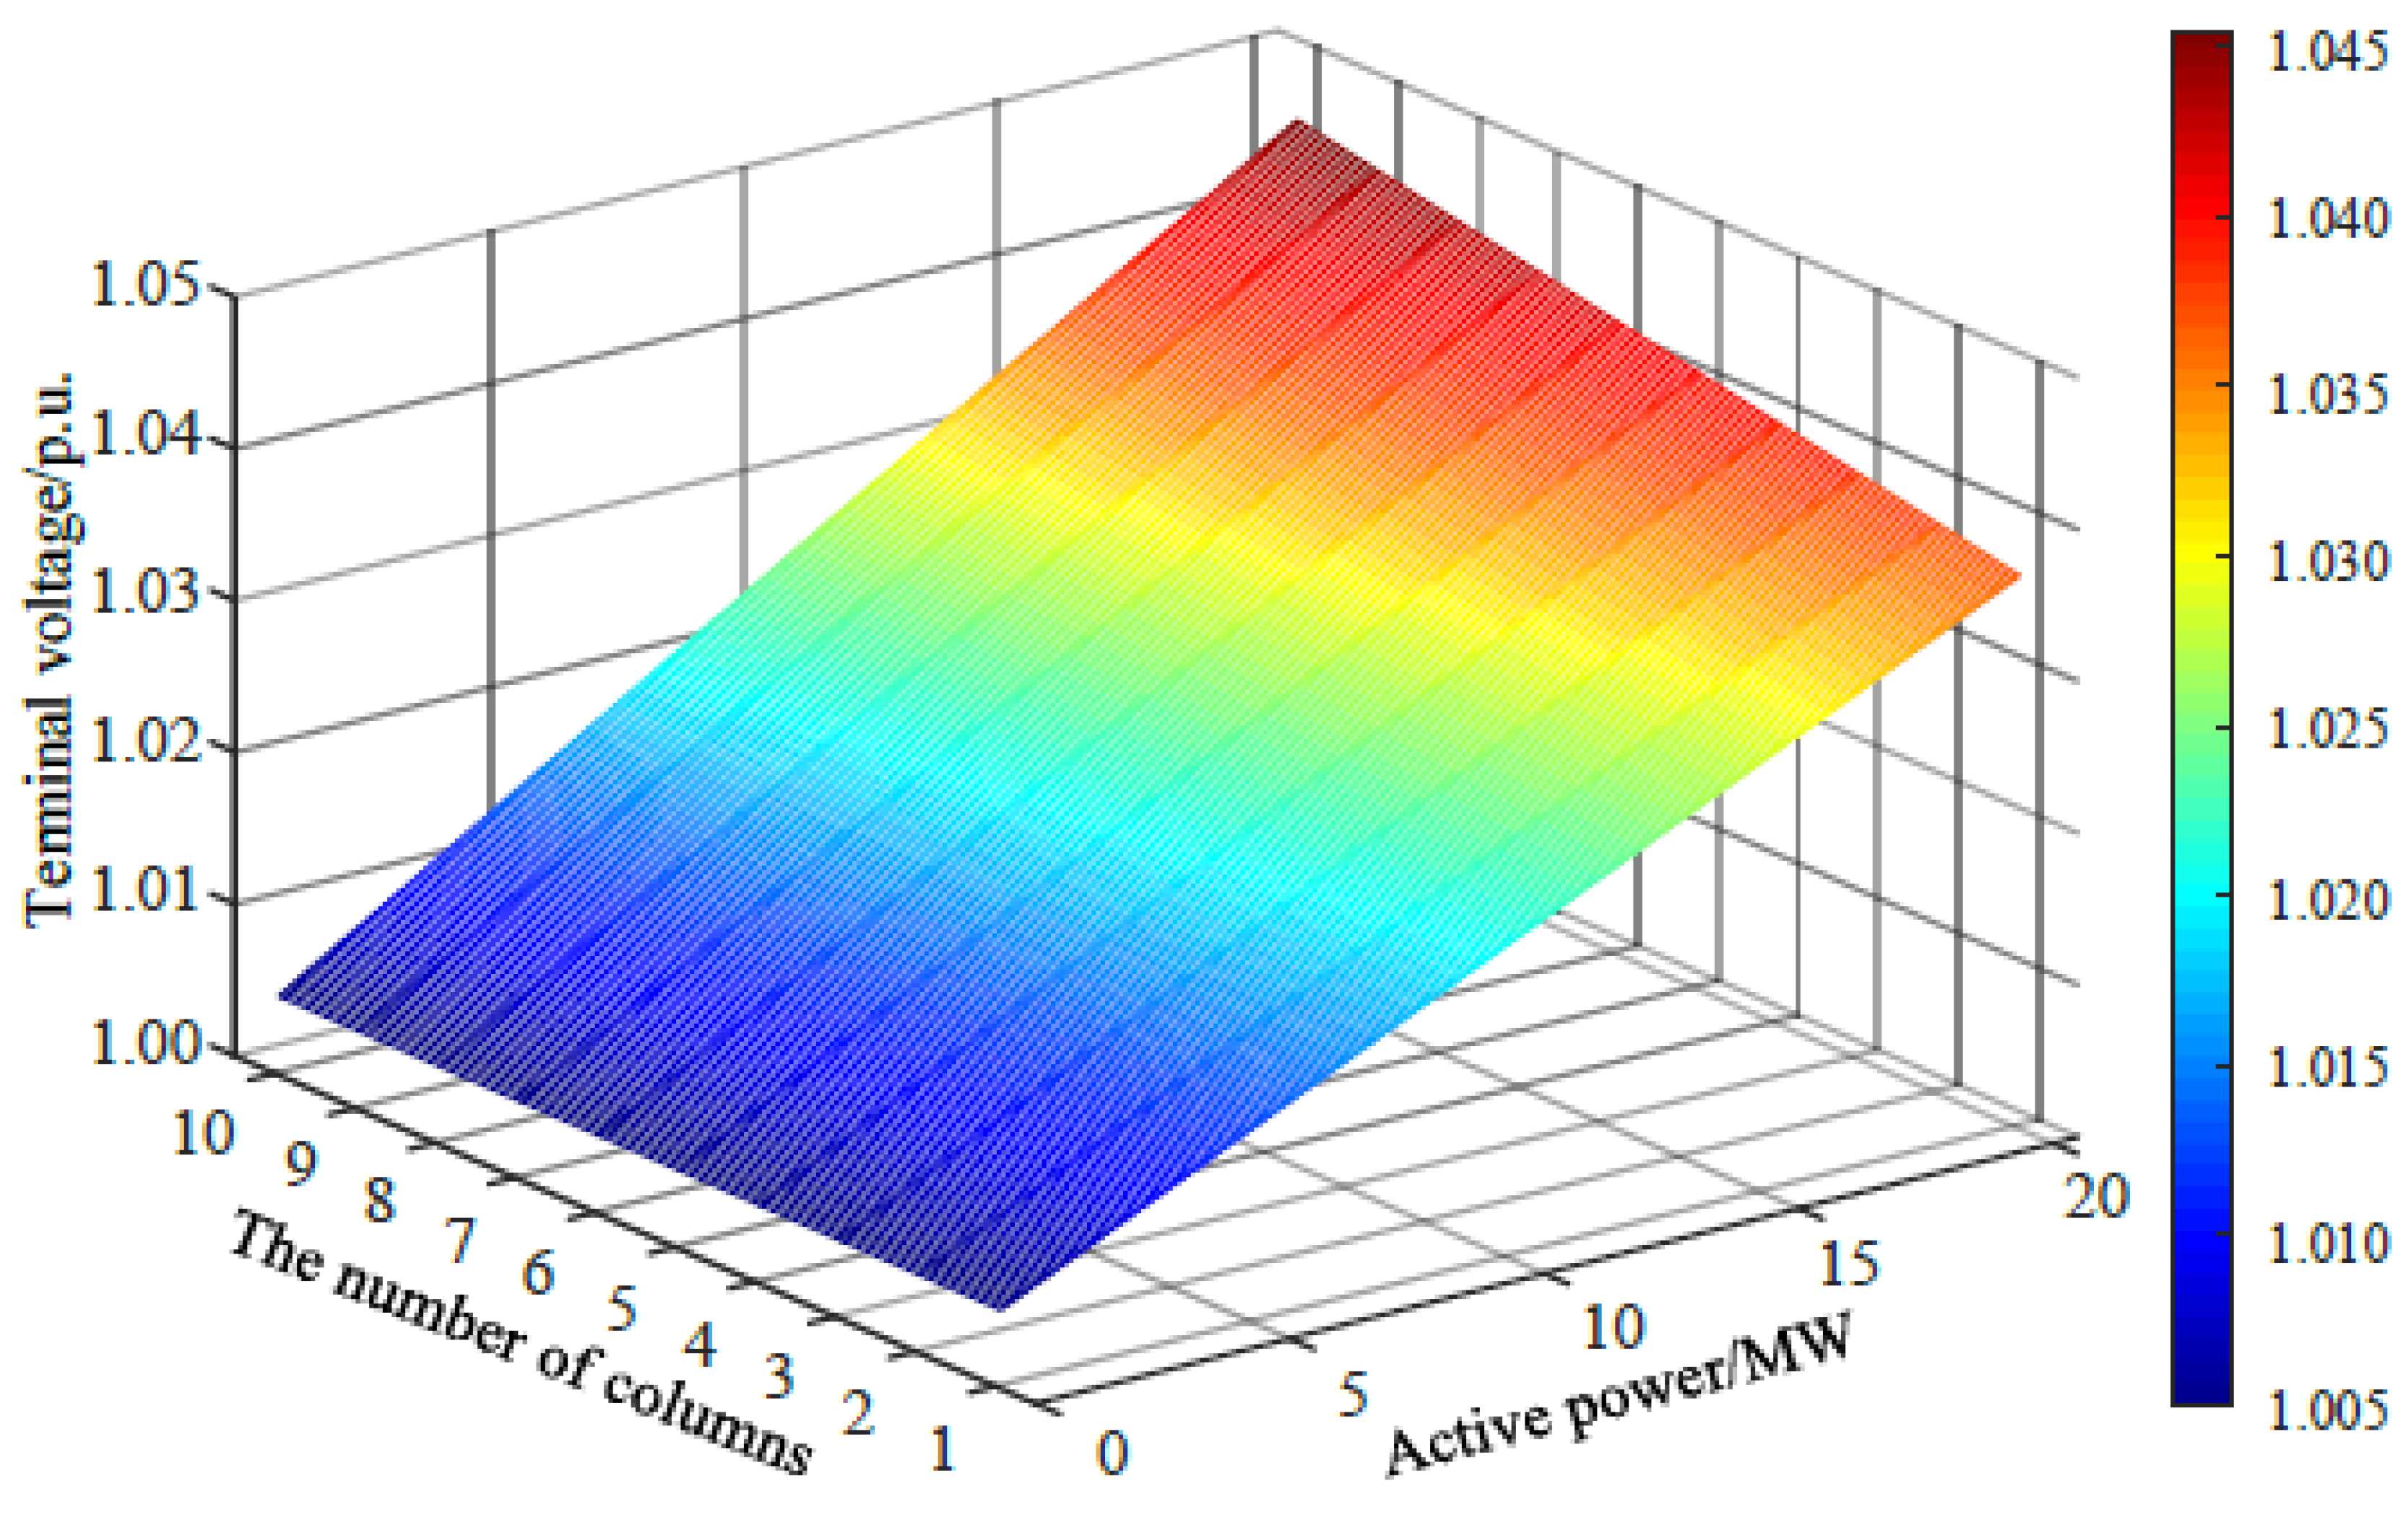
Equation (10) states that the terminal voltage of WT is closely related to the impedance of the feeder of the collection system, the position of WT in the feeder, the impedance of the box-type transformer, and the active power and reactive power output by WT. The relationship between the WT terminal voltage and the number of WTs, and the active output management of the wind farm is shown in Figure 7.
It shows that on the same feeder line, the WT terminal voltage gradually increases with the increase of the number of WT rows, and slowly rises with the rise of the active output power of the farm. Therefore, when the output power of the WT is significant, even if the PCC voltage is operating within the normal range, the terminal voltage of the feeder end WT will easily deviate too much, causing the terminal voltage to exceed the normal range and exceed the limit, resulting in the failure of the terminal WT; everyday work even triggers high-voltage disconnection.

3. Adaptive Gain Reactive Voltage Control Strategy for PMSG-Based Wind Farm

3.1. The Influence of Wake Effect on Reactive Power Adequacy of Wind Farm

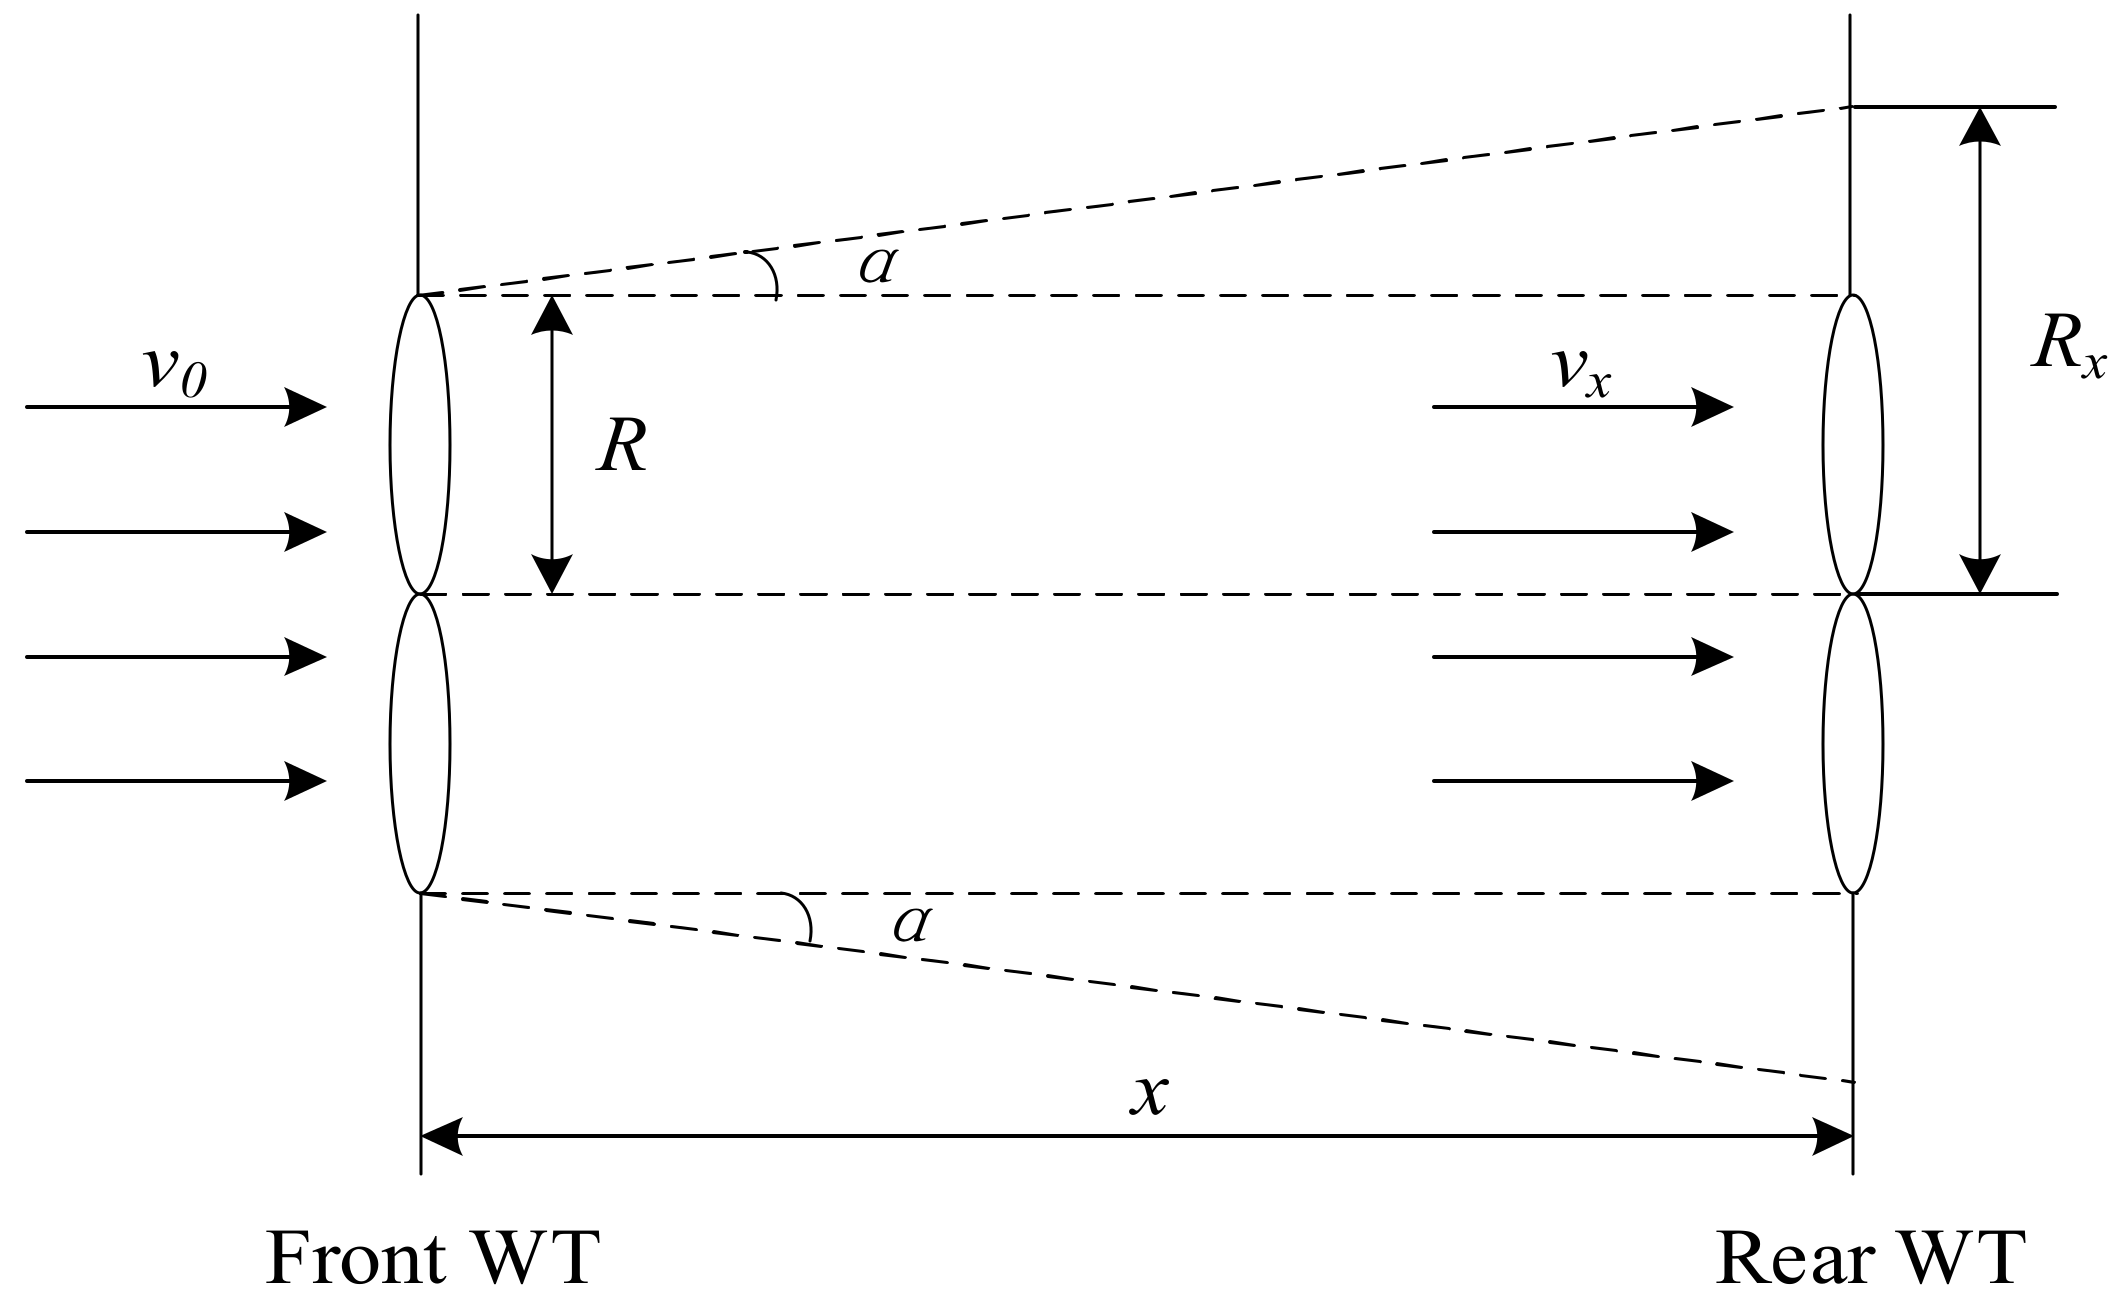
Figure 4 states that the reactive power adequacy of a WT is closely related to its input wind speed. Affected by the wake effect, energy will be lost after the wind passes through the WT wheel, causing the input wind speed of the rear WT to be lower than the input wind speed of the front WT, and the smaller the distance between the WTs, the more pronounced the wake effect. To simplify the simulation of the wake effect of flat terrain, this paper uses the Jensen model to illustrate the influence of the wake effect on the reactive power adequacy of the wind farms. The basic principle of the Jensen model is shown in Figure 8 [24].
The input wind speed of the front WT is v0, and the input wind speed of the rear WT with the separation distance x is vx. According to the Jensen model, the expression of vx is:
v x = v 0 [ 1 ( 1 1 C T ) ( R R x ) 2 ]
where CT is the thrust coefficient of the WT, which is the empirical coefficient of the WT, Rx is the projected cross-sectional radius of the rear WT affected by the wake of the front WT, and the calculation method is:
R x = R + R tan α
Affected by the wake effect, the input wind speed of the rear WT of the wind farm will be reduced, the reactive power range that the WT can adjust will be more comprehensive, and the reactive power adequacy will be greater. Therefore, when considering the participation of WTs in voltage regulation at the PCC, it is necessary to consider the influence of the wake effect on the reactive power adequacy of WTs. Take a PMSG-based wind farm with a 3 × 4 structure as an example. The current input wind speed of the front WT is 13 m/s, and the wind direction of the wind farm is 0°, −45°, −90°, −135°, and 180°, respectively. The reactive power adequacy of each WT in the wind farm affected by the wake effect is shown in Figure 9a–e. The wind blowing from the PCC of the wind farm to the WT is defined as the wind direction of 180°.
Figure 9a–e state that the reactive power adequacy of each WT in the wind farm has specific differences due to the wake effect, and the reactive power adequacy of the wind forward WT is smaller. When the wind direction is different, the reactive power adequacy of WTs at other locations is other, and the total reactive power adequacy of the wind farm is also other.

3.2. The Influence of Electrical Distance on Active Power Loss of Wind Farm

According to the internal voltage distribution characteristics of the PMSG-based wind farm in Section 2.2, the longer the electrical distance of the WT from the PCC, the higher the terminal voltage, and the more likely it is that the voltage limit will be exceeded. Simultaneously, a longer electrical distance means that the line loss caused by the WT will be much higher than that of the WT near the PCC, and the reactive power output by the WT will have weaker support for the PCC voltage.
The main factors of active power loss in the wind farm are the feeder line resistance Zl and the box-type transformer resistance Zt. Suppose DWTij is the equivalent resistance from the j-th column WT on the i-th feeder to the PCC of the wind farm, that is, the electrical distance between the WTij and the PCC, and its expression is:
D W T i 1 = R t + R l D W T i 2 = R t + R l + R t / / R l D W T i 3 = R t + R l + R t / / ( D W T i 2 R t ) D W T i j = R t + R l + R t / / ( D W T i ( j 1 ) R t )
The calculation method of total active power loss in wind farm is:
Δ P = i = 1 n j = 1 m ( Q W T i j U W T i j L ) 2 D W T i j
When dΔP/dQWTij = 0, ΔP takes the minimum value; that is, when
Q W T 11 D W T 11 = = Q W T 1 j D W T 1 j = = Q W T 1 m D W T 1 m = = Q W T i 1 D W T i 1 = = Q W T i j D W T i j = = Q W T i m D W T i m = = Q W T n 1 D W T n 1 = = Q W T n j D W T n j = = Q W T n m D W T n m
ΔP is the minimum. Therefore, when the reactive power output by each WT is inversely proportional to the electrical distance between its location and the PCC, the active power loss of the wind farm is the smallest. Figure 7 also demonstrates that when the functional power loss in the wind farm is the smallest, the dynamic power output by the wind farm is smaller, which reduces the terminal voltage offset of the WTs in the farm, and the terminal voltage will be more balanced.

3.3. The Calculation Method of Adaptive Gain Coefficient of WT

According to Section 3.1, when the reactive power output by the WT is inversely proportional to the electrical distance from the PCC, the active power loss and the terminal voltage deviation in the wind farm are the smallest. However, according to Section 3.2, the wind speed due to fluctuations and wake effect, the PMSG at different locations in the wind farm have other reactive power adequacy. Therefore, this section proposes an adaptive calculation method for the gain coefficient of the reactive power controller of the WT, which considers the reactive power adequacy of the WTs and the electrical distance between the WTs and the PCC, aiming to improve the support for the PCC voltage and maintain the terminal voltage balance, to ensure the safe and stable operation of the PMSG-based wind farm after integration. The control block diagram of the reactive power controller adaptive gain scheme is shown in Figure 10.
In Figure 10, the adaptive gain coefficient AGWTij of the WTij reactive power controller should be proportional to the reactive power adequacy of the WT and inversely proportional to the electrical distance between the WT and the PCC, namely:
A G W T i j Q W T i j , a d e A G W T i j 1 D W T i j
Then, make
A G W T i j = C Q W T i j , a d e D W T i j
where C is the proportional constant, which can be determined according to the reactive power QPCC,need to be required to adjust the PCC voltage, namely:
i = 1 n j = 1 m A G W T i j ( U P C C U P C C , r e f ) = Q P C C , n e e d
where UPCC is the voltage measurement value of the PCC, and UPCC,ref is the voltage reference value of the PCC, so the expression of the proportional constant C is:
C = Q P C C , n e e d ( U P C C U P C C , r e f ) i = 1 n j = 1 m Q W T i j , a d e D W T i j
So, the calculation equation of the adaptive gain coefficient of the WTij reactive power controller is:
A G W T i j = Q P C C , n e e d ( U P C C U P C C , r e f ) i = 1 n j = 1 m Q W T i j , a d e D W T i j Q W T i j , a d e D W T i j
Equation (20) states that AGWTij is a coefficient that varies with time and space. The change with time is due to the influence of the temporal and spatial differences of wind energy, and the wind speed fluctuates all the time. Therefore, the reactive power adequacy QWTij,ade of WT also changes with time, and the gain coefficient needs to be adjusted adaptively as the input wind speed changes. With spatial modifications, on the one hand, WTs at different locations have different reactive power adequacy due to the wake effect of wind speed. On the other hand, they are affected by the electrical distance from the PCC. Therefore, the WTs at different locations in the wind farm have spatial differences.
Therefore, it is not that the downstream wind WT with greater reactive power sufficiency has a more significant adaptive gain coefficient. It is also necessary to consider the electrical distance between the WT and the PCC, to avoid excessive power loss and increase the risk of the terminal voltage of the end WT exceeding the limit. Similarly, it is not that the WT with the closer electrical distance to the PCC needs to set a more significant adaptive gain coefficient, but it also needs to consider the reactive power adequacy of the WT, to prevent the reactive power of the WT from exceeding the limit of the WT reactive power adequacy and damaging the converter. Therefore, the proposed strategy control block diagram is shown in Figure 11.

4. Case Study

4.1. Simulation Settings

A simulation system of a PMSG-based wind farm is built in PSCAD/EMTDC for verification calculation, as shown in Figure 11. The wind farm comprises 12 WTs in three rows of four columns, and the WT’s parameters are all the same, as shown in Table 1. The infinite power grid is equivalent to a synchronous generator with a capacity of 100 MVA, and the static load of 30 MW and 1 MVar is connected to the PCC in the simulation system.

4.2. Simulation Case

Three simulation scenarios are set to demonstrate the comprehensive effectiveness of the proposed strategy, where all the disturbances were set at 3 s, and the load increased by 4 MW and 2.4 MVar. In addition, this paper only considers the reactive voltage control ability of the WT itself. It does not consider the voltage regulation control of SVG and other reactive power compensation devices. Therefore, after the system is disturbed, the voltage of the PCC does not recover to the initial value.
According to the analysis in Section 3, the performance of the adaptive gain reactive voltage control strategy for the PMSG-based wind farm is closely related to wind conditions (including wind speed and wind direction), electrical distance, and disturbance. Therefore, by changing the wind regime, this section compares and analyzes the changes in the voltage at the PCC, the active power loss, and the terminal voltage in the wind farm after being disturbed. Among them, comparison strategies are as follows:
Strategy 1: The adaptive gain coefficient is only calculated according to the reactive power adequacy of WT.
Strategy 2: The adaptive gain coefficient is only calculated according to the electrical distance between the WT and the PCC.
Strategy 3: The adaptive gain coefficient is calculated according to Equation (20), the proposed strategy.
The average voltage of the PCC, the sum of the square of the terminal voltage difference, and the sum of active power losses in the farm are set to compare the three strategies to verify the comprehensive effectiveness of the proposed strategy. Wherein, the calculation method of the average voltage of the PCC is:
U ¯ P C C = U P C C , t 1 + U P C C , t 2 + + U P C C , t N N
where UPCC,ti (i = 1, 2, … N) is the measured value of the PCC voltage at the time of ti. t1 is the starting time of analysis, and tN is the end time of calculation. N is the sampling time of the measured value during the t1 to tN.
The calculation method of the sum of active power losses in the farm is:
Δ P = S B i = 1 n j = 1 m ( Q W T i j U W T L i j ) 2 D W T i j
where SB is the base capacity.
The calculation method of the sum of the square of the terminal voltage difference is:
Δ U = i = 1 n j = 1 m ( U ¯ W T L i j U W T , r e f ) 2
where U ¯ WTLij is the average terminal voltage of each WT, the calculation method is similar to that of Equation (21). UWT,ref is the reference value of terminal voltage, set as 1.0 p.u.

4.2.1. Scenario 1: The Wind Speed Is Constant at 13 m/s, and the Wind Direction Is 180°

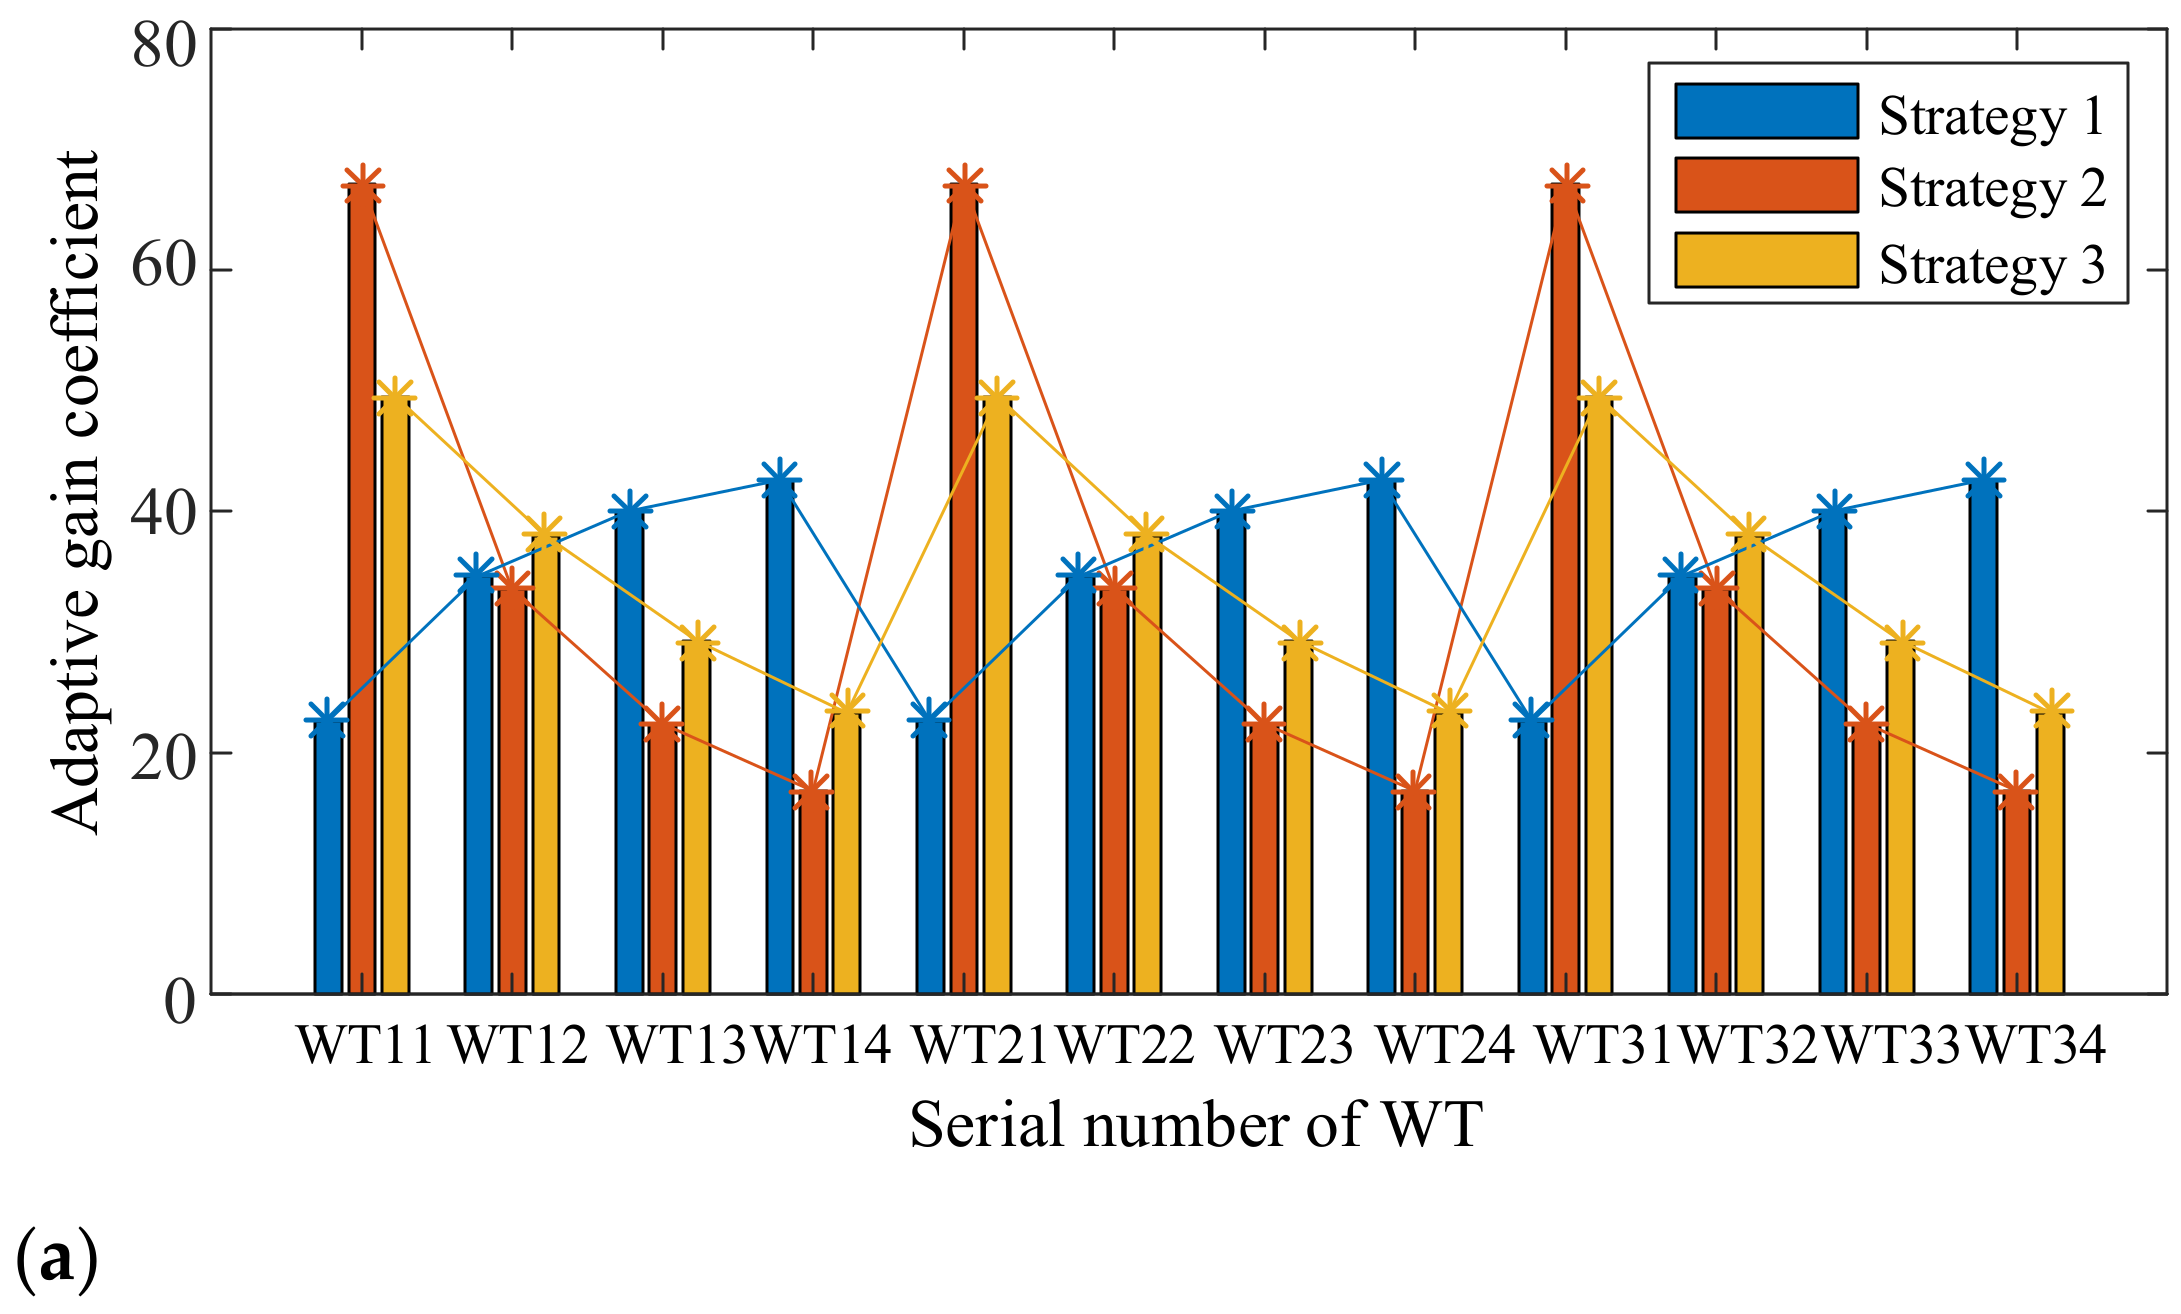
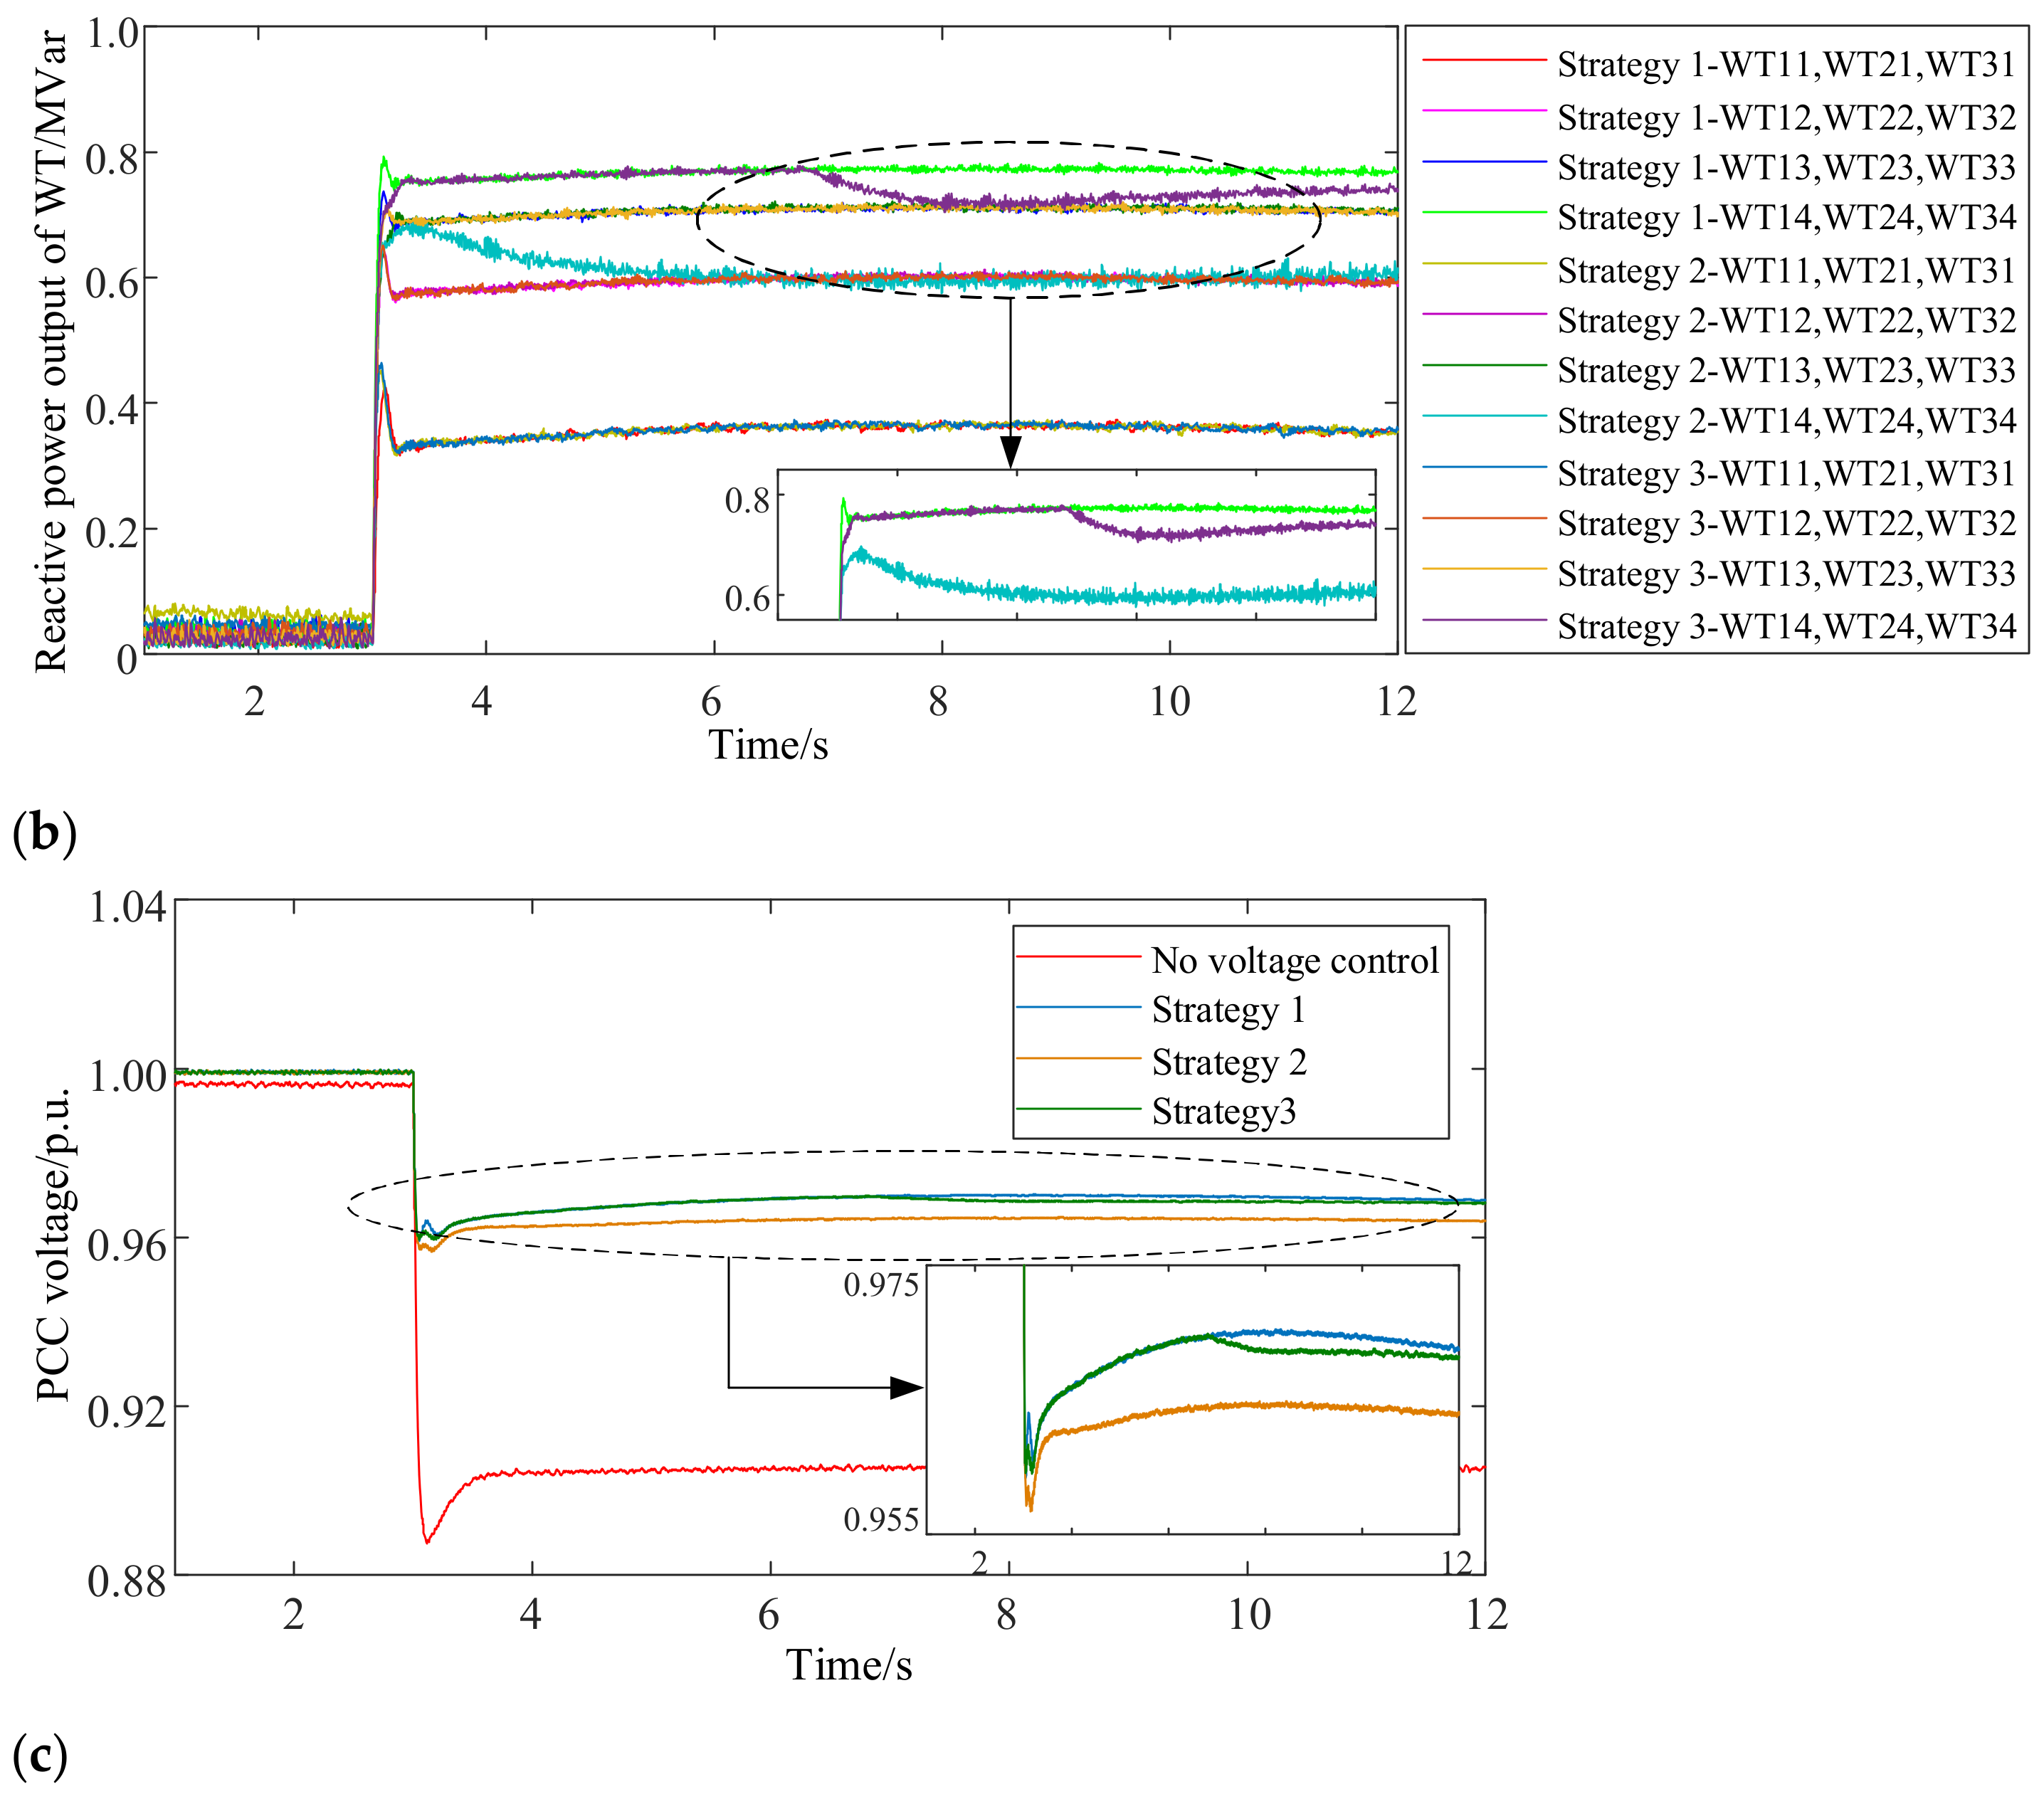
First, the simulation is carried out when the wind speed is constant at 13 m/s, and the wind direction is 180°. Affected by the wake effect, the reactive power adequacy of each WT is shown in Figure 9e, and the adaptive gain coefficient, reactive output power, and PCC voltage of each WT under the three strategies are shown in Figure 12a–c, respectively. The indicator calculation results of the three strategies during 4–12 s are shown in Table 3.
As can be seen from Figure 9e and Figure 12a, the active power output of the WTs in column 4 is the minimum, and the reactive power adequacy of the WTs is the maximum affected by the input wind speed. Therefore, the adaptive gain coefficient of the WTs in column 4 of Strategy 1 is the ultimate, which decreases sequentially from column 3 to column 1. However, the adaptive gain coefficient of Strategy 2 is affected by the electrical distance, and the WTs in column 4 decreases successively from the WTs in column 1. The adaptive gain coefficient of Strategy 3 increases from the WTs in column 1 to the WTs in column 4 after comprehensively considering the influence of reactive power adequacy and electrical distance.
Furthermore, the most significant difference in reactive power output of each WT under the three strategies lies in the WTs in column 4. According to Figure 12c and Table 2, the average value of the PCC voltage in Strategy 1 is the highest, which results in the maximum active power loss and the sum of the square of the terminal voltage difference. Even the terminal voltage of the WTs in column 4 has reached 1.09 p.u. Inversely, strategy 2 reduces the active power loss and the terminal voltage difference. So, the terminal voltage of the WTs in column 4 has not exceeded the limit. However, the PCC voltage decreases because the WTs in column 4 collectively reduce the reactive power output. Strategy 3 takes the reactive power adequacy of the WT and the balance of terminal voltage into consideration comprehensively, and the lifting effect of the PCC voltage is more noticeable compared with Strategy 2. Compared with Strategy 1, the active power loss in the farm and the sum of the square of terminal voltage difference are reduced. Further calculation of the results in Table 4 shows that strategy 3 reduces the voltage difference between fan terminals by 0.7% compared to strategy 1. Compared with strategy 2, strategy 3 has a 0.4% increase in the voltage rise effect at the grid connection point. Therefore, strategy 3 proposed in this paper can effectively improve the voltage support capacity of the wind farm to the PCC and facilitate the active power loss in the farm to maintain the balance of the terminal voltage of the WTs, which has particular comprehensive effectiveness.

4.2.2. Scenario 2: The Wind Speed Fluctuates, and the Wind Direction Is 180°

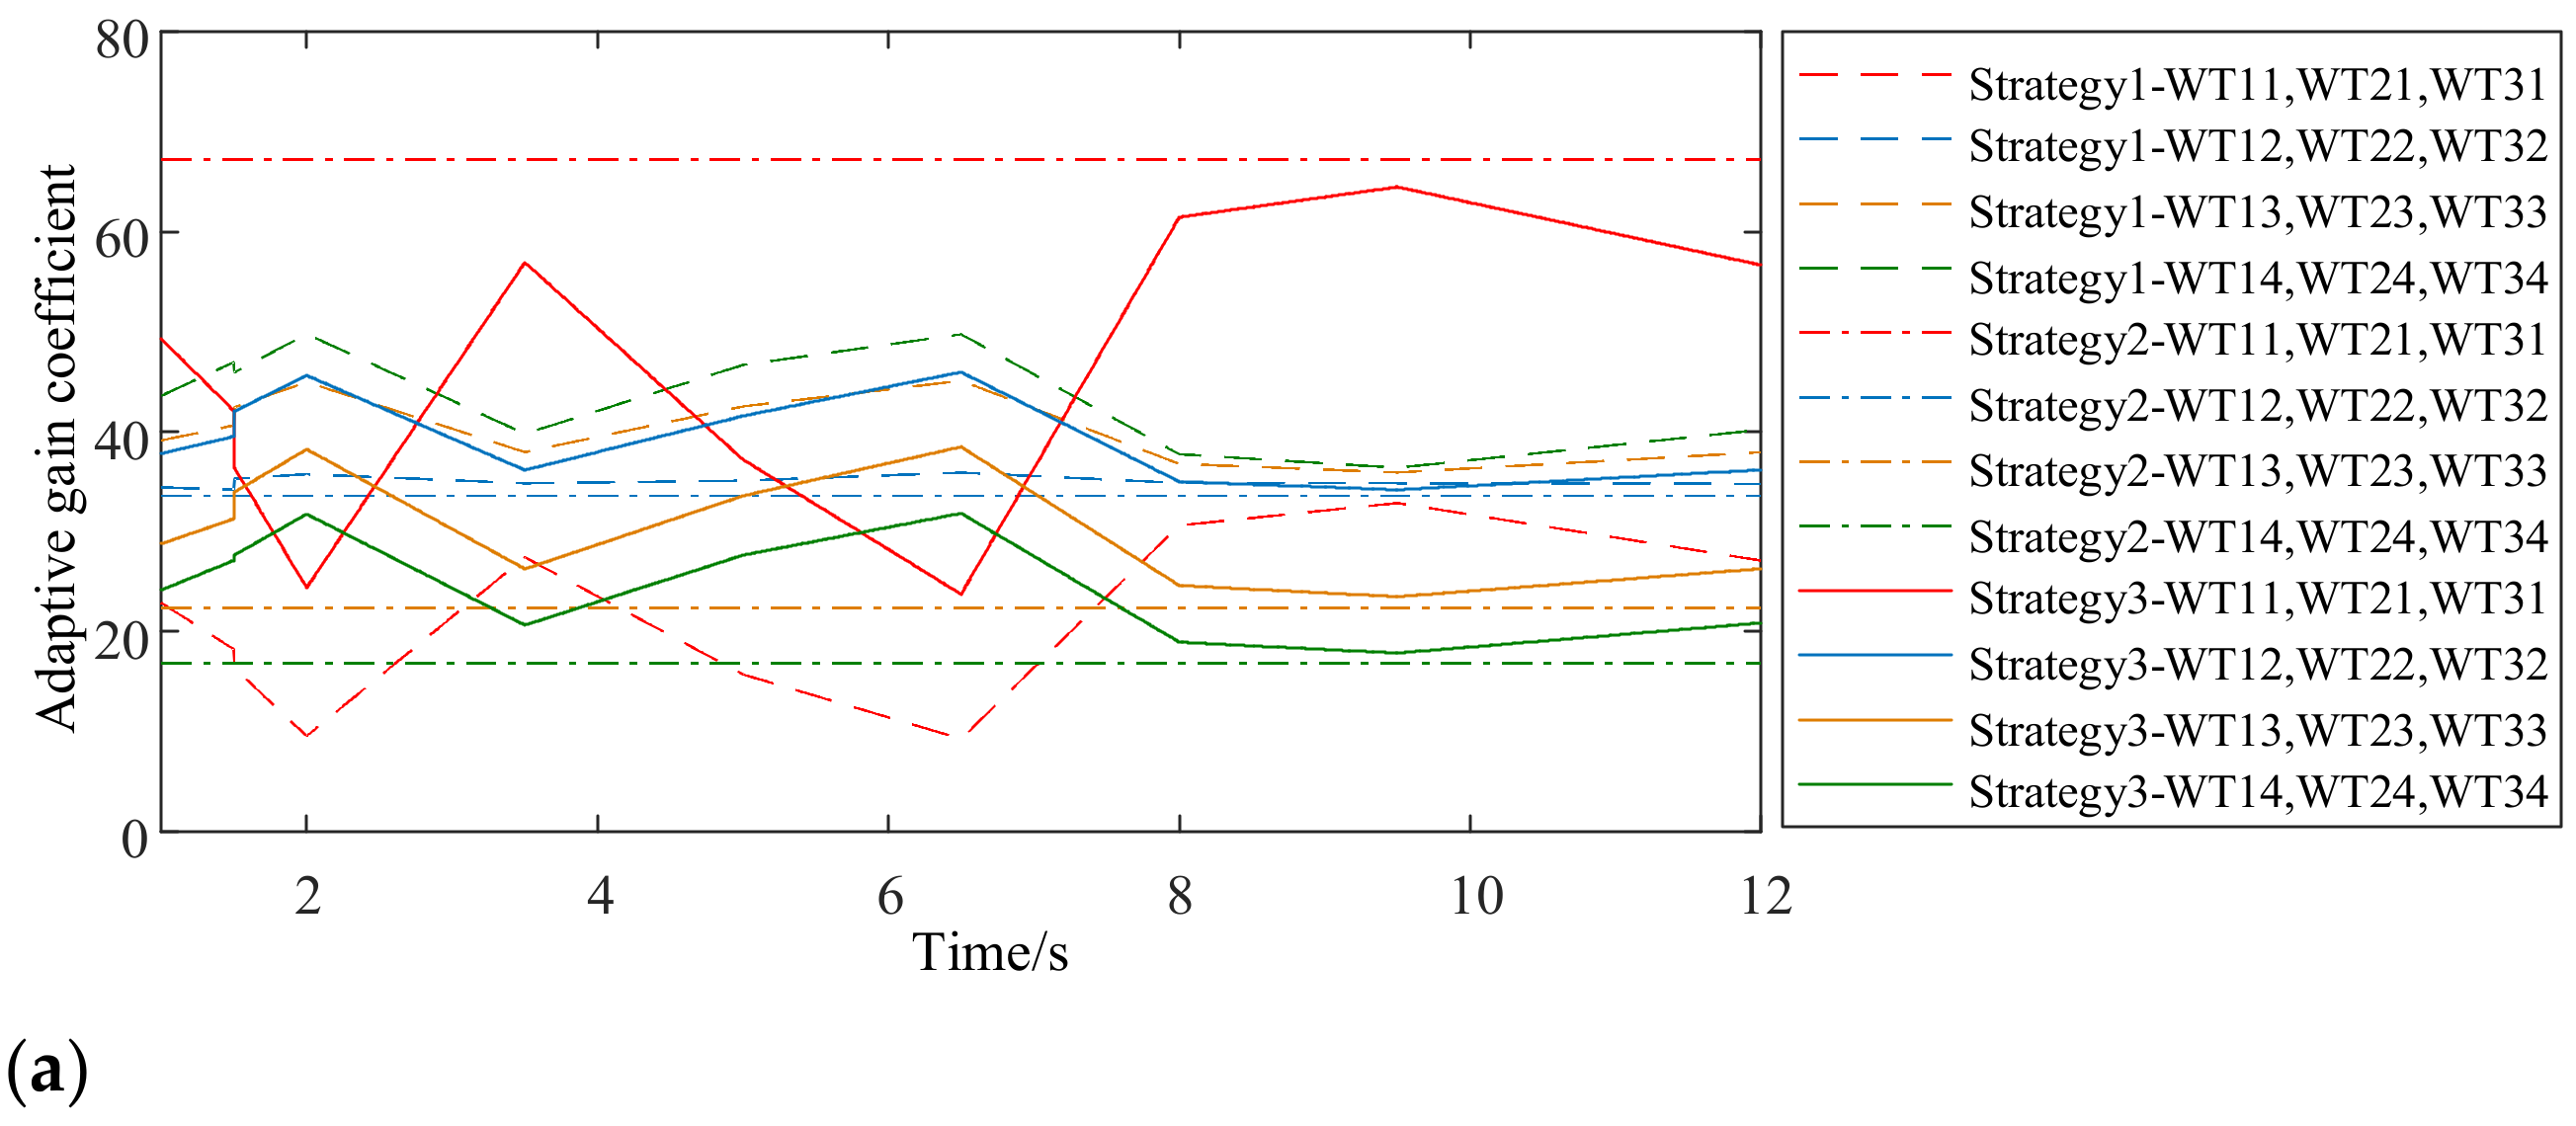
When the wind speed fluctuates, and the wind direction is 180°, the input wind speed of each WT in the wind farm is shown in Figure 13. The adaptive gain coefficient, reactive output power, and PCC voltage under the three strategies are shown in Figure 14a–c, respectively.
According to Figure 13 and Figure 14a–c, the variation trend of the adaptive gain coefficient of each WT in Strategy 1 is opposite to the variation trend of the input wind speed of each WT. When the wind direction is 180°, the input wind speed of the WTs in column 1 is the maximum, and the adaptive gain coefficient is the minimum. In Strategy 2, the adaptive gain coefficient of each WT remains unchanged and is only related to the electrical distance between the WT and the PCC, which does not change with the wind speed fluctuation. The larger the electrical length, the smaller the adaptive gain coefficient. In Strategy 3, while the adaptive gain coefficient of the WTs in column 1 fluctuates with the wind speed, the adaptive gain coefficient is significant when the input wind speed of the WT is relatively low because the electrical distance to the PCC is the closest. In addition, compared with the WTs in the third and fourth rows of Strategy 2, the WTs can output more reactive power, improve the voltage of the PCC and reduce the active power loss.

4.2.3. Scenario 3: The Wind Direction Changes with the Same Input Wind Speed

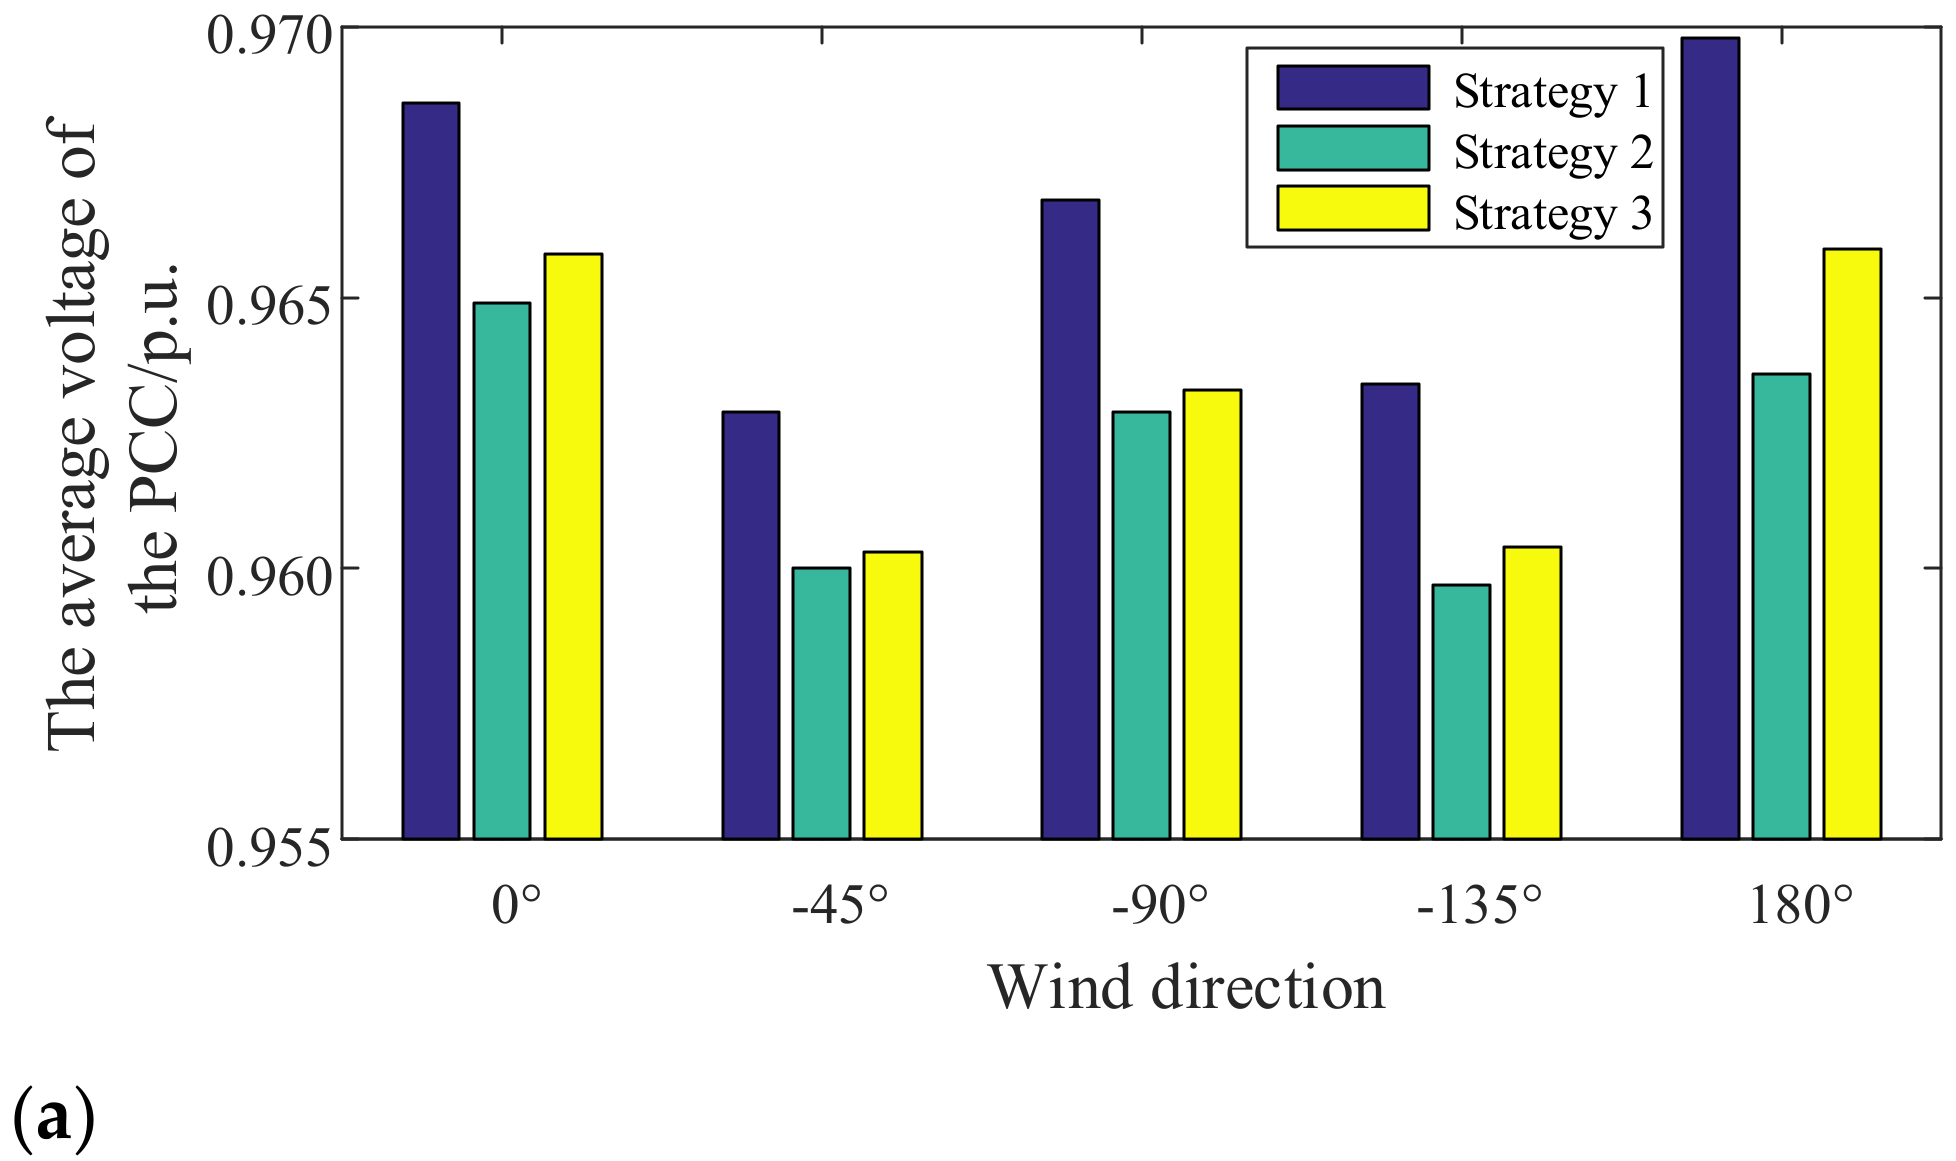
When the input wind speed of the wind farm is the same, and the wind direction is 0°, −45°, −90°, −135°, and 180°, respectively, the comparison of the indicator calculation results of the three strategies during 4~12 s is shown in Figure 15a–c.
By setting different case scenarios, this paper compares the indicators of the three control strategies. Compared with the wind turbine droop gain voltage control method proposed by existing literatures, the fixed droop gain and improper gain setting will lead to unsatisfactory regulation effect of grid-connected point and generator terminal voltage. The strategy 3 proposed in this paper is a wind farm reactive power and voltage control strategy that comprehensively considers the reactive power sufficiency and voltage balance of the units. The adaptive gain coefficient is calculated according to Equation (20). Each wind turbine comprehensively considers the change of the input wind speed and the electrical distance from the grid-connected voltage to the output reactive power for voltage regulation control. The adaptive gain coefficients of the other two strategies are only calculated based on the reactive power slack of the wind turbine or the electrical distance from the grid connection point. Set the average value of the grid-connected point voltage, the square sum of the terminal voltage difference, the active power loss in the field and three indicators to compare the three strategies.
The calculation result shows that Strategy 1 can better improve the PCC voltage, but increases the functional loss within the wind farm and the terminal voltage difference. Strategy 2 is the optimal control to minimize the functional power loss, which reduces the function power loss and maintains the balance of terminal voltage, but has a poor regulation effect on the PCC voltage. The proposed Strategy 3 considers the difference of each WT and adaptively adjusts the reactive voltage according to the electrical distance between each WT and the PCC and the fluctuation of the input wind speed, to improve the PCC voltage well and reduce the active power loss and the terminal voltage difference. The calculation of the results in Table 4 shows that strategy 3 reduces the voltage difference between fan terminals by 0.7% compared to strategy 1. Compared with strategy 2, strategy 3 has a 0.4% increase in the voltage rise effect at the grid connection point. Further analysis and calculation of Figure 15 shows that when the wind direction changes, strategy 3 reduces the voltage difference between fan terminals by an average of 4.8% compared with strategy 1. Compared with strategy 2, strategy 3 has an average increase of 0.2% in the voltage rise effect at the grid connection point.

5. Conclusions

This paper first analyzes the reactive power adequacy of PMSG under the complete wind condition and the distribution characteristics of voltage inside the PMSG-based wind farm. Then, it put forward a reactive voltage control strategy for PMSG-based wind farms, considering reactive power adequacy and terminal voltage balance based on the influence of wake effect on reactive power adequacy of the wind farms and the impact of electrical distance on active power loss wind farm. The results demonstrate that:
The proposed strategy can fully use the reactive power regulation ability of each WT in the wind farm without damaging the WT converter, and simultaneously realize the voltage rise of the PCC (an average of about 0.3%), the reduction of the voltage difference between the terminals (an average of about 2.8%), and the reduction of the active power loss (an average of about 7.8%) in the wind farm under the disturbance scenarios such as load mutation, wind speed fluctuation, and wind direction change.

Author Contributions

Conceptualization, J.D. and L.W.; methodology, P.C. and L.W.; software, J.D. and X.Z.; validation, L.W., P.C. and X.Z.; formal analysis, J.D.; investigation, L.W. and X.Z.; resources, J.D.; data curation, L.W.; writing—original draft preparation, J.D. and L.W.; writing—review and editing, J.D. and L.L.; visualization, L.W.; supervision, J.D.; funding acquisition, J.D., X.Z. and L.L. All authors have read and agreed to the published version of the manuscript.

Funding

This work was supported by Open Fund of State Key Laboratory of Power Grid Security and Energy Conservation (China Electric Power Research Institute) (No. FX80-21-001).

Conflicts of Interest

The authors declare no conflict of interest.

Abbreviations

Acronyms
PCCpoint of common connection
PMSGPermanent magnet synchronous generator
OLTCOn-load tap changer
SVCStatic Var compensator
SVGStatic Var Synchronous
DFIGDoubly-Fed Induction Generators
MPPTMaximum Power Point Tracking
Variables
Pmthe output mechanical power of the WT
ρ the air density
Rthe radius of the WT blade
vthe input wind speed
Cpthe wind energy utilization coefficient
ω m the angular velocity of the WT
Koptthe equivalent coefficient to obtain the maximum wind power
PWTthe expression of the active power output
vcut-inthe cut-in wind speed
vratethe rated wind speed
vcut-outthe cut-out wind speed
Pratethe rated active power of WT
SWTthe apparent power of the WT converter
QWT,adethe reactive power adequacy of the WT
CTthe thrust coefficient of the WT
Rxthe projected cross-sectional radius of the rear WT affected by the wake of the front WT
UPCCthe wind farm PCC voltage
v0the input wind speed of the front WT is
ΔPthe minimum
Cthe proportional constant
t1the starting time of analysis
tNthe end time of calculation
SBthe base capacity
U ¯ WTLijthe average terminal voltage of each WT
UWT,refthe reference value of terminal voltage
Uthe power grid voltage

References

  1. Mahela, O.P.; Shaik, A.G. Comprehensive overview of grid interfaced wind energy generation systems. Renew. Sustain. Energy Rev. 2016, 57, 260–281. [Google Scholar] [CrossRef]
  2. Asadollah, S.; Zhu, R.; Liserre, M. Analysis of voltage control strategies for wind farms. IEEE Trans. Sustain. Energy 2020, 11, 1002–1012. [Google Scholar] [CrossRef]
  3. Zhou, W.; Wang, Y.; Torres-Olguin, R.E.; Chen, Z. Effect of Reactive Power Characteristic of Offshore Wind Power Plant on Low-Frequency Stability. IEEE Trans. Energy Convers. 2020, 35, 837–853. [Google Scholar] [CrossRef] [Green Version]
  4. Kuang, H.; Zheng, L.; Li, S.; Ding, X. Voltage stability improvement of wind power grid-connected system using TCSC-STATCOM control. IET Renew. Power Gener. 2019, 13, 215–219. [Google Scholar] [CrossRef]
  5. Chen, X.; Yan, L.; Zhou, X.; Sun, H. A novel DVR-ESS-embedded wind-energy conversion system. IEEE Trans. Sustain. Energy 2018, 9, 1265–1274. [Google Scholar] [CrossRef]
  6. Ouyang, J.; Li, M.; Diao, Y.; Tang, T.; Xie, Q. Active control method of large-scale wind integrated power system with enhanced reactive power support for wind speed fluctuation. IET Gener. Transm. Distrib. 2018, 12, 5664–5671. [Google Scholar] [CrossRef]
  7. Mahdavi, H.; Panamtash, A.D.; Zhou, Q. Predictive Coordinated and Cooperative Voltage Control for Systems with High Penetration of PV. IEEE Trans. Ind. Appl. 2021, 57, 2212–2222. [Google Scholar] [CrossRef]
  8. Karbouj, H.; Rather, Z.H. Voltage control ancillary service from wind power plant. IEEE Trans. Sustain. Energy 2019, 10, 759–767. [Google Scholar] [CrossRef]
  9. Wang, Q.; Chen, L.; Hu, M.; Tang, X.; Li, T.; Ji, S. Voltage prevention and emergency coordinated control strategy for photovoltaic power plants considering reactive power allocation. Electr. Power Syst. Res. 2018, 163, 110–115. [Google Scholar] [CrossRef]
  10. Ouyang, J.; Tang, T.; Yao, J.; Li, M. Active voltage control for DFIG-based wind farm integrated power system by coordinating active and reactive powers under wind speed variations. IEEE Trans. Energy Convers. 2019, 34, 1504–1511. [Google Scholar] [CrossRef]
  11. Yassami, H.; Rabiee, A.; Jalilvand, A.; Bayat, F. Model predictive control scheme for coordinated voltage control of power systems at the presence of volatile wind power generation. IET Gener. Transm. Distrib. 2018, 12, 1922–1928. [Google Scholar] [CrossRef]
  12. Gencer, A. Analysis of fault ride through capability improvement of the permanent magnet synchronous generator based on WT using a BFCL. In Proceedings of the 2019 1st Global Power, Energy and Communication Conference (GPECOM), Nevsehir, Turkey, 12–15 June 2019; pp. 353–357. [Google Scholar]
  13. Tian, C.; Luo, X.; Dong, J.; Chen, B.; Yuan, J. Voltage and reactive power optimisation of offshore wind farms based on terminal voltage control mode of DFIG. J. Eng. 2017, 13, 874–879. [Google Scholar] [CrossRef]
  14. Ouyang, J.; Li, M.; Zhang, Z.; Tang, T. Multi-timescale active and reactive power-coordinated control of large-scale wind integrated power system for severe wind speed fluctuation. IEEE Access 2019, 7, 51201–51210. [Google Scholar] [CrossRef]
  15. Kim, J.; Seok, J.-K.; Muljadi, E.; Kang, Y.C. Adaptive Q–V scheme for the voltage control of a DFIG-based wind power plant. IEEE Trans. Power Electron. 2016, 31, 3586–3599. [Google Scholar] [CrossRef]
  16. Sun, H.; Guo, Q.; Qi, J.; Ajjarapu, V.; Bravo, R.; Chow, J.; Li, Z.; Moghe, R.; Nasr-Azadani, E.; Tamrakar, U.; et al. Review of challenges and research opportunities for voltage control in smart grids. IEEE Trans. Power Syst. 2019, 34, 2790–2801. [Google Scholar] [CrossRef] [Green Version]
  17. Li, Y.; Xu, Z.; Zhang, J.; Meng, K. Variable droop voltage control for wind farm. IEEE Trans. Sustain. Energy 2018, 9, 491–493. [Google Scholar] [CrossRef]
  18. Guo, Y.; Gao, H. Data-Driven online system equivalent for self-adaptive droop voltage control of wind power plants. IEEE Trans. Energy Convers. 2020, 35, 302–305. [Google Scholar] [CrossRef]
  19. Xing, P.; Fu, L.; Wang, G.; Wang, Y.; Zhang, Y. A compositive control method of low-voltage ride through for PMSG-based wind turbine generator system. IET Renew. Power Gener. 2018, 12, 117–125. [Google Scholar] [CrossRef]
  20. Qin, N.; Bak, C.L.; Abildgaard, H.; Chen, Z. Multi-stage optimization-based automatic voltage control systems considering wind power forecasting errors. IEEE Trans. Power Syst. 2017, 32, 1073–1088. [Google Scholar] [CrossRef]
  21. Yin, M.; Xu, Y.; Shen, C.; Liu, J.; Dong, Z.Y.; Zou, Y. Turbine stability-constrained available wind power of variable speed wind turbines for active power control. IEEE Trans. Power Syst. 2017, 32, 2487–2488. [Google Scholar] [CrossRef]
  22. Dai, J.; Tang, Y.; Yi, J. Adaptive gains control scheme for PMSG-based wind power plant to provide voltage regulation service. Energies 2019, 12, 753. [Google Scholar] [CrossRef] [Green Version]
  23. Tian, J.; Zhou, D.; Su, C.; Chen, Z.; Blaabjerg, F. Reactive power dispatch method in wind farms to improve the lifetime of power converter considering wake effect. IEEE Trans. Sustain. Energy 2017, 8, 477–487. [Google Scholar] [CrossRef] [Green Version]
  24. Nath, A.P.; Paul, S.; Rather, Z.H.; Mahapatra, S. Estimation of Offshore Wind Farm Reliability Considering Wake Effect and Wind Turbine Failure. In Proceedings of the 2019 IEEE Innovative Smart Grid Technologies-Asia (ISGT Asia), Chengdu, China, 21–24 May 2019; pp. 3866–3871. [Google Scholar]
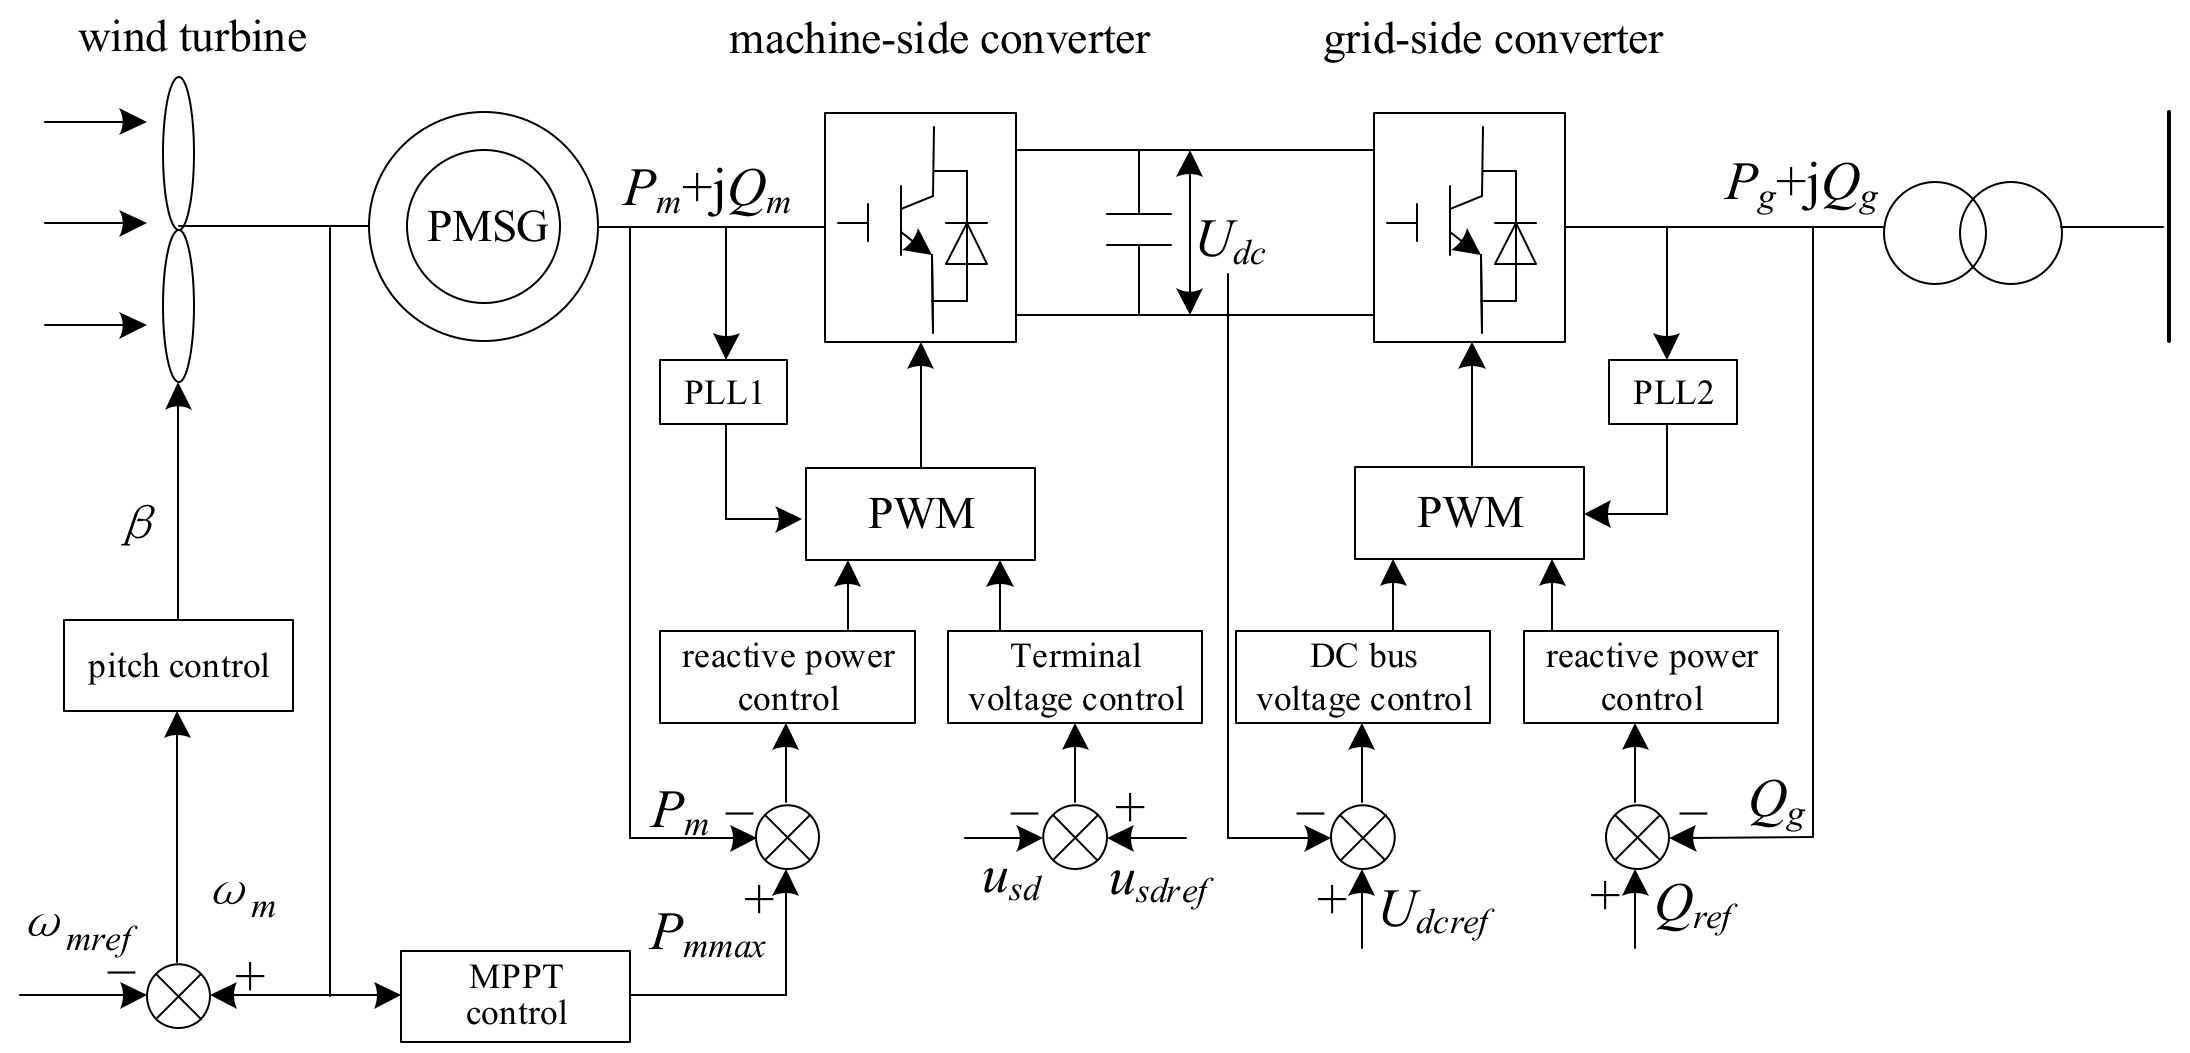
Figure 1. The basic structure of PMSG.
Electronics 11 01766 g001
Figure 2. The characteristic curves of wind energy utilization coefficient, blade tip speed ratio, and a pitch angle.
Electronics 11 01766 g002
Figure 3. The ideal wind speed-power characteristic curve of the PMSG.
Electronics 11 01766 g003
Figure 4. The measured reactive power adequacy of a 2MVA PMSG under the full wind condition.
Electronics 11 01766 g004
Figure 5. (a) Radial structure; (b) The equivalent model. The PMSG-based wind farm.
Electronics 11 01766 g005
Figure 6. The PCC voltage of a wind farm.
Electronics 11 01766 g006
Figure 7. The terminal voltage of the WT.
Electronics 11 01766 g007
Figure 8. The schematic diagram of the Jensen model.
Electronics 11 01766 g008
Figure 9. (a) 0°; (b) −45°; (c) −90°; (d) −135°; (e) 180°. The simulation diagram of wake effect on reactive power adequacy of wind farm.
Electronics 11 01766 g009aElectronics 11 01766 g009b
Figure 10. The control block diagram of the reactive power controller adaptive gain scheme for WT.
Electronics 11 01766 g010
Figure 11. The proposed strategy control block diagram.
Electronics 11 01766 g011
Figure 12. (a) The adaptive gain coefficient of each WT under the three different strategies; (b) The reactive power output of each WT under the three different strategies; (c) The PCC voltage under the three different strategies. The comparison diagram of the three different strategies in Scenario 1.
Electronics 11 01766 g012aElectronics 11 01766 g012b
Figure 13. The input wind speed of each WT in Scenario 2.
Electronics 11 01766 g013
Figure 14. (a) The adaptive gain coefficient of each WT under the three different strategies; (b) The reactive power output of each WT under the three different strategies; (c) The PCC voltage under the three different strategies; The comparison diagram of the three different strategies in Scenario 2.
Electronics 11 01766 g014aElectronics 11 01766 g014b
Figure 15. (a) The average voltage of the PCC under the three different strategies; (b) The sum of active power losses in the wind farm under the three different strategies; (c) The sum of the square of the terminal voltage difference under the three different strategies. The comparison of the indicator calculation results of the three strategies.
Electronics 11 01766 g015aElectronics 11 01766 g015b
Table 2. The related parameters of a 2MVA PMSG.
ParametersValues
Rated apparent power/MVA2
Rated voltage/kV0.69
Stator resistance/p.u.0.0108
Stator leakage reactance/p.u.0.102
Rotor resistance/p.u.0.01
Rotor leakage reactance/p.u.0.11
Inertial time constant/s3
Table 3. The impedance values mentioned in Figure 5b.
ParametersValues
Zt (the equivalent impedances of all WTs’ box-type transformers)/p.u.0.05 + j0.2
Zl (the equivalent impedance of lines between adjacent WTs)/Ω0.045 + j0.24
ZT (the equivalent impedance of the main transformer)/p.u.0.05 + j0.2
Zk (the equal impedance of the transmission line between the wind farm and the power grid)/Ω0.9 + j4.8
Table 4. The contrast indicators’ calculation results of the three different strategies in Scenario 1.
StrategyStrategy 1Strategy 2Strategy 3
Indicators
U ¯ PCC/p.u.0.96920.96410.9685
ΣΔP/MW1.06710.87151.0336
ΣΔU0.048720.045360.04837
Publisher’s Note: MDPI stays neutral with regard to jurisdictional claims in published maps and institutional affiliations.