Abstract
The research study provides a comprehensive bibliometric assessment in the field of Software Testing (ST). The dynamic evolution in the field of ST is evident from the publication rate over the last six years. The research study is carried out to provide insight into the field of ST from various research bibliometric aspects. Our methodological approach includes dividing the six-year time frame into the set of two symmetric but different periods (2016–2018) and (2019–2021) comprising a total of 75,098 records. VOSViewer is used to perform analysis with respect to collaboration network of countries and co-word assessment. Bibliometrix (Studio R) analysis tool is used to evaluate research themes/topics. The year 2019 leads the publication rate whereas a decrement in publication frequency is observed for the years 2020 and 2021. Our research study shows the influence of ST in other research domains as depicted in different research areas. Especially the impact of ST in the Electrical and Electronics Domain is quite notable. Most of the research publications are from the USA and China as they are among the most resourceful countries. On the whole, the majority of the publications are from Asian countries. Collaboration networks amongst countries demonstrate the fact that the higher the collaboration network, the greater would be the research output. Co-word analysis presents the relatedness of documents based on the keywords. The topic dendrogram is generated based on the identified research themes. Although English is the leading language, prominent studies are present in other languages also. This research study provides a comprehensive analysis based on 12 informative research questions
1. Introduction
It has been more than 45 years since the foundation of software engineering (SE) [1]. In 1968, at the NATO Software Engineering Conference the phrase “software engineering” was used for the first time [1,2]. SE refers to the concepts, techniques, and methods or approaches used in the development of software in computer systems [3,4]. The development and implementation of large and sophisticated systems, technical advancements, and the development of sub-areas highlight the significance of the SE field. SE consists of methodologies, processes, and the use of appropriate methods to produce high-quality computer software in the required time frame [5]. SE is defined as a set of procedures (processes) for managing and developing software-intensive systems, either individually or collectively (as a team) [6]. Software engineering as a research approach is distinct from the techniques, methods, and approaches employed in software development [7].
One of the important areas of SE is Software Testing (ST). The set of process activities is specially designed to ensure validity and verifies the software that is being developed so that the software is designed in such a way that it matches the business and technical requirements [8]. In other words, ST regulates the unintended behaviors of the software systems. ST plays a fundamental role in the development life cycle of software [9]. Improper testing can lead to major risks and unexpected outcomes [9]. Because ST is a single strategy to ensure software quality, it consumes most development resources. However, ST is a costly and time-consuming process. As a result, testing should start as soon as possible in the development phase to avoid financial and time constraints. Even so, testing should be carried out at each stage of the software development life cycle [10].
ST is widely classified as functional and non-functional testing [11]. The two types of testing approaches that are widely deployed in the testing world are black-box testing and white-box testing. Both can be found in a variety of software testing procedures. The input and output are the only considerations in black-box testing, which ignores the block’s internal design and functionality. The black-box approach focuses on analyzing the software’s performance in response to a specific input. The white-box approach, on the other hand, focuses on the block’s internal development and performance. It is the goal of the white-box technique to trace and discover all of the paths taken by a given input as it makes its way through the software [12]. Grey-box testing has been explored as a third testing approach in recent years. It is characterized as software testing combined with some understanding of the internal logic and underlying code. It employs internal data structures and algorithms to generate test cases to a greater extent than black-box testing, but not nearly as much as white-box testing [13]. The most common type of ST strategy is Integration testing. This approach is considered when more than one component is integrated into a more prominent model. This is carried out if the quality attribute cannot be accurately assessed from its parts; this testing is frequently performed in the interfaces between the components and the structure produced [13]. Another common type of testing is System Testing, which incorporates analysis based on the whole system’s quality testing. System testing is often functional and requires the specifications of the system [13]. Acceptance testing is carried out when the entire system is turned over to customers or users from the development side. Acceptance testing aims to ensure that the system is operational rather than to identify problems [8]. Unit testing evaluates the foundational unit of software application. It is only one of the testing steps that contribute to the aim of analyzing a system. It is frequently referred to as a white-box test class [13]. Test cases are used to carry out different types of tests [12].
The influence of ST is not only limited to the SE field, but has a vast impact on other areas as well. ST plays a vital role in web and application testing [12], testing of various embedded devices with respect to nuclear power applications [14], applications that are cloud-based [15], and testing of various aspects of smart contracts in blockchain [16], testing IoT applications [17].
ST plays an important role in the development and architectural aspects of software. In both centralized and distributed contexts, the 1 + 5 model has known to be a great framework for the design of enterprise service bus (ESB) as well as the distributed blockchain solutions [18]. This study [18] focuses on the integration aspect to propose an architectural approach for designing solutions that ensures that all parties involved in the communication are aligned. Various ST techniques are involved in Continuous Software Engineering (CSE) which is a new field of study and practice. CSE refers to the rapid development, deployment, and feedback from applications and customers. There are three steps of CSE: business strategy & planning, development, and operations [19]. Continuous Integration, Continuous Delivery, and Continuous Deployment are different aspects of the development phase with respect to CSE. Testing techniques are involved in various applications which require continuous delivery specifically for those applications that are blockchain-based [20]. In the scope of Continuous Delivery and Deployment, live testing is performed to test modifications or new features in the production system. Canary releases, dark launches, A/B tests, and gradual rollouts are all examples of this. Several of these live testing techniques are frequently coupled with each other [21]. The involvement of customers in the testing phase of Continuous Deployment is proposed in the study [19]. For Continuous Integration, the study [19] proposes multiple aspects of ST such as development based on test-driven approaches, planning of multiple tests, testing approaches based on cross-team activity, while decoupling of unit tests from acceptance tests as well as from the functional tests should be practiced. The main purpose of these ST techniques is to ensure the development of software that is thoroughly tested to guarantee that it meets the software requirements and is correctly developed.
The approach of showing and comparing numerous quantifiable facts required for studying evaluation is known as bibliometric assessment [22,23]. Scholars, researchers, and students can benefit from bibliometric analysis by using it to make better decisions in their respective fields based on various characteristics and by using it to spur additional research in areas where it is needed.
In addition to the powerful tools, the introduction of scientific databases such as Web of Science has allowed the acquisition of massive data to undertake a thorough bibliometric study. VOSViewer and Bibliometrix(R studio) are the two most commonly used platforms that allow to execute quantitative analysis and create a map of all scientific knowledge
Section 1 of our research study deals with the introduction, whereas Section 2 presents related work. The methodology is discussed in Section 3. Research findings and discussion constitute Section 4. Section 5 briefly states the future work and limitations of our study, whereas the conclusion is presented in Section 6. Finally, references are presented in the last section.
2. Related Work
The eminent research studies in the field of SE are summarized on the basis of parameters analyzed, time frames, and data sources as depicted in Table 1. To the best of our knowledge, the Software Testing field lacks such a comprehensive bibliometric assessment. Hence, all the related work presented in Table 1 belongs to the Software Engineering field. The details to be placed in Table 1 are carefully designed to provide a concise and easily understandable picture of the work presented in the included research studies. Our prominent contributions are listed in Table 2.

Table 1.
Significant bibliometric work in the field of Software Engineering.
Table 2.
The significant contribution of our research study.
3. Methodology
This section presents a complete methodological process followed in our research work.
3.1. Creation of Two Distinguished Datasets for Two Different Time Spans
In order to conduct the bibliometric assessment, Web of Science (WoS) is used to acquire our required dataset for the years 2016–2021. The dataset is acquired from the WoS Core Collection. The ISI WoS is one of the most commonly used electronic databases provided by Thomson Scientific’s Institute for Scientific Information [33] to perform bibliometric assessment which is also evident from Table 1. The initial dataset comprised 210,640 records for the query (Software AND Testing). However, refinement on the basis of topic is performed by selecting the topic while giving “Software AND Testing” as input in the query field. This is to ensure that all the articles included in the dataset are relevant to the topic of ST. Further refinement of datasets is carried out on the basis of inclusion/exclusion criteria as presented in Table 3. A complete methodological process is shown in Figure 1 for the formation of two distinguished data sets having 35,161 records for the years 2016–2018 and 39,937 records for the time frame 2019–2021.
Table 3.
The inclusion/exclusion criteria for the creation of datasets.
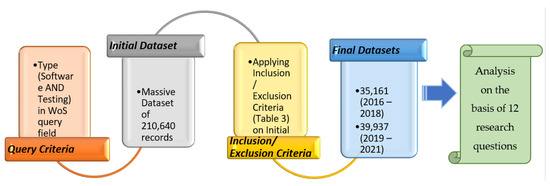
Figure 1.
Methodological Process for extracting the two final datasets (2016–2018 and 2019–2021).
3.2. Research Questions for the Analysis of Datasets
After extracting the dataset, this dataset is analyzed in accordance with the research questions. The connection between our research questions is our underlying research objective to find insights into the field of Software Testing with respect to various diverse aspects of bibliometric evaluation. We perform the analysis so as to determine and analyze the findings of the research questions such as the type of research documents, the year-wise rate of publications, the languages used as a medium to publish research studies, top 20 countries, and top 20 organizations based on these research studies, research areas, research themes, topic dendrogram used in conjunction with ST, the relatedness of documents in terms of co-word, and the impact of collaboration amongst countries in terms of the frequency of publications. Table 4 represents the analysis criteria for the two phases 2016–2018 and 2019–2021 in terms of formulated research questions. We have used built-in tools of the ISI Web of Science (WoS) database to evaluate Q1, Q3–Q9. VOSviewer is used as a visualization tool to map the findings related to Q10 and Q11. VOSviewer is a program that enables users to create maps based on network data and then visualize and explore them. VOSviewer is primarily meant for facilitating bibliometric assessment [34]. Bibliometrix is an app based on R which is used for the analysis of multiple aspects of bibliometrics. In our research work, we use this tool to perform various evaluations related to Q12 and Q2.
Table 4.
Research questions to analyze datasets for 2016–2018 and 2019–2021.
4. Research Findings
This section deals with the research findings and a comprehensive discussion regarding the results of the research questions.
4.1. Year-Wise Scientific Production
Based on our research query, the two distinct time spans 2016–2018 and 2019–2021 are used to perform the analysis. Yearly productions shown in (Figure 2) represents the publication trend in the ST field over the last six years in accordance with the aforementioned time lapse. Yearly scientific production shows the scientific contributions in terms of research articles published over the indicated time spans. The highlighted year 2019 shows that it has the greatest number of publications.
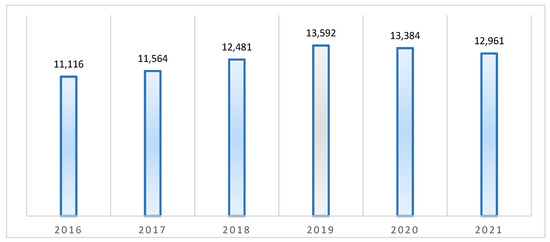
Figure 2.
Year-wise publication trend based on record count of publications for 2016–2021.
The publication trend solidifies the Software Testing field’s position as one of the most well-established fields which are represented by the number of publications for the time frame 2016–2021. From 2016–2018, an upward trend in the frequency of publications is observed. The year 2019 records the highest number of publications. However, a decline in the frequency of publications is noted in 2020 and 2021. COVID-19 may be one of the causes of this decline.
4.2. Top 20 Publication Venues
The top 20 publication venues (sources of publications) for the two different time frames are shown in Figure 3 and Figure 4. Figure 3 represents the top 20 publication venues for the time frame 2016–2018. During this time frame (2016–2018), the data set comprises a total of 12,090 publication venues whereas the total number of publication venues for 2019–2021 added up to 10,558. Figure 3 consists of more than 20 entries because multiple publication venues have the same number of publications, so they occupy the same position in the top 20. The darker the blue color is (in both the figures: Figure 3 and Figure 4), the greater the number of publications these sources (publication venues) have.
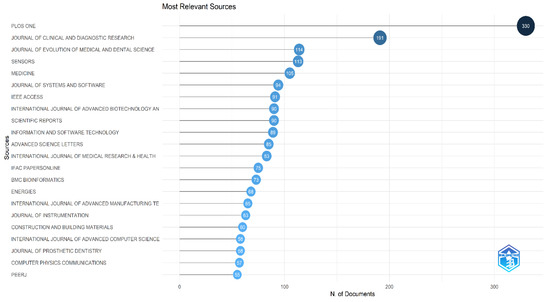
Figure 3.
Top 20 most relevant sources of publications with respect to the publication count for the time frame 2016–2018.
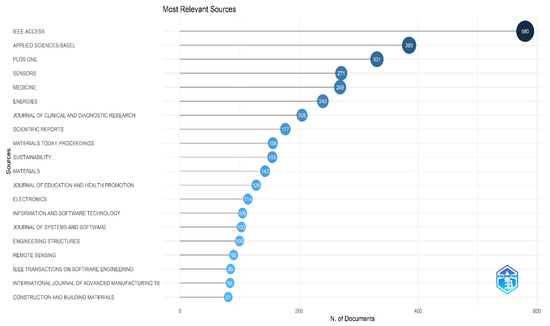
Figure 4.
Top 20 most relevant sources of publications with respect to the publication count for the time frame 2019–2021.
4.3. Types of Documents
Figure 5 represents the types of documents that belong to the two distinguished datasets. It is to be noted that a single research study tends to be a part of more than one type of document. To elaborate on this, a research study can be classified as an article as well as the proceeding’s papers. Articles comprise a major portion of these publications.
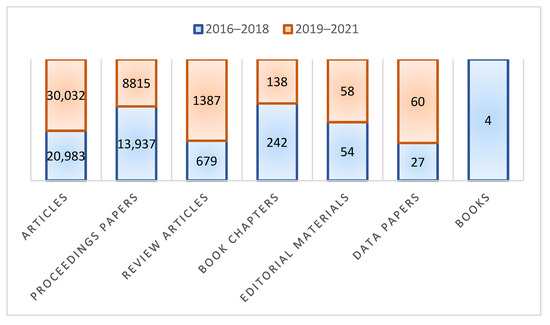
Figure 5.
Types of Documents published during time spans 2016–2018 and 2019–2021.
4.4. Top 20 Web of Science Categories Based on the Publications Count
Findings on the basis of the top 20 categories of WoS for the years 2016–2018 and 2019–2021 are depicted in Table 5 and Table 6. WoS categories are journal-based, where each WoS category is mapped to one Research Area.
Table 5.
Top 20 WoS Categories based on record count of publications (2016–2018).
Table 6.
Top 20 WoS Categories based on record count of publications (2019–2021).
The influence of Software Testing across multiple disciplines is evident by the various distinct WoS categories such as Telecommunications, Mechanical Engineering, Multidisciplinary Engineering, Multidisciplinary Materials Science, Energy Fuels, Automation Control Systems, Civil Engineering, Multidisciplinary Sciences, General Internal Medicine, Applied Physics, Educational Research, Instrumentation, Environmental Sciences, Dentistry and Oral Surgery Medicine, and Radiology Nuclear Medical Imaging. The software developed in these fields requires Software Testing to provide validation and verification in accordance with the requirements of the software.
4.5. Top 20 Research Areas in Accordance with the Record Count of Publications
Research areas are article-based. The Research Area depicts the research areas present within a particular document. As a result, one can recognize, retrieve and evaluate documents from multiple databases that belong to the same subject. Table 7 and Table 8 represent the top 20 research areas extracted from the two datasets (2016–2018) and (2019–2021). These research areas depict that the impact of Software Testing encompasses many variant areas, thus solidifying ST’s reputation as a field with strong multi-disciplinary impact.
Table 7.
Top 20 Research Areas based upon record count of the publications (2016–2018).
Table 8.
Top 20 Research Areas based upon record count of the publications (2019–2021).
This feature represents that the application of ST is not only limited to Computer Science or Engineering fields, but ST plays an important role in the validation and verification of various other fields such as Medical, Education, Physics, Optics, Mathematics, Business Economics, Biochemistry Molecular Biology, Radiology Nuclear Medicine Medical Imaging, Chemistry, Environmental Sciences, Energy Fuels, Pharmacology, Automation Control Systems, and Construction Technology. Thus, the importance and impact of ST encompass multiple disciplinary areas which represent that the techniques, processes, methods, and approaches of ST are applicable in designing the application software related to other fields to confirm that the developed application is in accordance with the technical and customer requirements.
4.6. Leading 20 Institutions/Organizations Based on the Frequency of Publications
The top 20 institutions based on the publication count for two different time frames, 2016–2018 and 2019–2021, are depicted in Table 9 and Table 10. This assessment criterion helps scholars to identify the most contributing institutions/organizations in terms of research count in the field of ST for a period of the last six years.
Table 9.
Top 20 Institutions/Organizations based on the number of publications for the years (2016–2018).
Table 10.
Top 20 Institutions/Organizations based on the number of publications for the years (2019–2021).
Throughout both the time frames, we analyzed that most publications were contributed by scholars having an affiliation with the Islamic Azad University, Iran. However, the USA leads in the number of institutions/organizations present in the top 20, followed by Iran, China, France, and India. The number of institutions/organizations in Table 9 and Table 10 belonging to a specific country is shown in Figure 6 and Figure 7 below.
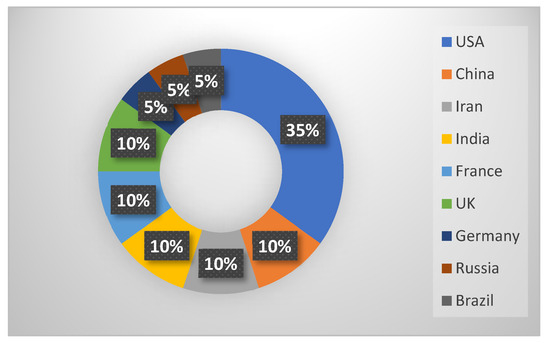
Figure 6.
Total number of institutions/organizations belonging to a specific country based on the top 20 institutions/organizations for the years (2016–2018).
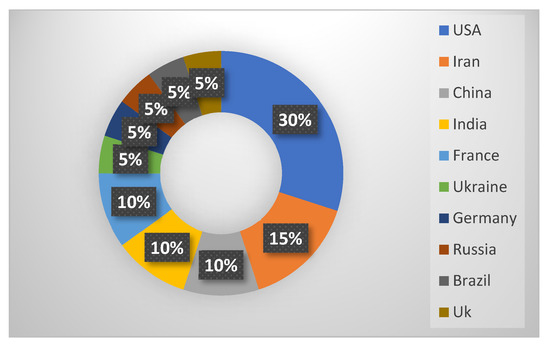
Figure 7.
Total number of institutions/organizations belonging to a specific country based on the top 20 institutions/organizations for the years 2019–2021.
4.7. The Top 20 Most Actively Contributing Countries Based on the Frequency of Publications
The top 20 countries in terms of research publication count are shown in Table 11 and Table 12. These tables present the variation in research contributions by countries for the time frames 2016–2018 and 2019–2021. The tables (Table 11 and Table 12) are a key factor in representing the most actively participating countries in the research area of ST over the last six years with respect to the number of publications. It is to be noted that in the case of multi-authored documents, contributions of all countries based upon authors’ affiliations are considered.
Table 11.
Top 20 Countries based on the number of publications (2016–2018).
Table 12.
Top 20 Countries based on the number of publications (2019–2021).
The results of Table 11 and Table 12 state that the USA and China show more significant contributions than the rest of the countries as they are more developed and financially more strong countries. However, the results suggest that more Asian countries are participating in research activities as confirmed by the results based on continent-wise research contributions for the years 2019–2021 as compared to the years 2016–2018. For the timeline 2016–2018, the number of Asian countries and European countries occupying a position in the top 20 actively participating countries in accordance with a record count of publications is eight, whereas for the time span (2019–2021), this number of Asian countries has increased from eight to nine.
4.8. Continent-Wise Research Contribution
The continent-wise research contribution as per the record count of published studies is shown in Figure 8 and Figure 9 for the years 2016–2018 and 2019–2021. It is to be noted that in the case of multi-authored documents, contributions of all countries based upon authors’ affiliations are considered.
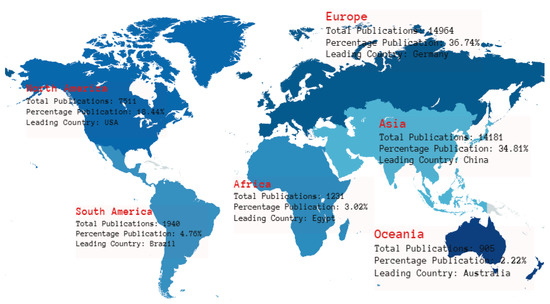
Figure 8.
Continent-wise research contributions for the years (2016–2018).
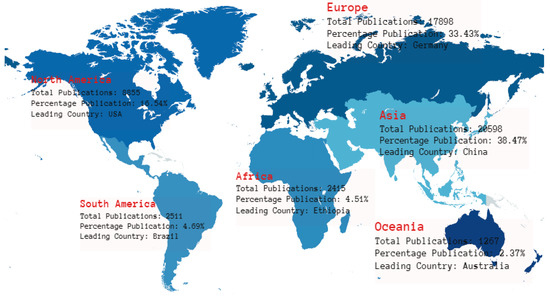
Figure 9.
Continent-wise research contributions for the years (2019–2021).
It is evident from the figures (Figure 8 and Figure 9) that for the time frame (2016–2018), Europe was leading as the continent which makes the most research contributions with respect to the number of publications. During this time frame, Asia was the second most contributing continent as far as the research aspect is concerned in the field of ST relative to the number of publications. However, for the time duration (2019–2021), Asia contributed the most in terms of research publications in the field of ST, with Europe contributing to research publications in the second place in ST. The rise in the number of published articles from Africa and Australia is also evident. The publication contribution of Asian countries has a significant rise from approx. 34% to approx. 38% of the total published scholarly studies.
4.9. Language of the Publications
This research criterion represents the diversity in the ST in terms of the medium of publication. Table 13 and Table 14 show the analysis of languages in our research area during the two different time frames of 2016–2018 and 2019–2021. It is to be noted that all those languages which have the same number of publications occupy the same position.
Table 13.
Languages used as a medium for publications (2016–2018) for which publication count is >1.
Table 14.
Languages used as a medium for publications (2019–2021) for which publication count is >1.
English is found to take about 99 percent of the complete pool of the value work included in our research study. The conclusions that are drawn from the table show us that the contributions of the researchers in different languages are significant. The articles published in languages other than English facilitate the researchers in disseminating the knowledge to non-English speakers. Other than English, facts show there are a good number of research publications in Spanish, Portuguese, Chinese, Russian, Turkish, German, French, and Korean that cannot be neglected. Considering the following results, we have to include languages other than English for our research query to perform bibliometric analysis. WoS provides a built-in feature to classify papers based upon the languages with respect to the particular research query.
4.10. Collaboration Network amongst Countries
The frequency of collaboration varies widely according to the scientific topic and discipline. Collaboration is very crucial for quality and timely research study in any field [23]. We used VOSviewer to conduct our study survey because it allows us to examine collaborative networks between countries. The circular elements (referred to as nodes) in VOSviewer represent a unit of analysis, and lines between nodes indicate that the respective two nodes collaborated on a research study. The weight of nodes is reflected in the size of the nodes. The weight of a node increases as its size increases. Greater weights, in this situation, indicate more collaboration for that specific country. Countries associated with each other very closely in terms of research studies belong to the same cluster and result in the formation of multiple co-authored research documents. Research Associativity is not only limited to intra-cluster collaboration, but is also extended to inter-cluster collaboration. However, the intra-cluster constitutes the countries collaborating with each other in a much more frequent manner. For the dataset 2016–2018 and 2019–2021, the minimum number of documents per country is selected to be 1. This results in a total of 169 countries for the dataset 2016–2018, whereas it results in 176 countries for the dataset 2019–2021. However, to enhance visibility, the top 20 countries are selected to represent the research collaboration network as shown in Figure 10 and Figure 11 for the time spans 2016–2018 and 2019–2021 respectively.
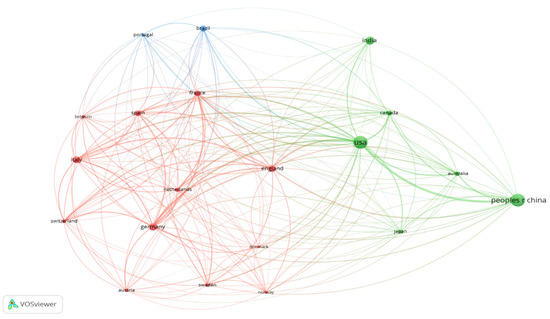
Figure 10.
Research collaboration network amongst the top 20 countries in terms co-authored documents (2016–2018).
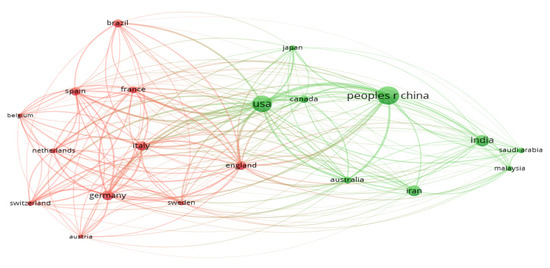
Figure 11.
Research collaboration network amongst top 20 countries in terms co-authored documents (2019–2021).
The results also state that collaboration plays a vital role in enhancing countries’ research outputs. Two of the most prominent countries from publications have the largest collaboration networks. These collaborations pave way for conducting timely research. Countries belonging to one cluster tend to collaborate more frequently than those belonging to other clusters
4.11. Correlation of Documents on the Basis of Co-Words
Co-word analysis is the method that is used to see the pattern of co-occurrence of keywords in a dataset [35]. Co-word analysis signifies the connections between the articles based on the occurrence of the keyword [23]. Figure 12 and Figure 14 represent word clouds using bibliometrix (Studio R) comprising the top 50 most common keywords for the years 2016–2018 and 2019–2021 respectively. However, from the visibility point of view, only the top 20 keywords are used for co-word analysis in the form of network visualization by using VOSViewer as shown in Figure 13 and Figure 15 for the years 2016–2018 and 2019–2021, respectively. We have used the full counting method to create a keywords co-occurrence map. Keywords in the same cluster allude to themes that are similar or connected. In the evaluation of the top 20 keywords, the total link for all keywords is 19, indicating that each keyword is related to every other keyword. Each item has a link that indicates the co-occurrence of two words. The total number of times each keyword appears in each of the three clusters is displayed in Table 15 and Table 16.
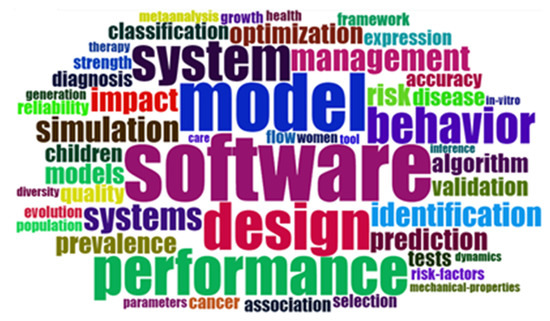
Figure 12.
Word Cloud comprising top 50 most common words for the years 2016–2018.
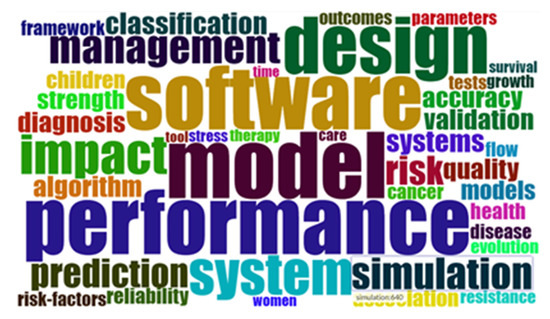
Figure 14.
Word Cloud comprising top 50 most common words for the years 2019–2021.
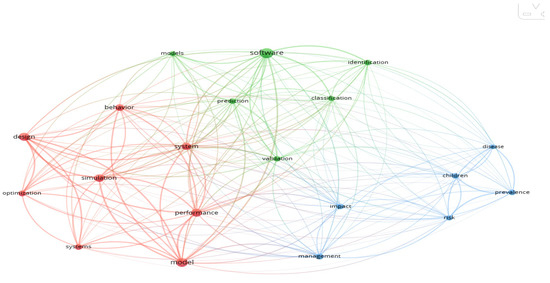
Figure 13.
Co-word analysis constituting the top 20 keywords for the time duration (2016–2018).
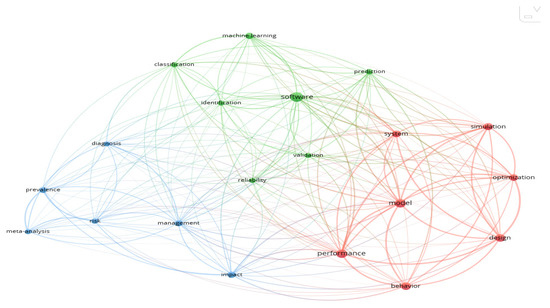
Figure 15.
Co-word analysis consisting of top 20 keywords for the time duration (2019–2021).
Table 15.
Number of occurrences of top 20 Keywords in each cluster for the years (2016–2018).
Table 16.
Number of occurrences of top 20 Keywords in each cluster for the years (2019–2021).
All the co-words that are more frequently used with one another are presented in one cluster. These clusters provide a ground for the identification of research themes/topics. For cluster 1, the word with highest number of occurrences for the time spans 2016–2018 is “model” and for 2019–2021 is “performance”. For cluster 2, the term “software” is the most common terminology for both the time spans. Cluster 3 shows that for the time frame 2016–2018, the term which has the highest occurrences is “management” and for the time duration 2019–2021 it is “impact”. Table 15 and Table 16 depict that the keywords which belong to cluster 1 generally have a greater number of occurrences as compared to the other two clusters. Furthermore, it also highlights the fact that any software that is being developed or is under development is incomplete without Software Testing as the keyword “Software” has the highest weight (Figure 13 and Figure 15) and the number of occurrences (Table 15 and Table 16) in the publications related to the field of ST.
4.12. Research Themes/Topics
Using co-occurrence networks or co-word assessment, conceptual structure elucidates the connections among themes, subjects, and trends. It is the only approach that makes use of actual research findings. As a result, a study unit is a concept, term, or subject discovered in the network as a whole. To perform this analysis, we have used bibliometrix (R studio).
A two-dimensional diagram known as a “thematic map” depicts typological patterns [36]. The co-word analysis identifies keyword clusters, which in turn generate themes for research topics as shown in Figure 16 and Figure 17 for the years (2016–2018) and (2019–2021) respectively. These themes can be divided into four quadrants on a two-dimensional graph on the basis of their density and centrality, which are the two dimensions of the graph. A bubble represents a theme on the map. including the first quarter (top right area): motor themes, a significant research concept that is getting momentum; The second quarter (top left area) contains highly evolved and isolated elements that have been well developed but are currently niche research issues; emerging theme in the third quarter (bottom left area): contains a study topic that has recently emerged or is on the verge of disappearing. The fourth quarter (bottom right side) contains the following information: basic elements, which are critical to the area, have not been extensively developed and often allude to major research topics [37]. Correspondence Analysis (CA) is a multivariate graphical tool that is used to investigate correlations between category data as shown in Figure 18 and Figure 19 for the two respective timelines (2016–2018 and 2019–2021). The hierarchical order and connectivity between the keywords created by the hierarchical classification are represented by the topic dendrogram is represented in Figure 20 and Figure 21 for the time spans 2016–2018 and 2019–2021.
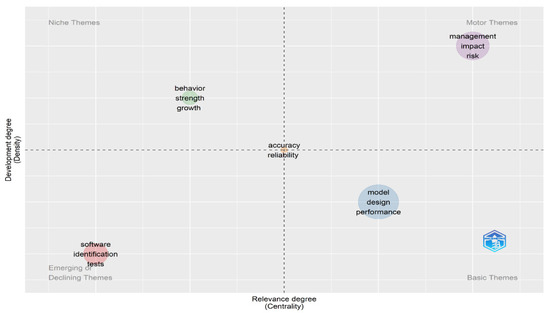
Figure 16.
Thematic Map for the years (2016–2018).
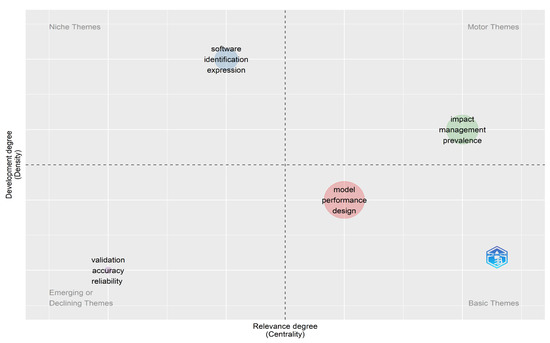
Figure 17.
Thematic Map for the years 2019–2021.
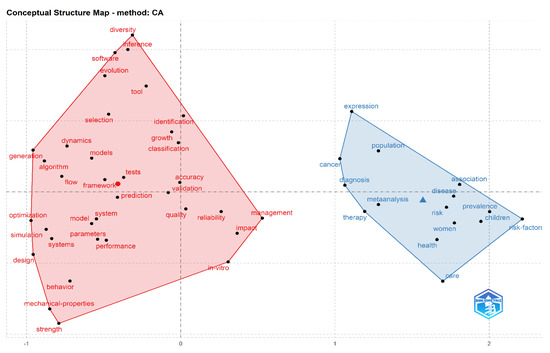
Figure 18.
Conceptual Structure Map representing clusters of research themes on the basis of correspondence analysis for the years 2016–2018.
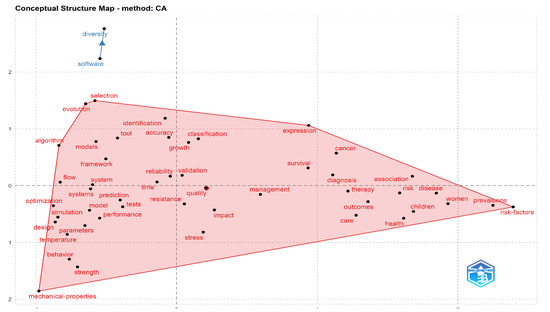
Figure 19.
Conceptual Structure Map representing clusters of research themes on the basis of correspondence analysis for the years 2019–2021.
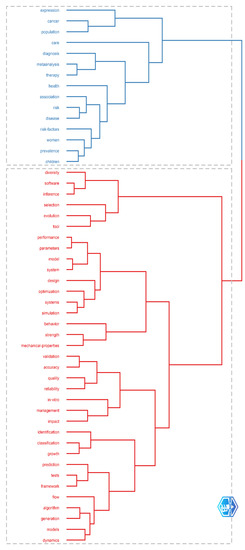
Figure 20.
Topic Dendrogram for the years 2016–2018.
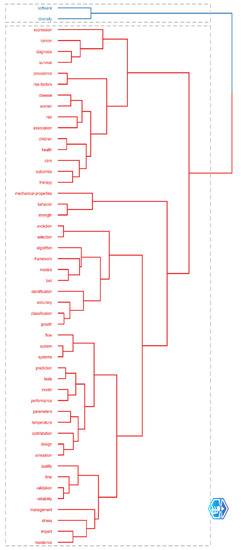
Figure 21.
Topic Dendrogram for the years 2019–2021.
In this data, the red and blue clusters are shown in Figure 18 and Figure 19. Words that are related to one another are found in each cluster. The red areas in the images (Figure 18 and Figure 19) reveal a greater number of different terms that are related to each other. This demonstrates that many research publications are linked based on the words given in these clusters.
Topic dendrograms (Figure 20 and Figure 21) depict the most commonly used topics, their relationships with other topics, and the classification of these topics in various colors. The majority of the topics come under a single cluster due to frequent relatedness amongst them which is shown by the red color in Figure 20 and Figure 21. This also demonstrates that the themes in the blue classification have little in common with those in the red classification. Each of them is then split into many groups, each group into many sub-groups, and so on till the topic is used, at which point numerous topics are included in one group, showing a connection between the two topics in research publications in the field of Software Testing.
5. Future Work and Limitations of the Research Study
5.1. Future Work
In future research, we intend to include databases such as Scopus, PubMed, and others besides the Web of Science. Moreover, in the future, we tend to perform detailed analyses on authors with respect to Software Testing. Analysis of various aspects of bibliometric assessment with respect to citations is out of the scope of this article but is intended to be carried out in the future. Although our research study itself is quite comprehensive, more search questions to uncover other bibliometric aspects of Software Testing would be covered in the future.
5.2. Limitations of the Study
- Limited Time Frame: We have included the research publications for the six-year timeframes of the WoS database 2016–2021. Therefore, the paper does not include the research studies for the time duration before 2016.
- Limitations of sub-domain of SE: We have a limited or bibliometric assessment on Software Testing only. However, there are many other sub-domains of Software Engineering that need to be analyzed in future works.
- Use of ISI Web of Science (WoS): We have used one of the most commonly used and highly privileged databases, which is ISI Web of Science. Other databases can also be used.
- Twelve research questions: Analysis on the basis of 12 research questions can be enhanced to include other bibliometric assessment parameters.
6. Conclusions
In this research paper, we have analyzed 75,098 publications from 2016 to 2021 in accordance with twelve research questions. Our research study represents the variation over two distinguished time frames (2016–2018 and 2019–2021) in different aspects of bibliometric assessment for Software Testing. Our findings suggest that the influence of Software Testing is not only limited to the Engineering and Computer Science field but spans multidisciplinary areas such as Medicine, Energy, Physics, Chemistry, and Environmental Sciences. The research publication trend shows an upward result from 2016–2019, where the year 2019 has the maximum number of publications. One of the possible reasons for the decline in the publication count for the years 2020 and 2021 could be the side effects of COVID-19.
The analysis of the top 20 institutions/organizations reveals that 35% of these institutions/organizations belong to the USA for the time frame 2016–2018, but this number is reduced to 30% for the time span 2019–2021. The rise in the number of Asian institutes/organizations is also observed when the two time frames are compared. For the years 2016–2018, the number of Asian institutes/organizations which are part of the leading 20 research institutions/organizations in terms of publications is six, but it has increased to seven for the years 2019–2021.
The USA and China have emerged as the top two leading countries from a research perspective for both the time frames. The record count of the published scholarly works has also increased from approximately 34.81% to approximately 38.47% for Asian countries with respect to the top 20 countries. However, Asia on the whole is the leading research contributor based on the publication count for the time frame (2019–2021).
Collaboration among the countries affirms the fact that a larger collaboration network plays a role in timely research production. USA and China are the two countries that have larger collaboration networks based on co-authored documents. Moreover, the clusters of collaboration networks state that although countries belonging to the same cluster frequently collaborate with each other, both inter-cluster and intra-cluster collaboration is carried out.
The findings of the publication medium state that although English has a major contribution as the medium of the published articles, qualitative articles are also published in languages other than the English language.
Co-word occurrence plays a vital role in not only depicting the relatedness amongst documents, but also forming the basis of various thematic analyses as shown in our study. The keyword “Software” has the greatest number of occurrences which shows that Software Testing plays a vital role in the development of Software. The topic dendrogram specifically represents the hierarchical relationship that exists amongst various themes.
The top 20 most relevant sources represent the 20 most contributing publication venues in terms of publication count. This factor further highlights the fact that Software Testing is a field that has impact and uses in other multi-disciplinary areas.
We can conclude that to the best of our knowledge, our comprehensive research study in the Software Testing domain is the first one of its kind.
Future research plans include incorporating databases like Scopus, PubMed, and others, not just Web of Science. Software testing will be analyzed in greater detail in the future, as well. Out of the scope of this article, but planned for the future, is an investigation into bibliometric assessment of citations.
Author Contributions
Conceptualization, S.A. and S.Z.; Methodology, S.A., M.M.u.R., A.F.K.M. and M.S.A.R.; Software, S.A., M.M.u.R. and A.F.K.M.; Validation, S.A., H.A.A.S., M.S.A.R. and A.S.; Formal Analysis, S.A., S.Z., A.S. and H.M.; Investigation, S.A., M.M.u.R. and A.F.K.M.; Resources, S.A., M.S.A.R. and H.M.; Data Curation, S.A., S.Z., M.M.u.R. and A.F.K.M.; Writing—original draft preparation, S.A., M.M.u.R., A.F.K.M. and H.A.A.S.; Writing—review and editing, S.A., S.Z., H.A.A.S., M.S.A.R., A.S. and H.M.; Visualization, S.A., S.Z., M.M.u.R. and A.F.K.M. All authors have read and agreed to the published version of the manuscript.
Funding
The authors are thankful to the Deanship of Scientific Research at Najran University for funding this work under the Research Collaboration Funding program grant code (NU/RC/SERC/11/7).
Conflicts of Interest
The authors declare that they have no conflict of interest to report regarding the present study.
References
- Garousi, V. A bibliometric analysis of the Turkish software engineering research community. Scientometrics 2015, 105, 23–49. [Google Scholar] [CrossRef]
- Galler, B.A. ACM president’s letter: NATO and software engineering? Commun. ACM 1969, 12, 301. [Google Scholar] [CrossRef]
- Johnson, P.; Ekstedt MJacobson, I. Where’s the theory for software engineering? IEEE Softw. 2012, 29, 96. [Google Scholar] [CrossRef]
- Alam, S.; Zardari, S.; Bano, M. Software engineering and 12 prominent sub-areas: Comprehensive bibliometric assessment on 13 years (2007–2019). IET Softw. 2021, 16, 125–145. [Google Scholar] [CrossRef]
- Roger, S.P.; Bruce, R.M. Software Engineering: A Practitioner’s Approach; McGraw-Hill Education: New York, NY, USA, 2005. [Google Scholar]
- Wasserman, A.I. Software engineering issues for mobile application development. In Proceedings of the FSE/SDP Workshop on Future of Software Engineering Research, Santa Fe, NM, USA, 7–8 November 2010; Association for Computing Machinery: New York, NY, USA, 2010; pp. 397–400. [Google Scholar]
- Gregg, D.G.; Kulkarni, U.R.; Vinzé, A.S. Understanding the Philosophical Underpinnings of Software Engineering Research in Information Systems. Inf. Syst. Front. 2001, 3, 169–183. [Google Scholar] [CrossRef]
- Singh, S.K.; Singh, A. Software Testing; Vandana Publications: Lucknow, India, 2012. [Google Scholar]
- Garousi, V.; Zhi, J. A survey of software testing practices in Canada. J. Syst. Softw. 2013, 86, 1354–1376. [Google Scholar] [CrossRef]
- Jindal, T. Importance of Testing in SDLC. Int. J. Eng. Appl. Comput. Sci. 2016, 1, 54–56. [Google Scholar] [CrossRef]
- Tan, T.B.; Cheng, W.K. December. Software testing levels in internet of things (IoT) architecture. In International Computer Symposium; Springer: Singapore, 2018; pp. 385–390. [Google Scholar]
- Hamza, Z.; Hammad, M. Testing Approaches for Web and Mobile Applications: An Overview. Int. J. Comput. Digit. Syst. 2020, 9, 657–664. [Google Scholar] [CrossRef]
- Chauhan, R.K.; Singh, I. Latest research and development on software testing techniques and tools. Int. J. Curr. Eng. Technol. 2014, 4, 2368–2372. [Google Scholar]
- Jayakumar, A.V.; Gautham, S.; Kuhn, R.; Simons, B.; Collins, A.; Dirsch, T.; Kacker, R.; Elks, C. Systematic software testing of critical embedded digital devices in nuclear power applications. In Proceedings of the 2020 IEEE International Symposium on Software Reliability Engineering Workshops (ISSREW), Coimbra, Portugal, 12–15 October 2020; IEEE: Piscataway Township, NJ, USA, 2020; pp. 85–90. [Google Scholar]
- Nurul, M.; Quadri, S.M.K. Software Testing Approach for Cloud Applications (STACA)–Methodology, Techniques & Tools. In Proceedings of the 2019 9th International Conference on Cloud Computing, Data Science & Engineering (Confluence), Noida, India, 10–11 January 2019; IEEE: Piscataway Township, NJ, USA, 2019; pp. 19–25. [Google Scholar]
- Sanchez-Gomez, N.; Torres-Valderrama, J.; Garcia-Garcia, J.A.; Gutierrez, J.J.; Escalona, M.J. Model-Based Software Design and Testing in Blockchain Smart Contracts: A Systematic Literature Review. IEEE Access 2020, 8, 164556–164569. [Google Scholar] [CrossRef]
- Murad, G.; Badarneh, A.; Qusef, A.; Almasalha, F. Software testing techniques in iot. In Proceedings of the 2018 8th International Conference on Computer Science and Information Technology (CSIT), Amman, Jordan, 11–12 July 2018; IEEE: Piscataway Township, NJ, USA, 2018; pp. 17–21. [Google Scholar]
- Górski, T. The 1+5 Architectural Views Model in Designing Blockchain and IT System Integration Solutions. Symmetry 2021, 13, 2000. [Google Scholar] [CrossRef]
- Shahin, M.; Babar, M.A.; Zhu, L. Continuous Integration, Delivery and Deployment: A Systematic Review on Approaches, Tools, Challenges and Practices. IEEE Access 2017, 5, 3909–3943. [Google Scholar] [CrossRef]
- Górski, T. Continuous Delivery of Blockchain Distributed Applications. Sensors 2021, 22, 128. [Google Scholar] [CrossRef] [PubMed]
- Schermann, G.; Schöni, D.; Leitner, P.; Gall, H.C. Bifrost: Supporting continuous deployment with automated enactment of multi-phase live testing strategies. In Proceedings of the 17th International Middleware Conference, Trento, Italy, 12–16 December 2016; pp. 1–14. [Google Scholar]
- Merigó, J.M.; Yang, J.-B. A bibliometric analysis of operations research and management science. Omega 2017, 73, 37–48. [Google Scholar] [CrossRef]
- Alam, S.; Zardari, S.; Shamsi, J. Comprehensive three-phase bibliometric assessment on the blockchain (2012–2020). Libr. Hi Tech 2022. [Google Scholar] [CrossRef]
- Tse, T.; Chen, T.; Glass, R.L. An assessment of systems and software engineering scholars and institutions (2000–2004). J. Syst. Softw. 2006, 79, 816–819. [Google Scholar] [CrossRef][Green Version]
- Wohlin, C. An analysis of the most cited articles in software engineering journals—1999. Inf. Softw. Technol. 2005, 47, 957–964. [Google Scholar] [CrossRef]
- Wong, W.E.; Tse, T.; Glass, R.L.; Basili, V.R.; Chen, T. An assessment of systems and software engineering scholars and institutions (2002–2006). J. Syst. Softw. 2009, 82, 1370–1373. [Google Scholar] [CrossRef][Green Version]
- Hamadicharef, B. Scientometric study of the IEEE transactions on software engineering 1980–2010. In Proceedings of the 2011 2nd International Congress on Computer Applications and Computational Science, Bali, Indonesia, 15–17 November 2011; Springer: Berlin, Heidelberg, 2012; pp. 101–106. [Google Scholar]
- Freitas, F.G.D.; Souza, J.T.D. Ten years of search based software engineering: A bibliometric analysis. In International Symposium on Search Based Software Engineering; Springer: Berlin/Heidelberg, Germany, 2011; pp. 18–32. [Google Scholar]
- Garousi, V.; Mäntylä, M.V. Citations, research topics and active countries in software engineering: A bibliometrics study. Comput. Sci. Rev. 2016, 19, 56–77. [Google Scholar] [CrossRef]
- Karanatsiou, D.; Li, Y.; Arvanitou, E.-M.; Misirlis, N.; Wong, W.E. A bibliometric assessment of software engineering scholars and institutions (2010–2017). J. Syst. Softw. 2018, 147, 246–261. [Google Scholar] [CrossRef]
- Almaliki, M. Software Engineering in Saudi Arabia: A Bibliometric Assessment. IEEE Access 2021, 9, 17245–17255. [Google Scholar] [CrossRef]
- Wong, W.E.; Mittas, N.; Arvanitou, E.M.; Li, Y. A bibliometric assessment of software engineering themes, scholars and institutions (2013–2020). J. Syst. Softw. 2021, 180, 111029. [Google Scholar] [CrossRef]
- Mikki, S. Comparing Google Scholar and ISI Web of Science for Earth Sciences. Scientometrics 2009, 82, 321–331. [Google Scholar] [CrossRef]
- Van Eck, N.J.; Waltman, L. VOSviewer Manual; Univeristeit Leiden: Leiden, The Netherlands, 2013; Volume 1, pp. 1–53. [Google Scholar]
- Ravikumar, S.; Agrahari, A.; Singh, S.N. Mapping the intellectual structure of scientometrics: A co-word analysis of the journal Scientometrics (2005–2010). Scientometrics 2014, 102, 929–955. [Google Scholar] [CrossRef]
- Cobo, M.J.; López-Herrera, A.G.; Herrera-Viedma, E.; Herrera, F. Science mapping software tools: Review, analysis, and cooperative study among tools. J. Am. Soc. Inf. Sci. Technol. 2011, 62, 1382–1402. [Google Scholar] [CrossRef]
- Wang, J.; Li, X.; Wang, P.; Liu, Q. Bibliometric analysis of digital twin literature: A review of influencing factors and conceptual structure. Technol. Anal. Strat. Manag. 2022, 1–15. [Google Scholar] [CrossRef]


Publisher’s Note: MDPI stays neutral with regard to jurisdictional claims in published maps and institutional affiliations. |
© 2022 by the authors. Licensee MDPI, Basel, Switzerland. This article is an open access article distributed under the terms and conditions of the Creative Commons Attribution (CC BY) license (https://creativecommons.org/licenses/by/4.0/).