Article

Electrocardiogram Signal Classification Based on Mix Time-Series Imaging

Department of Computer Science, Shantou University, Shantou 515041, China
*
Author to whom correspondence should be addressed.
Electronics 2022, 11(13), 1991; https://doi.org/10.3390/electronics11131991
Submission received: 25 May 2022 / Revised: 19 June 2022 / Accepted: 19 June 2022 / Published: 24 June 2022
(This article belongs to the Special Issue Machine Learning in Big Data)

Abstract

:
Arrhythmia is a significant cause of death, and it is essential to analyze the electrocardiogram (ECG) signals as this is usually used to diagnose arrhythmia. However, the traditional time series classification methods based on ECG ignore the nonlinearity, temporality, or other characteristics inside these signals. This paper proposes an electrocardiogram classification method that encodes one-dimensional ECG signals into the three-channel images, named ECG classification based on Mix Time-series Imaging (EC-MTSI). Specifically, this hybrid transformation method combines Gramian angular field (GAF), recurrent plot (RP), and tiling, preserving the original ECG time series’ time dependence and correlation. We use a variety of neural networks to extract features and perform feature fusion and classification. This retains sufficient details while emphasizing local information. To demonstrate the effectiveness of the EC-MTSI, we conduct abundant experiments in a commonly-used dataset. In our experiments, the general accuracy reached 93.23%, and the accuracy of identifying high-risk arrhythmias of ventricular beats and supraventricular beats alone are as high as 97.4% and 96.3%, respectively. The results reveal that the proposed method significantly outperforms the existing approaches.

1. Introduction

According to the World Health Organization (WHO), cardiovascular disease has been the leading cause of death globally for the past 20 years. Since 2000, cardiovascular disease deaths have climbed by more than 2 million, reaching approximately 9 million in 2019, accounting for 16 percent of all deaths [1].
Arrhythmia is a serious disease in the category of cardiovascular diseases [2]. It is produced by abnormal activation of the sinus node or, outside the sinus node, slow conduction of excitation, blockage, or irregular channel conduction, i.e., a cardiac activity’s origin or conduction disorder leads to an abnormal heart rate or rhythm [3]. Arrhythmias can be divided into bradyarrhythmias, tachyarrhythmias, and hereditary arrhythmias [4]. In severe circumstances, the disease can cause physical discomfort or even death [5,6]. For instance, ventricular fibrillation, the deadliest type of arrhythmia, may nearly stop blood flow because the ventricles handle most of the “hard physical work” in the circulatory system [7]. People with ventricular fibrillation are usually patients with potential heart disease. If they cannot be treated within a few minutes, they may die. Therefore, identifying and classifying ECG signals is critical. With early warning and timely prevention, doctors can promptly detect problems.
ECG, a technique for recording the electrical activity patterns of the heart during each cardiac cycle, has been regarded as an essential auxiliary tool for diagnosing cardiovascular diseases [8]. The essence of ECG is a time series, which refers to random variables formed by arranging the values of the same statistical indicator in the order of their occurrence time [9]. Except for classification algorithms that have been applied in other applications [10,11,12,13], researchers have proposed a series of methods for the ECG classification in the past decades. The classification methods of ECG can be roughly divided into traditional statistical learning and machine learning methods. Statistical learning methods mainly include dynamic time warping (DTW), Fisher’s linear discriminant analysis (FLDA), and K-nearest neighbor classifier (KNN) [14]. Venkatesh et al. [15] proposed a method for identification using single-lead ECG, which extracted nine feature parameters from the ECG space domain for classification and used DTW and FLDA combined with the KNN classifier for type. For machine learning methods, many studies have proposed effective models based on machine learning models, such as artificial neural network (ANN) [16], support vector machine (SVM) [17], and decision tree (DT) [18].
However, the main disadvantage of these machine learning methods is they cannot fully exploit in-deep features while using heuristic manual construction with shallow feature learning architectures. It is challenging to find the most suitable and representative features, which are the key to improving the accuracy of ECG classification. As a branch of machine learning, deep learning [19] can extract features automatically, which has also been extensively applied to ECG diagnosis. Saadatnejad et al. [20] proposed a model that combines wavelet transform (WT) and long short-term memory (LSTM) for continuous cardiac monitoring on wearable devices with limited processing power. Compared with many methods based on computationally intensive deep learning, it has the characteristic of being lightweight. Kiranyaz et al. [21] proposed a system using adaptive one-dimensional convolutional neural networks (CNNs) to quickly and accurately classify and monitor the specific ECG of patients. However, these methods are all based on one-dimensional time series modeling, which cannot fully exploit the intrinsic characteristics of ECG signals.
In recent years, due to the significant progress brought by computer vision technology, scholars in different fields have gradually employed this technology in time series classification. A common strategy is to develop deep learning models to extract features from time-series data through imaging, which is an up-and-coming area of research. Specifically, it firstly converts time series into images and then applies deep learning algorithms to extract features from these images. The extracted features are then fed into the classifier to obtain the final results. Recently, the strategy has been applied in the time series classification task. Thanaraj et al. [22] used the Gramian angular summation field (GASF) to encode EEG signals into RGB images and then construct a custom CNN for detecting focused GASF images which realize the classification and diagnosis of epilepsy. Shahverdy et al. [23] converted driving signals into pictures through the recurrent plot (RP) to realize the transformation from the timing dependence of driving signals to the spatial support of images, which are employed to categorize driving behavior. Wang et al. [24] utilized single and composite time series imaging methods on 20 standard datasets to explore the effect of this technology, followed by feature learning using tiled convolutional neural networks (TCNN), and the competitive results reveal the superiority of the proposed approach.
The above studies show that the method of converting time series into images can achieve more impressive performances in time series classification. However, there are few works that focus on ECG classification based on time series imaging. In addition, the previous studies related to ECG classification tend to process one-dimensional ECG sequences directly, which cannot fully explore the internal characteristics of ECG signals and improve the accuracy of ECG classification [25]. Therefore, the main goals of this paper are as follows:
(1)
Design a novel and effective time series imaging method that better preserves the temporal dependence and correlation of the original ECG time series, such as Gramian angular field (GAF) [26], recurrent plot (RP) [27], and tiling [28].
(2)
Employ the image classification neural network to perform feature extraction, and then through feature fusion to lessen the impact of the inherent defects of a single feature.
(3)
Evaluate the effectiveness of the proposed method.
Aiming to achieve these goals, we propose an ECG classification based on Mix time-series imaging (EC-MTSI), classified by encoding ECG time-series into 2D images. The main contribution of this work is summarized as follows.
  • We transform the one-dimensional ECG signals into two-dimensional images to explore the nonlinearity and temporality of the raw data, opening a new direction for ECG research.
  • We employ several effective networks to extract features and perform feature fusion to exploit the hidden information fully.
  • To verify the proposed method, we perform extensive experiments on a classic dataset, and the results show our model demonstrates a high capability of classifying ECG signals.
The other parts of this paper are organized as follows. Firstly, we provide a brief review of relevant literature in Section 2. Then, we introduce the proposed ECG classification framework model in Section 3. After that, we conduct three experiments to prove the superiority of the proposed method, followed by the possible future development directions in Section 5.

2. Methods

In this section, we will first briefly illustrate the structure of the proposed EC-MTSI model, then the three components in our model are introduced in detail.

2.1. EC-MTSI Framework Model

Figure 1 demonstrates the structure of the EC-MTSI model proposed in this paper. Part I is the model structure of the mix time-series imaging (MTSI) framework, where the input ECG time series is passed through the GAF [22] and RP [18] and tiling [19] simultaneously. By superimposing the one-dimensional time gray images obtained by these three methods, three-channel images are obtained. After that, Part II extracts the features of the received RGB image through the two branches of ResNet and DenseNet. Lastly, the in-depth features obtained by the aforementioned two branches are fused in Part III. Combined with convolutional feature fusion, the integrated features pass through two fully connected layers and output the final classification result through the softmax activate function.

2.2. Mix Time-Series Imaging Method

In order to preserve the timing dependence, stationarity, and internal similarity of ECG signals, we construct a mix time series imaging (MTSI) method. Specifically, the input ECG signals are obtained by RP, GAF, and tiling methods, individually, and finally the superimposed image containing rich features is output. GAF encodes the ECG signals and maintains the time-series dependency, which enables the transformed 2D image retains the static information of the raw ECG signal [24]. RP, a vital method to analyze the periodicity, chaos, and non-stationarity of a time series, can reveal the internal structure of the time series and give prior knowledge about similarity, information, and predictability [29]. Due to the length of the patients’ average heartbeats being different or too long or even containing some outliers, tiling is necessary to divide the dataset with a fixed time interval. For example, a 3.6 s record at 360 Hz contains 3.6 × 360 measurements, and the signal can be tiled into a 36 × 36 matrix. To this end, it is reasonable to believe the MTSI can preserve sufficient information and boost classification performance.
The Mix conversion method uses Algorithm 1 to fuse GAF, RP, and tiling images to obtain the three-channel pictures corresponding to the ECG signals. Algorithm 1 takes the original signal as the red channel input, denoises the absolute value of the difference between the smoothed signal and the original signal as the green channel input, and the denoised green channel input as the blue channel input. After that, the ECG signals of the three channels are visualized by tiled, GAF, and RP, then superimposed to obtain the tensor. Finally, the array is rearranged to output the image to meet the requirement of the subsequent neural networks.
Algorithm 1: The pseudocode for the MTSI.
    Data: The original signal s
    Result: Mix-encoded three-channel image I
1   C h a n n e l r e d = s
2   C h a n n e l G r e e n = f d e n o i s e ( | f d e n o i s e ( s ) s | )
3   C h a n n e l b l u e = f d e n o i s e ( s )
4   I = [ T I L I N G ( C h a n n e l r e d ) , G A F ( C h a n n e l G r e e n ) , R P ( C h a n n e l B l u e ) ]
5   I = m o v e _ a x i s ( I , 0 , 2 )
In order to improve the accuracy of the data and the smoothness of the ECG signal and reduce the interference of noise without changing the signal trend, we employ the Savitzky–Golay algorithm [30] to smooth signal and restrain noise. In the Savitzky–Golay algorithm, the continuous subset of adjacent data points is fitted with a low-order polynomial by the linear least square method. When the distance between data points is equal, the analytical solution of the least-squares equation can be found, which is in the form of a set of "convolution coefficients" that can be applied to all data points. Savitzky–Golay’s convolution smoothing algorithm is an improvement of the moving smoothing algorithm (Equation (1)).
Y j * = i = m m C i Y j + 1 N , m + 1 2 j n m 1 2
where m is a fixed window size, Y i represents the observed value of the ECG signals, and C i is the convolution coefficient of continuous observations with each window size m.

2.3. Feature Extraction

To fully exploit the intrinsic features of ECG signals, more effectively utilize the advantages of CNNs in image processing, and further improve the accuracy of classification. We use feature extraction to process the transformed images further. Feature extraction will use a computer to extract image information and decide whether each image point belongs to an image feature [31]. The result of feature extraction is to divide the facts on the image into different subsets, which often belong to isolated points, continuous curves, or continuous regions.
The single-channel neural network structure can usually only process one type of information, and it is challenging to extract different ECG signal features simultaneously. Therefore, we propose an extraction method based on a multi-feature fusion convolutional neural network for ECG classification to solve this problem. Specifically, we use ResNetV2 [32] and DenseNet [33]. The modified ResNet50V2 and DenseNet121 extract the features after converting the ECG into an image. Namely, the last activation layer and output layer are removed. The output of the final fully connected layer is to prepare for the subsequent feature fusion.

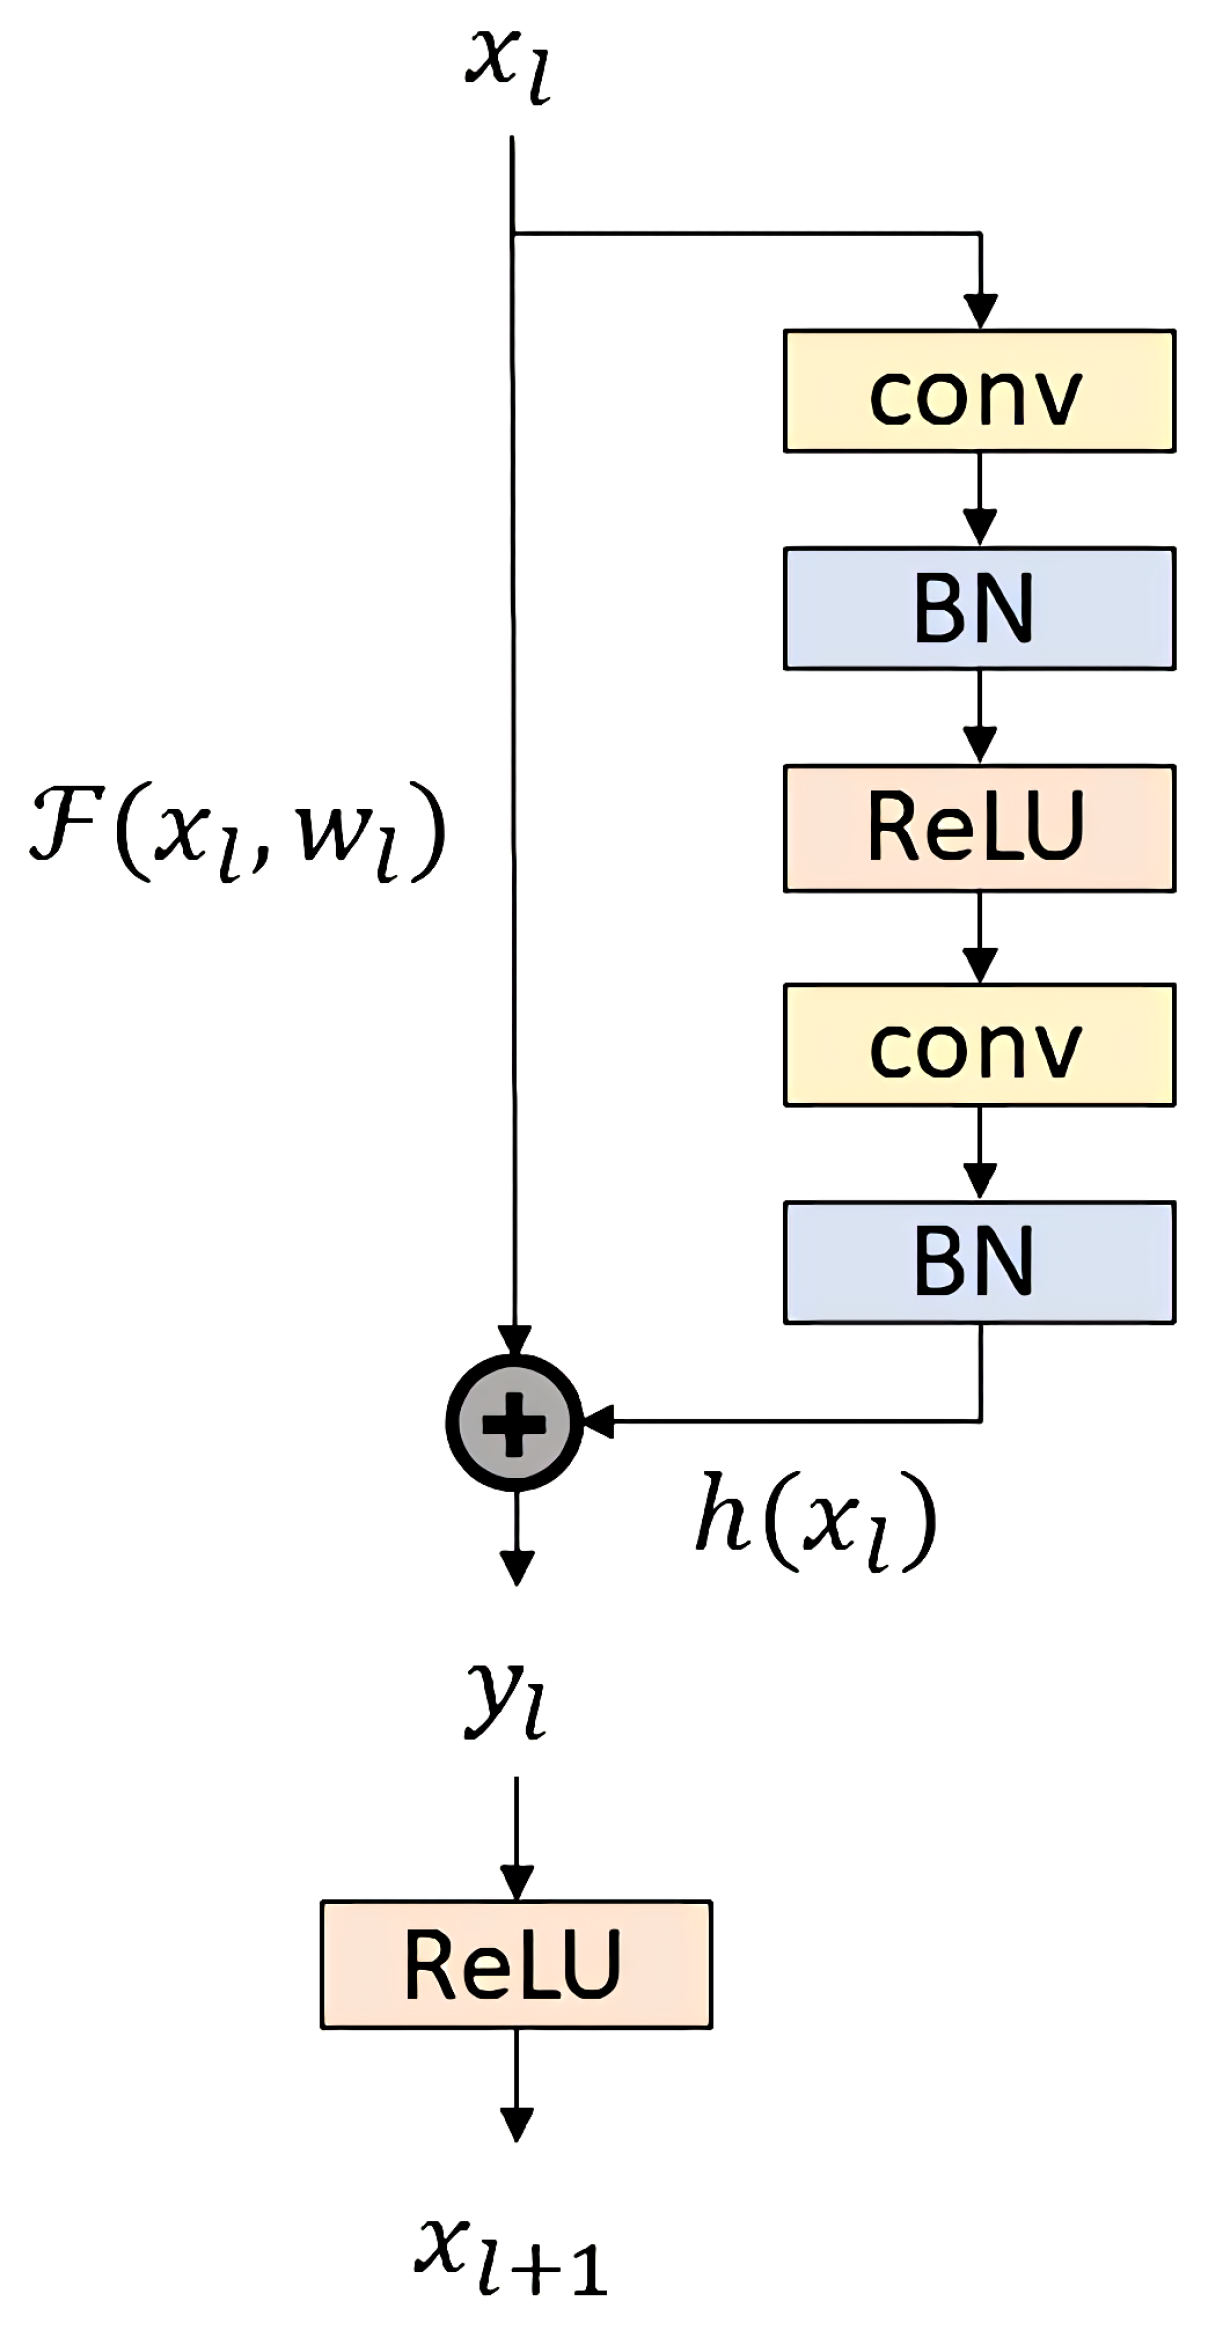
2.3.1. ECG Feature Extraction Based on ResNetV2

A powerful feature extractor is required to extract deep features in encoded images more efficiently. The feature extraction network used in this paper is ResNetV2. Compared with ResNetV1, ResNetV2 converges faster without changing the model depth. From a mathematical point of view, the residual structure of ResNetV1 shown in Figure 2 can be expressed by Formula (2):
y l = h ( x l ) + F ( x l , W l )
x l + 1 = f ( y l )
where x l and x l + 1 are the input and output of the lth unit, respectively, and F ( · ) is the residual function. h ( x l ) is the identity map, and f ( · ) is the ReLU function. Although this structure can alleviate the gradient disappearance and gradient explosion problems when the network structure is deepened, studies have shown that when the weight is too small, the gradient disappearance problem will still occur in ResNetV1 [32]. The ResNetV2 shown in Figure 3 can avoid this problem well. Specifically:
  • ResNetV2 does not easily change the value of the “identity” branch on the left side of the residual structure. The input is consistent with the output, h ( x l ) = x l . Forward parameters and reverse gradients can be directly passed from shallow to deep layers without hindrance, effectively alleviating the problem of gradient disappearance during training.
  • The distribution of features is no longer changed after the addition operation. In ResNetV2, x l + 1 is always equal to y l ; the ReLU at the end of ResNetV1 makes the output of the residual block always non-negative, which restricts the expressive ability of the model.

2.3.2. ECG Feature Extraction Based on DenseNet

Aiming at the relative scarcity of training data and overfitting, we choose DenseNet [33] as another feature extractor. DenseNet uses a more aggressive dense linking mechanism, as shown in Figure 4. The connector can express all its layers to each other. The following form:
X l = H l ( [ X 0 , X 1 , , X l 1 ] )
where [ · ] represents the concatenation operation, which combines all output feature maps from X 0 to X l 1 layers by channel. The nonlinear transformation H used here is a combination of BN+ReLU+conv.

2.4. ECG Feature Fusion

We add feature fusion after the feature extraction network to solve the problem of a single network extracting ECG signal features. Feature fusion can reduce the influence of the inherent defects of a single feature by removing multiple features simultaneously and achieving feature complementation. It is a critical way to improve classification performance [34].
We mainly select early fusion [35], which extracts image features through different networks and then performs feature fusion. In part III in Figure 1, the obtained features are spliced and fused after two feature extraction networks. Then input it into the multi-layer perception module, and the splicing is shown in Equation (5).
Z c o n c a t = i = 1 c X i K i + i = 1 c Y i K i + c
where X i and Y i are the eigenvalues of the two inputs, K represents the convolution kernel, and ∗ represents the convolution. This module consists of one output layer and two dense layers. The output layer uses the softmax function to predict the classification of the ECG.

3. Experiment

We begin with the introduction of the dataset used in the study to verify the effectiveness of the EC-MTSI. Then several evaluation metrics are elaborated, followed by extensive experiments and the corresponding analysis.

3.1. Datasets and Data Pre-Processing

We use the MIT-BIH arrhythmia dataset [36], which contains ECG signals derived from more than 4000 long-term Holter recordings obtained by the Hospital Arrhythmia Laboratory in Boston between 1975 and 1979. The specifications of 360 sampling points per second per channel are digitized, with a total of 109,500 heartbeats, of which abnormal beats account for 30%. In this paper, the heartbeat signals in the dataset are divided into five types according to Advancement of Medical Instrumentation (AAMI) standards [37], including regular beats, supraventricular beats, ventricular beats, fusion beats, and unknown beats. The details of five categories of heartbeats in the MIT-BIH dataset are represented in Table 1. Figure 5 shows a sample of each type.

3.2. Experimental Evaluation Metrics

As ventricular and supraventricular beats are the two types of arrhythmias with the most significant health risk, they need to be identified separately. Two assessment methods, VEB (Ventricular, VEB) and SVEB (Supraventricular, SVEB), are used in this paper. VEB refers to ventricular beats and other categories, and SVEB refers to supraventricular and different ones.
To evaluate the proposed method, we have four criteria of accuracy (Accuracy, acc), positive prediction (Positive Predictivity, Pp), sensitivity (Sensitivity, Se), and specificity (Specificity, Sp) to evaluate the classification results [38]. The calculation equation is shown in (6)–(9).
a c c = T P + T N T P + T N + F P + F N
P p = T P T P + F P
S e = T P T P + F N
S p = T N T N + F P
where TP, TN, FP, and FN indicate true positive, true negative, false positive, and false negative, respectively. The total number of samples is TP + TN + FP + FN.

3.3. Analysis

We perform abundant experiments to prove the superiority of the proposed EC-MTSI. The programming language is Python 3.8.5, and the experiment is based on TensorFlow-GPU 2.4.0 on Windows 10. Specifically, the platform is equipped with the following hardware: i7 9700k CPU, RTX2070 GPU, 32 GB memory, and 1T hard drive.

3.3.1. Discussion of the Parameters

We determined the optimal number of training epochs to prevent the model from overfitting and increasing computational overhead. The model was trained for 60 epochs at the beginning of the experiment. Figure 6 and Figure 7 show the accuracy and loss versus epoch during model training.
In the first 30 epochs, the accuracy rate gradually increases, and the loss gradually decreases. It tends to be stable at the 40th epoch, so the experiment trains 40 epochs.
To better deal with the noise existing in the ECG signal, we reduced its negative impact on the performance of the classification model. When using the Savitzky–Golay algorithm to denoise the ECG signal, a grid search is used to determine the optimal combination of the appropriate window size and the polyorder of the polynomial fit. The selection range of window size is [ 25 , 51 , 75 , 101 ] , and the selection range of order is [ 2 , 4 ] . The experiment uses ResNet50V2 and DenseNet169 as the feature extraction network, and the experiment records the ECG signal classification accuracy. The experimental results are shown in Table 2. It can be seen that when the poly order is 2 and the window size is 51, the noise reduction effect is the best, and the experimental accuracy reaches the highest, 93.23%. Therefore, in subsequent experiments, the poly order is 2, and the window size is 51.

3.3.2. Comparison

In our experiments, we compare the proposed method with the following feature extraction networks:
(1) ResNet [29]: The Bottleneck structure is adopted, and a 1 × 1 convolution is introduced. The number of channels is increased and decreased to realize the linear combination of multiple feature maps while maintaining the original feature map size. We use ResNet50 and ResNetV2 as representatives for comparison.
(2) DenseNet [30]: From the perspective of features, DenseNet dramatically reduces the number of parameters of the network through feature reuse and bypass settings, which are easy to train and have a specific regularization effect.
(3) MobileNet [39]: A lightweight deep neural network built using depthwise separable convolutions to improve the computational efficiency of convolutional networks.
Table 3 shows the experimental results of using the ResNet50V2 to extract features under different time series imaging methods. The average accuracy of ventricular beats and supraventricular beats encoded in three separate ways is 94.73% and 92.94%, respectively, which is lower than the accuracy of the mix time series imaging (95.74% and 96.27%, respectively). The general classification accuracy is between 82.48% and 89.84% while the proposed MTSI obtained 91.25% accuracy, exhibiting better performances in ECG classification. The improvement in the classification accuracy thanks to the MTSI, the hybrid transformation method, preserving more information compared to single time series imaging approach. The results prove that competitive results can be obtained when ECG signal is converted into images with the help of computer vision methods.
Table 4 shows the results of converting ECG time series into images by the MTSI with different feature extractors. The accuracy of identifying high-risk arrhythmias of ventricular beats and supraventricular beats alone are as high as 97.4% and 96.3%, respectively. At the same time, the best performances in GAF, RP, and tiling in Table 3 are 95.35% and 96.14%, which are lower than he Mix method 2.05% and 0.17%. Furthermore, the highest general accuracy rate of the single transformation method rate is 89.84%; the metric improved to 91.25% when MTSI employed. After combining the feature fusion, the general accuracy further boosts to 93.23%, achieving the impressive performances in ECG signal classification. The reason behind this is that feature fusion can reduce the influence of the inherent defects of a single feature by removing multiple features simultaneously and achieving feature complementation. Figure 8 illustrates the confusion matrices for the test set with MSTI. Compared to single feature extraction (ResNetV2 and DenseNet169), feature fusion can classify more samples into the right categories (46,264 samples are classified correctly).

4. Discussion

Early diagnosis of arrhythmia is helpful to prevent and reduce the occurrence of cardiovascular disease. ECG signals contain important information about cardiac abnormalities. Precise classification of ECG signals is the first important step to detect and diagnose many cardiovascular diseases. A novel ECG classification method is proposed in this paper, encoding one-dimensional ECG signals into the three-channel images, named EC-MTSI. The work related to the automatic classification of ECG signals is summarized in Table 5. Many machine learning methods have been proposed for the classification of five arrhythmias [40,41,42,43,44,45,46,47,48]. Previous studies tend to conduct features manually, which is time-consuming. Moreover, the final performance of the models is easily affected by the selected features. Our work can extract features automatically, and the MTSI transforms the original signals into images, preserving more information related to time dependence and correlation.
In Figure 8, the most correct category is the normal beat, while other types only have a small part. To this end, the unbalanced dataset may inhibit further improvement of model performance. In the future, sample rebalancing is necessary. Data augmentation is also a useful strategy to solve this issue. As the signals are encoded into images, we can use some technologies in the field of image classification to increase the number of small sample classes, including MixUp [49] and CutMix [50].
Considering the possibility of better parameter combinations and the good accuracy of our proposed classifier, the novel ECG classification method shows great potential. This method, i.e., using the image classifier as an ECG classifier, is an interesting method using advanced image classification research. We can easily replace the feature extractor in this paper with a better image classifier that may appear in the future and apply it to ECG classification, which does not require much effort.

5. Conclusions and Future Work

In this paper, we propose a novel ECG classification model named EC-MTSI. Different from the previous methods, we encode ECG signals into two-dimensional images, which preserves the time dependence and correlation of the original ECG time series data. It is reasonable to employ CNNs to fully extract features. In order to improve classification performance, we utilize two powerful networks to extract features simultaneously to reduce the influence of the inherent defects of a single feature. We conduct three experiments on a benchmark dataset, and the experimental results prove the effectiveness of EC-MTSI. Furthermore, the classification performance can be further enhanced by feature fusion. Compared to the single network (ResNet50V2 and DenseNet169) to extract features, feature fusion raises the general accuracy to 1.98% and 2.12%, respectively. Dominant results have verified that the proposed EC-MTSI can lead to an impressive performance in this task, and it also shows superiority in the classification tasks of the two arrhythmias with the highest health risk.
The experimental results show that using the EC-MTSI model to detect arrhythmias can help experts effectively diagnose cardiovascular diseases from ECG signals. In addition, the proposed ECG classification method can be applied to medical robots or scanners to monitor ECG signals and help medical experts identify ECG arrhythmias more easily. However, our study still has some limits. On one hand, further studies and comparisons are needed in different time series imaging methods and other state-of-the-art classification models, including Swin Transformer [51] and ConvNeXt [52]. On the other hand, when we evaluated our method on MIT-BIH dataset, the samples were unbalanced which may suppress model performance improvement. To solve this issue, we can use the SMOTE oversampling approach to rebalance the samples. In the future, we plan to explore more effective time series imaging methods to fully exploit the implicit information inherent in ECG. It is also necessary to design a more powerful backbone network to fully mine and extract features to boost the capacity of classification performance further.

Author Contributions

Project administration, H.C.; Writing—original draft, H.C. and L.X.; Writing—review & editing, J.X., Z.X. and C.Z. All authors have read and agreed to the published version of the manuscript.

Funding

This research was financially supported by: 2021 Guangdong province special fund for science and technology (“major special projects + task list”) project, Grant Number: STKJ2021021, STKJ2021201; Research on Food Production and Marketing traceability Software system based on Blockchain, Grant Number: STKJ2021011; 2020 Li Ka Shing Foundation Cross-Disciplinary Research Grant, Grant Number: 2020LKSFG08D; Guangdong basic and applied basic research fund project, Grant Number: 2021A1515012527; Free application project of Guangdong Natural Science Foundation, Grant Number: 2018A030313438; Special projects in key fields of colleges and universities in Guangdong Province, Grant Number: 2020ZDZX3073.

Conflicts of Interest

The authors declare no conflict of interest.

References

  1. World Health Organization. 2019 Global Health Estimates, 2000–2019; World Health Organization: Geneva, Switzerland, 2019.
  2. Huikuri, H.V.; Castellanos, A.; Myerburg, R.J. Sudden death due to cardiac arrhythmias. N. Engl. J. Med. 2001, 345, 1473–1482. [Google Scholar] [CrossRef]
  3. Hammad, M.; Iliyasu, A.M.; Subasi, A.; Ho, E.S.; Abd El-Latif, A.A. A multitier deep learning model for arrhythmia detection. IEEE Trans. Instrum. Meas. 2020, 70, 1–9. [Google Scholar] [CrossRef]
  4. Lazzerini, P.E.; Capecchi, P.L.; El-Sherif, N.; Laghi-Pasini, F.; Boutjdir, M. Emerging arrhythmic risk of autoimmune and inflammatory cardiac channelopathies. J. Am. Heart Assoc. 2018, 7, e010595. [Google Scholar] [CrossRef] [Green Version]
  5. Brouillette, J.; Cyr, S.; Fiset, C. Mechanisms of arrhythmia and sudden cardiac death in patients with HIV infection. Can. J. Cardiol. 2019, 35, 310–319. [Google Scholar] [CrossRef]
  6. Tuncer, T.; Dogan, S.; Pławiak, P.; Acharya, U.R. Automated arrhythmia detection using novel hexadecimal local pattern and multilevel wavelet transform with ECG signals. Knowl.-Based Syst. 2019, 186, 104923. [Google Scholar] [CrossRef]
  7. Sigvardsen, P.E.; Pham, M.H.; Kühl, J.T.; Fuchs, A.; Afzal, S.; Møgelvang, R.; Nordestgaard, B.G.; Køber, L.; Kofoed, K.F. Left ventricular myocardial crypts: Morphological patterns and prognostic implications. Eur. Heart J.-Cardiovasc. Imaging 2021, 22, 75–81. [Google Scholar] [CrossRef]
  8. Alfaras, M.; Soriano, M.C.; Ortín, S. A fast machine learning model for ECG-based heartbeat classification and arrhythmia detection. Front. Phys. 2019, 7, 103. [Google Scholar] [CrossRef] [Green Version]
  9. Ismail Fawaz, H.; Forestier, G.; Weber, J.; Idoumghar, L.; Muller, P.A. Deep learning for time series classification: A review. Data Min. Knowl. Discov. 2019, 33, 917–963. [Google Scholar] [CrossRef] [Green Version]
  10. Xing, W.; Bei, Y. Medical health big data classification based on KNN classification algorithm. IEEE Access 2019, 8, 28808–28819. [Google Scholar] [CrossRef]
  11. Dash, S.; Rengaswamy, R.; Venkatasubramanian, V. Fuzzy-logic based trend classification for fault diagnosis of chemical processes. Comput. Chem. Eng. 2003, 27, 347–362. [Google Scholar] [CrossRef]
  12. Moghimihanjani, M.; Vaferi, B. A combined wavelet transform and recurrent neural networks scheme for identification of hydrocarbon reservoir systems from well testing signals. J. Energy Resour. Technol. 2021, 143, 013001. [Google Scholar] [CrossRef]
  13. Ballabio, D.; Consonni, V. Classification tools in chemistry. Part 1: Linear models. PLS-DA. Anal. Methods 2013, 5, 3790–3798. [Google Scholar] [CrossRef]
  14. Yang, W.; Si, Y.; Wang, D.; Zhang, G. A novel method for identifying electrocardiograms using an independent component analysis and principal component analysis network. Measurement 2020, 152, 107363. [Google Scholar] [CrossRef]
  15. Venkatesh, N.; Jayaraman, S. Human electrocardiogram for biometrics using DTW and FLDA. In Proceedings of the 2010 20th International Conference on Pattern Recognition, Istanbul, Turkey, 23–26 August 2010; pp. 3838–3841. [Google Scholar]
  16. Pandey, S.K.; Janghel, R.R. ECG arrhythmia classification using artificial neural networks. In Proceedings of the 2nd International Conference on Communication, Computing and Networking, Larache, Morocco, 14–16 November 2019; pp. 645–652. [Google Scholar]
  17. Varatharajan, R.; Manogaran, G.; Priyan, M. A big data classification approach using LDA with an enhanced SVM method for ECG signals in cloud computing. Multimed. Tools Appl. 2018, 77, 10195–10215. [Google Scholar] [CrossRef]
  18. Kumari, L.; Sai, Y.P. Classification of ECG beats using optimized decision tree and adaptive boosted optimized decision tree. Signal Image Video Process. 2022, 16, 695–703. [Google Scholar]
  19. Pyakillya, B.; Kazachenko, N.; Mikhailovsky, N. Deep learning for ECG classification. J. Phys. Conf. Ser. 2017, 913, 012004. [Google Scholar] [CrossRef]
  20. Saadatnejad, S.; Oveisi, M.; Hashemi, M. LSTM-based ECG classification for continuous monitoring on personal wearable devices. IEEE J. Biomed. Health Inform. 2019, 24, 515–523. [Google Scholar] [CrossRef] [Green Version]
  21. Kiranyaz, S.; Ince, T.; Hamila, R.; Gabbouj, M. Convolutional neural networks for patient-specific ECG classification. In Proceedings of the 2015 37th Annual International Conference of the IEEE Engineering in Medicine and Biology Society (EMBC), Milan, Italy, 25–29 August 2015; pp. 2608–2611. [Google Scholar]
  22. Thanaraj, K.P.; Parvathavarthini, B.; Tanik, U.J.; Rajinikanth, V.; Kadry, S.; Kamalanand, K. Implementation of deep neural networks to classify EEG signals using gramian angular summation field for epilepsy diagnosis. arXiv 2020, arXiv:2003.04534. [Google Scholar]
  23. Shahverdy, M.; Fathy, M.; Berangi, R.; Sabokrou, M. Driver behavior detection and classification using deep convolutional neural networks. Expert Syst. Appl. 2020, 149, 113240. [Google Scholar] [CrossRef]
  24. Wang, Z.; Oates, T. Imaging time-series to improve classification and imputation. In Proceedings of the Twenty-Fourth International Joint Conference on Artificial Intelligence, Buenos Aires, Argentina, 25–31 July 2015. [Google Scholar]
  25. Mincholé, A.; Camps, J.; Lyon, A.; Rodríguez, B. Machine learning in the electrocardiogram. J. Electrocardiol. 2019, 57, S61–S64. [Google Scholar] [CrossRef]
  26. Wickramaratne, S.D.; Mahmud, M.S. A deep learning based ternary task classification system using gramian angular summation field in fNIRS neuroimaging data. In Proceedings of the 2020 IEEE International Conference on E-Health Networking, Application & Services (HEALTHCOM), Shenzhen, China, 1–2 March 2021; pp. 1–4. [Google Scholar]
  27. Mathunjwa, B.M.; Lin, Y.T.; Lin, C.H.; Abbod, M.F.; Shieh, J.S. ECG arrhythmia classification by using a recurrence plot and convolutional neural network. Biomed. Signal Process. Control 2021, 64, 102262. [Google Scholar] [CrossRef]
  28. Heinen, N. Using Lightweight Image Classifiers for Electrocardiogram Classification on Embedded Devices. Bachelor’s Thesis, University of Twente, Enschede, The Netherlands, 2020. [Google Scholar]
  29. Marwan, N.; Wessel, N.; Meyerfeldt, U.; Schirdewan, A.; Kurths, J. Recurrence-plot-based measures of complexity and their application to heart-rate-variability data. Phys. Rev. E 2002, 66, 026702. [Google Scholar] [CrossRef] [Green Version]
  30. Arn, R.T.; Narayana, P.; Emerson, T.; Draper, B.A.; Kirby, M.; Peterson, C. Motion segmentation via generalized curvatures. IEEE Trans. Pattern Anal. Mach. Intell. 2018, 41, 2919–2932. [Google Scholar] [CrossRef]
  31. Dong, P.T. A review on image feature extraction and representation techniques. Int. J. Multimed. Ubiquitous Eng. 2013, 8, 385–396. [Google Scholar]
  32. He, K.; Zhang, X.; Ren, S.; Sun, J. Identity mappings in deep residual networks. In Proceedings of the European Conference on Computer Vision, Munich, Germany, 8–14 September 2016; pp. 630–645. [Google Scholar]
  33. Huang, G.; Liu, Z.; Van Der Maaten, L.; Weinberger, K.Q. Densely connected convolutional networks. In Proceedings of the IEEE Conference on Computer Vision and Pattern Recognition, Honolulu, HI, USA, 21–26 July 2017; pp. 4700–4708. [Google Scholar]
  34. Ram Prabhakar, K.; Sai Srikar, V.; Venkatesh Babu, R. Deepfuse: A deep unsupervised approach for exposure fusion with extreme exposure image pairs. In Proceedings of the IEEE International Conference on Computer Vision, Venice, Italy, 22–29 October 2017; pp. 4714–4722. [Google Scholar]
  35. Chaib, S.; Liu, H.; Gu, Y.; Yao, H. Deep feature fusion for VHR remote sensing scene classification. IEEE Trans. Geosci. Remote Sens. 2017, 55, 4775–4784. [Google Scholar] [CrossRef]
  36. Apandi, Z.F.M.; Ikeura, R.; Hayakawa, S. Arrhythmia detection using MIT-BIH dataset: A review. In Proceedings of the 2018 International Conference on Computational Approach in Smart Systems Design and Applications (ICASSDA), Kuching, Malaysia, 15–17 August 2018; pp. 1–5. [Google Scholar]
  37. Goldberger, A.L.; Amaral, L.A.; Glass, L.; Hausdorff, J.M.; Ivanov, P.C.; Mark, R.G.; Mietus, J.E.; Moody, G.B.; Peng, C.K.; Stanley, H.E. PhysioBank, PhysioToolkit, and PhysioNet: Components of a new research resource for complex physiologic signals. Circulation 2000, 101, e215–e220. [Google Scholar] [CrossRef] [Green Version]
  38. Alizadeh, S.; Khodabakhshi, A.; Abaei Hassani, P.; Vaferi, B. Smart identification of petroleum reservoir well testing models using deep convolutional neural networks (GoogleNet). J. Energy Resour. Technol. 2021, 143, 073008. [Google Scholar] [CrossRef]
  39. Hatami, N.; Gavet, Y.; Debayle, J. Classification of time-series images using deep convolutional neural networks. In Proceedings of the Tenth International Conference on Machine Vision (ICMV 2017), Vienna, Austria, 13–15 November 2018; Volume 10696, p. 106960Y. [Google Scholar]
  40. De Lannoy, G.; François, D.; Delbeke, J.; Verleysen, M. Weighted conditional random fields for supervised interpatient heartbeat classification. IEEE Trans. Biomed. Eng. 2011, 59, 241–247. [Google Scholar] [CrossRef]
  41. Park, K.; Cho, B.; Lee, D.; Song, S.; Lee, J.; Chee, Y.; Kim, I.; Kim, S. Hierarchical support vector machine based heartbeat classification using higher order statistics and hermite basis function. In Proceedings of the 2008 Computers in Cardiology, Bologna, Italy, 14–17 September 2008; pp. 229–232. [Google Scholar]
  42. Ye, C.; Kumar, B.V.; Coimbra, M.T. Combining general multi-class and specific two-class classifiers for improved customized ECG heartbeat classification. In Proceedings of the 21st International Conference on Pattern Recognition (ICPR2012), Tsukuba, Japan, 11–15 November 2012; pp. 2428–2431. [Google Scholar]
  43. Zhang, Z.; Dong, J.; Luo, X.; Choi, K.S.; Wu, X. Heartbeat classification using disease-specific feature selection. Comput. Biol. Med. 2014, 46, 79–89. [Google Scholar] [CrossRef]
  44. Zhang, Z.; Luo, X. Heartbeat classification using decision level fusion. Biomed. Eng. Lett. 2014, 4, 388–395. [Google Scholar] [CrossRef]
  45. Mar, T.; Zaunseder, S.; Martínez, J.P.; Llamedo, M.; Poll, R. Optimization of ECG classification by means of feature selection. IEEE Trans. Biomed. Eng. 2011, 58, 2168–2177. [Google Scholar] [CrossRef]
  46. Soria, M.L.; Martínez, J. Analysis of multidomain features for ECG classification. In Proceedings of the 2009 36th Annual Computers in Cardiology Conference (CinC), Park City, UT, USA, 13–16 September 2009; pp. 561–564. [Google Scholar]
  47. Bazi, Y.; Alajlan, N.; AlHichri, H.; Malek, S. Domain adaptation methods for ECG classification. In Proceedings of the 2013 International Conference on Computer Medical Applications (ICCMA), Sousse, Tunisia, 20–22 January 2013; pp. 1–4. [Google Scholar]
  48. Lin, C.C.; Yang, C.M. Heartbeat classification using normalized RR intervals and morphological features. Math. Probl. Eng. 2014, 2014. [Google Scholar] [CrossRef]
  49. Zhang, H.; Cisse, M.; Dauphin, Y.N.; Lopez-Paz, D. mixup: Beyond empirical risk minimization. arXiv 2017, arXiv:1710.09412. [Google Scholar]
  50. Yun, S.; Han, D.; Oh, S.J.; Chun, S.; Choe, J.; Yoo, Y. Cutmix: Regularization strategy to train strong classifiers with localizable features. In Proceedings of the IEEE/CVF International Conference on Computer Vision, Seoul, Korea, 27 October–2 November 2019; pp. 6023–6032. [Google Scholar]
  51. Liu, Z.; Lin, Y.; Cao, Y.; Hu, H.; Wei, Y.; Zhang, Z.; Lin, S.; Guo, B. Swin transformer: Hierarchical vision transformer using shifted windows. In Proceedings of the IEEE/CVF International Conference on Computer Vision, Montreal, QC, Canada, 10–17 October 2021; pp. 10012–10022. [Google Scholar]
  52. Liu, Z.; Mao, H.; Wu, C.Y.; Feichtenhofer, C.; Darrell, T.; Xie, S. A convnet for the 2020s. In Proceedings of the IEEE/CVF Conference on Computer Vision and Pattern Recognition, New Orleans, LA, USA, 19–24 June 2022; pp. 11976–11986. [Google Scholar]
Figure 1. The framework of the EC-MTSI model.
Electronics 11 01991 g001
Figure 2. ResNetV1 residual structure.
Electronics 11 01991 g002
Figure 3. ResNetV2 residual structure.
Electronics 11 01991 g003
Figure 4. The dense connection mechanism in DenseNet.
Electronics 11 01991 g004
Figure 5. Five types of heartbeats. (a) The normal beat represents the beat of implementing the sinus node. (b) The supraventricular beat means supraventricular ectopic. (c) The ventricular beat denotes ventricular ectopic. (d) Unknown beats and rhythmic beats are classified as unknown beats. (e) The fusion beat represents the fusion of ventricular and normal beat.
Electronics 11 01991 g005
Figure 6. The relationship of ResNet50V2 network loss with epoch.
Electronics 11 01991 g006
Figure 7. ResNet50V2 network accuracy varies with epoch.
Electronics 11 01991 g007
Figure 8. The confusion matrices for the test set. (a) ResNet50V2. (b) DenseNet169. (c) ResNet50V2 + DenseNet169.
Electronics 11 01991 g008
Table 1. According to the AAMI standard, the ECG signals in the MIT-BIH data set are divided into five types.
AAMI ClassesHeartbeat Types
Normal beatsNormal beats, Left bundle branch block, Right bundle branch block, Atrial escape beat, Nodal (junctional) escape beat
Supraventricular beatsAtrial premature beat, Aberrated atrial premature beat, Nodal (junctional) premature beat, Supraventricular premature beat
Ventricular beatsPremature ventricular contraction, Ventricular escape beat
Unknown beatsPaced beat, Fusion of paced and normal beat, Unclassified beat
Fusion beatsThe fusion of ventricular and normal beat
Table 2. Savitzky–Golay algorithm parameters discuss the experiment.
Window Size255175101
Polyorder
2 92.5893.2388.6889.02
4 89.0290.1289.0289.02
Table 3. Comparison of Mix and three other separate methods to transform image experimental results.
TransformationNetworkVEBSVEBAcc
AccPpSeSpAccPpSeSp
GAFResNet50V295.3591.9131.0899.8187.365.4114.6690.1582.49
RPResNet50V294.0652.7384.8394.7195.346.061.7998.9388.82
TILINGResNet50V294.856.7584.0295.5596.1422.821.8599.7689.84
MixResNet50V295.7467.167.5897.796.270099.9691.25
Table 4. Experimental results of Mix-transformed images.
TransformationNetworkVEBSVEBAcc
AccPpSeSpAccPpSeSp
MixResNet5095.5767.8660.1898.0295.6612.112.7899.2390.57
MixResNet50V295.7467.167.5897.796.270099.9691.25
MixDenseNet12197.2179.6876.4198.6593.756.525.1897.1588.99
MixDenseNet16995.5867.860.6298.096.248.750.1699.9391.11
MixDenseNet20195.7466.5969.0199.5395.558.442.0799.1490.66
MixMobileNet93.4112.350.9699.5396.30010088.64
MixMobileNetV293.3120.791.1599.796.30099.9988.88
MixResNet50V2+
DenseNet169
97.4083.5774.6398.9896.30010093.23
Table 5. The comparison of five categories of arrhythmia in the MIT-BIH dataset.
MethodsFeature SetClassifierAccuracy (%)
De Lannoy et al. [40]HBF, morphological, ECG-segments, HOS, RR intervalsWeighted conditional random fields85.0
Park et al. [41]HOS, HBFHierarchical support vector machine85.0
Ye et al. [42]ICA, RR interval, wavelet, PCA, morphological featuresCombined support vector machine86.0
Zhang et al. [43]ECG segments and intervals, morphological features, RR intervals features, RR intervals, wavelet coefficientsCombined support vector machine86.0
Zhang and Luo [44]Morphological features, statistical features, temporal features, SFFSMultilayer perceptron, weighted linear discriminants89.0
Mar et al. [45]Morphological features, RR Intervals, VCG, FFSweighted linear discriminants90.0
Soria and Martinez [46]Morphological features, waveletSupport vector machine, IWKLR, DTSVM93.0
Bazi et al. [47]Normalized RR intervalWeighted linear discriminants93.0
EC-MTSIEncoded three-channel imagesSoftmax93.7
Publisher’s Note: MDPI stays neutral with regard to jurisdictional claims in published maps and institutional affiliations.

