Article

Estimation of Solar Radiation on a PV Panel Surface with an Optimal Tilt Angle Using Electric Charged Particles Optimization

by
Muhammad Saud Khan
1,*,
Makbul A. M. Ramli
1,
Hatem Faiz Sindi
1,
Taufal Hidayat
1 and
Houssem R. E. H. Bouchekara
2
1
Department of Electrical and Computer Engineering, King Abdulaziz University, Jeddah 21589, Saudi Arabia
2
Department of Electrical Engineering, University of Hafr Al Batin, Hafr Al Batin 31991, Saudi Arabia
*
Author to whom correspondence should be addressed.
Electronics 2022, 11(13), 2056; https://doi.org/10.3390/electronics11132056
Submission received: 10 May 2022 / Revised: 25 June 2022 / Accepted: 26 June 2022 / Published: 30 June 2022

Abstract

:
Solar energy is a promising renewable energy source that can fulfill the world’s current and future energy needs. The angle at which a photovoltaic (PV) panel faces the horizon determines the incidence of solar radiation. The incident solar radiation on PV panels could be optimized by adjusting their tilt angles and increasing the power output of the PV array. In this study, solar energy model-based research was conducted in the Saudi Arabian cities of Dhahran and Makkah. This study investigated the performance of a 1 kW monocrystalline silicon PV array in these cities. Analyzing the optimal tilt angle for efficiency and performance improvement of the PV panel is challenging. The optimal tilt angle is determined by combining the data of the Sun’s diffuse, direct radiation and the global horizontal Sun radiation. This research examined the four empirical models by applying the electric charged particle optimization (ECPO) algorithm to estimate the solar radiation on sloped surfaces. The model’s results were compared to the global horizontal solar radiation based on the daily mean solar radiation value in these cities. The Hay–Davies–Klucher–Reindel model presented the maximum amount of tilted surface solar radiation in the year and at different periods. In contrast, the Badescu model exhibited the weakest results of all the isotropic and anisotropic models. Finally, using the ECPO algorithm, all models indicated that tilted surfaces (IT) received more solar radiation than horizontal surfaces (Ig).

1. Introduction

Several nations are combining renewable and other energy sources to secure a long-term reliance on renewable resources while meeting development objectives. This endeavor has two primary objectives: the utilization of renewable energy and the minimization of greenhouse gas emissions. Numerous utilities worldwide are integrating renewable energy sources to address increasing electricity demand [1,2]. The rising demand for energy in household and commercial areas has strained traditional energy supplies, which release vast amounts of pollutants into the atmosphere. Hence, the world’s dependence on fossil fuels has led many people to believe that solar energy is the ultimate solution. Unlike other energy sources, solar radiation freely reaches the Earth’s surface. Therefore, it is considered an alternative energy source [3]. Solar energy-based technologies are increasingly being used to address rising energy demands without depleting fossil fuel reserves. In other words, fossil fuels negatively affect the global climate [1,3]. Environmental impact can be quantified using two terms: ecological footprint and carbon footprint. Solar panels do not emit any pollutants while generating power. However, they do have a carbon footprint. The primary emissions sources are the extraction and transportation of raw materials for manufacturing photovoltaic (PV) panels and the entire manufacturing process. Despite this, the carbon emissions of a PV panel throughout its whole life are far less than that of traditional energy sources. As opposed to the carbon footprint, the ecological footprint assesses the human demand for Earth’s environmental capability. Moreover, the ecological footprint motivates people to minimize resource depletion, whereas the carbon footprint encourages them to reduce their emissions of greenhouse gases. PV panels leave a lesser carbon footprint on the environment than traditional energy sources [4,5,6,7].
Many countries are frantically trying to enhance their solar electricity generation capacity. Installation costs of PV panels have dropped by 60% in the past decade, resulting in considerable increases in installation in several countries. PV panel usage has surged 50% each year in the past five years, with its international penetration projected to reach 11% by 2050. Saudi Arabia has achieved significant advances in solar energy generation because of its enormous capacity to absorb sunlight. Saudi Arabian authorities have also set an objective of supporting roughly 5% of the country’s demand for solar energy. By 2032, the Saudi Arabian government plans to install 16 GW of PV systems, contributing 4.4–5.5% of the country’s total electricity output [8]. Considering the increasing demand for energy and the progressive depletion of traditional sources, the azimuth, tilt angles, and local climate variables must be considered for the best possible radiation collection from a solar panel [9]. Emerging solar technologies have the potential to improve PV efficiency further. Perovskite is one of the most promising new PV technologies because perovskite crystals have a relatively high absorption efficiency [10]. Silicon and other semiconducting materials are used in solar panels and their manufacturing. A solar panel comprises several solar cells. Some solar panels, such as OPV [11] and monocrystalline, are currently in use. A PV array contains a number of those solar cells together. Solar panels capture the Sun’s rays and convert them into electricity. These PV arrays are used in various solar energy extraction techniques to maximize different solar characteristics. The tilt angle is one of these parameters that is used to extract more solar radiation and generate extra power.
Several investigations have been conducted globally to determine the optimal tilt angle for PV panels. Energy generation from PV modules depends on solar radiation, which can be affected by module orientation and weather [12]. Accurate solar radiation prediction and high-quality tilt angles are crucial in designing and developing a PV–wind–battery device [13]. Furthermore, accurate Sun radiation forecasts and precise tilt angles are also needed [14,15]. The technical literature includes several research and case studies on the tilt angle optimization of specific sites. Saraf and Hamad used solar energy sources to fulfill the growing demand for electrical energy in Basrah, Iraq [16]. A group of researchers assessed solar electricity assets to obtain the most precise tilt angle for PV panels. Notably, the Sindh region of Pakistan was chosen as the site for investigation in another study [17].
Benghanem also investigated how to boost the PV panels’ efficiency in Madinah by adjusting the tilt angle. According to his study, the annual adjustment of the tilt angle resulted in an 8% loss of power compared to the monthly adjustment of the tilt angle [18]. A study used European Sun radiation data to establish the appropriate tilt angle [19]. Beringer et al. [20] found that Germany’s PV system produced the highest power between 50° and 70° in winter and 0° and 30° in summer. The PV plant’s performance was unaffected by the tilt angle. In Spain, data from four years of observations were used to examine the tilt angles of PV panels in summer and winter under horizontal and inclined floor orientations [21]. Despotovic and Nedic calculated the highest-rated angle of solar creditors in Belgrade, Serbia [22]. An empirical technique was used in Abu Dhabi to measure the solar radiation at different tilt angles to understand its impact on the overall performance of PV panels and creditors. The findings suggest that the lean perspective should be updated at least twice a year [23]. A fixed-angle solar collector in the northern hemisphere was also expected to have a superior angle [24].
Numerous research works have been conducted under specified conditions to determine the maximum energy output of PV panels, for instance, depending on the optimal tilt angle and array size for optimum utilization gathered with minimal electric power sold to the grid [25]. Another research project used a variety of directions and tilt angles to determine the yearly maximum output energy [26]. An alternative approach has also been applied to replace the tilt angle optimization. Some researchers have examined Sun monitoring structures to increase the PV panel electricity output by increasing the incident radiation following the Sun’s paths instead of optimizing from a lean standpoint [27,28]. However, solar tracking structures are not always cost-effective [29]. A monitoring device requires 550% extra distance, and static PV panels spanning an area of 1.07 hectares necessitate an additional 350% space for a two-axis tracking system. Moreover, electricity and periodic protection are required for their operation and calibration [30]. The growing need for mechanical parts for solar monitoring systems increases energy costs [31]. Climate conditions have also been considered while optimizing the tilt angle [32]. This study suggested that a neural network could increase a PV panel’s strength. The primary factors such as humidity, temperature, and the angle of the Sun’s zenith are mostly considered while determining the amount of electricity generated by PVs. Ambient temperature and ground reflectance are also considered to obtain the best results.
A forecasting model was used to determine the tilt angle and intervals for the most efficient solar power generation [33]. Chang [34] identified the best PV tilt angles using the ant-direction hybrid differential evolution technique in Taiwan. Annual top-of-line tilt angle trends were also determined. The actual and simulated results of nonlinear time-varying evolution were highly similar in accuracy. Particle swarm optimization (PSO) improved the tilt angles of PV panels in seven Taiwanese municipalities [35,36]. Therefore, the author proposed more commercial technology studies. The Industrial Technology Research Institute’s 23.5° tilt perspective should not be applied to Taiwan’s seven major cities. Ismail et al. [37] used a genetic algorithm to determine the optimum floor azimuth and the tilt angles of each month, season, and year. The authors also reported the amount of energy produced per year using unique PV tracking systems.
Solar radiation data at a particular site must be determined for the PV system design and cost analysis, except that long-term data for many global regions are often unavailable. Empirical models based on climate data have been applied to predict the amount of accessible solar energy. Meteorological stations regularly record the intensities of diffuse and global solar radiation events occurring on horizontal surfaces. Tilted surface solar radiation observations provide a poor source of information. Therefore, it is crucial to first convert the angle of incidence to that of a surface level before measuring the consequent amount of solar radiation on an inclined surface. The tilt of solar collector plates is often selected to maximize the annual average amount of energy [38]. The best collector orientation in the northern hemisphere is south facing (i.e., γ = 0). Furthermore, the optimum tilt angle varies depending on the location’s latitude and the time of the year. The optimum inclination is typically greater in winter (+15 deg latitude) than in the summer (−15 deg latitude). Sudhakar et al. investigated and recommended various tilt angles based on latitudes [39].
Researchers have also attempted to develop models and algorithms for calculating Sun radiation on an inclined surface in various locations and climates [40]. Except for the component of diffuse sky radiation that is often divided into isotropic and anisotropic models, all models have similar mathematical representations of solar radiation calculations [9,41]. The total radiation impacting an inclined surface has three components: diffuse radiation, ground-reflected radiation, and beam radiation. Beam radiation on a tilted surface may be calculated using the comparatively straightforward geometric connection between the horizontal and inclined surfaces. A simple method using an isotropic model can estimate the ground-reflected radiation with high precision. This is not the case with diffuse components because diffuse radiation does not have a definite incidence angle on a horizontal surface. Several models have attempted to connect the diffuse radiation measured on a level surface and an inclined surface. Isotropic and anisotropic sky models are the two most common forms of sky models.
The isotropic models suggest that sky radiation is uniformly dispersed across the sky dome. Therefore, the portion of the sky dome observed by the surface is proportional to the diffuse radiation striking it at a certain angle. In contrast, anisotropic models assume that diffuse sky radiation near the Sun in the circumsolar region has anisotropy. The diffuse section of the sky dome is distributed isotropically (horizon-brightening portion) [42]. Generally, the scattered portion of the radiation on tilted surfaces frequently consists of horizon brightening, isotropic, and circumsolar factors. Other researchers have presented detailed reviews on various isotropic and anisotropic models [41,43,44].
Analytical models were used to establish the proper tilt angle in various locations in Canada and India. Anisotropic models had slightly larger tilt angles depending on the location’s latitude [45,46]. A study conducted in India used three isotropic and an equal number of anisotropic models. The predicted solar radiation output was higher than the output of two isotropic models but lower than the output of anisotropic models. Although Hay–Davies–Klucher–Reindel (HDKR) and Hay and Davies (HD) models projected slightly higher values than Liu and Jordan (LJ) for overcast conditions, they obtained comparable results [47,48]. Several elements could affect the PV system’s performance. Various mathematical models and correlations have been applied to identify the tilt angles of PV panels [43]. Multiple models and optimization approaches, such as PSO, artificial neural networks (ANN), and genetic algorithms (GA), have been described to estimate the appropriate tilt angle in various geographical regions [41]. Therefore, investigating the combined effects of tilt angle on PV array power production is essential. Several novel algorithms, most notably metaheuristic algorithms, have been developed recently, with distinct pros and cons as detailed in the literature. Electric charged particle optimization (ECPO) is a newly developed algorithm with excellent performance (as reported in the literature). It has reduced the sidelobes in circular antenna arrays [49]. Moreover, it has been used in detecting moving targets using unmanned aerial vehicles (UAVs) [50] and optimizing wind farm layouts [51].
This study aims to address previous studies’ limitations and fill the research gap. In the abovementioned studies, researchers significantly contributed to developing isotropic and anisotropic models for estimating the amount of solar radiation that reaches a tilted surface [9,41,43,44,46,47,48]. Most researchers focused on determining the ideal tilt angle for a particular location each year and then using that as a model for the entire country [52]. Estimating a single average optimal tilt angle for a country like Saudi Arabia, where weather conditions are extremely variable, is not representative of the whole country. The scientific literature has substantial proof that PV cell tilt angle and temperature significantly affect their power output [53]. The amount of solar radiation that strikes a surface and the temperature’s effect on it can enhance the amount of power generated and reduce the cost of solar energy systems and their energy losses. Because of this, it is essential to thoroughly investigate how the tilt angle affects the amount of solar radiation and PV array power output in different places in the Kingdom of Saudi Arabia (KSA). The authors recognize the necessity for a comprehensive approach, especially in areas like KSA with harsh environments using direct and diffuse solar radiation and ambient temperature data.
This study used the standard version of the ECPO algorithm to demonstrate four distinct model responses to determine which model performed better. This research used two isotropic and anisotropic models to determine the optimal tilt angle of PV panels at various intervals and extract the maximum amount of total tilted surface solar radiation and power generation output of PV arrays in Dhahran and Makkah, Saudi Arabia. It is a novel method with outstanding features for addressing a variety of global challenges. However, it has not been used in the power and energy sectors because it is a novel concept. A study of two cities in Saudi Arabia with different climates was conducted to investigate the effects of solar radiation and PV array power output. This research will aid PV installers in structuring their systems more accurately, resulting in increased power output by the solar energy conversion system. This study contributed the following important points:
  • It maximized the performance of solar energy systems by optimizing the tilt angle of the PV surface.
  • Using the ECPO technique, both anisotropic and isotropic empirical solar radiation models were applied to estimate the solar radiation received on a tilted surface in Dhahran and Makkah, Saudi Arabia.
  • It explored the functioning of the ECPO algorithm and its implementation for tilt angle optimization.
This paper provides a detailed explanation of the solar radiation model and discusses simulation results. This study’s final section is divided into three parts: Application, Results, and Conclusions and the most significant findings are provided.

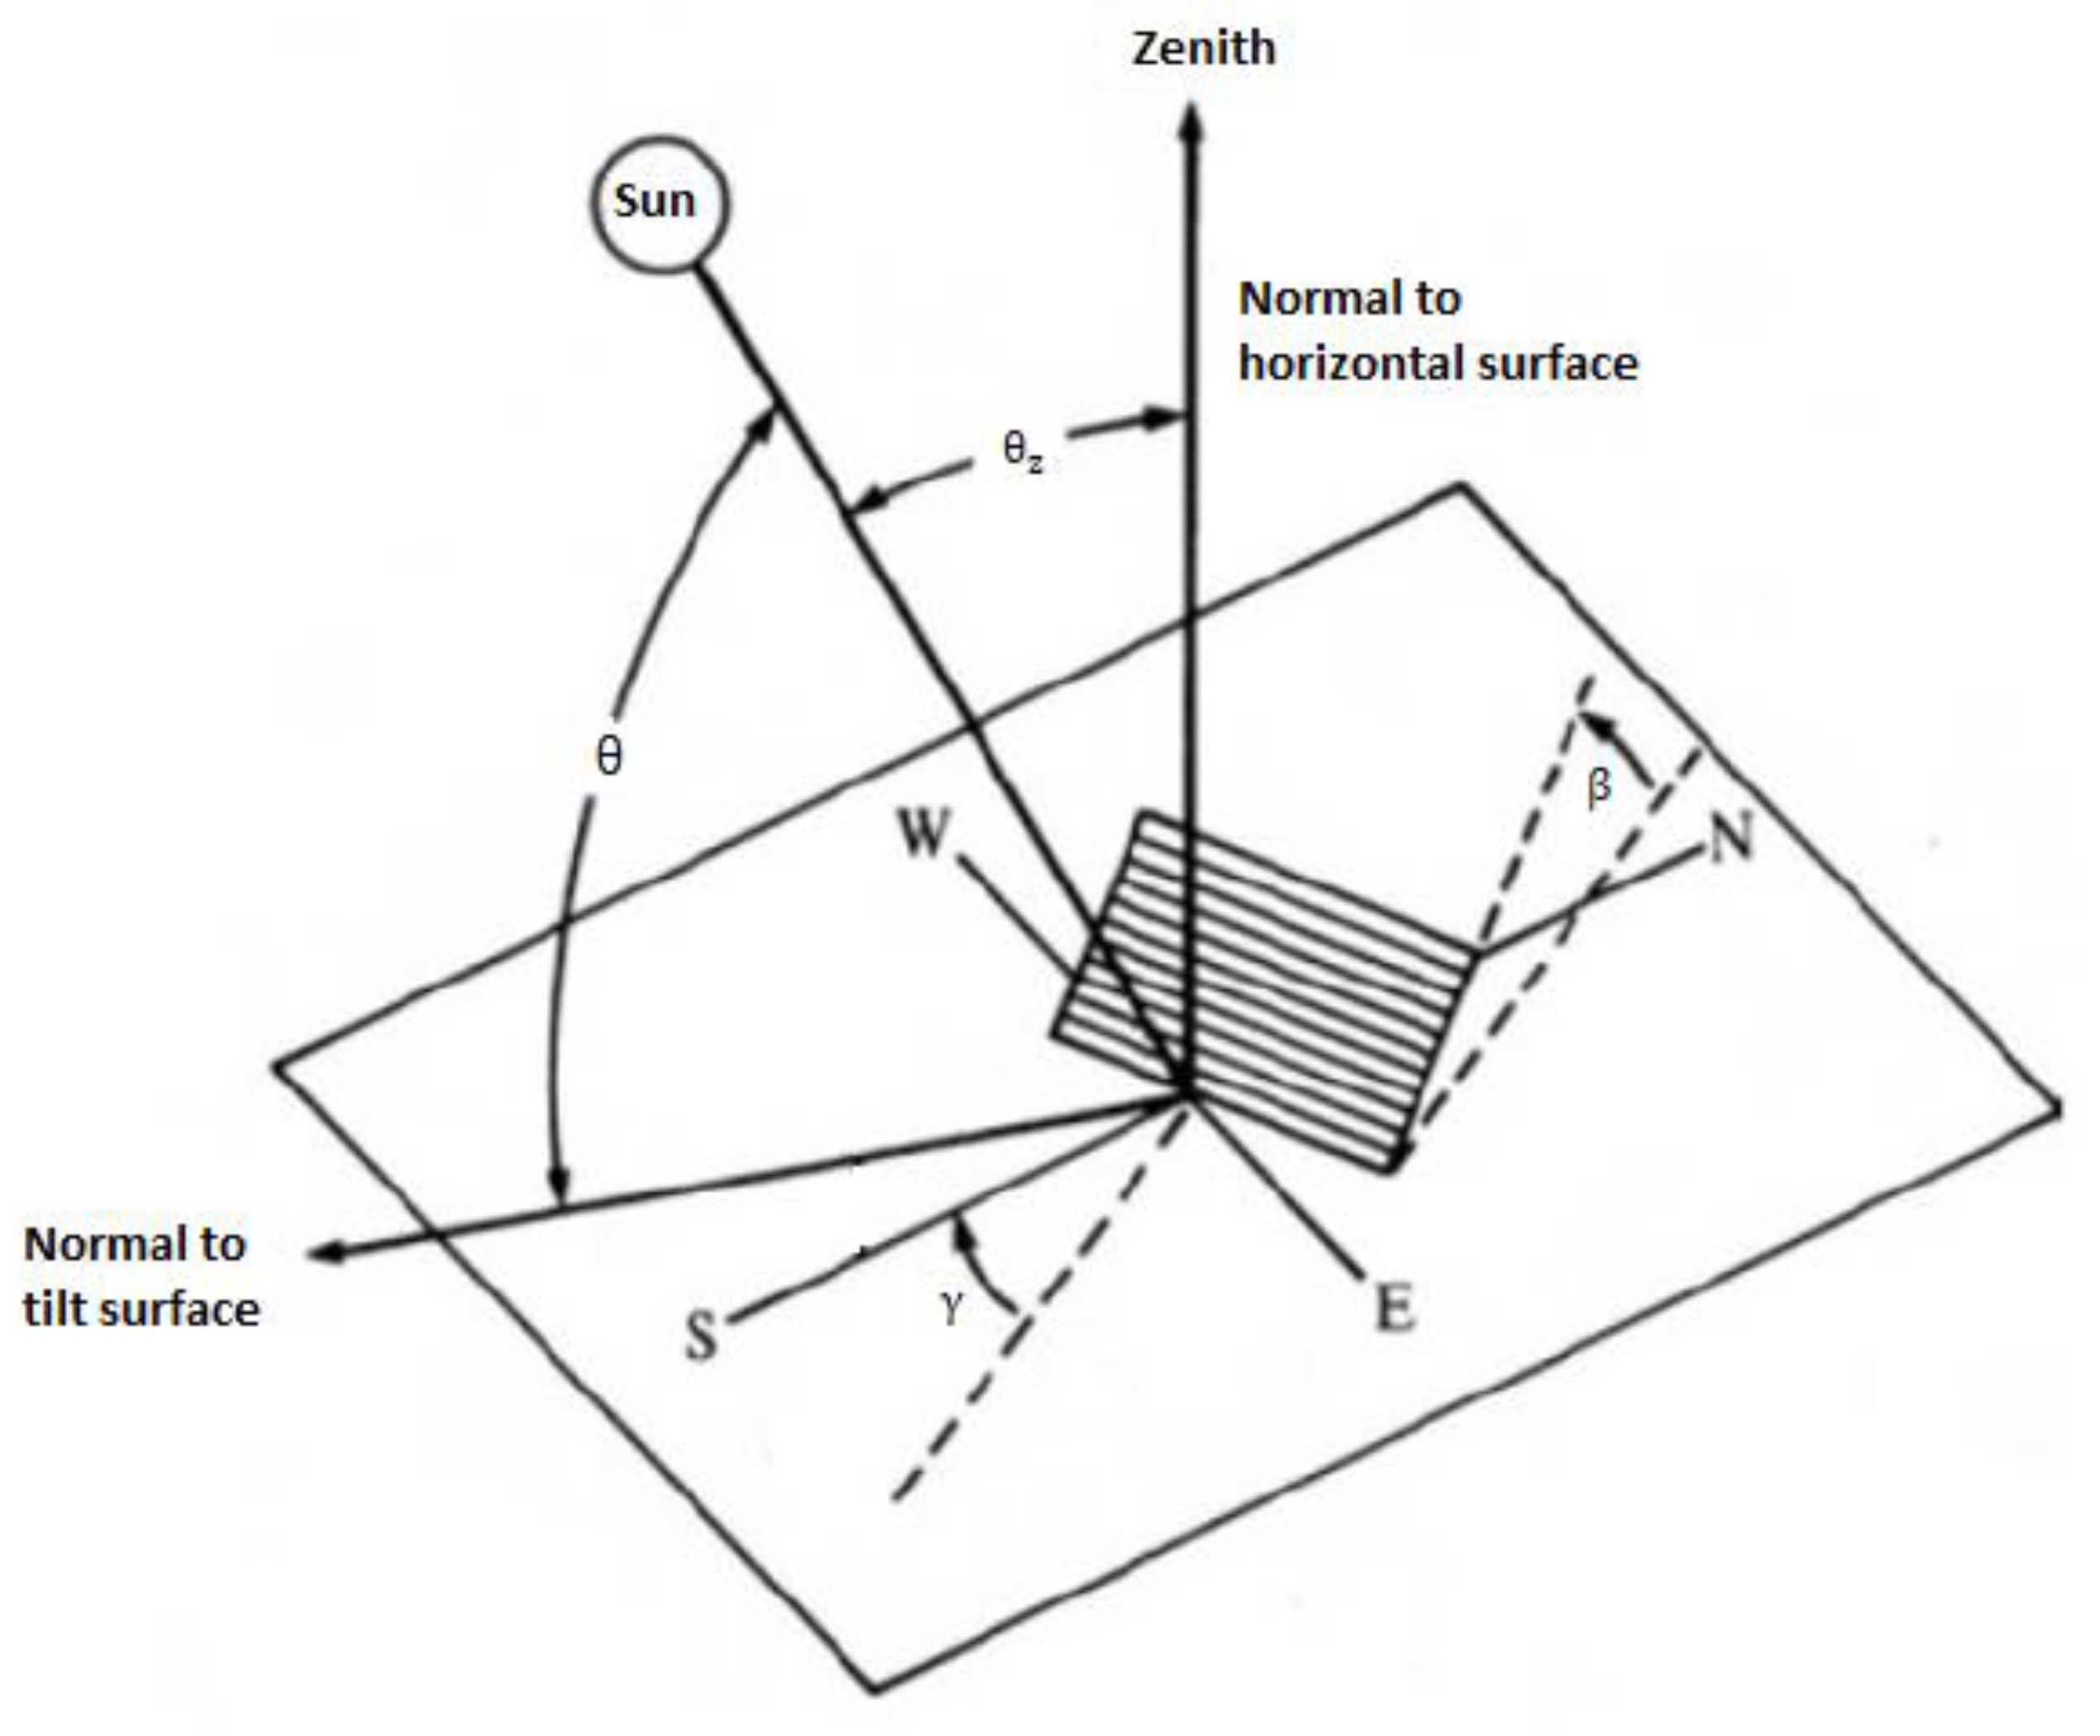
2. Mathematical Model of Solar Radiation

2.1. Declination Angle

The Earth’s rotation axis can be slanted or inclined because it revolves around the Sun at 23.45°. The declination angle is formed by the perpendicular plane and the line between the Sun and Earth. The following formula is used to calculate the annual fluctuations in the declination angle:
δ = 23.45 ° sin [ 360 365 ( 284 + DY ) ]
where DY denotes the number of days in a year beginning in January. (284 + DY) and (DY − 81) are mathematically identical for years without a leap day.

2.2. Sunset Hour Angle

The sunset hour angle ( ω S ) for a particular location can be determined from the Sun’s declination and latitude:
  ω S = cos 1 ( tan φ   tan δ )

2.3. Total Solar Radiation

The total solar radiation received on the slanted surface can be calculated by the IT module as follows:
I T = I B + I R + I D
where ID is the diffuse radiation, IB is the beam radiation, IR is the reflected radiation, and IT is the total tilted surface solar radiation.
An inclined surface receives a considerable amount of total solar radiation via direct beam radiation IB:
I B = ( I g I d ) R b
A global horizontal surface emits both global and diffuse radiation designated as Ig and Id, respectively.
Beam radiation ratio (Rb) is the ratio between the cosine of the incidence-to-zenith angle. It is expressed as follows
R b = cos θ cos θ z
These cosine angles are referred to as solar noon’s angle of incidence.
cos θ = cos δ cos β cos φ + sin φ cos δ sin β cos γ + sin δ cos β sin φ sin δ sin β cos γ cos φ
where φ is the latitude, δ is the declination angle, γ is the azimuth angle of the surface, and β is the tilt angle as shown in Figure 1.
The zenith angle indicates in Figure 1 can be expressed as follows:
cos θ z = cos φ cos δ + sin φ sin δ
In contrast, the reflected radiation is expressed as follows:
I R = ρ g I g ( 1 cos β 2 )
The tilt angle β and a constant of 0.2 are used in this equation to represent the ground of albedo ρ g . Ig represents the global horizontal radiation.

2.4. Diffused Radiation

Diffused radiation (ID) is the percentage of the Sun’s rays scattered and redirected by the atmosphere. Forecasting different fluctuations in its path with diffuse radiation is challenging. Diffused radiation can be divided into three categories: isotropic, circumsolar, and horizon brightening. The isotropic diffuse radiation is uniformly distributed throughout the sky dome. Still, a forward scattering of solar radiation causes diffusion in the circumsolar area [55] and horizon brightening under clear skies close to the horizon [56] as shown in Figure 2. In other words, diffuse radiation dispersed in the space depends on the ground’s reflectivity (albedo). The horizon becomes brighter as surfaces with a high albedo reflect sunlight into the space.
Notably, the diffuse radiation (ID) formula is expressed as follows:
I D = I d R d
where Rd denotes the slanted to horizontal diffuse radiation ratio.

2.5. Diffuse Radiation Models Using Isotropic and Anisotropic Sky Models

Anisotropic and isotropic sky models are the most prominent approaches for estimating diffuse radiation on inclined surfaces. Although several isotropic and anisotropic models are available, four empirical models were considered for this study. Their results were evaluated to determine the most relevant and suitable model for this domain. Two isotropic models (LJ model and Badescu model (BA) and two anisotropic models (HD model and HDKR model) were investigated. The isotropic and anisotropic sky models were used in the following section to compare the estimated findings.

2.5.1. Liu and Jordan Model (LJ)

This method divides the incident solar radiation into three parts: the beam, the ground reflection, and the diffuse fraction. The diffuse radiation was exclusively considered isotropic, whereas circumsolar and horizon brightening was supposed to be zero. Therefore, Liu and Jordan [57] reported the expression as follows: R d = ( 1 + cos β 2 ) .
The total radiation on the surface was calculated from the sum of the beam, Earth reflected, and diffuse radiation on a slanted surface. In other words, it consists of the following components:
I T = ( I g I d ) R b + δ g I g ( 1 cos β 2 ) + I d ( 1 + cos β 2 )

2.5.2. Badescu Model (BA)

To demonstrate the diffuse radiation on tilted surfaces, Badescu used the following expression and described its calculation: R d = ( 3 + cos ( 2 β ) 4 ) . Therefore, the total radiation incident on an inclined surface can be expressed as follows [47]:
I T = ( I g I d ) R b + δ g I g ( 1 cos β 2 ) + I d ( 3 + cos ( 2 β ) 4 )

2.5.3. Hay and Davies Model (HD)

Hay and Davies stated diffuse radiation from the sky must provide isotropic and circumsolar components. In contrast, the horizon brightening components were neglected. The dispersion was assumed to be isotropic in the sky dome for the diffuse parts originating from every direction except those pointing at the Sun. An anisotropy index was used to assign weight to each of the elements ( I B H o ). In the anisotropy index, a portion of diffuse radiation was considered circumsolar. At the same time, the rest was presumed to be isotropic, as advised by Liu and Jordan to manage the reflected section. The theoretical estimate of the total radiation emitted by a tilted surface is expressed as follows:
I T = ( I g I d ) R b + δ g I g ( 1 cos β 2 ) + I d ( I B H o R b + ( 1 I B H o ) ( 1 + cos β 2 ) )
Hay and Davies proposed that the anisotropy index for beam radiation was defined as a function of atmospheric transmittance [53]. I B H o denotes the anisotropy index.
H o denotes the average amount of extraterrestrial radiation received each day during a month. It was used to calculate I D .

2.5.4. Hay−Davies−Klucher−Reindel Model (HDKR)

A new correlation known as the HDKR model was devised based on the solar radiation equation, the reflected beam, and all diffuse radiation-related terminologies, including isotropic, circumsolar, and horizon brightening. It was considered a blend of Klucher and Reindel and Hay and Davies’ models.
Klucher’s ( I B I g ) , also known as the horizontal brightness factor, was incorporated into the HD model [53]. Equation (13) presents the HDKR anisotropic model, which is a modification of the HD model. Accordingly, the irradiance at an inclined surface can be calculated as follows:
I T = ( I g I d ) R b + δ g I g ( 1 cos β 2 ) + I d ( I B H o R b + ( 1 I B H o ) ( 1 + cos β 2 ) × ( 1 + I B I g sin 3 ( β 2 ) ) )

2.6. Extraterrestrial Radiation

It is possible to determine the extraterrestrial radiation that reaches the top of the atmosphere using the following expression:
i o = ( 1 + 0.033   cos 360 × DY 365 )
where DY is the day in a year (1–365), and GSC denotes the solar constant (1.367 kilowatts per square meter). H o represents the horizontal extraterrestrial radiation, which can be determined using the following equation:
H o = 24 3600 G SC π ( i o ) × ( π ω S 180 sin δ sin φ + cos δ sin ω S cos φ )
The equation can be rearranged to calculate the total tilted surface solar radiation:
I T = ( I g I d ) R b + δ g I g ( 1 cos β 2 ) + I d R d

2.7. Power Output

This research calculated the PV arrays’ output power using the following expression [58]:
P PV . = Y PV . f PV . ( G T G T ,   S . T . C . ) [ 1 + α P ( T C T C ,   STC . ) ]
where YPV denotes the PV array output capacity under standard testing conditions (STC) (kW), α P is known as the temperature coefficient of power (percentage/°C), and f PV   is known as the factor of PV derating (percentage). Global Sun irradiance on a PV panel’s tilted surface is called GT. GT,STC is known as the incident radiation under the standard test circumstances (1 kW/m2). T C is the temperature of the PV cell in °C, and T C ,   STC   denotes the temperature of the PV cell at STC (25 °C).
The following equation demonstrated the relationship between a PV cell and its ambient temperature:
T C = T a + ( 0.0256 × G )

3. Electric Charged Particles Optimization Algorithm (ECPO)

The ECPO is a population-based metaheuristic algorithm inspired by the interactions of electrically charged particles. The ECPO uses the following internal parameters: MaxITER, the maximum number of iterations noted; nECP represents the total number of ECPs; nECPI, the number of ECPs that interact in one of the three referred methods; and naECP, the size of the archive pool. The charged particles interact using a standard method in which the superior particle attracts the inferior particle, and the inferior particle repels the superior particle. The entire procedure of optimization is illustrated in Figure 3 while the main steps of the ECPO are summarized as follows:
Initialization: In the first step of ECPO, random normal distributions inside the search space are used to generate nECP charged particles. Thereafter, all particles are classified by fitness.
Archive pool: A distinct naECP (archive pool) is created. Subsequently, the selected ECPs are stored and updated according to the archive’s size for each iteration.
Selection: The effectiveness of the optimization process heavily depends on the ECPO process selection step. A random selection from the created population determines the number of ECPs involved in the interaction (nECPi). The chosen ECPs are ranked from best to worst and followed by interaction.
Interactions: The selected nECPI particles then interact with each other using one of three strategies described below.
Strategy 1: Only the best ECPs are authorized to engage in a dialog with arriving ECP. ECPinew1 and ECPinew2 are the names of (n − 1) new ECPs created using this method, where n is the number of nECPi that have been selected.
Strategy 2: The interaction of ECPbest with any other ECPs is unknown. Although one or two ECPs are involved, only ECPbest could not interact with other ECPs to produce an ECPnew.
Strategy 3: This technique combines strategies one and two. A new population of ECPs (newECP) will be generated for each nECPi or interaction method. All of the new residents are indistinguishable from the original population.
Bounds check: This step verifies the bounds of any ECPnew formed during the interaction stage. The articles found outside the search area will be returned to the sign border.
Diversification: New ECPs will be diversified using the likelihood of diversification at this stage (Pd). The diversity operator will collect data from both the new and archived ECPs.
Population update: The new population from rank 1 to nECP will be modified and stored in the archive pool.

4. Proposed Approach

4.1. Description

Selecting a location and site-specific characteristics, such as direct and diffuse solar radiation data, are required for estimating solar radiation. The optimization process can begin after collecting the required data and identifying the number of periods and the current model for the computation of solar radiation. This research presents the variable that will be adjusted to optimize the solar radiation and power of the inclined surface. Figure 4 depicts the whole process of optimization.

4.2. Objective Function

The main objective function maximizes the estimation of solar radiation (IT) and power (P). f (β) = IT, P

4.3. Design Variable

The design variable is the tilt angle that is represented as β.
  • Maximize f (IT, P)
  • Subjected to βmin ≤ β ≤ βmax

4.4. Constraints

The ECPO technique is used in this research to determine the optimal tilt angle values. Initially, the tilt angle was searched in the range of [−10, +90].
  • −10 ≤ β ≤ 90
  • Different parameters and functions for applying the ECPO algorithm are used in MATLAB and are expressed as follows.
  • Number of variables 1
  • Limit [−10, 90]
  • Population size or ECP size 50
  • No of iteration, MaxITER 100
Figure 4 shows the flowchart of the proposed approach for determining the appropriate tilt angle. A MATLAB software program was used to implement this approach. The first step in this procedure is selecting the desired location: the preferred city. Furthermore, this study’s diffuse and direct Sun radiation data are used to identify the desired location.
Although a single-day tilt angle adjustment is obvious, this is not feasible. It cannot address the problem. Consequently, the proposed technique has been designed to apply throughout various periods. For instance, If NP is 4, the tilt angle will change after four phases (91, 91, 91, and 92 days each).
For this study’s purposes, this research assumes that the year begins on 1 January and concludes on 31 December. However, this section is optional. A year may be added to the study’s timeline, or the lead project engineer may choose the study’s start and finish dates based on its schedule.
The ECPO method determines the best tilt angle for each period after selecting the number of periods and the model. The procedure concludes by displaying the optimal tilt angles, solar radiation, and power for various periods.

5. Results and Discussion for Dhahran and Makkah Cities

This section investigated the ideal tilt angle for PV panels and the maximum energy generation from a solar array system based on latitude and climate (solar radiation) in Saudi Arabia. The eastern and western regions of Saudi Arabia were selected as the study area because they have a wide range of climates. Although Saudi Arabia is a large country, different regions experience a wide variation of humidity and temperature throughout the year. Dhahran’s climate is a tiny version of such conditions comprising hot and humid weather. The studied cities in the KSA are listed below:
  • Eastern region of Dhahran (26.23° N, 50.03° E)
  • Western region of Makkah (21.38° N, 39.85° E)
Three alternative ECPO algorithm strategies were used to optimize various scenarios for each case. Strategies were simultaneously implemented to validate the proposed algorithm to solve all four models with the same parameters for different periods. Subsequently, the findings were compared to determine the optimum strategy. However, similar results were obtained for all procedures while running the algorithm for each model having different periods. The ECPO algorithm’s first strategy was only used to avoid lengthy descriptions. The ECPO algorithm results were discussed to evaluate the horizontal surface performance over the tilted surface solar radiation. The optimized tilted solar radiation was better than the horizontal surface for all two isotropic and anisotropic models.
The proposed method has been applied to Dhahran, Saudi Arabia, to determine an ideal tilt angle. Three distinct periods of NPs (365, 12, and 4) were tested. Figure 5 depicts the best tilt angle falling upon a tilted surface of tested NPs obtained using the ECPO algorithm for two isotropic and anisotropic models.
Figure 5a shows the daily variations in the optimized tilt angle for the LJ, BA, HD, and HDKR models when Np = 365. Their angles ranged from 2.01–48.82° (LJ) to 0.64–47.35° (BD), 1.38–48.82° (HD), and 4.93–49.57°, respectively. Figure 5b displays the ideal tilt angle variation (12 periods) throughout a year when NP = 12. The figure shows that the optimal tilt angles were between 2.51° and 44.06° (LJ), 1.87° and 39.64° (BA), 2.51° and 44.06° (HD), and 6.08° and 45.79° (HDKR), respectively. Figure 5c demonstrates the fluctuations in the ideal tilt angle when NP = 4. The figure shows that the optimal tilt angles were between 7.0° and 39.66° (LJ), 5.16° and 35.26° (BA), 7.00° and 39.66° (HD), and 10.66° and 41.45° (HDKR), respectively. Figure 5 depicts the optimum tilt angles revealed using four models for all the evaluated NPs. The same analysis performed for all models using the ECPO method for fixed periods or intervals has been performed on the findings. Figure 5 presents this analysis’s results, and the values are tabulated in Table 1 and Table 2.
The solar radiation emitted by a horizontal surface and the total Sun radiation emitted by a slanted surface for multiple NPs were examined (Figure 6). The proposed technique received substantially more solar radiation than the one with fixed panels positioned horizontally for all four models (Figure 6a–c). Table 1 and Table 2 summarize the optimal results of the LJ, the BA, the HD, and the HDKR models for Dhahran. The condition of NP = 365 was excluded to keep the length of this work to a minimum. Table 1 indicates that the amount of solar radiation extracted on a horizontal surface received an average of 5709.99 Wh/m2/d over the year. The adjacent tilt angle allowed the panel to absorb 6136.50 Wh/m2/d (the LJ model), 6062.31 Wh/m2/d (the BA model), 6136.49 Wh/m2/d (the HD model), and 6222.45 Wh/m2/d (the HDKR model) of solar radiation on a tilted surface when NP = 12. The gain percentages for NP = 12 were 7.46% (the LJ model), 6.17% (the BA model), 7.46% (the HD model), and 8.97% (the HDKR model). Table 2 indicates that the adjacent tilt angle allowed the panel to absorb solar radiation at the tilted surface at 6132.99 Wh/m2/d (the LJ model), 6058.67 Wh/m2/d (the BA model), 6132.99 Wh/m2/d (the HD model), and 6221.53 Wh/m2/d (the HDKR model) for all models when NP = 4. The gain percentages for NP = 4 were 7.42 (the LJ model), 6.12 (the BA model), 7.42 (the HD model), and 8.96% (the HDKR model), respectively, compared to the solar energy captured by a horizontal surface. Moreover, a daily adjustment enabled the panel to collect 6155.64 Wh/m2/d (the LJ model), 6088.21 Wh/m2/day (the BA model), 6155.64 Wh/m2/day (the HD model), and 6235.81 Wh/m2/day (the HDKR model) of solar radiation. Figure 6a–c presents the results of the same analysis performed for all models using the ECPO method for set periods or intervals, and the values are tabulated in Table 1 and Table 2.

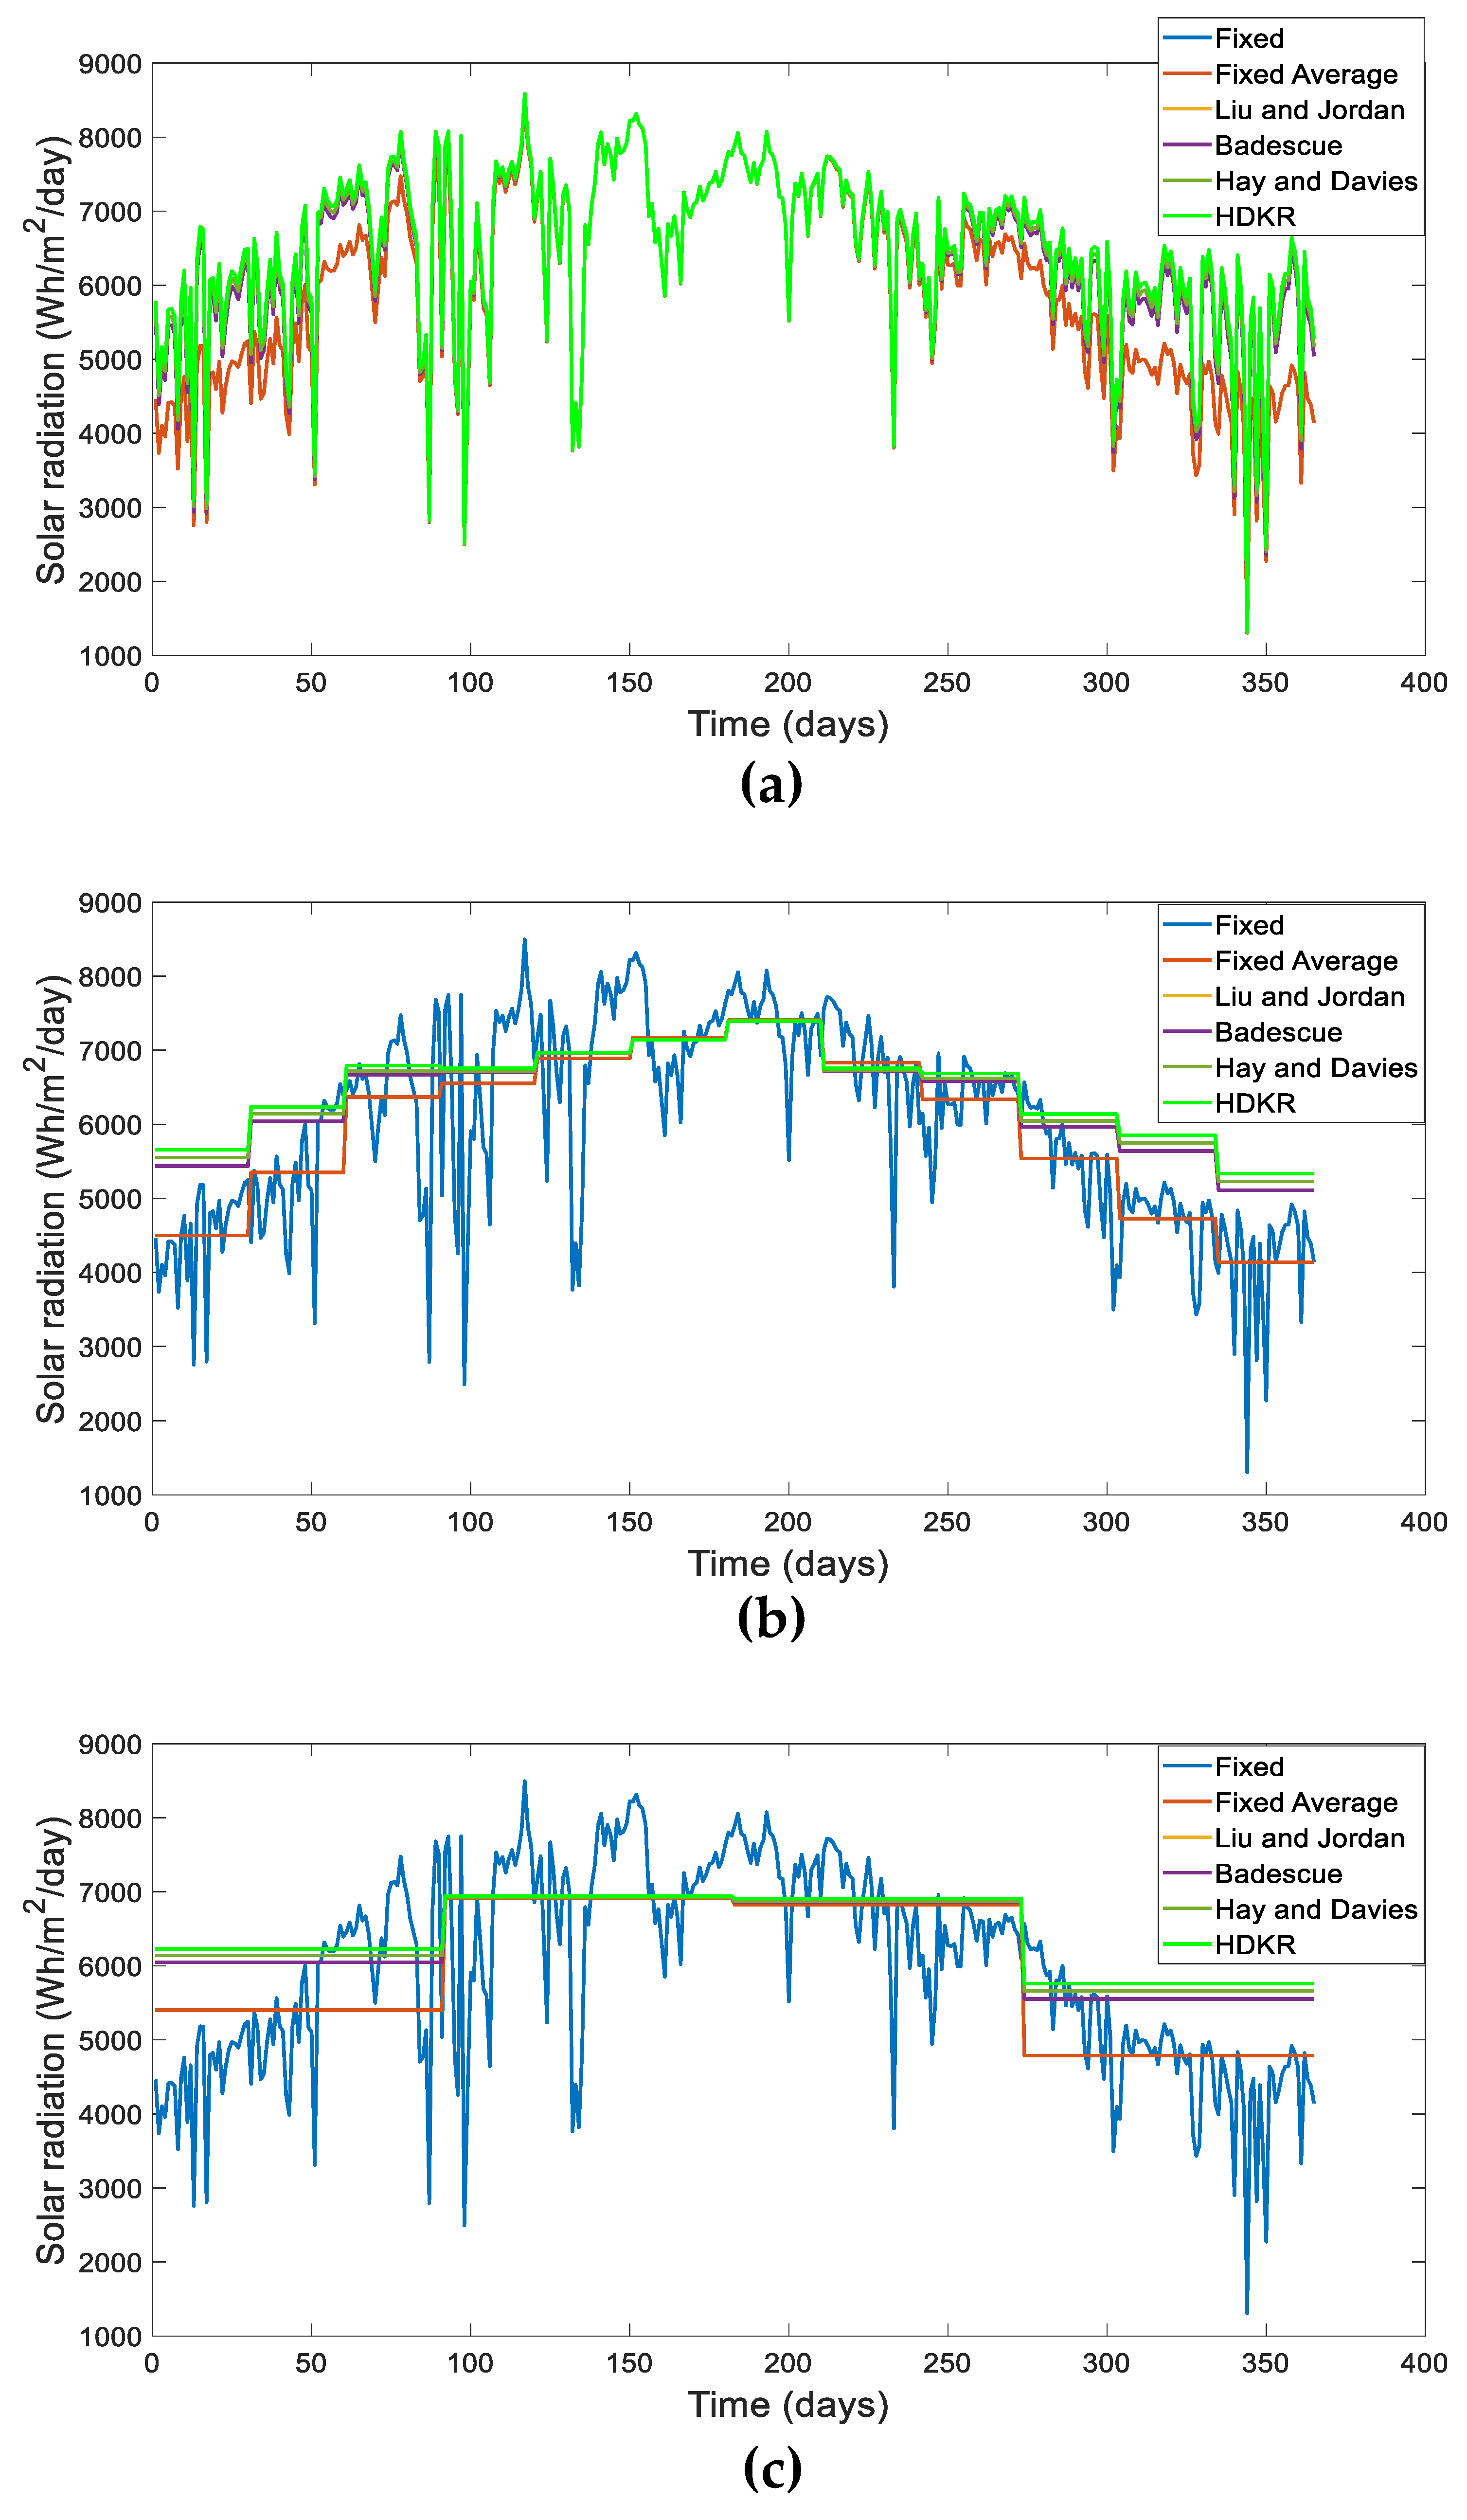
5.1. Tilted Surfaces Produce Variable Amounts of Solar Radiation When Several Models Are Utilized

The results of the LJ, BA, HD, and HDKR models were compared. Meanwhile, the ECPO algorithm was applied, and more solar radiation was captured on the tilted surface than on the horizontal surface. Table 1 and Table 2 showed that the HDKR model executed much greater values than the LJ, BA, and HD models.
Among all models, the HDKR model demonstrated the highest estimated values. It was possible because this model considered all diffuse components independently and incorporated a modulating element. LJ and HD models extracted the same amount of solar radiation, whereas the BA model had the lowest estimated outcome of all other isotropic and anisotropic models. Because of the ECPO optimization algorithm, all models indicated that the tilted surface (IT) received higher solar radiation than the horizontal surface (Ig). Table 1 and Table 2 presented the best tilt angle and global horizontal and tilted surface radiation for Dhahran based on four empirical models. Considering these models, the total solar radiation reaching a tilted surface was superior to that reaching a flat surface.

5.2. Power Generation Output

Certain factors must be properly selected for the PV system to produce maximum output. In this study, Dhahran in Saudi Arabia was investigated for the orientation and tilt angle of the PV system. Numerous tilt angles were analyzed for different time intervals (every day, 4 periods, and 12 periods) to determine the amount of electricity obtained and the best alignment angles for the PV system.
The daily average output power of a 1 kW PV panel was found to be 485.25 W (the LJ model), 479.81 W (the BA model), 485.25 W (the HD model), and 491.65 W (the HDKR model) at the tilt panel surfaces of 21.80°, 18.41°, 21.80°, and 24.65°, respectively (Figure 7a). Here, the HDKR model demonstrated higher estimated values than the other three models (Figure 7). Although the modification of yearly intervals minimized the power production, the daily change resulted in a higher yield (Figure 7a) for all models. Therefore, the tilt angle should be adjusted for a short period to maximize the PV system’s power output.
Figure 7 shows the power output of PV arrays at the analyzed locations. Table 3 and Table 4 present the PV arrays’ power output for different tilt angles and periods. The performance of all four models was evaluated and is presented in Table 3 and Table 4. Figure 7a–c presents the graphical representation of these performances.
Based on LJ’s isotropic and HDKR anisotropic models, the four tilt periods for Dhahran were calculated at 22.99° and 25.73°, respectively. The maximum power generated by a PV array in Dhahran was 483.98 W for the LJ isotropic model and 491.04 W for the HDKR anisotropic model while considering four periods (Table 4, Figure 7a–c). The optimized power for several isotropic and anisotropic models is tabulated in Table 3 and Table 4 at the periods 12 and 4, respectively. These results were compared to understand the HDKR anisotropic model performance against other isotropic and anisotropic models in Dhahran city.
Table 5 presents the monocrystalline PV parameters used to simulate Equation (17). The derating factor was estimated to be fPV = 80% because of the manufacturer’s output tolerance, the inverter’s efficiency in converting DC to AC power, the inverter connections, wirings, soiling, and shading. Dhahran is located at a latitude of 26.236° E. The electricity generated by a 1 kilowatt monocrystalline PV panel was analyzed by adjusting the tilt angle between 0° and 90°. Three scenarios with varying solar radiation and power were examined while keeping the tilt angle between 0° and 90°. Daily adjustments to tilt angles were inconsistent, even though different periods were selected throughout the year. A PV system’s output power depends on several characteristics; hence, it must be carefully selected to achieve maximum output. The orientation and tilt angle of PV systems were evaluated for the Saudi Arabian cities of Dhahran and Makkah. Multiple tilt angles were evaluated throughout the year at different periods to decide the optimum orientation angle of the PV system for generating the highest amount of energy.

5.3. Results for Makkah City

The proposed method has been applied to determine the optimal tilt angle for Makkah, Saudi Arabia. Three distinct periods of NPs (365, 12, and 4) were studied. Figure 8 shows the optimum tilt angles at which the solar radiation will strike a tilted surface of tested NPs obtained using the ECPO algorithm for four isotropic and anisotropic models.
Figure 8a shows the daily variations in the optimized tilt angle for LJ, BA, HD, and HDKR models when Np = 365. This angle ranged from −1.95° and 44.98° (LJ) to −1.65° and 43.52° (BA), −1.95° and 44.98° (HD), and 0.01° and 45.68° (HDKR). Figure 8b illustrates the fluctuations in the optimal tilt angle throughout a year (when NP = 12). The figure shows that the optimal tilt angle was between −1.62° and 42.28° (LJ), −1.36° and 39.21° (BA), −1.62° and 42.28° (HD), and 0.68° and 43.58° (HDKR). Figure 8c demonstrates the fluctuations in the optimum tilt angle when NP = 4. The figure illustrates that the ideal tilt angle was between 3.80° and 36.87° (LJ), 3.20° and 33.48° (BA), 3.80° and 36.87° (HD), and 6.06° and 38.36° (HDKR). Figure 8 depicts the optimum tilt angles found using four models for all the evaluated NPs. The same analysis was performed for all models using the ECPO method for fixed periods or intervals (Figure 8, Table 6 and Table 7).
Figure 9 compares the total radiation emitted by a horizontal surface with the total solar radiation emitted by a tilted surface of various NPs. The proposed technique received substantially more solar radiation than the one with horizontally positioned fixed panels for all four models (Figure 9a–c). Table 6 and Table 7 summarize the optimum results of LJ, BA, HD, and the HDKR models for Makkah. The scenario of NP = 365 was excluded from this paper to minimize lengthy discussion. Table 6 shows that solar radiation on a horizontal surface received an average of 5983.01 Wh/m2/d throughout the year. The adjacent tilt angle allowed the panel to absorb 6415.11 Wh/m2/d (the LJ model), 6362.16 Wh/m2/d (the BA model), 6415.08 Wh/m2/d (the HD model), and 6474.93 Wh/m2/d (the HDKR model) of solar radiation on a tilted surface when NP = 12. The gain percentages for NP = 12 were 7.22% (the LJ model), 6.33% (the BA model), 7.22% (the HD model), and 8.22% (the HDKR model). According to Table 7, the adjacent tilt angle allowed the panel to absorb 6398.11 Wh/m2/d (the LJ model), 6346.32 Wh/m2/d (the BA model), 6398.10 Wh/m2/d (the HD model), and 6459.22 Wh/m2/d (the HDKR model) of solar radiation at a tilted surface when NP = 4. The gain percentages for NP = 4 were 6.99% (the LJ model), 6.12% (the BA model), 6.99% (the HD model), and 8.01% (the HDKR model), respectively, compared to the solar energy captured by a horizontal surface. In addition, a daily adjustment enabled the panel to collect 6425.031 Wh/m2/day (the LJ model), 6374.5 Wh/m2/day (the BA model), 6425.033 Wh/m2/day (the HD model), and 6482.386 Wh/m2/day (the HDKR model) of solar radiation. Figure 9a–c presents the results of the same analysis performed for all four models using the ECPO algorithm for set periods or intervals. The values are tabulated in Table 6 and Table 7.

5.4. Solar Radiation Measured on a Tilted Surface Varies When Different Models Are Used

The HDKR model exhibited the highest estimated values among all models. It was achievable because this model considered all diffuse components independently and incorporated a modulating element. LJ and HD models extracted the same amount of solar radiation. Meanwhile, the BA model had the lowest estimated outcome of all other isotropic and anisotropic models. Due to the ECPO optimization algorithm, all models indicated that the tilted surface (IT) received higher solar radiation than the horizontal surface (Ig). Table 6 and Table 7 present the best tilt angle and global horizontal radiation for Makkah based on four empirical models. Based on the ECPO optimization algorithm, all models indicated that the tilted surface (IT) received more solar radiation than the horizontal surface (Ig).

5.5. PV Power Generation Output

Certain factors must be appropriately selected for the PV system to produce maximum power. This study examined Makkah in Saudi Arabia for its PV system orientation and tilt angle. Numerous tilt angles were analyzed for various time intervals (each day, 4 periods, and 12 periods) to determine the amount of power obtained and the best orientation angles for the PV system. The daily average output power of a 1 kW PV panel was 504.40 W (LJ), 500.37 W (BA), 504.41 W (HD), and 508.96 W (HDKR) at the tilt panel surfaces of 19.95°, 17.85°, 19.95°, and 21.89°, respectively (Figure 10a). The HDKR model demonstrated the highest estimated values compared to the other three models (Figure 10). In contrast, modifications of yearly adjustment in intervals reduced the power production, whereas daily changes resulted in a higher yield. Therefore, the tilt angle should be adjusted early to maximize the PV system’s power output.
Figure 10 demonstrates the PV arrays’ power output at analyzed locations, whereas Table 8 and Table 9 present the PV arrays’ power output for various tilt angles and periods. The performance of all four models was evaluated and is presented in Table 8 and Table 9. Figure 10a–c presents these performances in graphical form.
For Makkah, the four tilt periods based on the LJ isotropic and HDKR anisotropic model were determined to be 20.43° and 22.29°, respectively. The maximum power generated by a solar array in Makkah was 502.51 W for the LJ isotropic model and 507.36 W for the HDKR anisotropic model while considering the four periods (Table 9 and Figure 10a–c). The optimized power for several isotropic and anisotropic models is tabulated in Table 8 and Table 9 for the periods of 12 and 4, respectively. These results were compared to understand the HDKR anisotropic model performance against other isotropic and anisotropic models in Makkah city.

5.6. Results Comparison of Dhahran and Makkah Cities

As shown in Table 10 and Table 11, the HDKR model for both cities was considered. IT increased by approximately 89,999.14, 92,155.2, and 86,756.85 Wh/m2/year in Makkah city compared with the horizontal surface for NP = 365, NP = 12, and NP = 4. However, daily modifications could enable the panel to attain solar radiation of 6235.813 Wh/m2/d. As shown in the table, the yearly values were divided by 365 (the number of days in a year) to obtain the average daily values.
The total radiation on a tilted surface is compared in Figure 11 and Table 12 using the optimum tilt angle estimates and various yearly tilt angle adjustments. The tilt angle has been adjusted from 90° minus the latitude by ±23°. Maximum Solar radiation is observed when the optimum tilt angle is applied for adjustment. The worst-case scenario is when the tilt angle stays at 90° or near 90° for the entire year. Table 12 shows that the optimal tilt angle estimates for Dhahran and Makkah are higher than the adjusted tilt angle for a whole year.

6. Conclusions

The advantages of clean energy over fossil fuel are evident due to its environmentally friendly nature. More and more countries are making great efforts to develop solar power. Therefore, this work is crucial for environmental protection and energy transition. This study used the recently developed ECPO algorithm to identify the optimal tilt angle of solar PV arrays. The research was conducted in the Saudi Arabian cities of Dhahran and Makkah to establish the ideal tilt angle for PV panels for capturing the maximum solar radiation and producing the highest power. Solar radiation parameters were used to determine the proper tilt angle. The NP per year was used in the optimization of the tilt angle. The ECPO algorithm was used to estimate the solar radiation for each time. However, the optimal tilt angle was determined by the period’s maximum solar radiation. The optimization results demonstrated that the anticipated ideal tilt angle captured more solar radiation than an untilted surface.
This study suggests that both models presented different values, even though the anisotropic model produced somewhat greater values than the isotropic model. After understanding the effects of solar radiation, tilt angle, and PV power production, the HDKR model and ECPO algorithm were effectively used in two different cities of Saudi Arabia to evaluate the combined effects of solar radiation and tilt position for assessing the PV power output. The results indicate that increasing the number of modifications each year increases proficiency. Four models have been evaluated in this study. The HDKR model can absorb more solar radiation on a tilted surface than the other three using the ECPO algorithm.
In this paper, the ECPO approach, combined with the HDKR model, was used to calculate the solar radiation efficiency of a sloped surface for determining the optimal tilt angle for the PV array. For Dhahran, the HDKR model for NP = 4 had tilt angles of 35.59°, 10.64°, 15.24°, and 41.45°. Compared to the other places estimated with the same model and the same number of periods, the tilt angles for Makkah were 33.53°, 6.06°, 11.21°, and 38.36°, which improved the IT by 86,756.85 Wh/m2/year. Dhahran received annual average solar radiation of 6221.53 Wh/m2/day. Makkah had 6459.22 Wh/m2/day of solar radiation on a tilted surface. Finally, it is highly advised that dust and shading, the tilt angle, and slanted surface solar radiation impact should be considered to maximize the output of a PV system.

Author Contributions

Conceptualization, M.S.K. and M.A.M.R.; methodology, M.S.K. and T.H.; software, M.S.K. and T.H.; validation, M.A.M.R., H.F.S. and H.R.E.H.B.; formal analysis, M.S.K., M.A.M.R. and H.F.S.; investigation, M.A.M.R.; resources, M.A.M.R.; writing—original draft preparation, M.S.K.; writing—review and editing, M.A.M.R., H.F.S., H.R.E.H.B. and T.H.; supervision, M.A.M.R.; funding acquisition, M.A.M.R. All authors have read and agreed to the published version of the manuscript.

Funding

This research was funded by Deputyship for Research and Innovation, Ministry of Education in Saudi Arabia, grant number IFPRC-190-135-2020.

Acknowledgments

The authors extend their appreciation to the Deputyship for Research & Innovation, Ministry of Education in Saudi Arabia for funding this research work through the project number IFPRC-190-135-2020 and King Abdulaziz University, DSR, Jeddah, Saudi Arabia.

Conflicts of Interest

The authors declare no conflict of interest.

References

  1. Furlan, C.; Mortarino, C. Forecasting the Impact of Renewable Energies in Competition with Non-Renewable Sources. Renew. Sustain. Energy Rev. 2018, 81, 1879–1886. [Google Scholar] [CrossRef]
  2. Kabir, E.; Kumar, P.; Kumar, S.; Adelodun, A.A.; Kim, K.H. Solar Energy: Potential and Future Prospects. Renew. Sustain. Energy Rev. 2018, 82, 894–900. [Google Scholar] [CrossRef]
  3. REN21. Renewables 2020 Global Status Report; REN21: Paris, France, 2020; ISBN 978-3-948393-00-7. [Google Scholar]
  4. The True Carbon Footprint of Photovoltaic Energy—ONE Only Natural Energy. Available online: https://www.onlynaturalenergy.com/the-true-carbon-footprint-of-photovoltaic-energy/ (accessed on 31 May 2022).
  5. Hertwich, E.G.; Gibon, T.; Bouman, E.A.; Arvesen, A.; Suh, S.; Heath, G.A.; Bergesen, J.D.; Ramirez, A.; Vega, M.I.; Shi, L. Integrated Life-Cycle Assessment of Electricity-Supply Scenarios Confirms Global Environmental Benefit of Low-Carbon Technologies. Proc. Natl. Acad. Sci. USA 2015, 112, 6277–6282. [Google Scholar] [CrossRef] [Green Version]
  6. What Is the Carbon Footprint of a Solar Panel? Overview and Emissions. Available online: https://www.treehugger.com/how-much-co-does-one-solar-panel-create-4868753 (accessed on 31 May 2022).
  7. Mansour, R.B.; Mateen Khan, M.A.; Alsulaiman, F.A.; Mansour, R.B. Optimizing the Solar PV Tilt Angle to Maximize the Power Output: A Case Study for Saudi Arabia. IEEE Access 2021, 9, 15914–15928. [Google Scholar] [CrossRef]
  8. IEA. Solar Energy: Maping the Road Ahead; IEA: Paris, France, 2019; Volume 20, pp. 1–82. [Google Scholar]
  9. Kaddoura, T.O.; Ramli, M.A.M.; Al-Turki, Y.A. On the Estimation of the Optimum Tilt Angle of PV Panel in Saudi Arabia. Renew. Sustain. Energy Rev. 2016, 65, 626–634. [Google Scholar] [CrossRef]
  10. Li, R.; Li, C.; Liu, M.; Vivo, P.; Zheng, M.; Dai, Z.; Zhan, J.; He, B.; Li, H.; Yang, W.; et al. Hydrogen-Bonded Dopant-Free Hole Transport Material Enables Efficient and Stable Inverted Perovskite Solar Cells. CCS Chem. 2021, 3, 3309–3319. [Google Scholar] [CrossRef]
  11. Krebs, F.C.; Espinosa, N.; Hösel, M.; Søndergaard, R.R.; Jørgensen, M. 25th Anniversary Article Rise to Power OPV-Based Solar Parks. Adv. Mater. 2014, 26, 29–39. [Google Scholar] [CrossRef]
  12. Chen, Y.M.; Lee, C.H.; Wu, H.C. Calculation of the Optimum Installation Angle for Fixed Solar-Cell Panels Based on the Genetic Algorithm and the Simulated-Annealing Method. IEEE Trans. Energy Convers. 2005, 20, 467–473. [Google Scholar] [CrossRef]
  13. Mbungu, N.T.; Naidoo, R.; Bansal, R.C.; Bipath, M. Optimisation of Grid Connected Hybrid Photovoltaic-Wind-Battery System Using Model Predictive Control Design. IET Renew. Power Gener. 2017, 11, 1760–1768. [Google Scholar] [CrossRef]
  14. Xue, X. Prediction of Daily Diffuse Solar Radiation Using Artificial Neural Networks. Int. J. Hydrogen Energy 2017, 42, 28214–28221. [Google Scholar] [CrossRef]
  15. Yaniktepe, B.; Genc, Y.A. Establishing New Model for Predicting the Global Solar Radiation on Horizontal Surface. Int. J. Hydrogen Energy 2015, 40, 15278–15283. [Google Scholar] [CrossRef]
  16. Saraf, G.R.; Hamad, F.A.W. Optimum Tilt Angle for a Flat Plate Solar Collector. Energy Convers. Manag. 1988, 28, 185–191. [Google Scholar] [CrossRef]
  17. Khahro, S.F.; Tabbassum, K.; Talpur, S.; Alvi, M.B.; Liao, X.; Dong, L. Evaluation of Solar Energy Resources by Establishing Empirical Models for Diffuse Solar Radiation on Tilted Surface and Analysis for Optimum Tilt Angle for a Prospective Location in Southern Region of Sindh, Pakistan. Int. J. Electr. Power Energy Syst. 2015, 64, 1073–1080. [Google Scholar] [CrossRef]
  18. Benghanem, M. Optimization of Tilt Angle for Solar Panel: Case Study for Madinah, Saudi Arabia. Appl. Energy 2011, 88, 1427–1433. [Google Scholar] [CrossRef]
  19. Calabrò, E. An Algorithm to Determine the Optimum Tilt Angle of a solar panel from global horizontal solar radiation. J. Renew. Energy 2013, 2013, 12. [Google Scholar] [CrossRef] [Green Version]
  20. Beringer, S.; Schilke, H.; Lohse, I.; Seckmeyer, G. Case Study Showing That the Tilt Angle of Photovoltaic Plants Is Nearly Irrelevant. Sol. Energy 2011, 85, 470–476. [Google Scholar] [CrossRef]
  21. Navntoft, L.C.; Fernandez-Ibañez, P.; Garreta, F. UV Solar Radiation on a Tilted and Horizontal Plane: Analysis and Comparison of 4years of Measurements. Sol. Energy 2012, 86, 307–318. [Google Scholar] [CrossRef]
  22. Despotovic, M.; Nedic, V. Comparison of Optimum Tilt Angles of Solar Collectors Determined at Yearly, Seasonal and Monthly Levels. Energy Convers. Manag. 2015, 97, 121–131. [Google Scholar] [CrossRef]
  23. Jafarkazemi, F.; Saadabadi, S.A. Optimum Tilt Angle and Orientation of Solar Surfaces in Abu Dhabi, UAE. Renew. Energy 2013, 56, 44–49. [Google Scholar] [CrossRef]
  24. Chang, T.P. The Sun’s Apparent Position and the Optimal Tilt Angle of a Solar Collector in the Northern Hemisphere. Sol. Energy 2009, 83, 1274–1284. [Google Scholar] [CrossRef]
  25. Gong, X.; Kulkarni, M. Design Optimization of a Large Scale Rooftop Photovoltaic System. Sol. Energy 2005, 78, 362–374. [Google Scholar] [CrossRef]
  26. Hussein, H.M.S.; Ahmad, G.E.; El-Ghetany, H.H. Performance Evaluation of Photovoltaic Modules at Different Tilt Angles and Orientations. Energy Convers. Manag. 2004, 45, 2441–2452. [Google Scholar] [CrossRef]
  27. Suthar, M.; Singh, G.K.; Saini, R.P. Performance Evaluation of Sun Tracking Photovoltaic Systems: A Case Study. IET Conf. Publ. 2013, 2013, 328–335. [Google Scholar] [CrossRef]
  28. Al Garni, H.Z.; Awasthi, A.; Ramli, M.A.M. Optimal Design and Analysis of Grid-Connected Photovoltaic under Different Tracking Systems Using HOMER. Energy Convers. Manag. 2018, 155, 42–57. [Google Scholar] [CrossRef]
  29. Vermaak, H.J. Techno-Economic Analysis of Solar Tracking Systems in South Africa. Energy Procedia 2014, 61, 2435–2438. [Google Scholar] [CrossRef] [Green Version]
  30. Eldin, S.A.S.; Abd-Elhady, M.S.; Kandil, H.A. Feasibility of Solar Tracking Systems for PV Panels in Hot and Cold Regions. Renew. Energy 2016, 85, 228–233. [Google Scholar] [CrossRef]
  31. Sinha, S.; Chandel, S.S. Analysis of Fixed Tilt and Sun Tracking Photovoltaic-Micro Wind Based Hybrid Power Systems. Energy Convers. Manag. 2016, 115, 265–275. [Google Scholar] [CrossRef]
  32. de Bernardez, L.S.; Buitrago, R.H.; García, N.O. Photovoltaic Generated Energy and Module Optimum Tilt Angle from Weather Data. Int. J. Sustain. Energy 2011, 30, 311–320. [Google Scholar] [CrossRef]
  33. Akhlaghi, S.; Sangrody, H.; Sarailoo, M.; Rezaeiahari, M. Efficient Operation of Residential Solar Panels with Determination of the Optimal Tilt Angle and Optimal Intervals Based on Forecasting Model. IET Renew. Power Gener. 2017, 11, 1261–1267. [Google Scholar] [CrossRef]
  34. Chang, Y.P. An Ant Direction Hybrid Differential Evolution Algorithm in Determining the Tilt Angle for Photovoltaic Modules. Expert Syst. Appl. 2010, 37, 5415–5422. [Google Scholar] [CrossRef]
  35. Chang, Y.P. Optimal the Tilt Angles for Photovoltaic Modules Using PSO Method with Nonlinear Time-Varying Evolution. Energy 2010, 35, 1954–1963. [Google Scholar] [CrossRef]
  36. Chang, Y.P. Optimal the Tilt Angles for Photovoltaic Modules in Taiwan. Int. J. Electr. Power Energy Syst. 2010, 32, 956–964. [Google Scholar] [CrossRef]
  37. Ismail, M.S.; Moghavvemi, M.; Mahlia, T.M.I. Analysis and Evaluation of Various Aspects of Solar Radiation in the Palestinian Territories. Energy Convers. Manag. 2013, 73, 57–68. [Google Scholar] [CrossRef]
  38. Tiwari, G.N.; Ahmad, M.J. Optimization of Tilt Angle for Solar Collector to Receive Maximum Radiation. Open Renew. Energy J. 2009, 2, 19–24. [Google Scholar] [CrossRef]
  39. Sudhakar, K.; Srivastava, T.; Satpathy, G.; Premalatha, M. Modelling and Estimation of Photosynthetically Active Incident Radiation Based on Global Irradiance in Indian Latitudes. Int. J. Energy Environ. Eng. 2013, 4, 21. [Google Scholar] [CrossRef] [Green Version]
  40. Klein, S.A.; Theilacker, J.C. An Algorithm for Calculating Monthly-Average Radiation on Inclined Surfaces. J. Sol. Energy Eng. Trans. ASME 1981, 103, 29–33. [Google Scholar] [CrossRef]
  41. Yadav, A.K.; Chandel, S.S. Tilt Angle Optimization to Maximize Incident Solar Radiation: A Review. Renew. Sustain. Energy Rev. 2013, 23, 503–513. [Google Scholar] [CrossRef]
  42. Noorian, A.M.; Moradi, I.; Kamali, G.A. Evaluation of 12 Models to Estimate Hourly Diffuse Irradiation on Inclined Surfaces. Renew. Energy 2008, 33, 1406–1412. [Google Scholar] [CrossRef]
  43. Hafez, A.Z.; Soliman, A.; El-Metwally, K.A.; Ismail, I.M. Tilt and Azimuth Angles in Solar Energy Applications—A Review. Renew. Sustain. Energy Rev. 2017, 77, 147–168. [Google Scholar] [CrossRef]
  44. Khatib, T.; Mohamed, A.; Mahmoud, M.; Sopian, K. Optimization of the Tilt Angle of Solar Panels for Malaysia. Energy Sources Part A Recover. Util. Environ. Eff. 2015, 37, 606–613. [Google Scholar] [CrossRef]
  45. Hailu, G.; Fung, A.S. Optimum Tilt Angle and Orientation of Photovoltaic Thermal System for Application in Greater Toronto Area, Canada. Sustainability 2019, 11, 6443. [Google Scholar] [CrossRef] [Green Version]
  46. Yadav, P.; Chandel, S.S. Comparative Analysis of Diffused Solar Radiation Models for Optimum Tilt Angle Determination for Indian Locations. Appl. Sol. Energy 2014, 50, 53–59. [Google Scholar] [CrossRef]
  47. Shukla, K.N.; Rangnekar, S.; Sudhakar, K. Comparative Study of Isotropic and Anisotropic Sky Models to Estimate Solar Radiation Incident on Tilted Surface: A Case Study for Bhopal, India. Energy Rep. 2015, 1, 96–103. [Google Scholar] [CrossRef] [Green Version]
  48. Jakhrani, A.Q.; Othman, A.; Rigit, A.R.H.; Samo, S.R.; Ahmed, S. Estimation of Incident Solar Radiation on Tilted Surface by Different Empirical Models. Int. J. Sci. Res. Publ. 2012, 2, 15–20. [Google Scholar]
  49. Bouchekara, H.R.E.H. Electric Charged Particles Optimization and Its Application to the Optimal Design of a Circular Antenna Array; Springer: Dordrecht, The Netherlands, 2021; Volume 54, ISBN 0123456789. [Google Scholar]
  50. Alanezi, M.A.; Bouchekara, H.R.E.H.; Mohammad, S.; Shahriar, Y.A.S.; Javaid, M.S.; Khodja, M. Motion-Encoded Electric Charged Particles Optimization for Moving Target Search Using Unmanned Aerial Vehicles. Sensors 2021, 21, 6568. [Google Scholar] [CrossRef]
  51. Hidayat, T.; Ramli, M.A.M.; Bouchekara, H.R.E.H.; Khalid, J.; Budiman, F.N. Design of 3D Wind Farm Layout Using an Improved Electric Charge Particles Optimization with Hub-Height Variety. IEEE Access 2022, 10, 31385–31396. [Google Scholar] [CrossRef]
  52. Jacobson, M.Z.; Jadhav, V. World Estimates of PV Optimal Tilt Angles and Ratios of Sunlight Incident upon Tilted and Tracked PV Panels Relative to Horizontal Panels. Sol. Energy 2018, 169, 55–66. [Google Scholar] [CrossRef]
  53. Mehleri, E.D.; Zervas, P.L.; Sarimveis, H.; Palyvos, J.A.; Markatos, N.C. Determination of the Optimal Tilt Angle and Orientation for Solar Photovoltaic Arrays. Renew. Energy 2010, 35, 2468–2475. [Google Scholar] [CrossRef]
  54. Deceased, J.A.D.; Beckman, W.A. Solar Engineering of Thermal Processes; John Wiley and Sons Inc.: Hoboken, NJ, USA, 1982; Volume 3, ISBN 9780470873663. [Google Scholar]
  55. Widen, J. Distributed Photovoltaics in the Swedish Energy System Model Development and Simulations. Ph.D. Thesis, Uppsala University, Uppsala, Sweden, 2009. [Google Scholar]
  56. Robinson, D.; Stone, A. Solar Radiation Modelling in the Urban Context. Sol. Energy 2004, 77, 295–309. [Google Scholar] [CrossRef]
  57. Liu, B.Y.H.; Jordan, R.C. The Interrelationship and Characteristic Distribution of Direct, Diffuse and Total Solar Radiation. Sol. Energy 1960, 4, 1–19. [Google Scholar] [CrossRef]
  58. Oladigbolu, J.O.; Ramli, M.A.M.; Al-Turki, Y.A. Feasibility Study and Comparative Analysis of Hybrid Renewable Power System for Off-Grid Rural Electrification in a Typical Remote Village Located in Nigeria. IEEE Access 2020, 8, 171643–171663. [Google Scholar] [CrossRef]
Figure 1. The angle of incidence, zenith angle, tilt angle, and azimuth angle for a tilted surface [54].
Electronics 11 02056 g001
Figure 2. Schematic view of the sky showing the solar radiance distribution component.
Electronics 11 02056 g002
Figure 3. Flowchart of the ECPO algorithm.
Electronics 11 02056 g003
Figure 4. Flowchart of the proposed approach.
Electronics 11 02056 g004
Figure 5. Comparison of optimized tilt angles between different models in Dhahran city during various periods: (a) NP = 365, (b) NP = 12, (c) NP = 4.
Electronics 11 02056 g005
Figure 6. Comparison of the total solar radiation radiated by a horizontal versus a tilted surface for optimized tilt angle adjustment for Dhahran city over different periods: (a) NP = 365, (b) NP = 12, (c) NP = 4.
Electronics 11 02056 g006
Figure 7. PV power output comparison between different models in Dhahran city for different periods: (a) NP = 365; (b) NP = 12; (c) NP = 4.
Electronics 11 02056 g007
Figure 8. Comparison of the optimized tilt angles among different models in Makkah city during various periods: (a) NP = 365, (b) NP = 12, (c) NP = 4.
Electronics 11 02056 g008
Figure 9. Comparison of the total solar radiation radiated by a horizontal versus a tilted surface for optimized tilt angle adjustment for Makkah city over different periods: (a) NP = 365, (b) NP = 12, (c) NP = 4.
Electronics 11 02056 g009
Figure 10. PV power output comparison between different models in Makkah city for different periods: (a) NP = 365; (b) NP = 12; (c) NP = 4.
Electronics 11 02056 g010
Figure 11. Optimum and adjusted tilt angle comparison of solar radiation: (a) Dhahran city, (b) Makkah city.
Electronics 11 02056 g011
Table 1. Optimal tilt angles and solar radiation results for Dhahran city.
Number of Days per PeriodLiu and Jordan (Isotropic Model)Badescu (Isotropic Model)Hay and Davies (Anisotropic Model)HDKR (Anisotropic Model)
β
Tilt Angle (°)
IT Wh/m2/DayIg Wh/m2/Day β
Tilt Angle (°)
IT Wh/m2/DayIg Wh/m2/Day β
Tilt Angle (°)
IT Wh/m2/DayIg Wh/m2/Day β
Tilt Angle (°)
IT Wh/m2/DayIg Wh/m2/Day
3041.895006.384052.9737.084852.664052.9741.895006.384052.9743.775135.264052.97
3034.865502.714779.0729.705372.994779.0734.865502.704779.0737.065625.234779.07
3023.715925.525536.5318.855848.745536.5323.705925.405536.5326.566027.055536.53
3012.145665.675626.478.655642.155626.4712.145665.675626.4716.035728.695626.47
305.707065.866991.534.267059.936991.535.707065.866991.539.217104.456991.53
302.517375.667356.171.877374.457356.172.517375.667356.176.087399.057356.17
304.247213.637204.333.127210.177204.334.247213.637204.337.917246.627204.33
3111.066961.546905.588.586941.136905.5811.066961.546905.5814.197021.956905.58
3121.266876.846576.7417.306810.276576.7421.266876.856576.7423.886975.156576.74
3133.256480.315751.7429.096358.845751.7433.256480.295751.7435.146600.785751.74
3140.484861.544009.6135.824724.524009.6140.484861.534009.6142.334979.204009.61
3144.064702.363729.1939.644551.833729.1944.064702.353729.1945.794826.013729.19
Table 2. Optimal tilt angles and solar radiation results for Dhahran city.
Number of Days per PeriodLiu and Jordan (Isotropic Model)Badescu (Isotropic Model)Hay and Davies (Anisotropic Model)HDKR (Anisotropic Model)
β
Tilt Angle (°)
IT Wh/m2/DayIg Wh/m2/Day β
Tilt Angle (°)
IT Wh/m2/DayIg Wh/m2/Day β
Tilt Angle (°)
IT Wh/m2/DayIg Wh/m2/Day β
Tilt Angle (°)
IT Wh/m2/DayIg Wh/m2/Day
9133.245456.564811.0027.865333.554811.0033.245456.554811.0035.595576.794811.00
917.006707.716674.635.166698.976674.637.006707.716674.6310.646752.156674.63
9112.066970.296875.309.316945.626875.3012.066970.296875.3015.247036.646875.30
9239.665397.414475.2935.265256.534475.2939.665397.404475.2941.455520.534475.29
Table 3. Power output results for Dhahran city for NP = 12.
Number
of Days
per Period = 12
Liu and Jordan
(Isotropic Model)
Badescu
(Isotropic Model)
Hay and Davies
(Anisotropic Model)
HDKR (Anisotropic Model)
Power (W)Power (W)Power (W)Power (W)
30412.20399.54412.19422.80
30450.91440.28450.91460.94
30477.84471.65477.83486.02
30448.82446.96448.82453.81
30548.75548.29548.75551.74
30563.78563.68563.78565.56
30547.64547.37547.64550.14
31532.30530.74532.30536.91
31530.09524.96530.09537.66
31512.28502.68512.28521.79
31391.78380.74391.77401.25
31387.55375.14387.54397.73
Table 4. Power output results for Dhahran city for NP = 4.
Number of Days per Period = 4Liu and Jordan
(Isotropic Model)
Badescu
(Isotropic Model)
Hay and Davies
(Anisotropic Model)
HDKR
(Anisotropic Model)
Power (W)Power (W)Power (W)Power (W)
91445.39435.35445.39455.19
91521.76521.07521.75525.21
91533.26531.37533.26538.33
92435.52424.15435.51445.44
Table 5. PV array parameters.
ParametersValue
Y PV 1 KW
f PV 80%
α P 0.43 % /
T C , STC 25  
G T 1 KW
Table 6. Optimal tilt angles and solar radiation results for Makkah city.
Number of Days per PeriodLiu and Jordan (Isotropic Model)Badescu (Isotropic Model)Hay and Davies (Anisotropic Model)HDKR (Anisotropic Model)
β
Tilt Angle (°)
IT Wh/m2/DayIg Wh/m2/Day β
Tilt Angle (°)
IT Wh/m2/DayIg Wh/m2/Day β
Tilt Angle (°)
IT Wh/m2/DayIg Wh/m2/Day β
Tilt Angle (°)
IT Wh/m2/DayIg Wh/m2/Day
3040.345550.264497.9737.215434.304497.9740.345550.254497.9741.685653.134497.97
3033.166138.955349.8729.886043.685349.8733.166138.945349.8734.706234.675349.87
3022.416719.206367.919.806668.886367.922.406718.906367.924.116789.646367.9
3010.906714.876551.49.256700.716551.410.906714.876551.413.056756.396551.4
302.096954.516888.51.766953.956888.52.096954.516888.54.386966.446888.5
30−1.627141.197171.53−1.367140.857171.53−1.627141.197171.530.687139.417171.53
300.517390.367405.530.437390.327405.530.517390.367405.532.557395.797405.53
317.676725.056828.326.406717.526828.327.676725.056828.3210.036757.726828.32
3118.446621.526335.6815.936583.966335.6818.446621.536335.6820.406685.216335.68
3129.716046.205535.2326.255963.045535.2329.716046.195535.2331.456137.025535.23
3138.575750.534725.5835.375638.104725.5838.575750.524725.5839.965852.744725.58
3142.285228.694138.6139.215110.614138.6142.285228.684138.6143.585331.024138.61
Table 7. Optimal tilt angles and solar radiation results for Makkah city.
Number of Days per PeriodLiu and Jordan (Isotropic Model)Badescu (Isotropic Model)Hay and Davies (Anisotropic Model)HDKR (Anisotropic Model)
β
Tilt Angle (°)
IT Wh/m2/DayIg Wh/m2/Day β
Tilt Angle (°)
IT Wh/m2/DayIg Wh/m2/Day β
Tilt Angle (°)
IT Wh/m2/DayIg Wh/m2/Day β
Tilt Angle (°)
IT Wh/m2/DayIg Wh/m2/Day
9131.996138.215401.2028.806049.915401.2031.996138.205401.2033.536229.415401.20
913.806922.126910.593.206920.306910.593.806922.126910.596.066940.096910.59
919.076872.826821.797.716862.876821.799.076872.826821.7911.216908.376821.79
9236.875659.274785.7733.485552.234785.7736.875659.264785.7738.365759.034785.77
Table 8. Power results for Makkah city for NP = 12.
Number
of Days
per Period = 12
Liu and Jordan
(Isotropic Model)
Badescu
(Isotropic Model)
Hay and Davies
(Anisotropic Model)
HDKR (Anisotropic Model)
Power (W)Power (W)Power (W)Power (W)
30448.92439.55448.92457.23
30493.29485.64493.29500.97
30536.75532.73536.72542.37
30529.36528.25529.36532.63
30537.56537.51537.56538.48
30544.69544.67544.69544.56
30569.70569.70569.70570.12
31515.86515.28515.86518.36
31509.58506.70509.58514.48
31472.46465.97472.46479.55
31460.06451.07460.06468.23
31425.34415.74425.33433.65
Table 9. Power results for Makkah city for NP = 4.
Number of Days per Period = 4Liu and Jordan
(Isotropic Model)
Badescu
(Isotropic Model)
Hay and Davies
(Anisotropic Model)
HDKR
(Anisotropic Model)
Power (W)Power (W)Power (W)Power (W)
91493.31486.22493.31500.64
91536.24536.10536.24537.63
91528.65527.89528.65531.38
92451.81443.27451.81459.77
Table 10. Results comparison for Dhahran city.
NP
Number of Days per Period
Liu and Jordan (Isotropic Model)Badescu (Isotropic Model)Hay and Davies (Anisotropic Model)HDKR (Anisotropic Model)Liu and Jordan (Isotropic Model)Badescu (Isotropic Model)Hay and Davies (Anisotropic Model)HDKR (Anisotropic Model)
IT (Wh/m2/Day)IT (Wh/m2/Day)IT (Wh/m2/Day)IT (Wh/m2/Day)IT (Wh/m2/Year)IT (Wh/m2/Year)IT (Wh/m2/Year)IT (Wh/m2/Year)
3656155.6486088.216155.646235.8132,246,811.522,222,196.652,246,810.062,276,071.74
126136.56062.316136.496222.452,239,822.52,212,743.152,239,818.852,271,194.25
46132.996058.676132.996221.532,238,541.352,211,414.552,238,541.352,270,858.45
Table 11. Results comparison for Makkah city.
NP
Number of Days per Period
Liu and Jordan (Isotropic Model)Badescu (Isotropic model)Hay and Davies (Anisotropic Model)HDKR (Anisotropic Model)Liu and Jordan (Isotropic Model)Badescu (Isotropic Model)Hay and Davies (Anisotropic Model)HDKR (Anisotropic Model)
IT (Wh/m2/Day)IT (Wh/m2/Day)IT
(Wh/m2/Day)
IT
(Wh/m2/Day)
IT (Wh/m2/Year)IT (Wh/m2/Year)IT
(Wh/m2/Year)
IT (Wh/m2/Year)
3656425.036374.56425.036482.3862,345,136.3152,326,692.52,345,137.0452,366,070.89
126415.116362.166415.086474.932,341,515.152,322,188.42,341,504.22,363,349.45
46398.116346.326398.106459.222,335,310.152,316,406.82,335,306.52,357,615.3
Table 12. Total radiation on a tilted surface for various yearly tilt angle modifications vs. the optimum tilt angle.
DHAHRAN
NPLiu and Jordan ModelBadescu ModelHay and Davies ModelHDKR Model
86.7740.77Optimum86.7740.77Optimum86.7740.77Optimum85.7740.77Optimum
3653579.7785773.6956155.6483513.795545.6096088.213579.7555773.6916155.6443697.45916.1316235.813
123571.5965763.4316136.53505.5815535.2516062.313571.5915763.4166136.493694.4125911.1876222.45
43606.9955789.0146132.993541.0795561.186058.673606.9915789.0096132.993733.4025937.6296221.53
MAKKAH
NPLiu and Jordan ModelBadescu ModelHay and Davies ModelHDKR Model
9045.62Optimum9045.62Optimum9045.62Optimum9045.62Optimum
3653043.5865732.0796425.0313043.5865553.5846374.53043.5835732.086425.0333117.3565847.4096482.386
123044.0185733.3856415.113044.0185554.6816362.163044.0215733.3536415.0823119.5755851.8516474.95
43052.5345759.1676398.1053052.5345580.6536346.323052.5315759.1626398.13130.7195877.9226459.225
Publisher’s Note: MDPI stays neutral with regard to jurisdictional claims in published maps and institutional affiliations.

