1. Introduction
The ability of texture discrimination is an essential feature of artificial tactile sensing for robotic applications in minimally invasive surgery, skin prosthetics, the manufacturing industry, and wearable devices. Several technologies were investigated for developing artificial tactile sensors, based on piezoresistive [
1,
2], capacitive [
3,
4], and piezoelectric [
5,
6] effects. Even if each of the sensing methodologies presents advantages and disadvantages in tactile sensing [
7,
8], piezoelectric-based tactile sensors provide the highest sensitivity, widest dynamic range, and a high-frequency response [
9,
10]. However, this type of sensor is not able to detect static stimuli due to the fast decay of a generated charge under a constant external force.
Ferroelectrets are voided dielectrics that present a piezoelectric response due to the interfacial polarization of the internal void surfaces [
11,
12]. The charge polarization takes place when a high electric field exceeding the breakdown voltage of the air contained in the voids is applied, leading to ionization and orientation of the generated charges on the internal surfaces of the voids. Recently, our group has reported electret and ferroelectret concepts for application in force sensing, invisible digital coding, and energy harvesting [
13,
14,
15,
16].
The study of the human sense of touch has always attracted the interest of the researchers involved in the field of haptic devices and tactile sensors [
17] for robotic applications. Human skin, particularly the fingertips, is provided with a complex combination of different types of mechanoreceptors, which are sensitive to static pressure and time-varying stimuli, such as the vibration occurring at the fingertips when stroking a surface texture [
18].
In this paper, we demonstrate the ability of ferroelectret-based tactile sensors in differentiating surface texture profiles.
Section 2 reports the tactile sensing model. In the same section, we describe the fabrication process for a ferroelectret-based tactile sensor with FEP and poly(dimethylsiloxane) (PDMS) bump structures, the method for the sensor characterization, and the experimental setup for the tactile ability characterization. Then, the experimental results and their discussion are presented in
Section 3, followed by conclusions in
Section 4.
2. Materials and Methods
2.1. Tactile Sensing
An established finding in the literature on the neural mechanisms underlying texture perception is the enhanced discrimination sensitivity obtained when a finger explores a surface. The light interaction (contact force in the range of 0.5 to 2 N) between the skin and the surface roughness elicits vibratory mechanical waveforms which propagate into the finger skin and induce the response of the mechanoreceptors. Among the different types of mechanoreceptors, the fast-adapting (FA) mechanoreceptors (Pacinian corpuscles) work as a high-pass filter for vibrational stimuli in a range of 40–500 Hz, with the highest sensitivity around 250 Hz [
18,
19].
Indeed, the vibration induced by the fingerprint scanning of a largely spaced texture has been proved to correlate with the periodicity of the surface sample [
20]. In agreement with those studies, the fundamental frequency is correlated with the spatial frequency of the gratings,
which is determined by the scanning speed (
v) and grating spatial wavelength (
λ) [
20,
21].
Imitating the FA mechanoreceptors, the concept is to take advantage of the rapidly adaptive response of a charged FEP ferroelectret sensor to enable the temporal encoding of mechanical vibration cues elicited from the dynamic contact, which facilitates the perception of surface textures. In this preliminary study, the mimicking of patterns on human fingerprints was performed using an array of hemispherical bumps to amplify the texture-induced vibrations [
22].
2.2. Sensor Fabrication
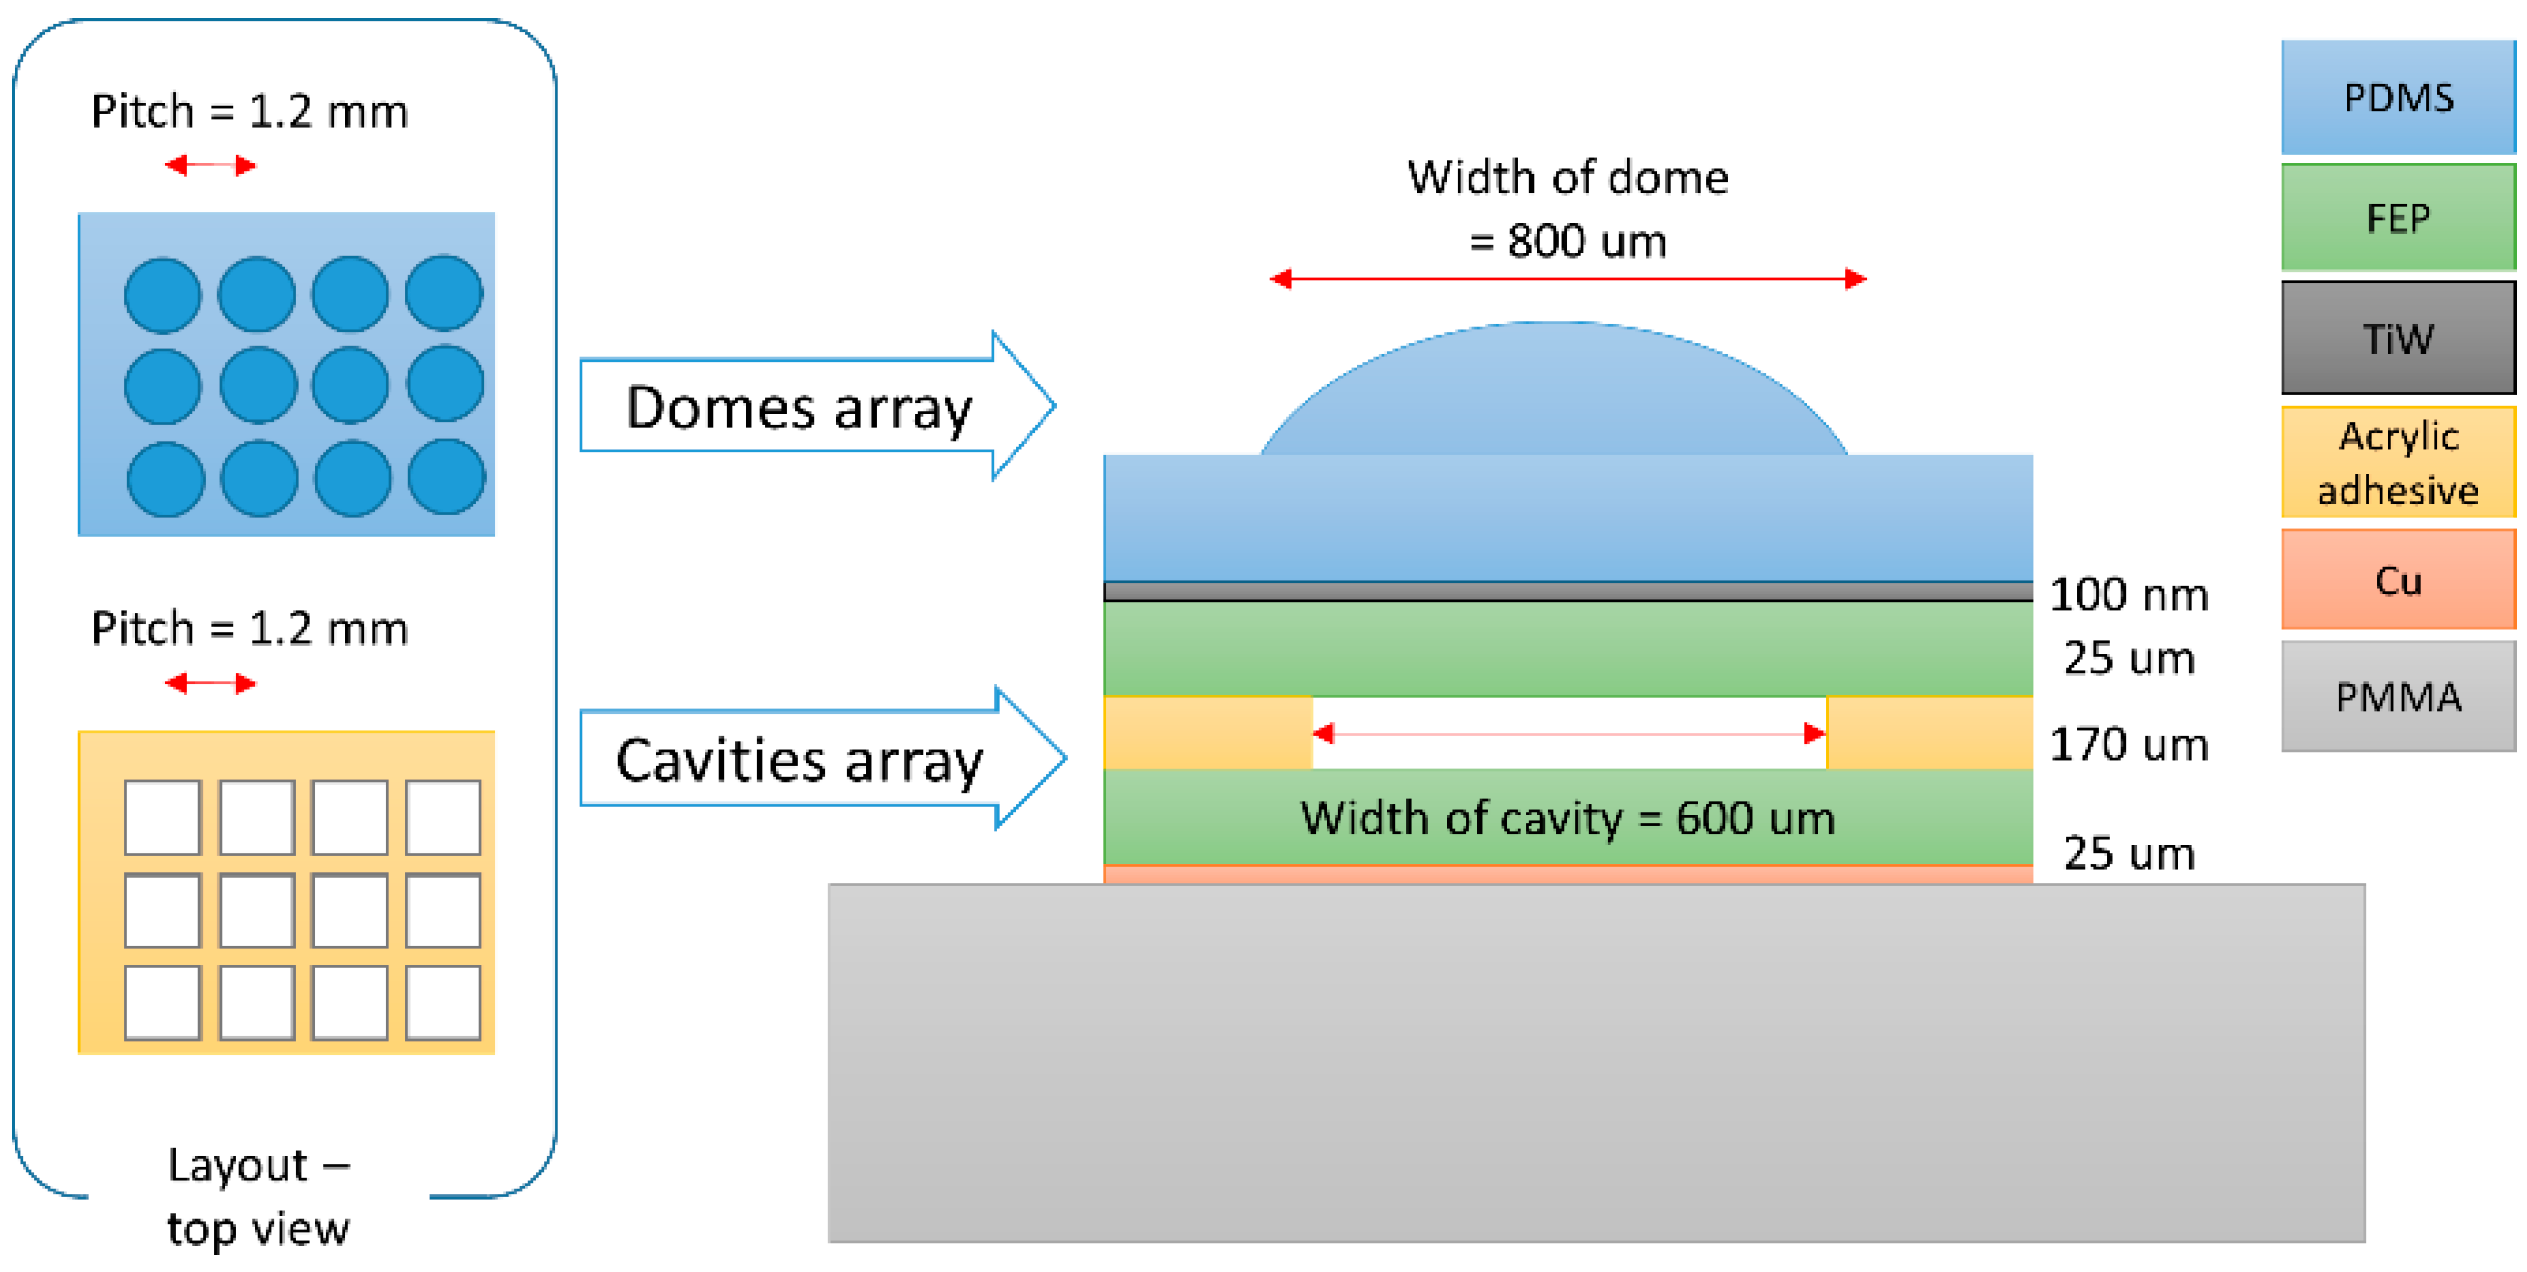
The preparation of the sensor, as schematically depicted in
Figure 1, divided in two parts: (1) preparation of the ferroelectret sensor and (2) preparation of the PDMS bump structure. At the end of the process, both structures were bonded, and the sensor was charged and characterized.
The ferroelectret sensor was prepared following the protocol previously used in our laboratory [
23]. A 25-μm-thick fluorinated ethylene propylene (FEP) sheet was coated with TiW (100 nm) and bonded with another 25-μm-thick FEP sheet using a laser-patterned PVC-film backing double-sided adhesive (170 μm thick) The patterns created on the double-sided acrylic film consisted of 600 μm by 600 μm squares arranged in an array (15 × 17) with a pitch of 1.2 mm, thus creating the cavities between the two FEP layers. The total thickness of the sensor was 220 μm.
The PDMS film, with a 5:1 weight ratio, was fabricated by the micro-molding of an aluminum alloy substrate with micro-dome patterns (350 μm in diameter, 1200 μm in pitch, and 200 μm in height). The PDMS pre-polymer was then spin-coated onto the mold at 400 rpm to reach a thickness of 120 μm, after which it was fully cured at 75 °C for 5 h. Finally, the PDMS replica was carefully peeled off from the mold.
After preparing the FEP ferroelectret, the PDMS pattern was bonded on top of the sensor (
Figure 1). For this, as reported in [
24], a treatment with an aqueous solution of (3-Aminopropyl) triethoxysilane (3-APTES) (5%
v/
v) and plasma oxygen surface treatment were used to improve the adhesion between the metal electrode and the top PDMS layer.
2.3. Charging and Characterization of the Ferroelectret Sensor
After bonding the FEP ferroelectret and the PDMS film, the sample was charged using a pyroelectric method described in previous publications [
23]. The charging process takes advantage of the pyroelectric properties of lithium niobate (LiNbO
3) to generate high voltage when subjected to a temperature gradient [
25,
26]. Thus, a custom-made charging setup, consisting of a thermoelectric cooler and a temperature controller, cycles the temperature of a LiNbO
3 crystal (25 mm diameter, 5 mm thickness) from 10 °C to 80 °C. The ferroelectret sensor, placed on top of the crystal, is subjected to the high electric field that breaks down the air molecules contained in the polymer voids and polarizes the internal surfaces.
The characterization was performed using the direct piezoelectric effect and a custom-made setup. For this, an out-of-plane sinusoidal excitation force (
F) was applied to the sample under test. In order to characterize the sample over a wide range of frequencies (from 0.5 Hz to 1 kHz) two different types of sensors were employed. For low frequencies (<100 Hz), a load cell (FSAGPNXX010WC2C3, Honeywell, Fort Mill, SC, USA) with a force range of 10 N and a response time of 0.4 ms was used to measure the applied force. At higher frequencies (>100 Hz), a PVDF commercial sensor (Model DT1-052K, TE Connectivity, USA) was employed. Further details about this system can be found in [
15]. Using this system, the response of the sensor to different forces and different frequencies was characterized.
As shown in
Figure 2, the output voltage of the sensor (
VDUT) is linear (over the range of frequencies of interest (10 Hz to 80 Hz)) with the force in the range between 0.5 N and 2 N. The sensor was characterized in this narrow range of force to imitate how human touch works. Taking this curve into consideration, and knowing that the total capacitance of the measurement setup (
C) is 10.5 nF, the piezoelectric coefficient
d33 can be extracted using the following equation:
Thus, the average value of the d33 over the aforementioned range of forces is 150.1 ± 3.2 pC/N in the range of 10 to 80 Hz.
The frequency response of the sensor (in
Figure 3) shows a flat region from 10 up to 1000 Hz, which allows it to cover the typical spectrum of tactile cues.
2.4. Experimental Setup for Tactile Sensing Characterization
To test the ability of the sensor in detecting texture spatial wavelength, several gratings varying in spatial periodicity were fabricated using a rapid prototyping SLA printer (FORM2 from Formlabs, Somerville, MA, USA). The height and width of the ridges were kept constant at 200 μm and 400 μm, respectively, while the width of grooves was varied from 400 to 800 μm.
The signals from the sensor were pre-amplified/buffered (1×) and filtered (SR560 from Stanford Research Systems, Sunnyvale, CA, USA) through a first-order band-pass filter with the lower and higher cut-off frequencies at 3 Hz and 1 kHz, respectively, and then acquired through a data acquisition board (T7 pro from Labjack, Lakewood, CO, USA) at 5 kHz. In order to receive feedback about the level of the contact force when the grating touched the sensor, the tactile sensor was attached to a 3-axis load cell (LAN X1 20N from LCT, Xiamen China), while the surface textures with different gratings were fixed to a 3-axis CNC (S-400T from CNC-Step, Geldern, Germany) and scanned at different speeds in the direction perpendicular to the ridges (
Figure 4a). Each axis of the load cell was connected to its dedicated 24-bit ADC (HX-711 from Sparkfun, Niwot, CO, USA) through a shielded cable and sampled at 80 Hz. A microcontroller (Teensy v.3.5 from Sparkfun, Niwot, CO, USA) received the data from the three ADC and forwarded them to a PC via USB (
Figure 4b).
The signals of the tactile sensor underwent filtering (band pass filter with low and high cut-off frequencies of 8 and 100 Hz) and Fast Fourier Transform (FFT) spectral analysis in Matlab® 2021b.
The test was performed by tangentially displacing the gratings over the sensor at velocities ranging from 10 mm/s to 30 mm/s over a length of 30 mm and an average normal force of 1 N. For the spectral analysis, only the signals acquired during a constant velocity phase of the stroke were considered. The acceleration and deceleration phases were excluded. Initial manual control of the applied force was performed at the beginning of each grating. Each sample underwent 6 repetitions at the same speed.
3. Results and Discussions
In this experiment, we validated the ability of the tactile sensor to measure the vibration frequency as it increased with the periodicity of each grating and the scanning speed. We assessed the temporal and spectral domains of the sensor signal in response to the different gratings’ periodicity scanned at the same speed (
Figure 5), and to the same grating at different scanning speeds (
Figure 6).
According to the spectral range calculated for each segment, the first harmonic appears to be inversely proportional to the periodicity and directly proportional to the velocity, as shown in
Figure 5 and
Figure 6, respectively.
For each grating, linear regression was used to predict the wave number (inverse of the periodicity) in relation to the fundamental frequency, fI. A significant regression equation was found (p < 0.05, R2 = 0.99 for the three gratings). The estimated slope of each curve was 2.5586, 1.7159, and 1.2263 mm−1, corresponding to the spatial wavelengths of 0.3908, 0.5828, and 0.8154 mm, respectively, which confirmed how the fittings of the experimental data are in agreement with the model defined in Equation (1).
Based on what is reported in the literature [
19,
20,
21,
22] and according to the model, the results (
Figure 7) showed that the sensor was able to distinguish between all the gratings, and a good correlation was found between the expected and measured frequencies.
As mentioned in the introduction, many tactile sensors based on piezoelectric or triboelectric sensing mechanisms have been developed, as in [
5,
6,
27,
28,
29,
30]. Several studies ([
5,
28]) showed the ability to detect time-varying contact stress in the range of low frequencies, up to 30 Hz. In [
29], a bandwidth of 10–140 Hz was reported, where only a qualitative tactile ability of texture discrimination was mentioned. The capacity of a tactile sensor to detect vibrating pressure up to 330 Hz was reported in [
30]. In our work, the wide bandwidth of the sensor (10–1000 Hz) serves to potentially identify a broad spectrum of spatial wavelength components in surface textures.
Despite the tactile sensor’s demonstrated capacity to identify periodic gratings, this study has certain limitations. First, there was a lack of testing for various contact force levels, including an extensive test on various materials and textures (either regular or random). Additionally, the sensor’s long-term stability and robustness have not been thoroughly verified yet. The sensor’s inherent filtering of spectral components below 10 Hz is another issue, which inhibits the detection of slowly changing touch events. Additionally, more research is needed to validate this strategy utilizing other PDMS pattern geometries and develop a better method for aligning and bonding the PDMS layer to the metal electrode.
4. Conclusions
This work introduced the fabrication and characterization of a pyroelectrically charged ferroelectret-type sensor for surface texture detection. The preparation of the sensor including the ferroelectret structure as well as the PDMS textured surface was presented. The sensor was then charged and characterized, showing a linear response to the applied force in the range of 0.5 to 2 N, and a d33 of 150.1 ± 3.2 pC/N in the range of 10 to 80 Hz. Moreover, the dynamic response of the sensor was constant in the range of 10–1000 Hz.
The reported study showed promising results on the ferroelectret-based sensor’s ability to discriminate tactile features. Moreover, a wider range of textures and materials will be tested. Additionally, the effect of the applied normal force on the piezoelectric coefficient will be evaluated.
Despite their inability to detect static stimuli, ferroelectrets demonstrate a high potential to be exploited for tactile sensing in many applications, including autonomous robots, minimally invasive surgery, and wearable devices for rehabilitation, thanks to their low-cost fabrication, self-powering ability, and mechanical flexibility.
Author Contributions
Conceptualization, E.S., P.G.-L. and K.B.V.; methodology, E.S., P.G.-L., R.M.R.P. and K.B.V.; software, E.S., P.G.-L. and M.F.; validation, E.S., P.G.-L. and H.Y.; formal analysis, E.S. and K.B.V.; investigation, E.S. and P.G.-L.; data curation, E.S. and P.G.-L.; writing—original draft preparation, E.S. and P.G.-L.; writing—review and editing, all authors; supervision, K.B.V.; project administration, K.B.V.; funding acquisition, K.B.V. All authors have read and agreed to the published version of the manuscript.
Funding
This research received no external funding.
Institutional Review Board Statement
Not applicable.
Informed Consent Statement
Not applicable.
Data Availability Statement
Not applicable.
Acknowledgments
We would like to acknowledge the invaluable administrative support of Elisabete P. Fernandes.
Conflicts of Interest
The authors declare no conflict of interest.
References
- Stassi, S.; Cauda, V.; Canavese, G.; Pirri, C.F. Flexible tactile sensing based on piezoresistive composites: A review. Sensors 2014, 14, 5296–5332. [Google Scholar] [CrossRef] [Green Version]
- Thanh-Vinh, N.; Binh-Khiem, N.; Takahashi, H.; Matsumoto, K.; Shimoyama, I. High-sensitivity triaxial tactile sensor with elastic microstructures pressing on piezoresistive cantilevers. Sens. Actuators A Phys. 2014, 215, 167–175. [Google Scholar] [CrossRef]
- Chun, S.; Hong, A.; Choi, Y.; Ha, C.; Park, W. A tactile sensor using a conductive graphene-sponge composite. Nanoscale 2016, 8, 9185–9192. [Google Scholar] [CrossRef]
- Sotgiu, E.; Aguiam, D.E.; Calaza, C.; Rodrigues, J.; Fernandes, J.; Pires, B.; Moreira, E.E.; Alves, F.; Fonseca, H.; Dias, R.; et al. Surface Texture Detection with a New Sub-mm Resolution Flexible Tactile Capacitive Sensor Array for Multimodal Artificial Finger. J. Microelectromechanical Syst. 2020, 29, 629–636. [Google Scholar] [CrossRef]
- Park, J.; Kim, M.; Lee, Y.; Lee, H.S.; Ko, H. Nanomaterials: Fingertip skin-inspired microstructured ferroelectric skins discriminate static/dynamic pressure and temperature stimuli. Sci. Adv. 2015, 1, e1500661. [Google Scholar] [CrossRef] [Green Version]
- He, H.; Fu, Y.; Zang, W.; Wang, Q.; Xing, L.; Zhang, Y.; Xue, X. A flexible self-powered T-ZnO/PVDF/fabric electronic-skin with multi-functions of tactile-perception, atmosphere-detection and self-clean. Nano Energy 2017, 31, 37–48. [Google Scholar] [CrossRef]
- Sun, X.; Liu, T.; Zhou, J.; Yao, L.; Liang, S.; Zhao, M.; Liu, C.; Xue, N. Recent Applications of Different Microstructure Designs in High Performance Tactile Sensors: A Review. IEEE Sens. J. 2021, 21, 10291–10303. [Google Scholar] [CrossRef]
- Peng, Y.; Yang, N.; Xu, Q.; Dai, Y.; Wang, Z. Recent Advances in Flexible Tactile Sensors for Intelligent Systems. Sensors 2021, 21, 5392. [Google Scholar] [CrossRef]
- Jiang, Y.; Ma, Z.; Cao, B.; Gong, L.; Feng, L.; Zhang, D. Development of a Tactile and Slip Sensor with a Biomimetic Structure-enhanced Sensing Mechanism. J. Bionic Eng. 2019, 16, 47–55. [Google Scholar] [CrossRef]
- Yeo, H.G.; Jung, J.; Sim, M.; Jang, J.E.; Choi, H. Integrated Piezoelectric AlN Thin Film with SU-8/PDMS Supporting Layer for Flexible Sensor Array. Sensors 2020, 20, 315. [Google Scholar] [CrossRef] [Green Version]
- Lindner, M.; Hoislbauer, H.; Schwödiauer, R.; Bauer-Gogonea, S.; Bauer, S. Charged cellular polymers with “ferroelectretic” behavior. IEEE Trans. Dielectr. Electr. Insul. 2004, 11, 255–263. [Google Scholar] [CrossRef]
- Wegener, M.; Bauer, S. Microstorms in Cellular Polymers: A Route to Soft Piezoelectric Transducer Materials with Engineered Macroscopic Dipoles. ChemPhysChem 2005, 6, 1014–1025. [Google Scholar] [CrossRef] [PubMed]
- Gonzalez-Losada, P.; Martins, M.; Vinayakumar, K.B. Pyroelectrically Generated High Voltage to Digitally Code Invisible Electrostatic Information on Flexible Polymer for Application in Security and Anti-Counterfeit. In Proceedings of the 2022 IEEE 35th International Conference on Micro Electro Mechanical Systems Conference (MEMS), Tokyo, Japan, 9–13 January 2022; IEEE Computer Society: Los Alamitos, CA, USA, 2022; pp. 473–476. [Google Scholar]
- Gonzalez-Losada, P.; Alves, F.; Martins, M.; Mundy, S.; Dias, R.; Vinayakumar, K.B. Pyroelectrically Rechargeable Electret for Continuous Vibration Energy Harvester. In Proceedings of the 2021 21st International Conference on Solid-State Sensors, Actuators and Microsystems (Transducers), Orlando, FL, USA, 20–24 June 2021; pp. 928–931. [Google Scholar] [CrossRef]
- Pinto, R.; Gonzalez-Losada, P.; Faraji, M.; Vinayakumar, K.B. Pyroelectrically-Charged Flexible Piezoelectret Sensors: Route Towards Sustainable Functional Electronics. In Proceedings of the 2022 IEEE 35th International Conference on Micro Electro Mechanical Systems Conference (MEMS), Tokyo, Japan, 9–13 January 2022; IEEE Computer Society: Los Alamitos, CA, USA, 2022; pp. 547–550. [Google Scholar]
- Gonzalez-Losada, P.; Pinto, R.M.R.; Faraji, M.; Vinayakumar, K.B. Pyroelectrically-Charged Piezoelectrets for Force Sensing. IEEE Trans. Dielectr. Electr. Insul. 2022, 29, 845–852. [Google Scholar] [CrossRef]
- Nguyen, T.D.; Lee, J.S. Recent Development of Flexible Tactile Sensors and Their Applications. Sensors 2021, 22, 50. [Google Scholar] [CrossRef] [PubMed]
- Bolanowski, S.J.; Gescheider, G.A.; Verrillo, R.T.; Checkosky, C.M. Four channels mediate the mechanical aspects of touch. J. Acoust. Soc. Am. 1988, 84, 1680–1694. [Google Scholar] [CrossRef]
- Bensmaia, S.J.; Hollins, M. The vibrations of texture. Somatosens. Mot. Res. 2003, 20, 33–43. [Google Scholar] [CrossRef]
- Fagiani, R.; Barbieri, M. A contact mechanics interpretation of the duplex theory of tactile texture perception. Tribol. Int. 2016, 101, 49–58. [Google Scholar] [CrossRef]
- Wandersman, E.; Candelier, R.; Debrégeas, G.; Prevost, A. Texture-induced modulations of friction force: The fingerprint effect. Phys. Rev. Lett. 2011, 107, 164301. [Google Scholar] [CrossRef] [Green Version]
- Prevost, A.; Scheibert, J.; Debrégeas, G. Effect of fingerprints orientation on skin vibrations during tactile exploration of textured surfaces. Commun. Integr. Biol. 2009, 2, 422–424. [Google Scholar] [CrossRef]
- Gonzalez-Losada, P.; Yang, H.; Pinto, R.M.R.; Faraji, M.; Dias, R.; Vinayakumar, K. Flexible ferroelectret for zero power wearable application. In Proceedings of the 2022 IEEE International Conference on Flexible and Printable Sensors and Systems (FLEPS), Vienna, Austria, 10–13 July 2022; pp. 1–4. [Google Scholar] [CrossRef]
- Sunkara, V.; Park, D.K.; Cho, Y.K. Versatile method for bonding hard and soft materials. RSC Adv. 2012, 2, 9066–9070. [Google Scholar] [CrossRef]
- Vinayakumar, K.B.; Gund, V.; Lambert, N.; Lodha, S.; Lal, A. Enhanced lithium niobate pyroelectric ionizer for chip-scale ion mobility-based gas sensing. In Proceedings of the IEEE Sensors, Orlando, FL, USA, 30 October–3 November 2016. [Google Scholar] [CrossRef]
- Ni, D.; Vinayakumar, K.B.; Pinrod, V.; Lal, A. Multi Kilovolt Lithium Niobate Pyroelectric Cantilever Switched Power Supply. In Proceedings of the IEEE 32nd International Conference on Micro Electro Mechanical Systems (MEMS) Seoul, Korea, 27–31 January 2019; pp. 970–973. [Google Scholar] [CrossRef]
- Zhu, G.; Yang, W.Q.; Zhang, T.; Jing, Q.; Chen, J.; Zhou, Y.S.; Bai, P.; Wang, Z.L. Self-powered, ultrasensitive, flexible tactile sensors based on contact electrification. Nano Lett. 2014, 14, 3208–3213. [Google Scholar] [CrossRef]
- Shin, Y.E.; Park, Y.J.; Ghosh, S.K.; Lee, Y.; Park, J.; Ko, H. Ultrasensitive Multimodal Tactile Sensors with Skin-Inspired Microstructures through Localized Ferroelectric Polarization. Adv. Sci. 2022, 9, 2105423. [Google Scholar] [CrossRef] [PubMed]
- Chun, K.-Y.; Jun Son, Y.; Jeon, E.-S.; Lee, S.; Han, C.-S.; Chun, K.; Son, Y.J.; Jeon, E.; Lee, S.; Han, C. A Self-Powered Sensor Mimicking Slow- and Fast-Adapting Cutaneous Mechanoreceptors. Adv. Mater. 2018, 30, 1706299. [Google Scholar] [CrossRef] [PubMed]
- Chun, S.; Son, W.; Kim, H.; Lim, S.K.; Pang, C.; Choi, C. Self-Powered Pressure- and Vibration-Sensitive Tactile Sensors for Learning Technique-Based Neural Finger Skin. Nano Lett. 2019, 19, 3305–3312. [Google Scholar] [CrossRef] [PubMed]
| Publisher’s Note: MDPI stays neutral with regard to jurisdictional claims in published maps and institutional affiliations. |
© 2022 by the authors. Licensee MDPI, Basel, Switzerland. This article is an open access article distributed under the terms and conditions of the Creative Commons Attribution (CC BY) license (https://creativecommons.org/licenses/by/4.0/).


 ,
, 

