Abstract
In facial aesthetics, soft tissue landmark recognition and linear and angular measurement play a critical role in treatment planning. Visual identification and judgment by hand are time-consuming and prone to errors. As a result, user-friendly software solutions are required to assist healthcare practitioners in improving treatment planning. Our first goal in this paper is to create a computational tool that may be used to identify and save critical landmarks from patient X-ray pictures. The second goal is to create automated software that can assess the soft tissue facial profiles of patients in both linear and angular directions using the landmarks that have been identified. To boost the contrast, we employ gamma correction and a client-server web-based model to display the input images. Furthermore, we use the client-side to record landmarks in pictures and save the annotated landmarks to the database. The linear and angular measurements from the recorded landmarks are then calculated computationally and displayed to the user. Annotation and validation of 13 soft tissue landmarks were completed. The results reveal that our software accurately locates landmarks with a maximum deviation of 1.5 mm to 5 mm for the majority of landmarks. Furthermore, the linear and angular measurement variances across users are not large, indicating that the procedure is reliable.
1. Introduction
A pleasant-looking facial aesthetic is one of the purposes of healthcare treatment. Nowadays, many young males and females are looking for orthognathic surgery for a better and more attractive appearance in society. Therefore, it is necessary to study the facial skeleton and corresponding soft tissue. Bones and teeth are examples of hard tissue. Ligaments, tendons, and muscles are examples of soft tissue that connects and supports the body’s surrounding structures and organs [1]. For successful orthognathic surgery, hard and soft tissue facial profile analysis should be included [2,3,4]. The hard tissue analysis for orthognathic surgery has been discussed by Burstone et al. [5] and the soft tissue analysis by Legan and Burstone [4]. However, several researchers found that the soft tissue (covering the teeth and face) can behave differently from patient to patient because of the thickness.
Structure inconsistencies have historically been considered the main treatment restrictions by orthodontists. In actuality, the therapeutic modifiability is more closely related to the soft tissues. As a result, the crucial step in orthodontic decision-making is the study of soft tissue. The extent to which the orthodontist can change the size of dental arches and the positioning of the mandible is determined by these soft tissues. Therefore, the cephalometric analysis of the soft tissue should be taken into account in a successful surgical treatment plan [6,7]. Furthermore, it is necessary to find the standard soft tissue profile analysis based on age, sex, ethnic group, etc. [8,9,10,11]. Similarly, Sahar [11] reported that an increasing number of Saudis are looking for orthognathic surgery. Therefore, this study should be carried out to find its own characteristics for Saudi Arabia.
There are two ways to analyze the soft tissue profile. The first way is by hand without any computer-aided solution; a transparent acetate sheet is superimposed above the printed X-ray image and then manually calculates the linear distances and angles. The second way is the computer-aided solution. There are many tools available which are used for research and teaching, but may cost a lot of money. Besides, the tool may not be customizable to suit the local community’s needs. Nevertheless, most of the research regarding soft tissue profile analysis did not consider X-ray images, which are inevitable for the Saudi population since only X-ray images are acceptable in all Saudi hospitals, clinics, dental colleges, etc. Therefore, it is really necessary and of utmost importance to consider an inexpensive approach for the accurate investigation of the soft tissue profile analysis from the X-ray images.
Furthermore, other approaches are not created to study the linear and angular measurements automatically and need some type of manual intervention to obtain an accurate result. The novelty of our approach is that we implemented this process automatically without any type of manual intervention from the user, i.e., after successful annotations, the user can obtain the linear and angular measurements automatically.
The contribution of our study is:
- The creation of a computational tool for identifying and saving important soft tissue landmarks in X-ray images;
- The creation of a computational tool to automatically calculate linear and angular measurement of the patients’ soft tissue facial profiles using the above identified landmarks.
We performed experiments with 14 male and 14 female subjects’ X-ray images. We preprocess the images to improve the contrast by applying the gamma correction. After that, we annotated all these images by four examiners. As a result, we have a total of 112 annotated X-ray images. In the end, we calculated the variations among all annotators and found the variations are negligible, and hence, our approach is reliable. Nevertheless, we also calculated the linear and angular measurements and calculated the variations. We found that the variation is very small and our results are reliable.
An image must be in grayscale X-ray images with a minimum size of 1024 × 1024 to be included in the annotations. Since X-ray images are the main type of images for clinical practices in Saudi Arabia, we chose these types of images, and the mentioned size is the minimum best size for good X-ray images. In addition, the input images must include the areas of the forehead, nasal, labial, and chin. The reason is that these areas contain all our soft tissue landmarks. Furthermore, the intensity of the edge line, which contains such landmarks, and the background of the image should be distinguishable for the success of the detection of the landmarks. If these conditions are not met for any image sample, then it will not be processed further.
The rest of the paper is organized as follows. In Section 2, we consider the previous studies related to our paper. In Section 3, we explain the preprocessing steps before proceeding with our approach. Section 4 contains the detailed methods of the software architecture as well as methods related to the capturing of the annotations and measurements. Section 5 contains the results of the computer experiments and a discussion of the findings. At the end, Section 6 contains short conclusions and future work.
2. Previous Studies
A number of studies [2,12,13,14,15,16,17,18,19,20] have been carried out on the different aspects of soft tissue profile analysis. Some research focuses on linear measurement of the soft tissue profile [2] and some other research focuses on angular measurement [4,21]. The aim of this section is to review only the important and relevant studies related to the present research of soft tissue profile analysis.
One of the initial significant research attempts on the linear measurement of the soft tissue profile analysis was conducted by Paulo et al. [2], who considered 15 landmark points from the four major regions (facial, labial, chin, and nasal) and then calculated linear measurements based on the vertical, horizontal, and Canut’s lines. Unfortunately, the work is based only on the photographic records (no X-ray images) and it is only for the European white population. They also did a similar analysis for angular measurement [21]. Sahar et al. [11,16] and Nasser [18] focus on the soft tissue profile analysis for the Saudi population in the Riyadh region. Their solution uses a market tool that is very expensive to buy and does not have the flexibility for custom usages. They did not consider major landmarks as in [2] and did not consider all the linear and angular measurements under consideration. Nevertheless, they did not consider any preprocessing steps such as gamma correction to improve the contrast and visibility of the X-ray images.
Furthermore, other researchers consider this problem based on the population of different regions in the world, e.g., Alcaledi et al. [19] consider the Japanese population, Hamdan et al. [20] consider the Jordanian population, Al-Azemi et al. [17] consider the Kuwaiti population, Filipović et al. [15] consider the Serbian population, Celebi et al. [14] consider the Turkish population, Akter et al. [13] consider the Bangladeshi population, Pandian et al. [12] consider the Indian population, etc.
For many years, manual cephalometric tracing was the only method where a transparent acetate sheet was superimposed above the printed X-ray images. The researchers used a pencil to locate the major landmarks and draw the lines and angles for the soft and hard tissue analysis [22].
Ricketts [23] illustrated computerized cephalometric tracing in 1969. After that, many tools are available on the market. Unfortunately, such tools are very expensive and non-customizable for use in the analysis of the cephalometric study. Therefore, it is necessary to look for a solution that will be used for the study of the soft tissue profile analysis, especially for the Saudi population. Another disadvantage of other tools is that they do not automatically provide linear and angular measurements; rather, a ruler must be used to obtain measurements for each subject of study, which is time-consuming and tedious work. In our work, our method automatically calculates the distance once the dental practitioners finalize the landmarks on the X-ray images. Furthermore, we use gamma correction to improve the contrast of the image, which was not performed by other tools.
3. Data Preprocessing
The borders of the soft tissue in the initial X-ray images are not clearly visible due to poor contrast, and hence we need to apply some preprocessing steps, i.e., to use the gamma correction method to sharpen and increase the contrast of the borders of the soft tissue.
According to [24], gamma correction, or gamma, is a nonlinear process which is performed for encoding and decoding luminance values in still images or video systems. In the simplest instances, gamma correction is specified by the power-law expression:
where is a user defined parameter. The user can change the parameters and the brightness of the image will change based on the value of . The output value Y is obtained by raising the non-negative real input value X to the power and multiplying it by the constant a. In the case of , inputs and outputs are usually in the range of 0–1.
In Figure 1, we show a sample X-ray image before and after applying the gamma correction. It is clear that after applying the gamma correction, the soft tissue borders are now visible for further usage. In our tool, we first preprocess all X-ray images using the gamma correction before performing actual annotations.
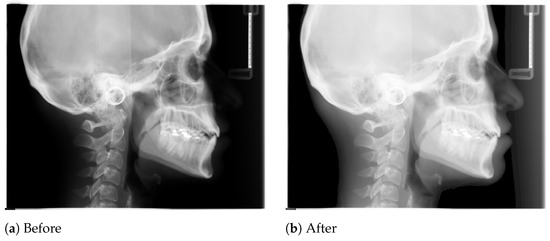
Figure 1.
Effect of gamma correction of a sample X-ray image.
4. Method
The steps to developing the aforementioned tool for dental doctors’ practices will be discussed in this section.
4.1. Architecture
We chose to use the client-server communication model paradigm. The reason behind this is that we have many users or clients (located separately) who will use this tool to annotate images. Such a distributive nature of clients necessitates the use of a client-server communication model rather than working as a single standalone program.
We have shown the client-server architecture in Figure 2. For the client-side, we used JavaScript (jQuery) along with CSS/HTML, and for the server-side, we used PHP (Laravel) with Apache server and MySQL database.
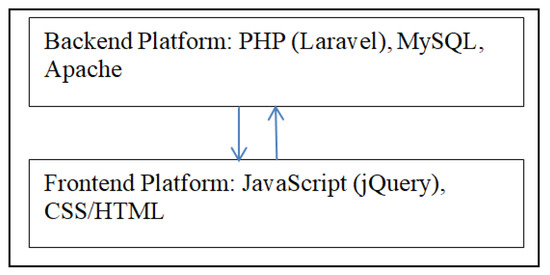
Figure 2.
Software architecture.
The “admin” user controls the main functionality of this tool and can add other users to use this tool for annotations. The tool is divided into three main components. The first component is to add new users who will perform the job of annotation. The second component is to add the landmarks (tags in the tool) dynamically, i.e., we do not fix the number of landmarks; the admin can dynamically add new landmarks under consideration. Right now, the tool is using only thirteen soft tissue landmarks, as shown in Table 1.

Table 1.
The set of soft tissue landmarks.
The third component is to add new images for annotations, edit previously added images, and search for images by keywords, gender, etc. When an expert annotator first logs in then he will see the list of images that he has already uploaded and/or annotated and a button to add new images (see Figure 3).
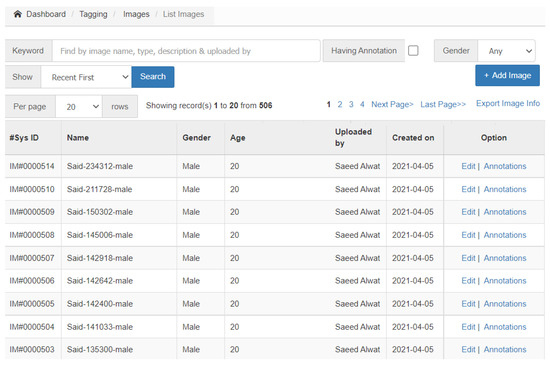
Figure 3.
The first landing page after login to show the list of images.
At this stage, the annotator can add new images by clicking the button “Add Image”. Furthermore, he can edit already added images by clicking the hyperlink “Edit” and can annotate the considered image by clicking on “Annotations”.
4.2. Capturing Annotations
In this study, we use 13 landmarks from the soft tissue area as shown in Table 1.
The user should click “Annotations” to start annotating the above landmarks, or if he has already done so, he can update those annotations easily. For illustration purposes, we show a sample X-ray image with the expert annotations in Figure 4.
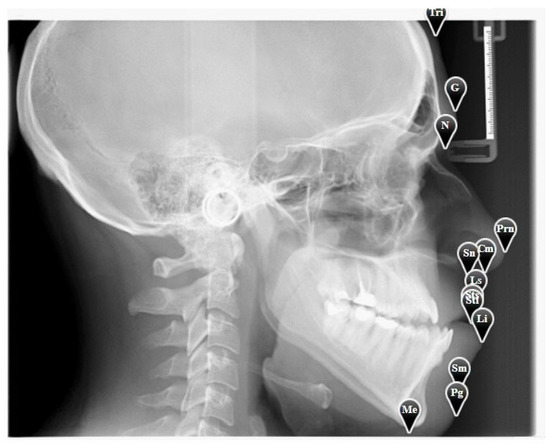
Figure 4.
A sample X-ray image with annotation.
When an expert annotator uses this tool to annotate landmarks, our tool captures those landmark positions (2D coordinates) and stores them in the system. It is possible to zoom the X-ray images for better viewing and locating the position of the landmarks. The tool takes the position based on a percentage matrix, i.e., both x and y-axis are taken as 100% of its actual width and height, respectively. It then uses the captured landmark position to calculate the actual position from the actual width and height of that image. Therefore, the zoom does not affect the landmark’s actual position. In addition, the position is taken with a long decimal fraction, which is up to 30 decimal points, to make the position more accurate.
It is always possible to change the landmarks manually and correct them. The “Edit” button is used for editing any images that have been previously annotated.
4.3. Linear and Angular Measurements
The tool automatically calculates the linear and angular measurements without any intervention from the user. Once the user finishes the annotation, then he needs to simply click the “View Distances” link and it will show both measurements immediately (see Figure 5). In addition, the user can save the measurement in an excel file.
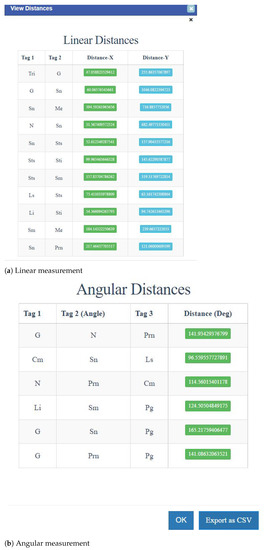
Figure 5.
A sample window of linear and angular measurement.
4.3.1. Linear Measurements
The tool provides the horizontal (x-axis) distance and vertical (y-axis) distances for a fixed pair of landmarks. The horizontal and vertical distance calculations are trivial; that is the normal difference between the values of the corresponding axis. The distance output is given in pixels that can be converted to mm by Equation (4). Nevertheless, we can easily calculate the Euclidean distance (c) from the horizontal and vertical distances by the following formula:
where,
- c = the Euclidean distance
- a = the horizontal distance (Distance-X)
- b = the vertical distance (Distance-Y)
4.3.2. Angular Measurements
The tool provides the angle for a given set of three landmarks in a degree unit. For example, G-N-Prn is a set of three landmarks where the middle landmark, N, is the vertex of the angle, and G-N and N-Prn are the sides of the angle. The angle has been calculated by the following formula:
where,
- b = the distance G-N
- c = the distance N-Prn
5. Results & Discussion
For our experiments, we obtained 28 sample X-ray images (14 male and 14 female) from health centers in Saudi Arabia. Four examiners independently performed the annotation and validation of the concerned soft tissue landmarks. As a result, we have a total of 112 annotated X-ray images.
In the literature, there are many methods for the evaluation of the system for identifying the landmark position for the acceptance of clinical practices. The manual method of human visual judgement is prone to intrajudge and interjudge variations [25]. The second way is the mix of manual and computer systems recognition method that is also susceptible to human error [25]. The third way is to examine if the computer system’s output is within the radius of 2 mm or not [25]. Our method is better where we obtained a radius for some landmarks even smaller than 2 mm.
5.1. Validation of Locating the Landmarks
We calculate the variation of landmarks by the computer system. For each landmark, we find the minimum variation that is the minimum distance between any two identified landmarks. Similarly, we calculate the average and maximum distance between any two landmarks. Note that, for each variation (minimum, average, and maximum), we take the average among the 28 samples and show them as our results. Table 2 displays the pixel and corresponding distance (mm) variation, with the first column displaying the landmark name, the second column displaying the minimum variation, the third column displaying the average variation and the fourth column displaying the maximum variation. We calculate the length in ‘mm’ from the pixel by the following formula (using 300 dpi):
Table 2.
Variation of different landmarks.
We can observe that the minimum variation is below 1 mm and the maximum variation for most landmarks is in the range of mm to 5 mm except for the landmark G and Pg. It is due to the fact that they are the most difficult to identify. Similarly, the average variation for most landmarks is in the range of 1 mm to 2 mm except for the above-mentioned two landmarks. Figure 6 shows the variation in a sample X-ray image, and Figure 7 shows the variation of each landmark in the same X-ray image (red circle shows the variation area).
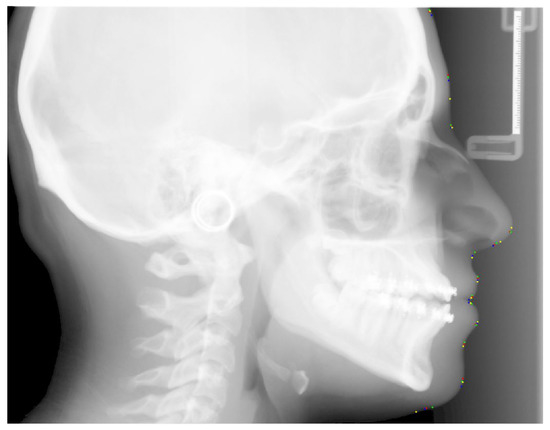
Figure 6.
Graphical representation of variations of one sample image showing all the landmarks.
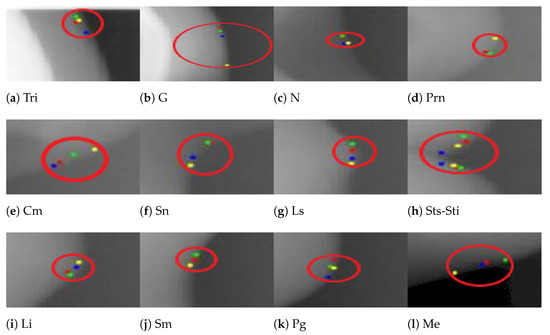
Figure 7.
Graphical representation of variations of each landmark.
5.2. Validation of Linear and Angular Measurements
We show the minimum (the column ’Min’), average (the column ’Avg’), and maximum (the column ’Max’) value of linear measurement (Euclidean distance) in pixel and mm units in Table 3. Nevertheless, we compared statistically using a Student’s paired t-test and we did not find any significant difference in variation, which shows that the results are stable using this tool.
Table 3.
Variation of linear measurement.
Similarly, we show the minimum (the column ’Min’), average (the column ’Avg’), and maximum (the column ’Max’) values of angular measurements (in degree units) in Table 4. Furthermore, we examined statistically using the Student’s paired t-test and found no significant difference, indicating that the results produced by our tool are consistent.
Table 4.
Variation of angular measurement (degree).
5.3. Limitations and Special Cases
Even though this developed tool can detect soft tissue landmarks pretty accurately, it is not free from limitations. The success of landmark detection depends mainly on the quality, size, and resolution of images as well as the intensity of soft tissue edge lines compared to the background.
The most prevalent conditions affecting the facial region are cleft deformities [26] and craniofacial defects [27]. Soft tissue landmarks are difficult to identify in bilateral and unilateral complete cleft lip and palate cases because the alveolus and lip are not fused well. In such cases, a clear image and a zoom-in facility might help. As well, experienced orthodontists can follow an anatomical point of view if they feel difficulties.
6. Conclusions and Future Work
In this paper, we describe our tool to capture the soft tissue landmark positions. This tool is based on the paradigm of the client-server communication model. Any orthodontist can use this tool for his clinical practice, and it can accurately give the landmark positions up to 30 decimal points. It can also extract information on linear and angular measurements for orthodontic treatment, allowing for a more personalized healthcare experience. We conducted experiments on 28 human samples, which resulted in robust and accurate measurement of soft tissue landmarks within a 5 mm radius.
One of the limitations of this study is that this tool only annotates soft tissue landmarks. In the future, hard tissue landmarks will be explored.
In today’s world, the smartphone is the most user-friendly technology available in the healthcare field. As a result, we will strive to integrate the proposed approach onto smartphones in the future, so that physicians may quickly recognize landmarks and complete the cephalometric analysis.
Author Contributions
Conceptualization, M.A., S.E. and M.K.A.; methodology, M.A., S.E. and M.K.A.; software, M.A.; validation, M.A.; formal analysis, M.A., S.E. and M.K.A.; investigation, M.A., S.E. and M.K.A.; resources, M.A., S.E. and M.K.A.; data curation, M.A., S.E. and M.K.A.; writing, M.A., S.E. and M.K.A.; visualization, M.A., S.E. and M.K.A.; supervision, M.A., S.E. and M.K.A.; project administration, M.A.; funding acquisition, M.A. All authors have read and agreed to the published version of the manuscript.
Funding
The authors extend their appreciation to the Deanship of Scientific Research at Jouf University for funding this work through research grant no. (DSR2020-04-2582).
Data Availability Statement
Available upon reasonable request.
Acknowledgments
The authors would like to express their gratitude to all of the volunteers who helped with this study.
Conflicts of Interest
The authors declare no conflict of interest.
References
- Understanding Injuries: Soft Tissue versus Hard Tissue Injuries. Available online: https://www.mgmillerlaw.com/soft-versus-hard-tissue-injuries/ (accessed on 19 March 2022).
- Fernández-Riveiro, P.; Suárez-Quintanilla, D.; Smyth, E.; Suarez-Cunqueiro, M. Linear photogrammetric analysis of the soft tissue facial profile. Am. J. Orthod. Dentofac. Orthop. 2002, 122, 59–66. [Google Scholar] [CrossRef] [PubMed]
- Ricketts, R. Esthetics, environment, and the law of lip relation. Am. J. Orthod. 1968, 54, 272–289. [Google Scholar] [CrossRef]
- Legan, H.; Burstone, C. Soft tissue cephalometric analysis for orthognathic surgery. J. Oral Surg. 1980, 38, 744–751. [Google Scholar] [PubMed]
- Burstone, C.; James, R.; Legan, H.; Murphy, G.; Norton, L. Cephalometrics for orthognathic surgery. J. Oral Surg. 1978, 36, 269–277. [Google Scholar]
- Sarver, D.; Pfoffit, W.; Ackerman, J. Evaluation of facial soft tissues. In Contemporary Treatment of Dentofacial Deformity; Proffit, W.R., White, R.P., Sarver, D.M., Eds.; Mosby: St. Louis, MO, USA, 2003; Volume 283. [Google Scholar]
- Ackerman, J.L.; Proffit, W.R. Soft tissue limitations in orthodontics: Treatment planning guidelines. Angle Orthod. 1997, 67, 327–336. [Google Scholar]
- Holdaway, R.A. A soft-tissue cephalometric analysis and its use in orthodontic treatment planning. Part I. Am. J. Orthod. 1983, 84, 1–28. [Google Scholar] [CrossRef]
- Merrifield, L.L. The profile line as an aid in critically evaluating facial esthetics. Am. J. Orthod. 1966, 52, 804–822. [Google Scholar] [CrossRef]
- Holdaway, R.A. A soft-tissue cephalometric analysis and its use in orthodontic treatment planning. Part II. Am. J. Orthod. 1984, 85, 279–293. [Google Scholar] [CrossRef]
- Albarakati, S. Soft tissue facial profile of adult Saudis Lateral cephalometric analysis. Saudi Med. J. 2011, 32, 836. [Google Scholar]
- Pandian, K.S.; Krishnan, S.; Kumar, S.A. Angular Photogrammetric Analysis of the Soft-tissue Facial Profile of Indian Adults. Indian J. Dent. Res. 2018, 29, 137–143. [Google Scholar]
- Akter, L.; Hossain, M. Angular Photogrammetric Soft Tissue Facial Profile Analysis of Bangladeshi Young Adults. APOS Trends Orthod. 2017, 7, 279. [Google Scholar] [CrossRef]
- Celebi, A.; Tan, E.; Gelgor, I.; Colak, T.; Ayyıldız, E. Comparison of Soft Tissue Cephalometric Norms between Turkish and European-American Adults. Sci. World J. 2013, 2013, 806203. [Google Scholar] [CrossRef]
- Filipović, G.; Stojanovic, N.; Jovanovic, I.; Randjelovic, P.; Ilić, I.; Đorđević, N.; Radulović, N. Differences in Angular Photogrammetric Soft-Tissue Facial Characteristics among Parents and Their Offspring. Medicina 2019, 55, 197. [Google Scholar] [CrossRef]
- ALBarakati, S.F.; Bindayel, N.A. Holdaway soft tissue cephalometric standards for Saudi adults. King Saud Univ. J. Dent. Sci. 2012, 3, 27–32. [Google Scholar] [CrossRef][Green Version]
- Al-Azemi, R.; Al-Jame, B.; Årtun, J. Lateral Cephalometric Norms for Adolescent Kuwaitis: Soft Tissue Measurements. Med Princ. Pract. 2008, 17, 215–220. [Google Scholar] [CrossRef]
- Al-Jasser, N. Facial esthetics in a selected Saudi population. Saudi Med. J. 2003, 24, 1000–1005. [Google Scholar]
- Alcalde, R.; Jinno, T.; Orsini, M.; Sasaki, A.; Sugiyama, R.M.; Matsumura, T. Soft tissue cephalometric norms in Japanese adults. Am. J. Orthod. Dentofac. Orthop. 2000, 118, 84–99. [Google Scholar] [CrossRef]
- Hamdan, A. Soft Tissue Morphology of Jordanian Adolescents. Angle Orthod. 2010, 80, 80–85. [Google Scholar] [CrossRef]
- Fernández-Riveiro, P.; Smyth, E.; Suárez-Quintanilla, D.; Suarez-Cunqueiro, M. Angular photogrammetric analysis of the soft tissue facial profile. Eur. J. Orthod. 2003, 25, 393–399. [Google Scholar] [CrossRef]
- Leonardi, R.; Giordano, D.; Maiorana, F.; Spampinato, C. Automatic Cephalometric Analysis A Systematic Review. Angle Orthod. 2008, 78, 145–151. [Google Scholar] [CrossRef]
- Ricketts, R.M. Introducing Computerized Cephalometrics; Rocky Mountain Data Systems, Inc.: Denver, CO, USA, 1969. [Google Scholar]
- Poynton, C. Digital Video and HDTV Algorithms and Interfaces, 1st ed.; Morgan Kaufmann Publishers Inc.: San Francisco, CA, USA, 2003. [Google Scholar]
- Tanikawa, C.; Yagi, M.; Takada, K. Automated Cephalometry: System Performance Reliability Using Landmark-Dependent Criteria. Angle Orthod. 2009, 79, 1037–1046. [Google Scholar] [CrossRef]
- Paradowska-Stolarz, A.M.; Kawala, B. The Nasolabial Angle Among Patients with Total Cleft Lip and Palate. Adv. Clin. Exp. Med. 2015, 24, 481–485. [Google Scholar] [CrossRef]
- Fatima, F.; Jeelani, W.; Ahmed, M. Current trends in craniofacial distraction: A literature review. Dent. Med Probl. 2020, 57, 441–448. [Google Scholar] [CrossRef]


Publisher’s Note: MDPI stays neutral with regard to jurisdictional claims in published maps and institutional affiliations. |
© 2022 by the authors. Licensee MDPI, Basel, Switzerland. This article is an open access article distributed under the terms and conditions of the Creative Commons Attribution (CC BY) license (https://creativecommons.org/licenses/by/4.0/).