1. Introduction
The brain and external devices, such as computers or other electronic devices, can be connected and communicate via Brain–Computer Interface (BCI) through signals generated during human brain activity [
1]. BCI aims to build a bridge link between the brain nerve and the computer. It offers an approach to translating EEG into physical effects without using muscles [
2]. Since the introduction of BCI innovation, the exploration of EEG signal techniques has always been the main impetus for the consistent improvement of BCI technology. In the BCI system, EEG is a painless acquisition method [
3]. It collects weak EEG signals with the help of electrodes placed on the scalp and records electrical signals generated by brain waves.
Because the EEG is weak and has a meager signal-to-noise ratio, extracting and classifying the characteristics is not easy. It is difficult for conventional classification techniques to recognize representative features to create a classification model with good results. A deep learning network model with a deep construction can extract more significant features through hierarchical nonlinear mapping and is viewed as a promising model for extracting EEG signal features [
4].
Most early AI algorithms require tons of manual work to distinguish pertinent features in the signal. As of late, deep learning and artificial neural network research have obtained incredible achievements in the field of computer vision and speech, for example, layer-by-layer automatic learning of data features, step-by-step abstraction, and sound generalization capabilities.
CNN is an end-to-end deep learning network that builds its own feature-extraction model. A well-trained CNN with multiple layers automatically detects features. Due to the accessibility of enormous computing clusters, special equipment and large amounts of data have found many valuable applications in image classification and object recognition.
However, CNN’s usage was fraught with difficulty because of the computationally intensive inference process and its complexity. Engineers have embraced particular CNN hardware accelerators to expedite the calculation, such as SoC [
5], ASIC [
6], GPU, and FPGA [
7]. The GPU platform is frequently the first option for scientists due to its exceptional computational performance and user-friendly development design. However, because of its high price, high power consumption, and large volume, the GPU cannot be used universally in all situations.
Conversely, some scientists are pinning their hopes on the FPGA. Due to unique hardware construction, the FPGA inference hardware accelerator is foretold to surpass GPU in terms of calculation performance and power consumption for CNN. Scientists proposed many FPGA hardware accelerator models with integrated software and hardware optimization methods to obtain high performance and energy efficiency [
8,
9,
10].
In this study, we compared the effects of STFT and CWT methods on classification accuracy in EEG signal processing. Furthermore, we propose a lightweight CNN inference hardware accelerator unit based on the PYNQ platform. We collected a set of eight channels of EEG signals by using OpenBCI, a consumer-grade device. The recorded data were used to train a lightweight CNN after preprocessing on a laptop, and the trained network parameters were downloaded to PYNQ for inference operations. Finally, the article evaluated the performance of two different construction CNNs on a laptop with GTX 1050Ti GPU, ARM CPU, and FPGA on PYNQ-Z2 platforms.
2. Methods
2.1. Data Acquisition
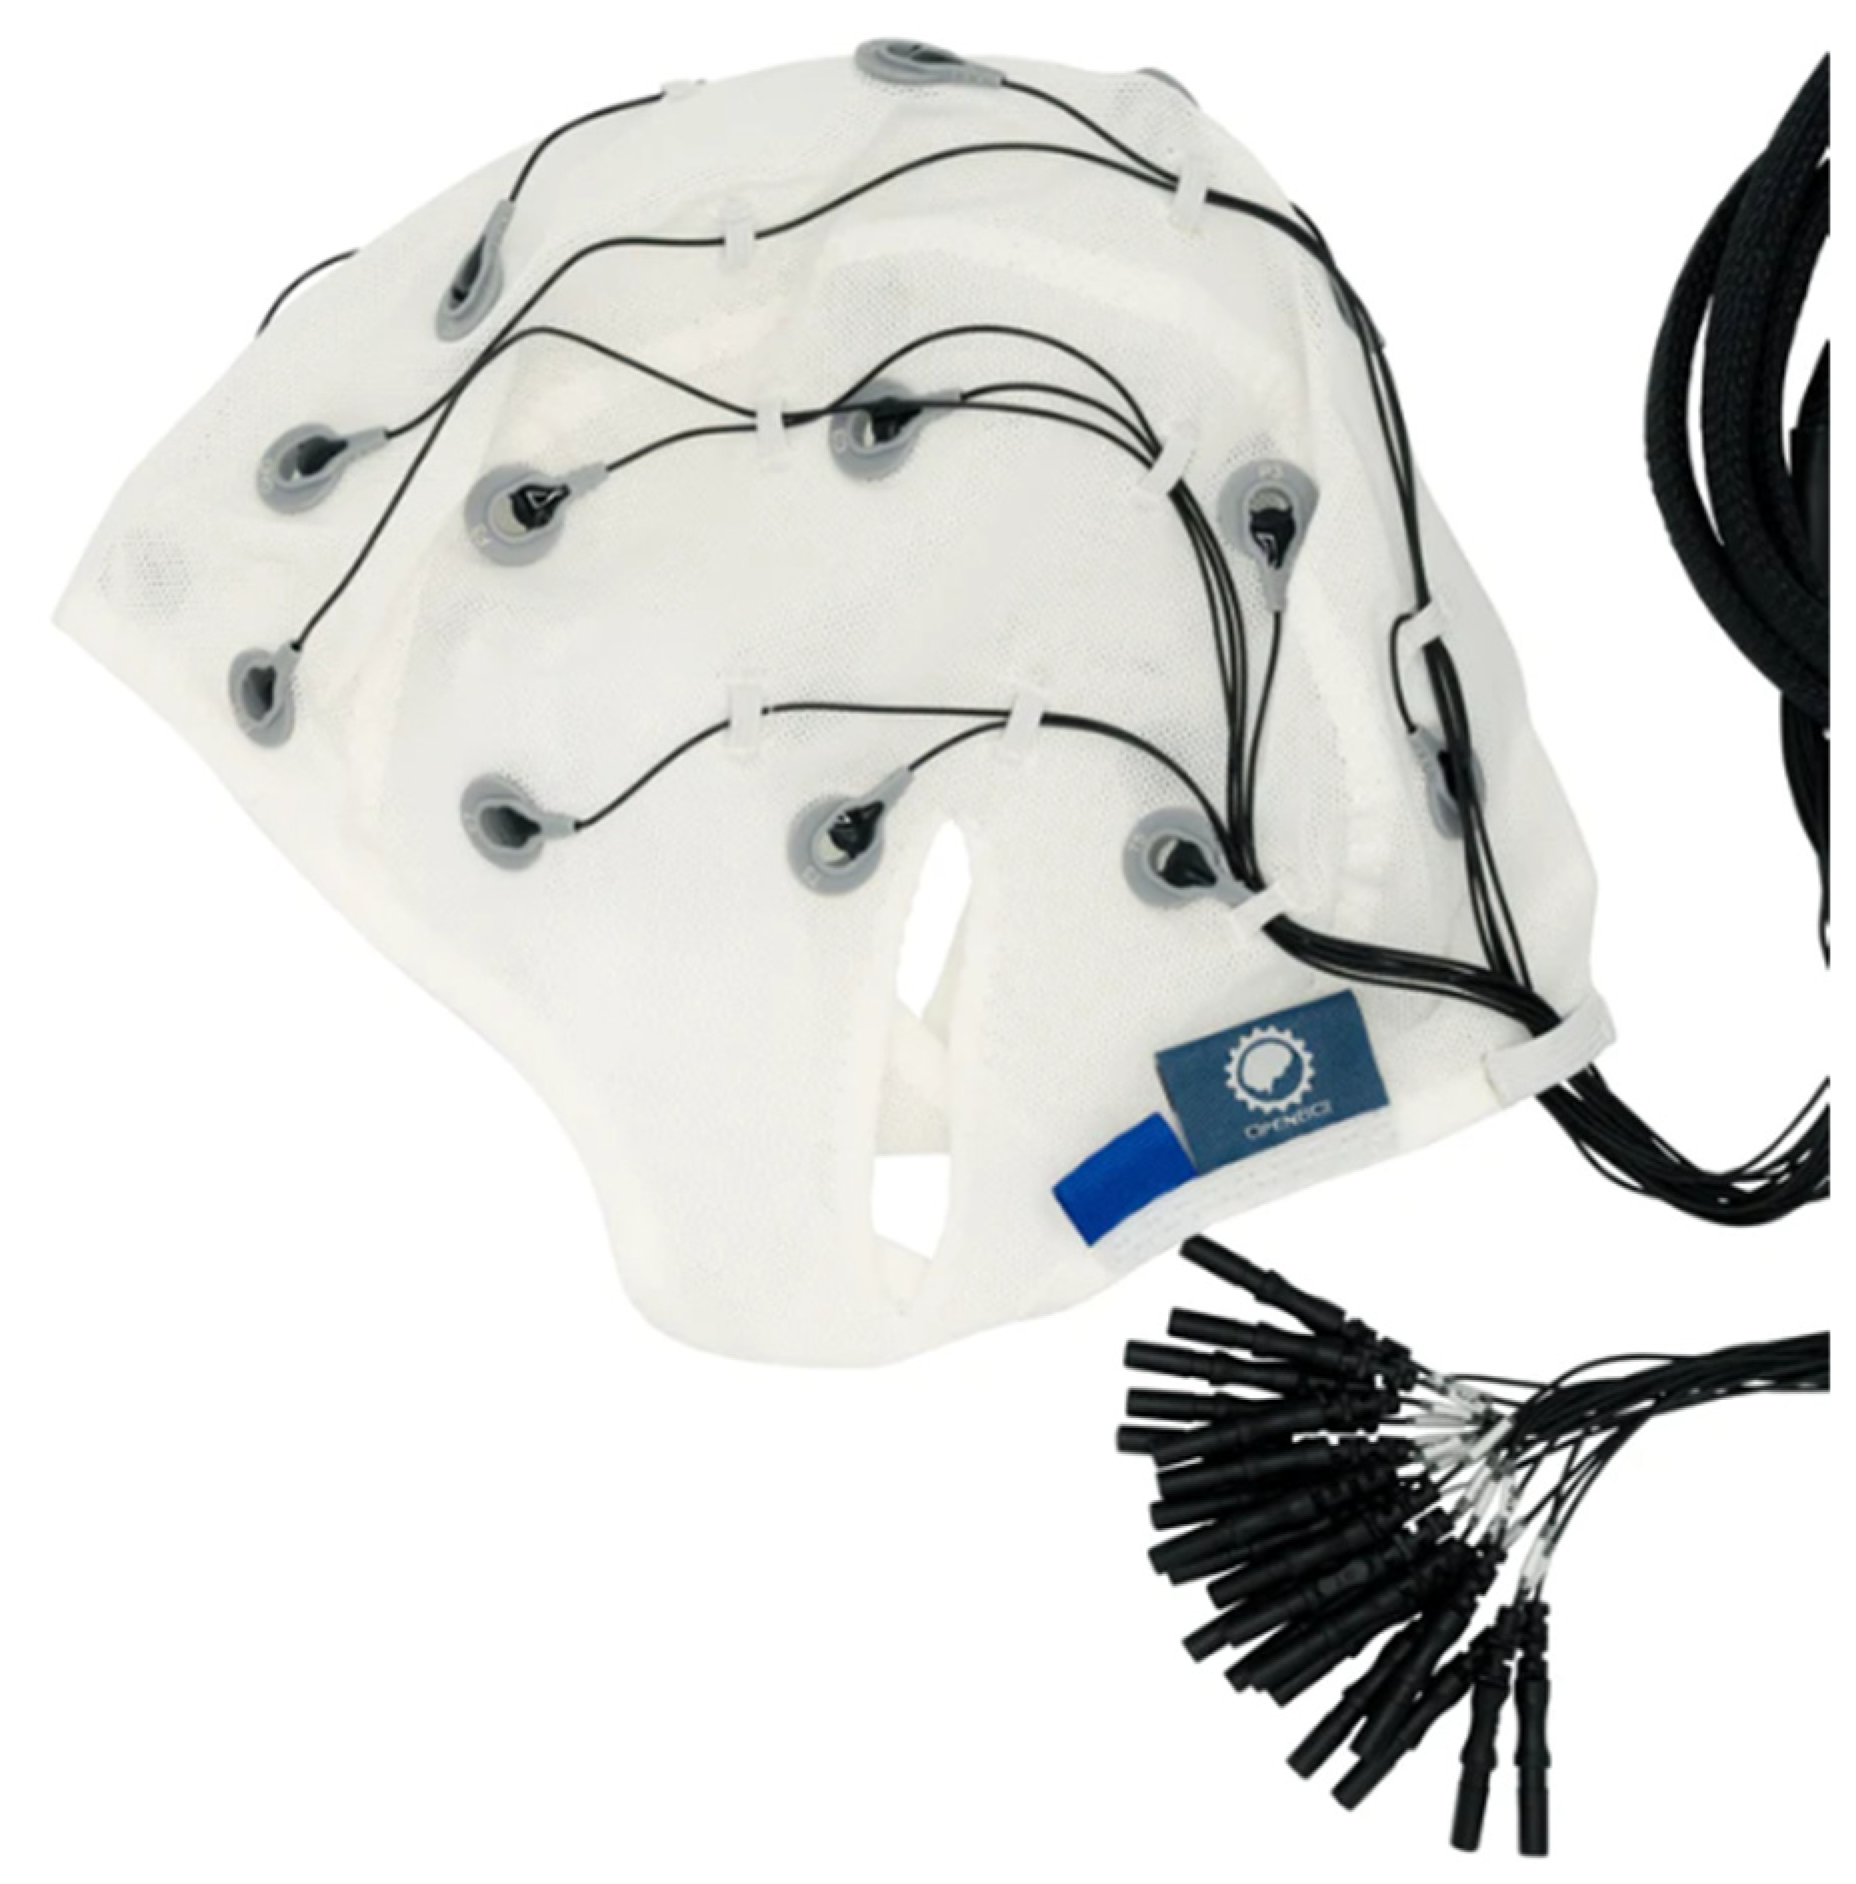
EEG signals were recorded from 10 subjects using OpenBCI Cyton Biosensing Board amplifiers connected to the OpenBCI EEG electrode cap, a 21-channel electrode cap with coated electrodes [
11]. The OpenBCI 21-channel electrode cap is shown in
Figure 1.
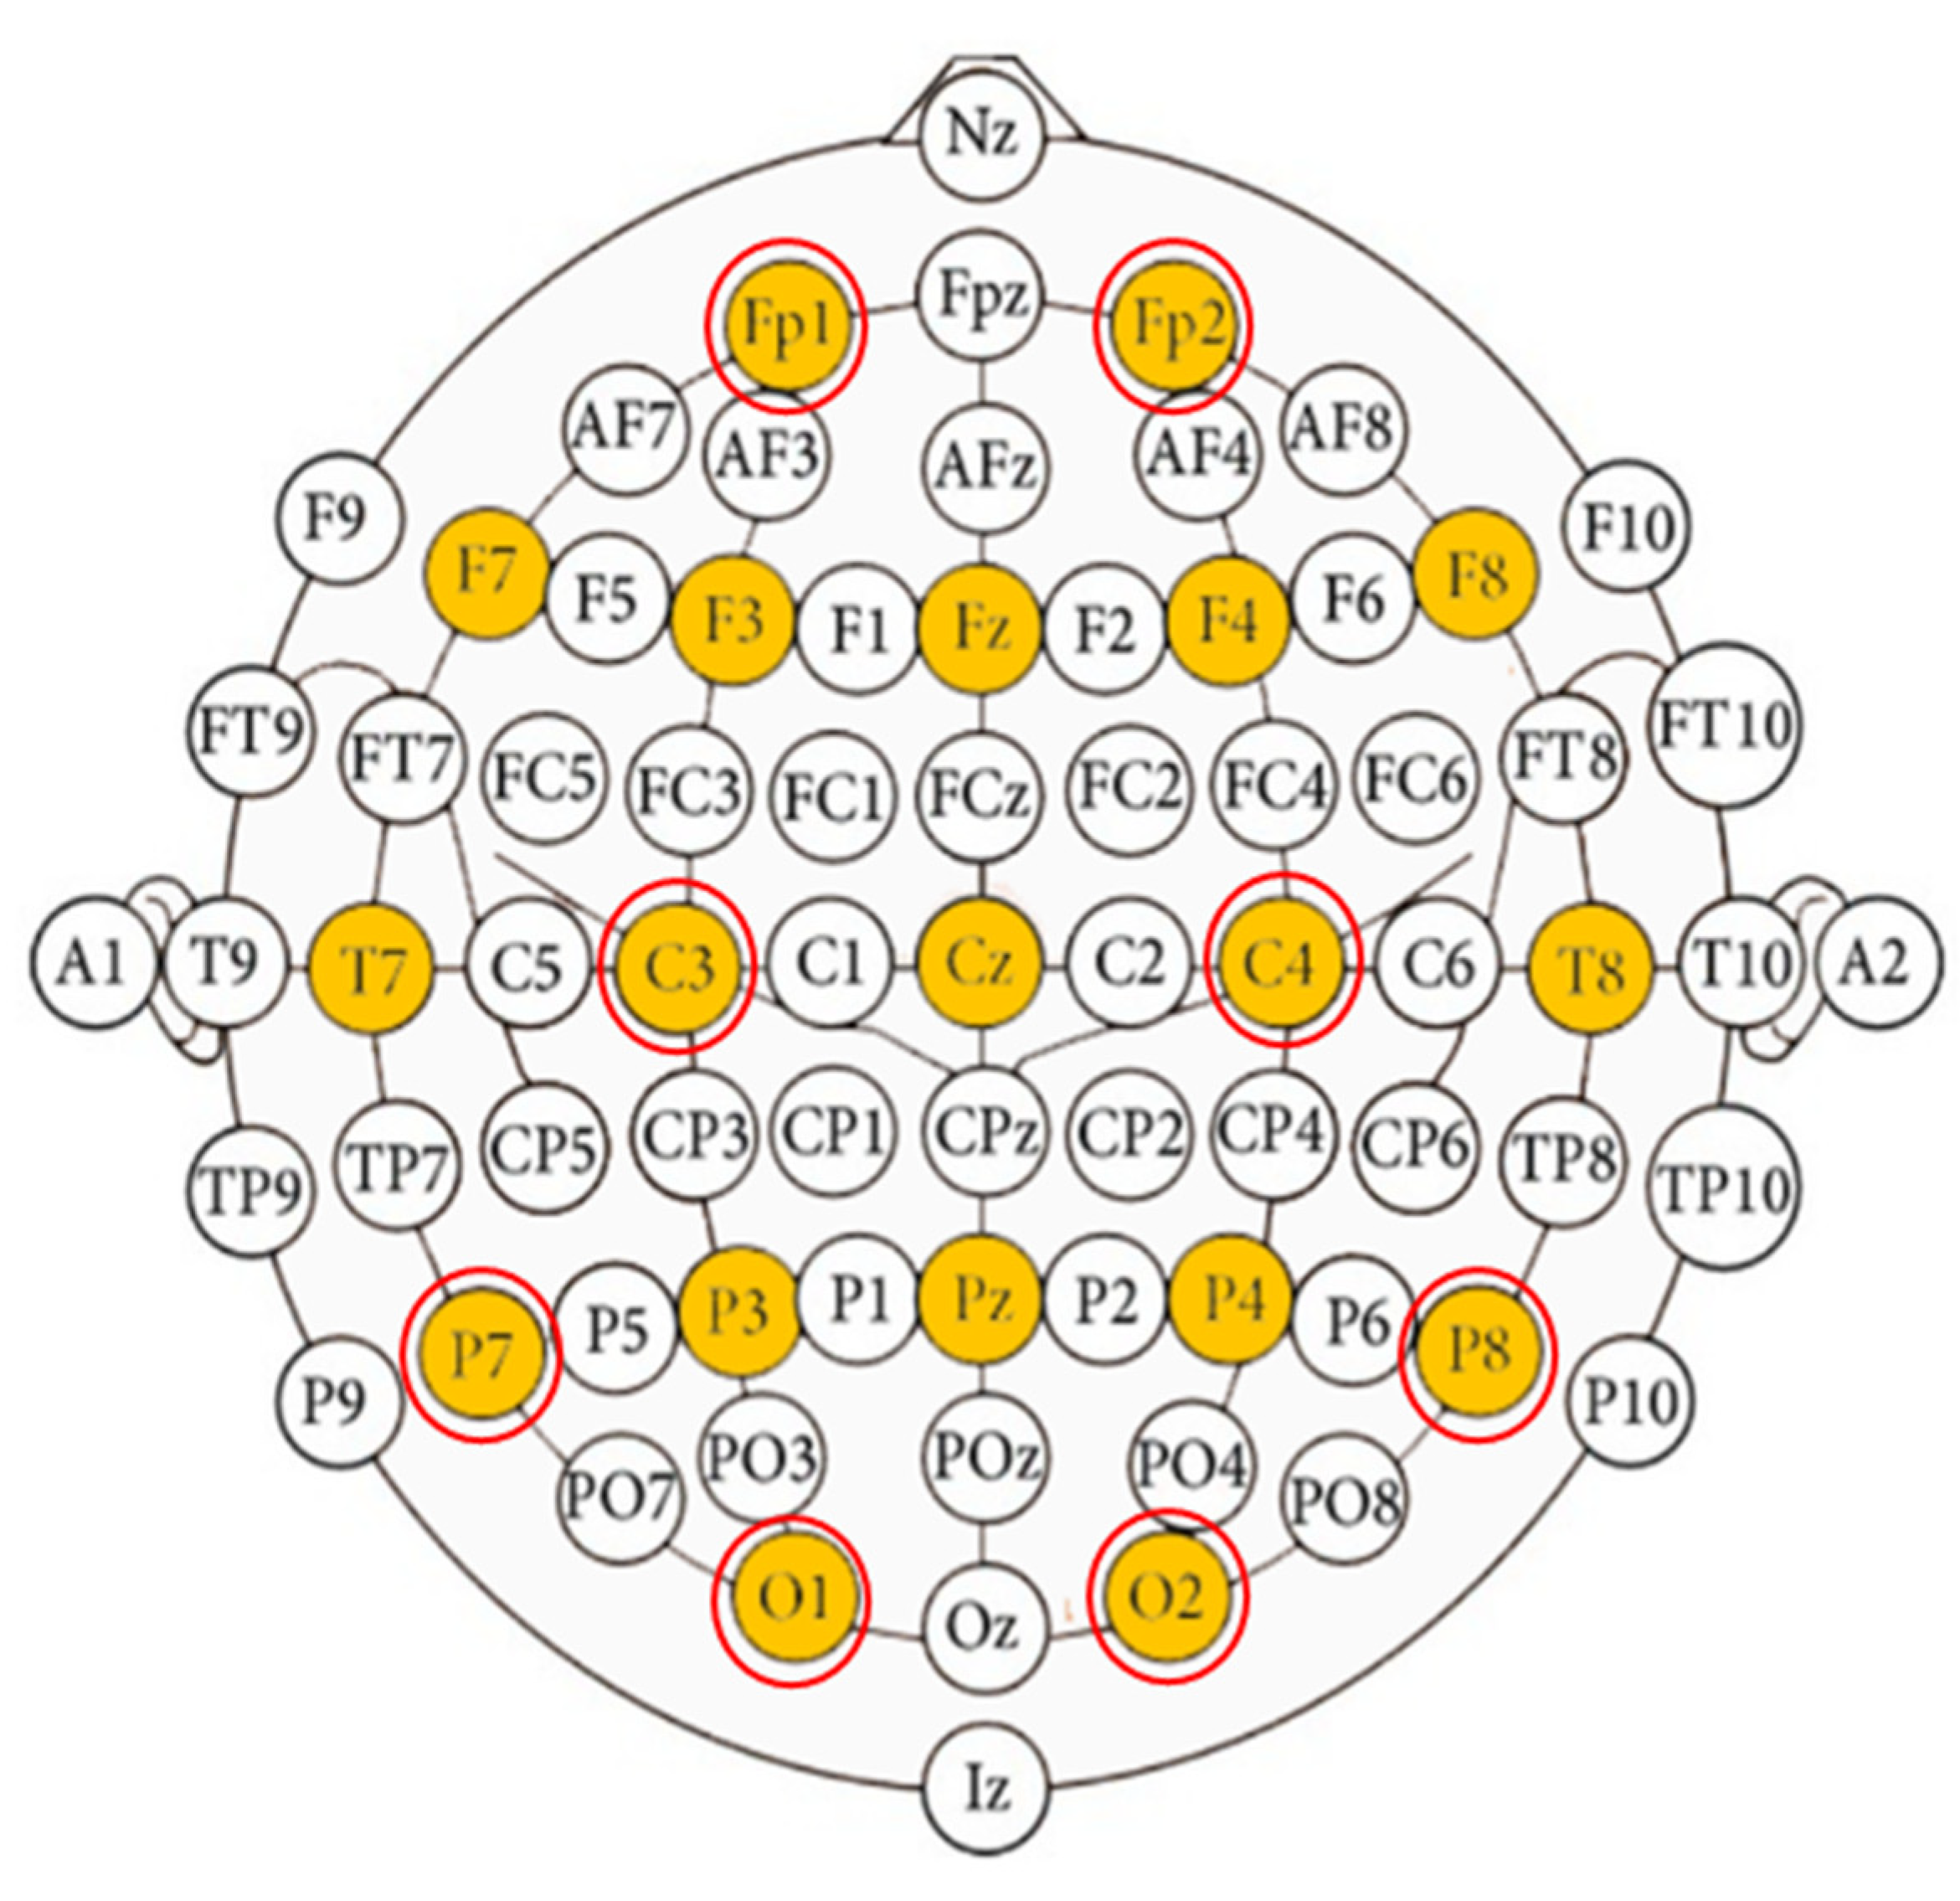
OpenBCI supports a 250 Hz sampling rate with an 8-channel recording. While 16 channels can be used with an add-on board (OpenBCI Daisy board), it reduces the sampling rate to 125 Hz. We used 8 of these electrodes at the following locations using the internationally recognized 10–20 system: C3, C4, Fp1, Fp2, O1, O2, P7, and P8. These electrodes map to labels on the electrodes shown in
Figure 2. Kindly note that the cap uses older labeling and that T3, T4, T5, and T6 were refreshed to be T7, T8, P7, and P8, respectively [
12]. These placements are exchangeable, and keeping in mind that the caps’ labels utilize older naming, they correspond to nodes in
Figure 2.
Each volunteer completed ten trials. Each trial consisted of one minute of eye-open recording and one minute of eye-closed recording for measurement. Because the actual collected EEG data are easily polluted by noise, the EEG signals recorded directly from scalp electrodes cannot accurately represent the brain’s neural signals. It is necessary to preprocess and de-noise the original EEG data to reduce or eliminate the influence of artifacts as much as possible.
2.2. Data Analysis
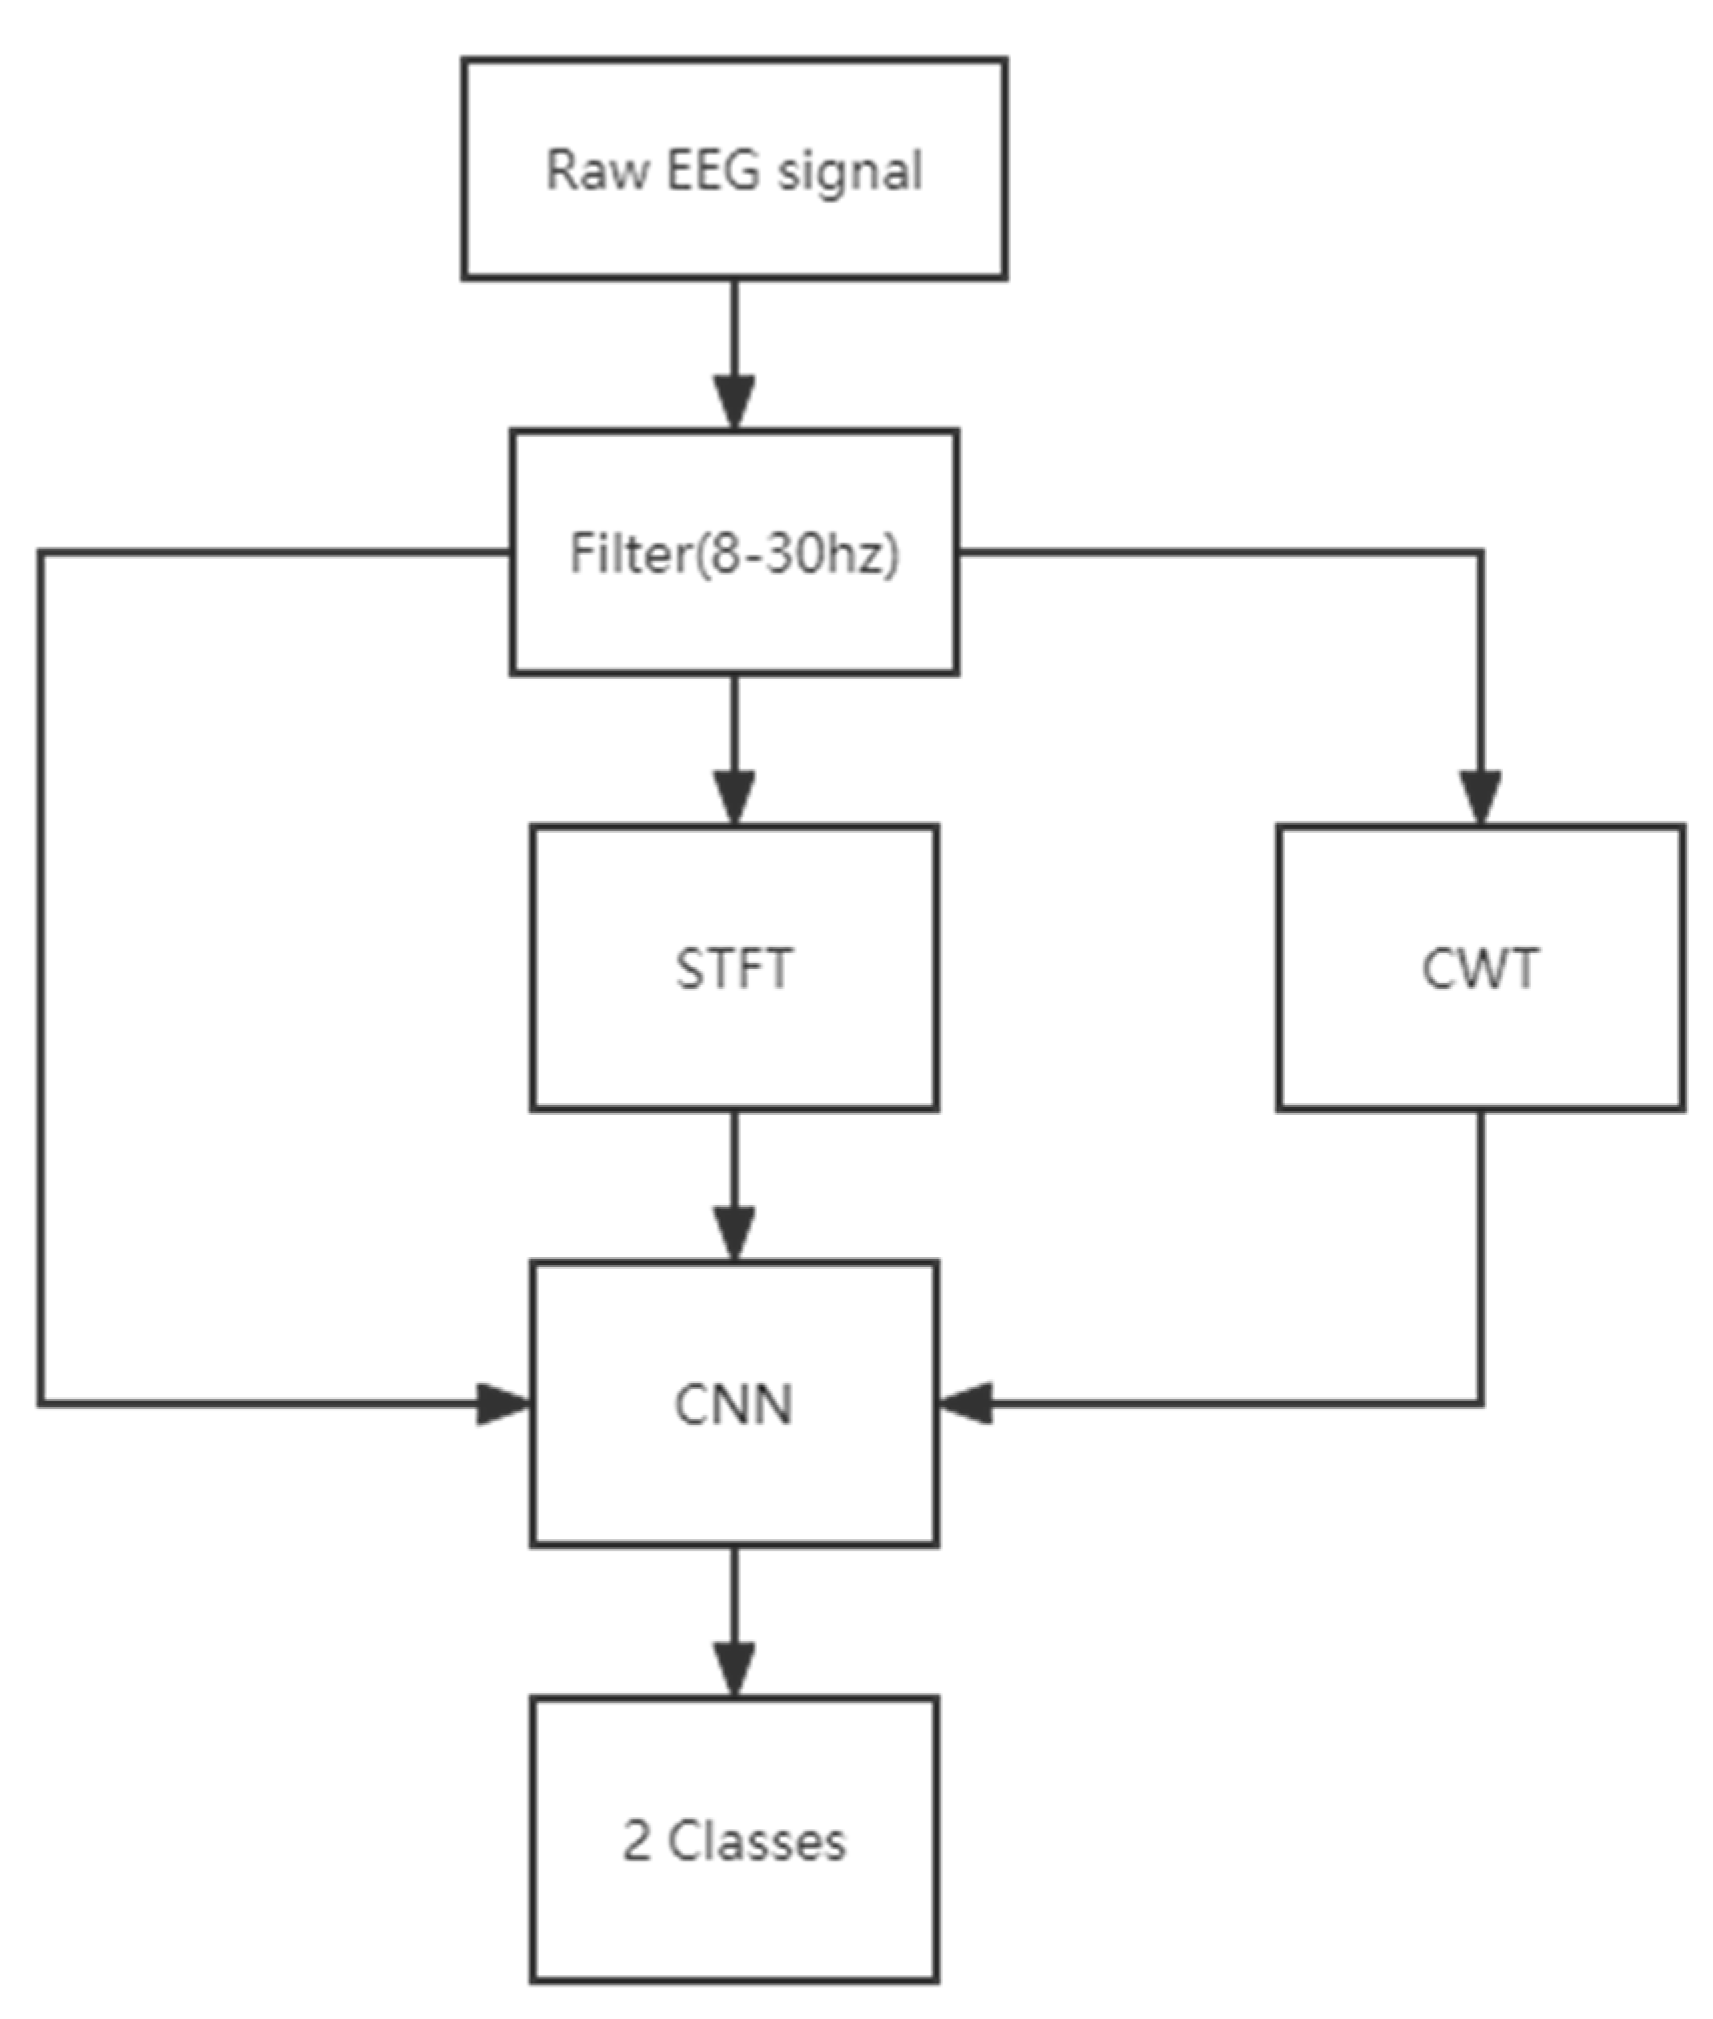
This study compared three preprocessing algorithms to classify eye open and close EEG signals. The filtered signals are processed in three different ways (by STFT algorithm, CWT algorithm, and without any preprocessing), and then eye-state EEG signals are mapped to time-frequency images as input to CNN for training.
2.2.1. Short-Time Fourier Transform (STFT) and Continuous Wavelet Transform (CWT)
Fast Fourier transform (FFT) is the most commonly used tool in the time-frequency analysis of signals. However, when using FFT to analyze signals, the problem of information localization in the time and frequency domains cannot be considered. In order to solve this problem, Fourier transform is generalized, and a series of methods based on time-frequency domain analysis is proposed, for example, STFT and CWT.
The STFT algorithm was first introduced by Gabor Dennis in 1946. It solved the problem that the information in the time domain and the frequency domain could not be localized by setting the size of a time window to determine the frequency information at a particular time point. The STFT is now represented by
where
is EEG signal,
is a temporal window, and
is the complex conjugate of
. The time span of window functions is crucial to describing the relationship between amplitude and time. The shorter the time window, the higher the time resolution. The narrower the frequency window, the higher the frequency resolution [
13].
CWT algorithm was proposed in 1984 to solve the problem that the STFT algorithm could not balance the information of global and local features due to the fixed window scale [
14]. The expression of the continuous wavelet transform is shown in Equation [
15]:
where
is the input signal, a is the scale of the wavelet transform,
is the wavelet basis function, and
is the time shift. There are five commonly used wavelet basis functions: Morlet wavelet, Mexican Hat wavelet, Harr wavelet, Daubechies wavelet, and SymN wavelet clusters. We choose the Morlet wavelet as the wavelet basis function. Its time-domain expression is as follows:
The expression of frequency is:
By analyzing the data, T and of the wavelet function are determined.
The flowchart of data processing in this study is shown in
Figure 3.
2.2.2. Preprocessing
EEG signals can be divided into different bands in the frequency domain. The 8–14 Hz bands are referred to as alpha waves, the 14–30 Hz bands are referred to as beta waves, the 30 Hz–80 Hz bands are referred to as gamma waves, the 1–4 Hz bands are referred to as the delta, and the 4 Hz –8 Hz bands are referred to as theta wave. The frequency bands are not exactly the same as in other articles [
2,
16,
17].
As soon as people are awake and quiet and their eyes are closed, alpha waves are observed [
18]. Alpha waves turn into fast waves when people think, open their eyes, or are subjected to other stimuli. This situation is named “alpha blocking” [
19]. Alpha wave is the direct reflection of electrical activities of the cerebral cortex in the awake, quiet, and eye-closed state.
Although open/closed-eyes activities can be distinguished well based on the alpha waves, the amplitude of the alpha wave is much more unstable than that of the beta wave. It may be a reason that the beta wave can be an experimental indicator for the opened eyes state [
20]. Therefore, the accuracy rate can be further improved if the neural network is trained by combining alpha and beta waves. Before training on the data set, a bandpass FIR filter of 8 Hz–30 Hz (alpha and beta bands) must be performed on the collected data to preserve the frequency bands related to eye activity. This method is simple and practical and is one of the essential methods in EEG signal processing.
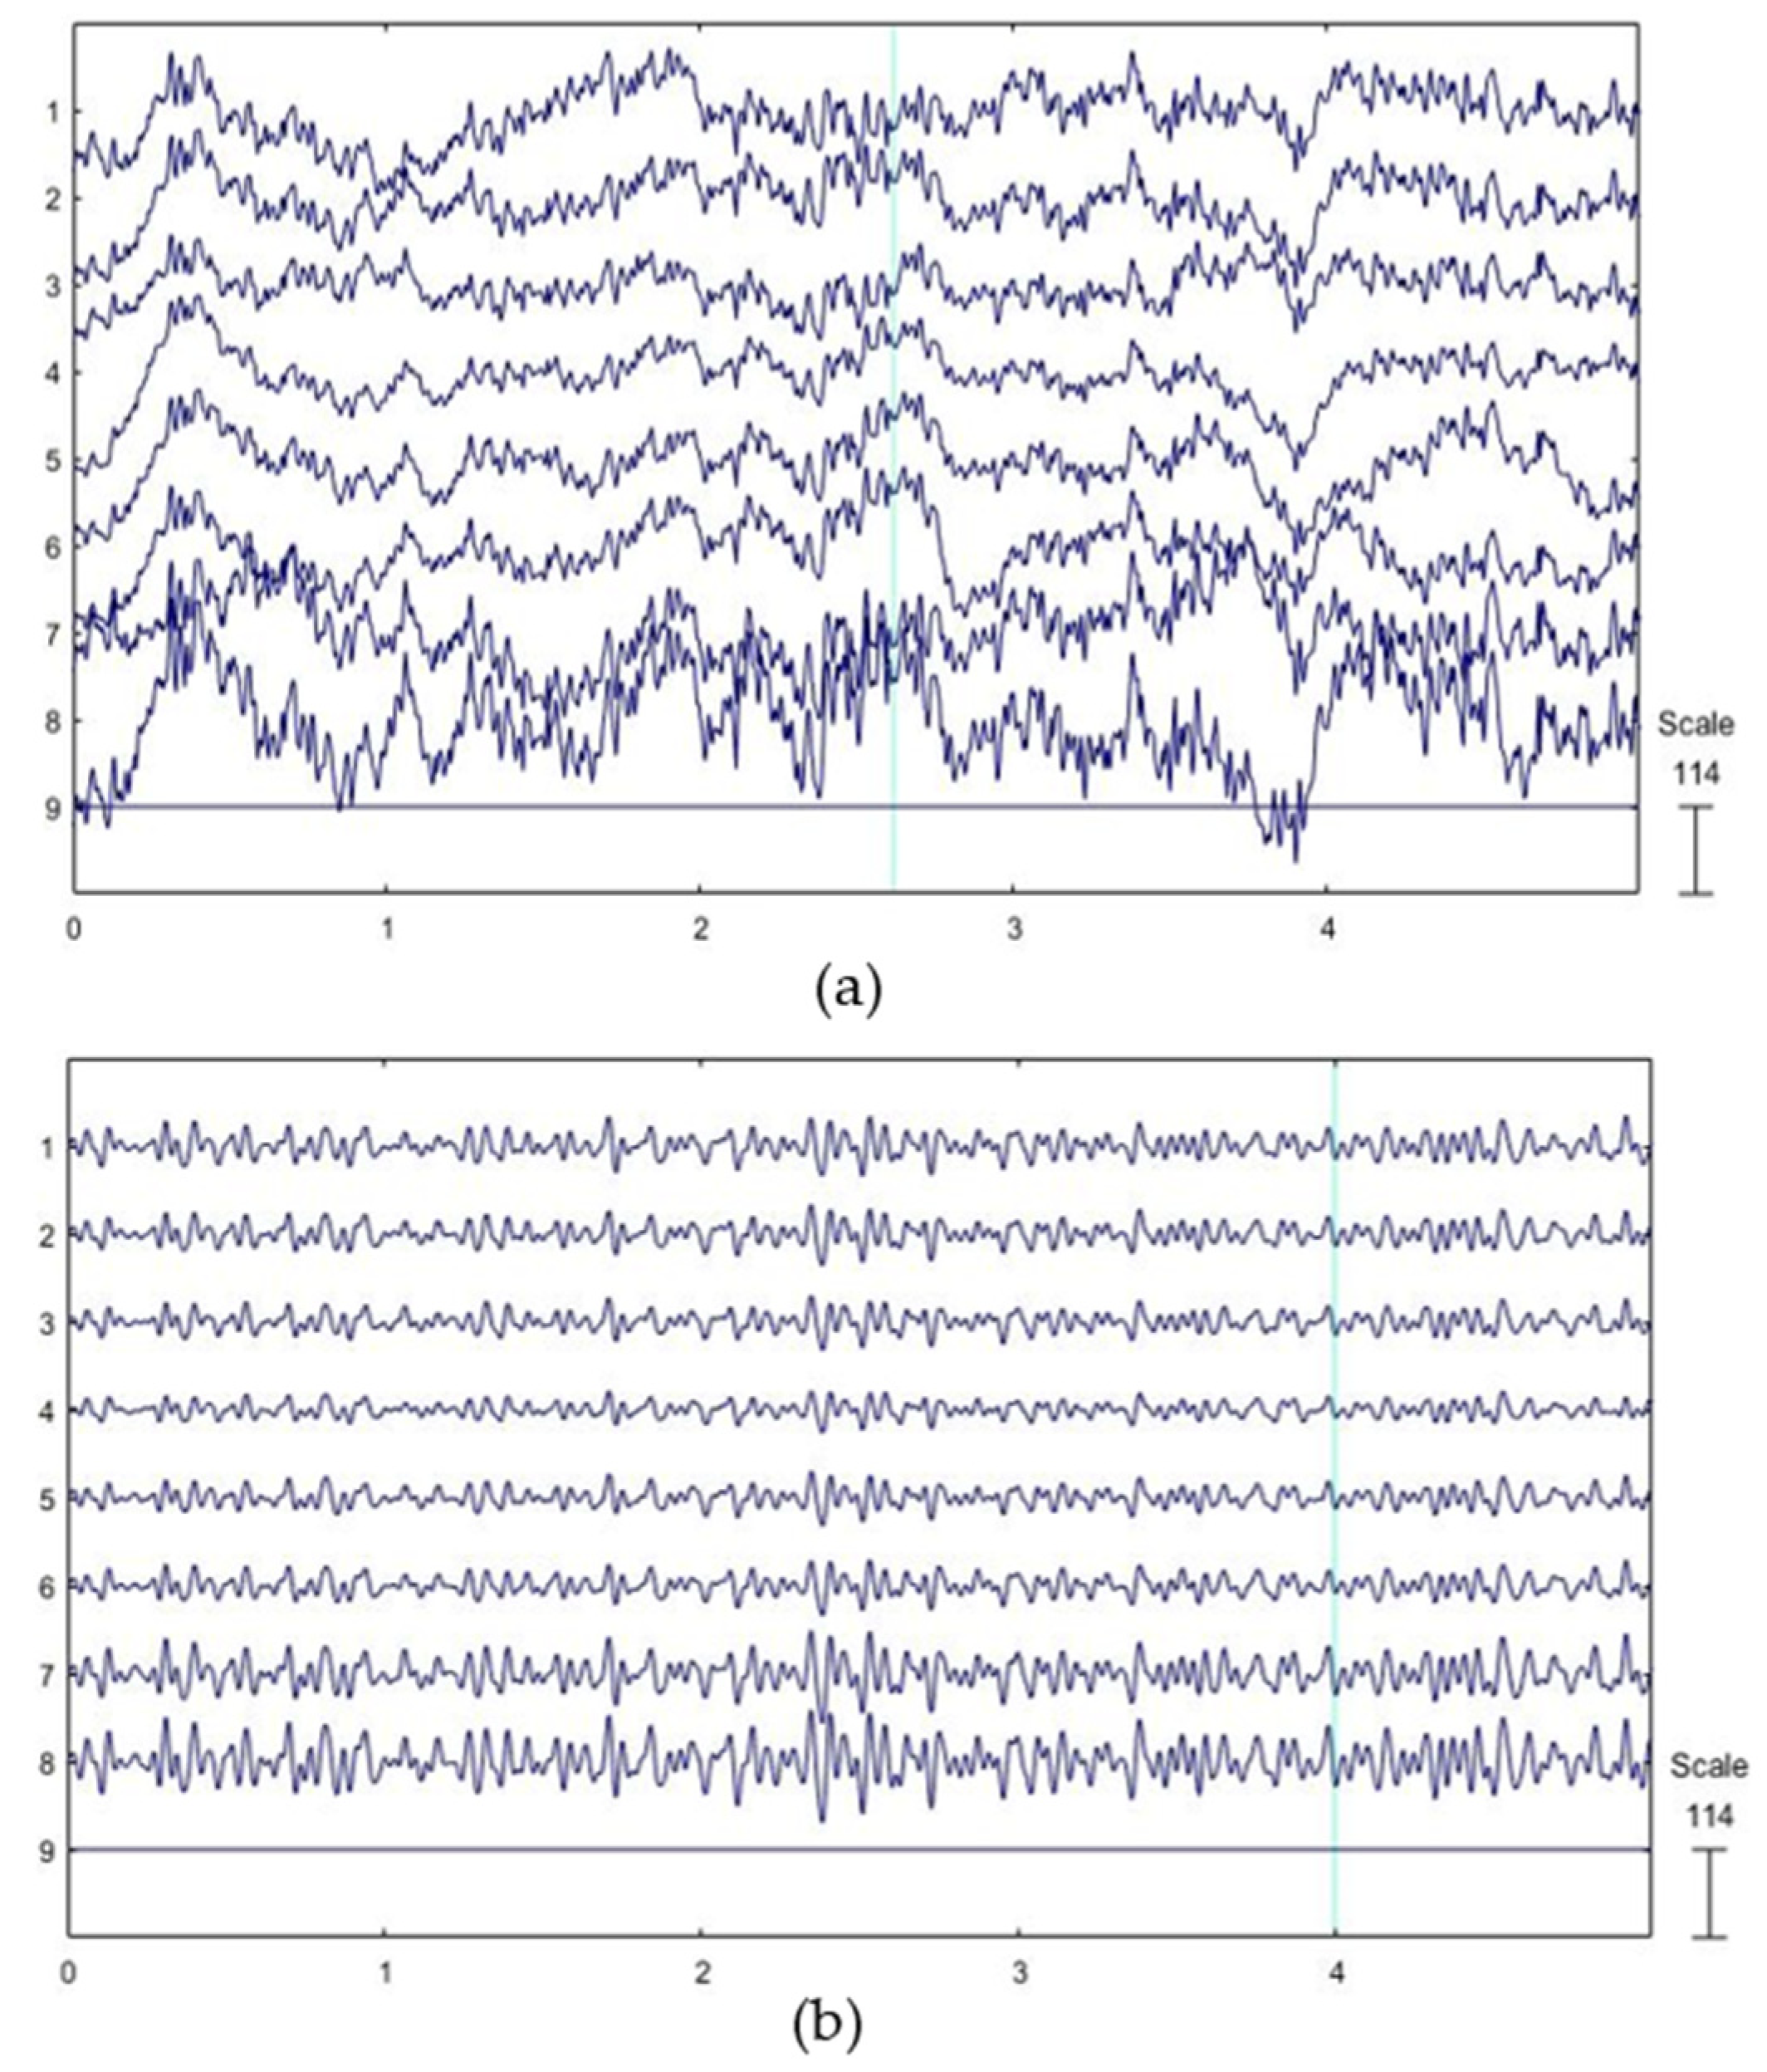
Figure 4 shows the comparison of partial EEG signals before and after filtering. It can be seen that the EEG signal is filtered, and the clutter becomes is reduced. The comparison of the eye-open and eye-close filtered signal and its CWT feature image are shown in
Figure 5.
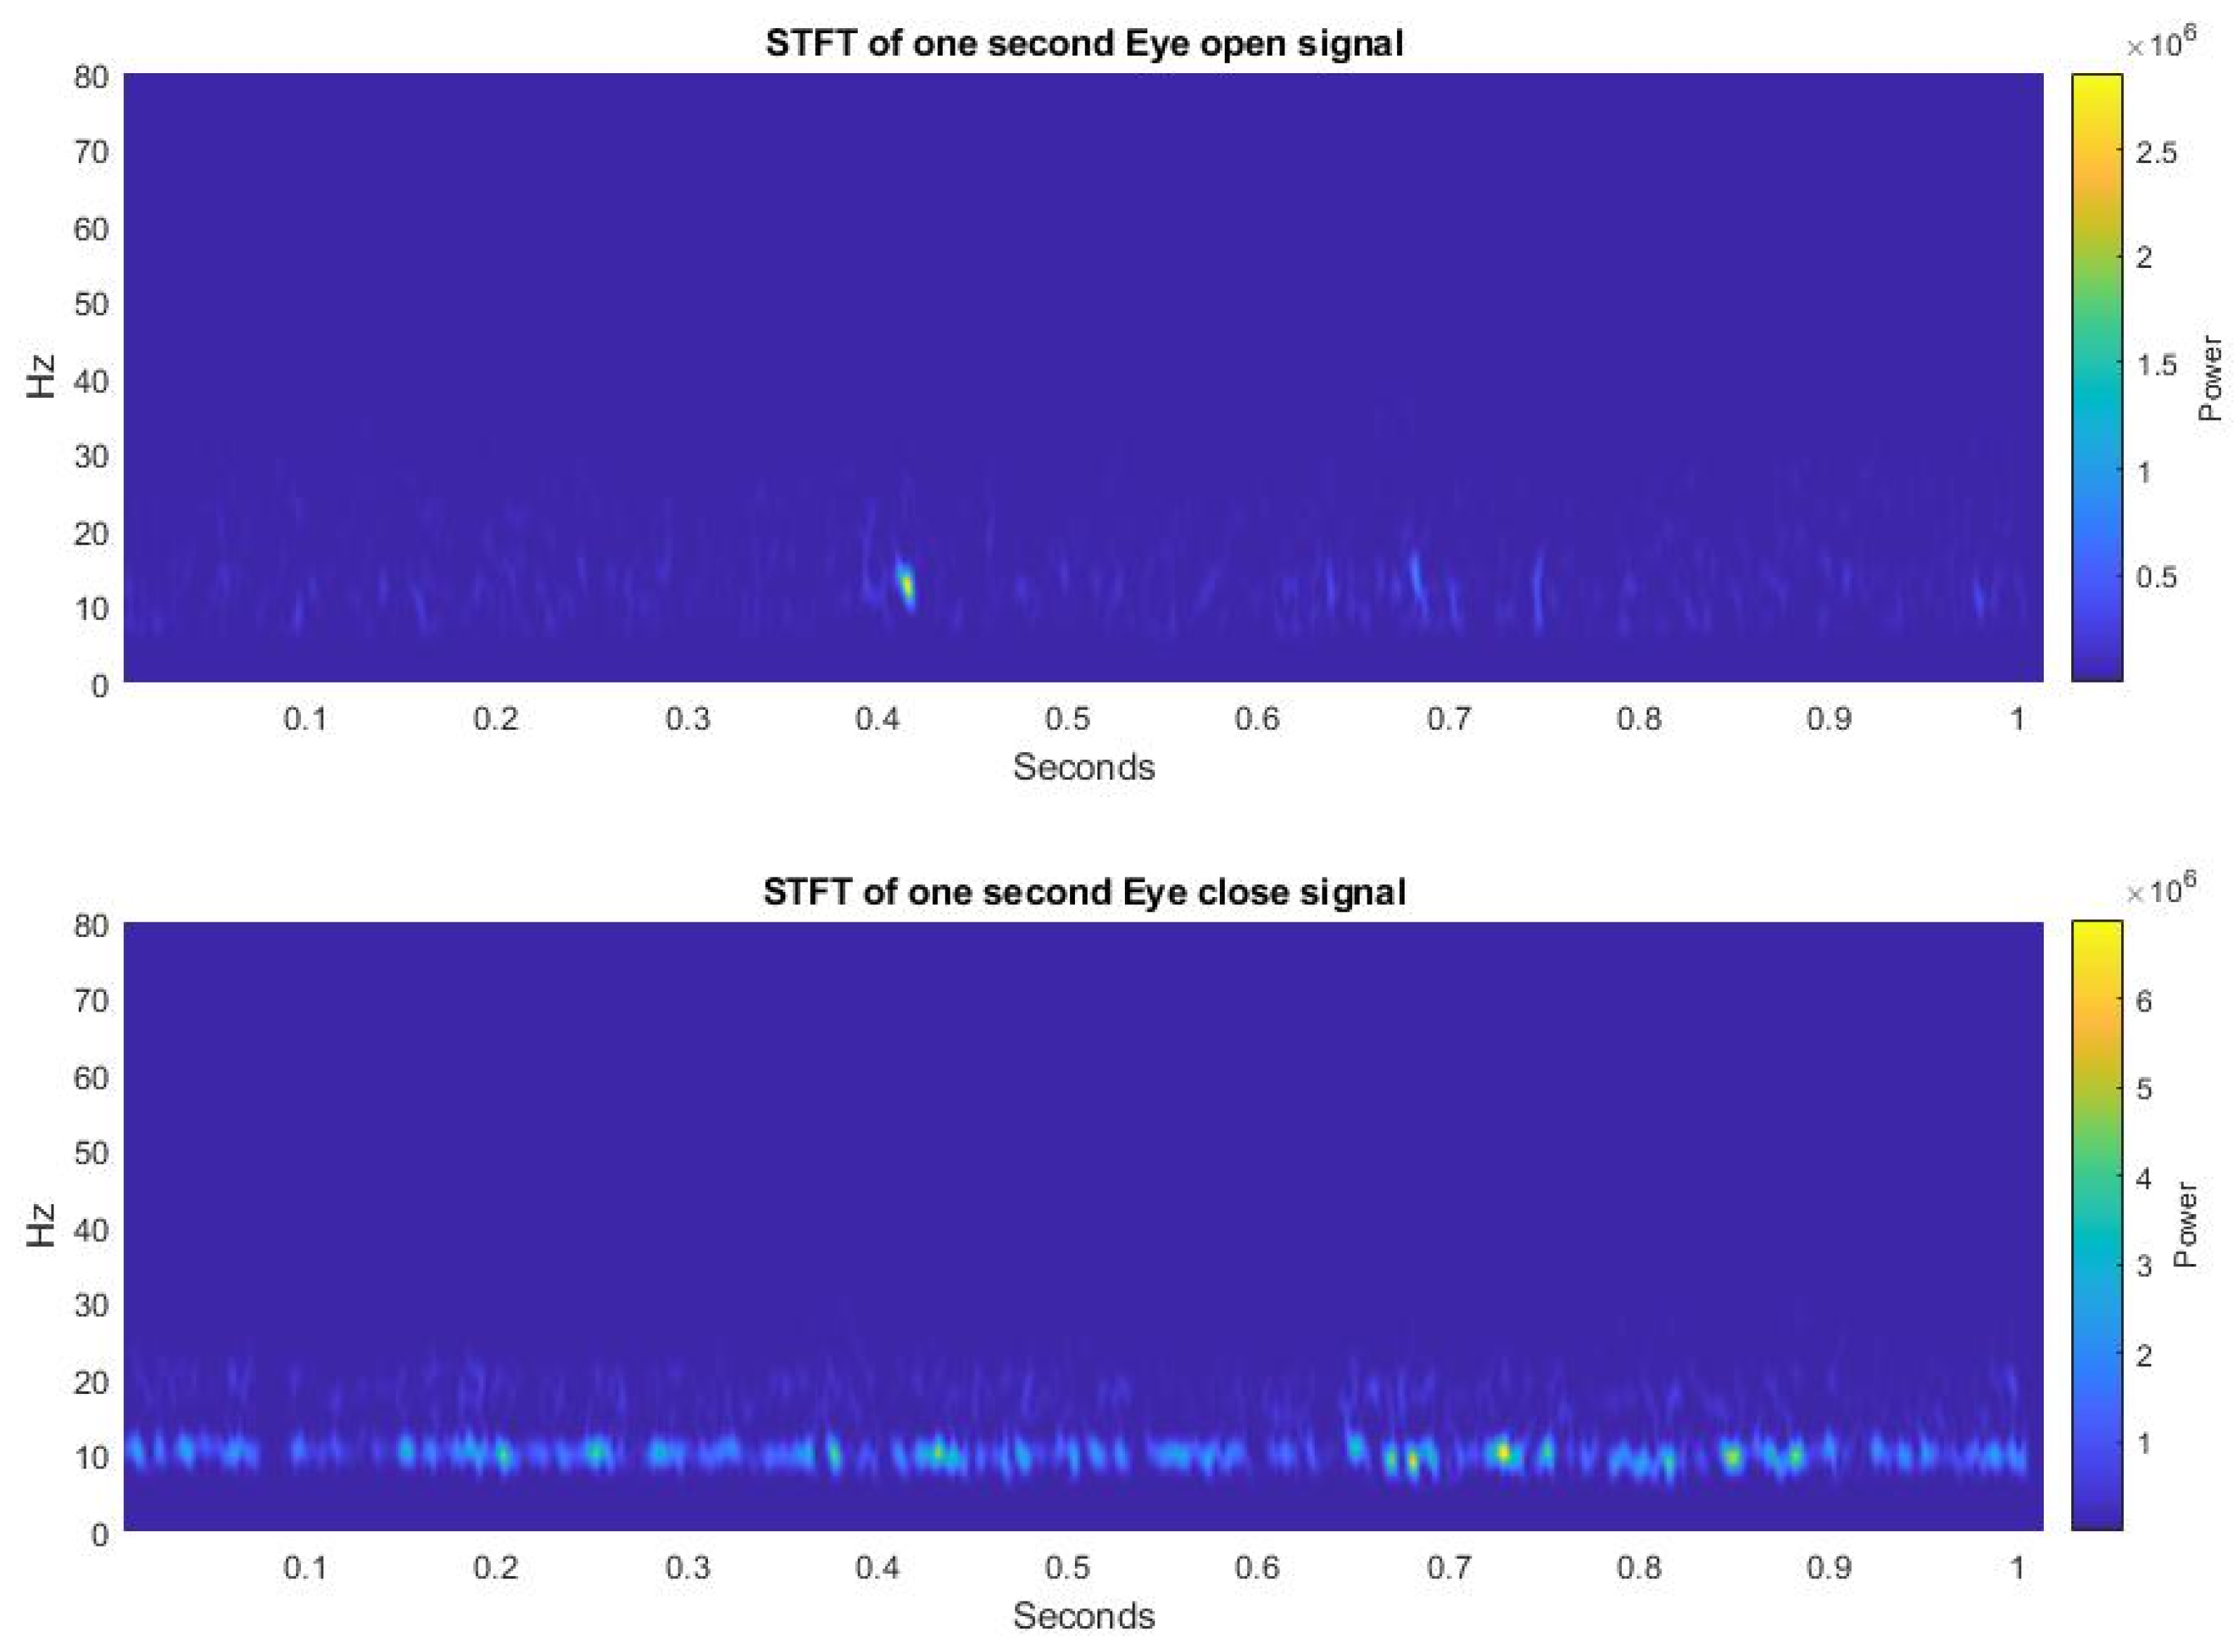
Figure 6 shows the comparison of eye-open and eye-close signals converted by STFT. From
Figure 5 and
Figure 6, we can see that when people close their eyes, most of the power is concentrated in 8–13 Hz, which is the alpha wave. A small amount of power is concentrated in the 13 Hz–30 Hz, which is the beta wave. The signal of open eyes is scattered and irregular.
2.3. Convolutional Neural Networks
A subset of artificial neural networks is CNN. In general, it refers to numerical models that replicate natural human brain nerves. CNN, a typical construction of artificial neural networks, has its main benefits in feature extraction after well-training [
21]. The disadvantage of traditional methods, which require much manual work for data processing, is avoided. The input layer, convolutional layer, pooling layer, fully connected layer, and output layer are among the layers that make up its primary structures.
The convolution layer performs the convolution operation on the input signal using the convolution kernel. The output of the convolution is called the feature map. The parameters involved are convolution kernel size, stride step size, and padding form. The weight coefficient and offset are independent for each component of the convolution kernel. The complexity of the model increases significantly with the number of layers.
Since the operation of convolution is the multiplication and addition of the corresponding elements, the parallel computing capability of FPGA is very suitable for dealing with such computing problems.
The pooling layer can also be called the down-sampling layer [
20]. After each convolutional layer, adding a pooling layer with a kernel can reduce the feature map’s size and the amount of parameter calculation in the network training process. Maximum pooling and average pooling are two different pooling layers. That is, the maximum or average value within the accepted region is adopted. Average pooling can also be regarded as average filtering of features, and maximum pooling can highlight signal features that are easy to distinguish.
In the neural network model, adding a fully connected layer can enhance the nonlinear mapping ability of the network and limit the network scale. Relu [
22] and Softmax [
23] are two types of activation functions. The Relu function usually uses the activation function to map the output to another input after the completion of the convolution operation to enhance the nonlinearity of the network. The softmax function calculates the probability distribution of k output classes. Thus, the final layer uses the Softmax function to predict which action the input EEG signal belongs to.
2.4. Training CNN
The classification accuracy advantage of the CNN algorithm can only be reflected when sample sets are large. The more complex the network is, the more parameters need to be trained, and the more training set samples need to be available. Therefore, in designing a neural network, the complexity of the network model cannot be increased blindly. The layers of the three CNN models are shown in
Table 1. The raw data were normalized with center 0 and standard deviation 1 and used as inputs for the CNN.
In the process of preparing a CNN model, in addition to determining the structure of the network, many hyperparameters should be set manually. We set up a series of parameters to train a network using stochastic gradient descent with momentum.
We used a mini-batch with 64 observations at each iteration. Network convergence is difficult and under-fitting if the network is too small. It will result in inefficient or memory overflow if the batch size is too large.
Learning rate plays a crucial role in network training. It is used to control the speed of descent of the error curve. It would make an error explosion and make it impossible to determine the direction of gradient descent with a high learning rate. Conversely, a low learning rate will lead to the error curve dropping too slowly. We decreased the learning rate by 0.05 for every ten epochs with a 0.2 initial learning rate and set the maximum number of epochs for training to 500. To prevent network overfitting, we designed an “early stop” mechanism. That means training is stopped before the test error starts to rise, even though training has not yet converged. L2 regularization techniques were used to address over-fitting and feature selection, and it was set to 0.0005.
2.5. ZYNQ and PYNQ
PYNQ [
24] is abbreviated as Python On ZYNQ [
25]. The aim is to permit the developer to completely use the ZYNQ platform’s features without having to actually work programmable logic circuits. Different from other FPGA devices, both the FPGA chip and the ARM processor are integrated on the Zynq platform, as same as an assortment of interfaces between the two parts. The advantage of an integrated architecture base on ARM with the variety of an FPGA is gathered in Zynq. It can rapidly deploy a working framework and launch the software on ARM and also take advantage of the parallelism of FPGA to speed up specific algorithms. While keeping up with effectiveness, the ZYNQ includes features such as low energy consumption, easy deployment, and movement. Developers might develop Zynq’s combination of FPGA hardware and ARM chip by utilizing Python-based technology to exploit more complicated accelerators quickly. Furthermore, many linear structures can be run more efficiently on ARM in CNN. It fits into the strengths of Zynq’s platform. Therefore, the PYNQ platform is an optimal FPGA device for building a hardware CNN accelerator.
3. The Inference Framework
This paper uses a software and hardware accelerator framework similar to that used in [
26]. Compared with [
26], we used our own OpenBCI equipment to collect EEG data and proposed three CNN frameworks. We also optimized the hardware structure of the CNN accelerator to improve the throughput. The specific optimization method can be found below in this chapter. In this paper, we used the evaluation criteria power efficiency to compare the three different platforms more reasonably and fairly.
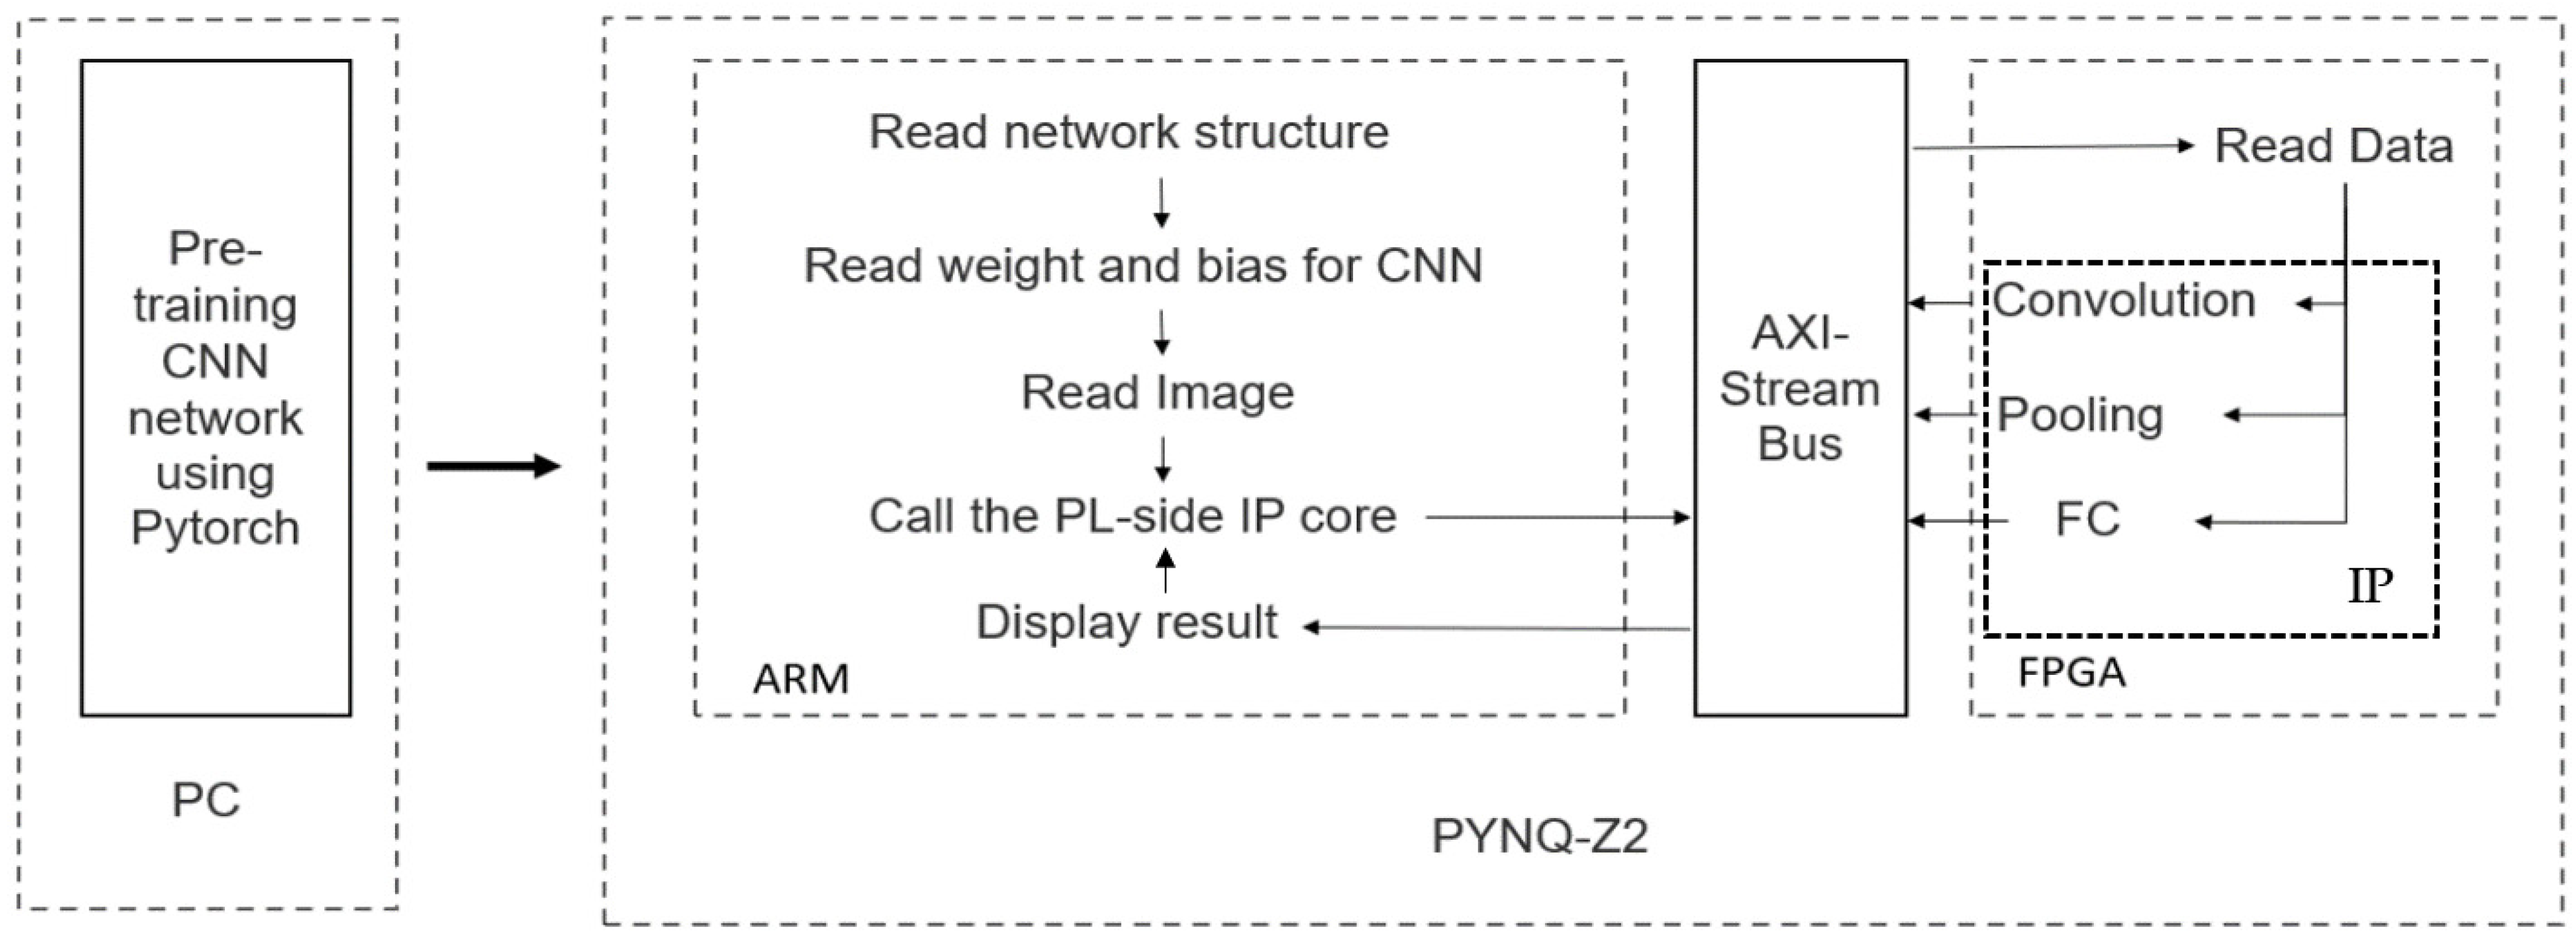
The proposed framework of the CNN inference unit is shown in
Figure 7 [
26]. The recorded data were used for training with the model stated in 2.4 on the PC side using the PyTorch tool. The PYNQ-Z2 Board obtained trained network parameters and test data set from PC. The ARM processing system (PS) part is responsible for the preprocessing data and displaying the result of the IP core.
The functions of convolutional computing, pooling computing, and fully connection computing in CNN are developed on the Programmable Logic (PL) part, which utilizes the FPGA benefits for parallel processing and diminishes the misuse of registering resources. An IP core can be designed by C, C++, or System C and converted into RTL implementation by the HLS kit. It dramatically reduces the amount of code and improves the programmer’s work efficiency compared to hardware description language. It should be mentioned that not every C and C++ grammar is permitted to be utilized in HLS [
27].
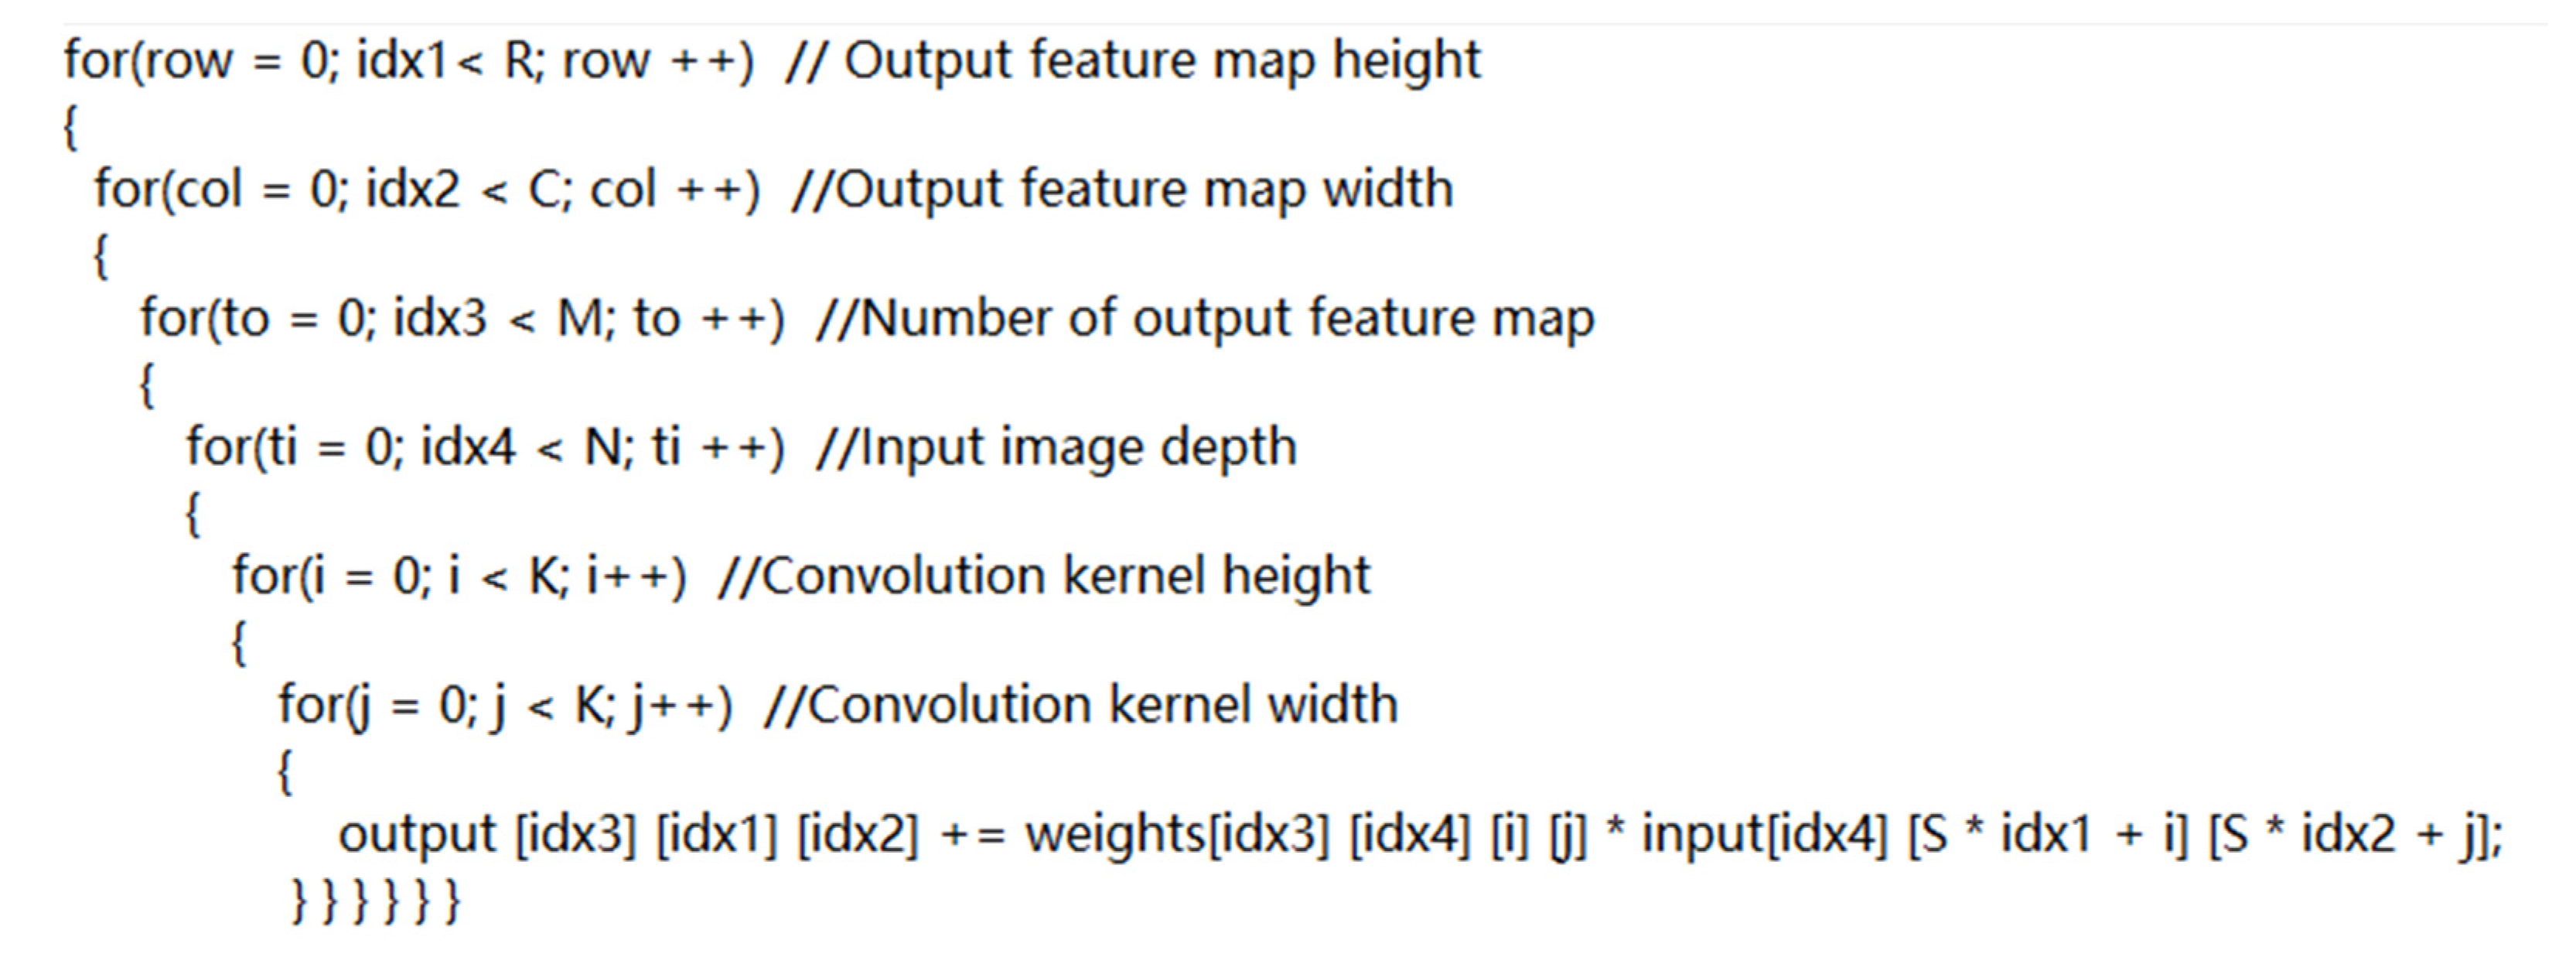
Because the convolution layer is the module with the most significant computation requirement in a CNN, the convolutional layer function is taken as an example for analysis. To increase the calculation speed of the CNN operation, we need to make use of the FPGA features and improve the parallelism of the computing. Unrolled loops make multiple independent operations rather than a single collection of operations [
28]. Loops in the C/C++ functions are kept rolled by default. When loops are rolled, synthesis makes the logic for one iteration of the loop, and the RTL design executes this logic for each iteration of the loop in sequence. A loop is completed for some of the iterations particularized by the loop initiation variable. The UNROLL pragma converts loops by making multiple duplicates of the loop body in the register transfer level (RTL) design, which permits a number or all loop iterations to happen in parallel. The for loop in convolution operation will be unrolled to a certain extent on the condition that sufficient resources are guaranteed.
Data dependencies relationships can be classified into three types [
29]: irrelevant, a certain variable does not operate on any function in an array; independent, if the array is completely separable along a loop dimension of a variable, that dimension is said to be independent of the array; dependent, if an array is indivisible along a loop dimension, that dimension is said to depend on the array.
Table 2 is shown the data dependencies relationship of
Figure 8. The loop dimensions of “Number of output feature map” and “Input image depth” are chosen for unrolling.
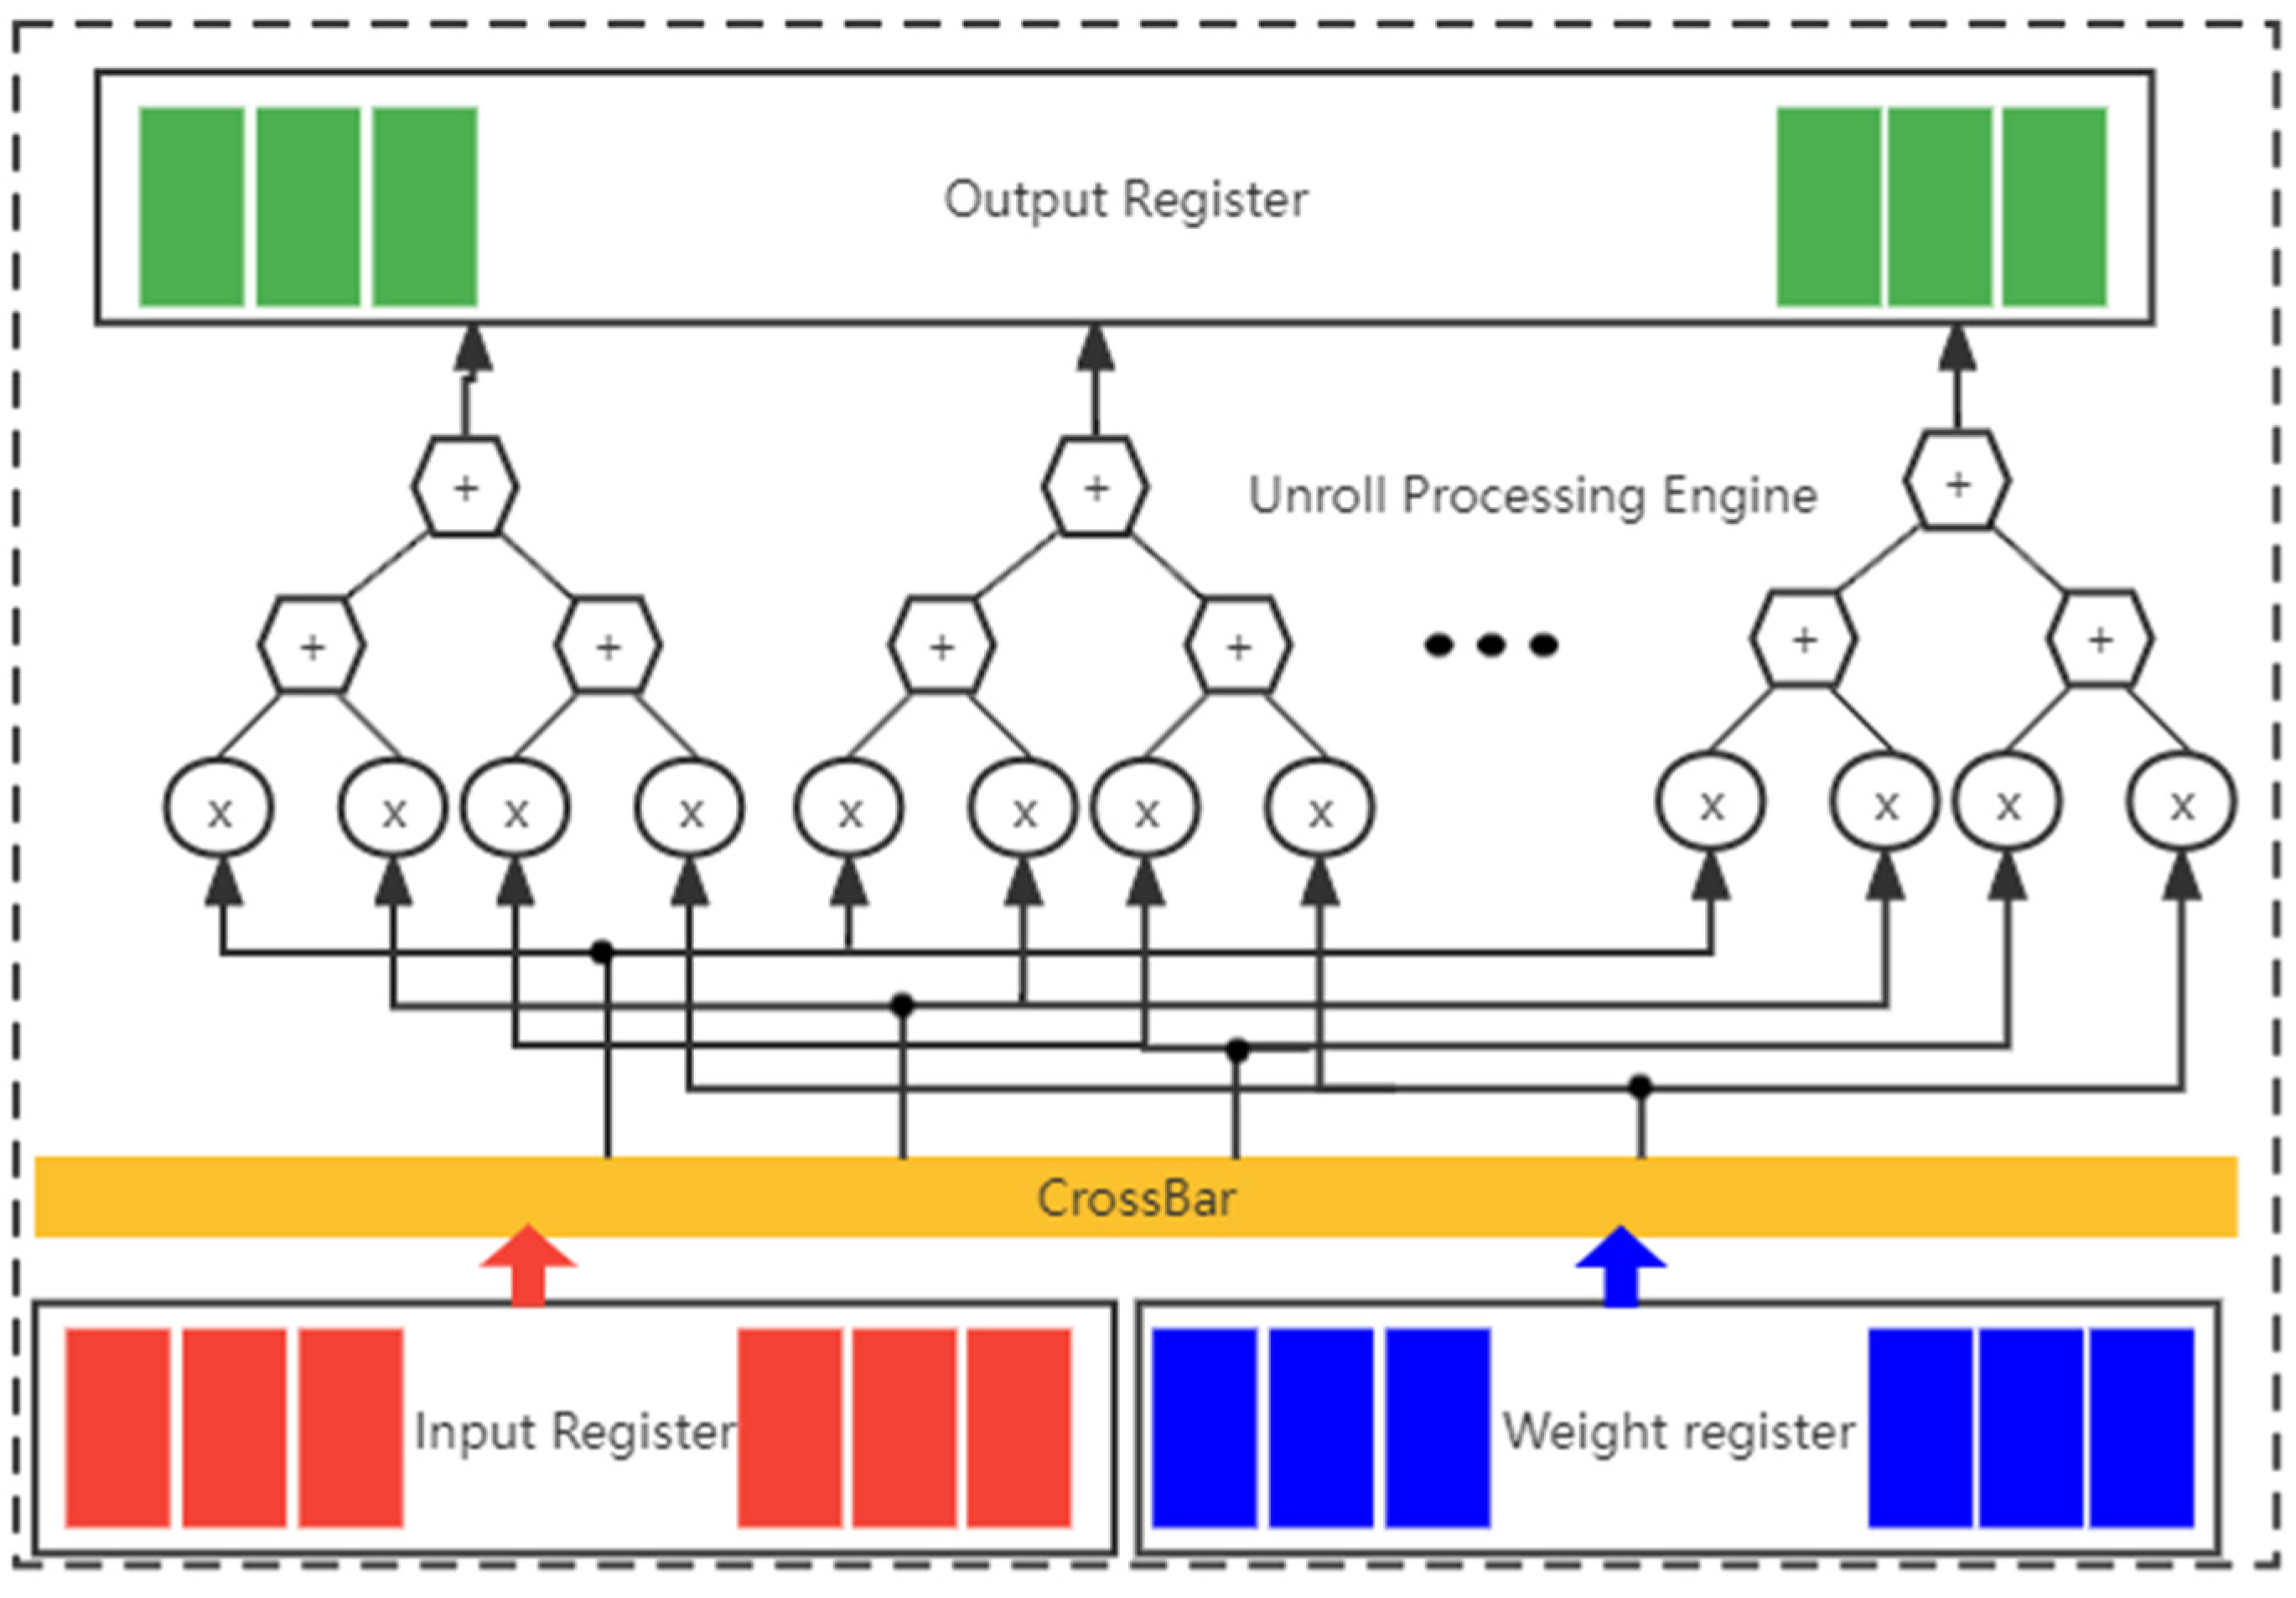
Figure 9 presents a block of the convolutional computing function.
Table 3 shows the comparison of logical resource usage. A digital signal processing logic slice known as a DSP48E can be found on specific FPGA device generations. This slice can be used to carry out a variety of calculations, such as multiply-accumulators, multiply-adders, and one- or n-step counters. In this paper, most of them are used as multiply-accumulators for convolution operations.
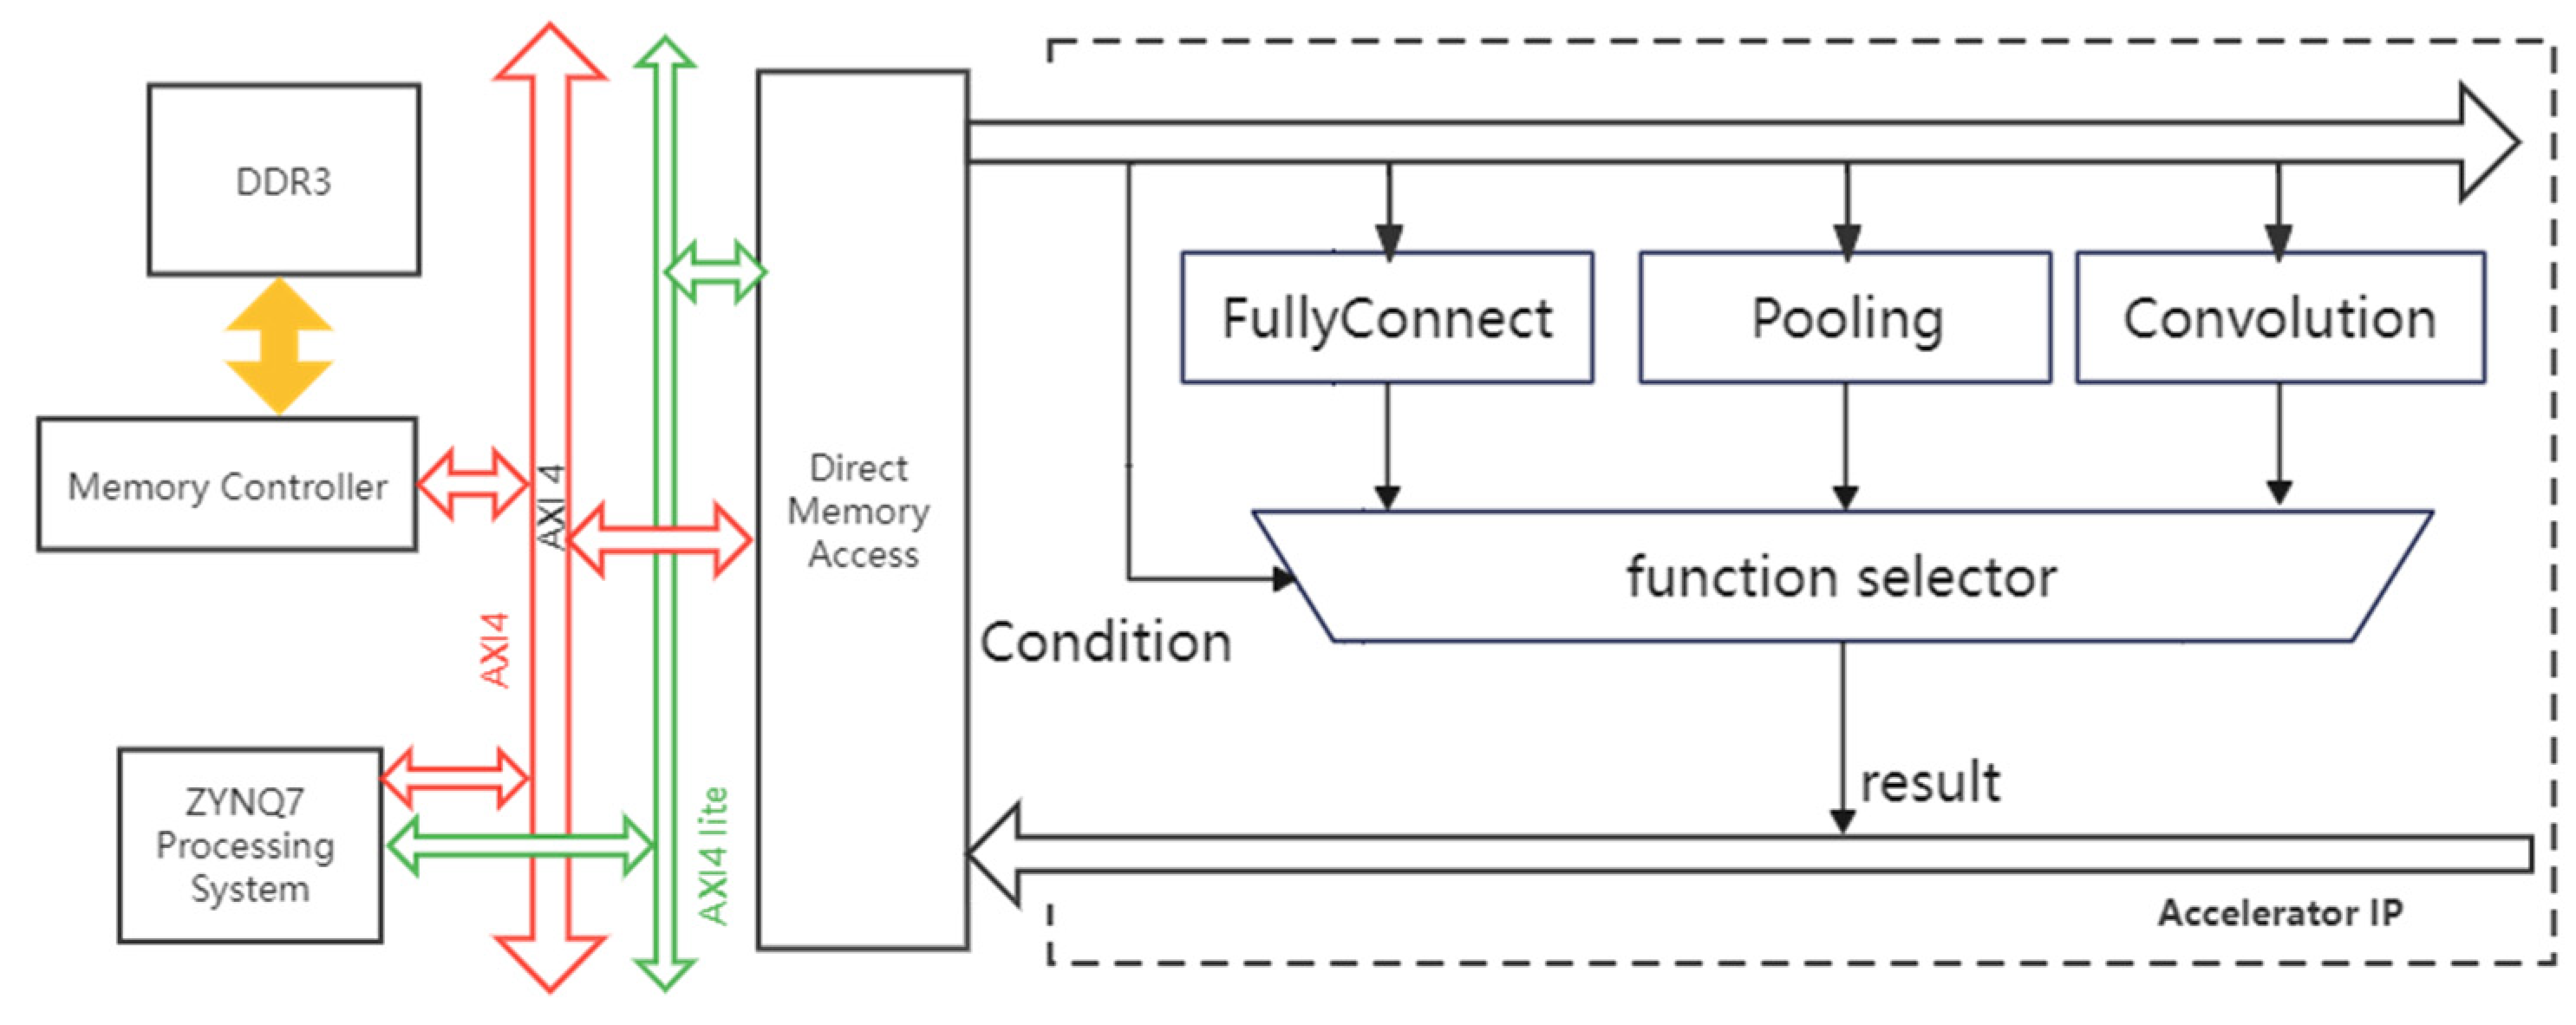
The PL system design is shown in
Figure 10. We combined the block of convolution, pooling, and fully connection functions into one IP. The system control signal is communicated via the AXI4-Lite Bus line, and the AXI4 bus is used to transfer data. The IP functions for convolution or polling are called by Processing Subsystem (PS). The output of the function will be sent to the PS part. The system then calls again one of a function used by the next layer based on the model. The ZYNQ7 processing system IP is the software interface used as a logical connection between PS and PL. The proposed accelerator is an IP on the AXI4 bus. It interacts with the Direct Memory Access IP and receives instructions and control signals from the ZYNQ7 processing system. Through the AXI4 bus, Direct Memory Access can access DDR3 memory.
This design aims to build a configurable CNN hardware accelerator that can accommodate the needs of respective models. The accelerator structure can be modified as needed, such as the window size, the arrangement of the network’s layers, and the number of layers.
The Batch normalization (BN) layer is responsible for improving generalization capabilities. In inference, the convolutional layer can be fused with the BN layer to reduce many computational and developmental difficulties, as specified in [
30].
The above CNN models are more straightforward in structure than CNNs such as AlexNet and VGG 16. They already include the essential components of CNN. Developers can edit different CNN frameworks via software on ARM, and the created IP is still usable without modifying the PL part.
4. Experimental Results and Discussion
All experimental results were obtained from the following devices.
Data Acquisition device: OpenBCI EEG electrode cap with Cyton Biosensing Board amplifiers,
CPU: Intel Core i5-7300HQ, dual-core ARM Cortex-A9 on PYNQ-Z2 board,
GPU: GeForce GTX 1050Ti,
FPGA: XC7Z020-1CLG400C on PYNQ-Z2 board.
Software environment:
Laptop: Window 10 64-bit operating system, 21H2; Vivado 2021.1; Vitis HLS 2021.1; Python 3.9,
PYNQ-Z2: Ubuntu 20.04; Python 3.8; JupyterLab 3.0.16.
EEG signals are segmented into different time windows, and the performance of varying segment sizes (input lengths) on classification results is shown in
Table 4. The tested networks in
Table 4 are all double-layer convolutional networks, as shown in
Table 1. The sampling frequency is 250 Hz. For CWT-CNN, the two and three-second windows have 500-time and 750-time sample points, respectively. The alpha and beta rhythms were extracted. The length of the sample points of frequency is 18. Feature images are different depending on the window size. For example, the feature image for two-second and three-second window sizes are (18, 500) and (18, 750), respectively. The purpose is to test the influence of different window sizes on network feature extraction. The data set is enlarged to further increase the model’s accuracy. Each segment has 50% of data that overlap the previous segment. A five-fold cross-validation was required for random mixing of the training and testing data set before training and inference to improve network generalization ability.
According to
Table 4, it can be seen that the network has a poor classification effect on signals with a length of less than 1 s. The main reason is that the time window is short, and the eye activity information contained in the signals is less conducive to recognition. The classification accuracy is significantly improved if the time length is at least 1 s, indicating that the EEG signal activity stimulated by eye activity is more prominent and easier to identify. Nevertheless, along with the input length being further increased, the average classification accuracy has increased by less than 1%. The explanation is that too much time could not provide more information, leading to improved classification features.
It can be observed that the time window size of 1 s is a decent option as it can discover the action from the EEG signal. It has a reasonable accuracy rate and acceptable latency compared with other time window sizes. Therefore, the following e experiments on PYNQ-Z2 are based on one-second window size.
We downloaded CWT-CNN parameters as the first test network and reconstructed it on PYNQ-Z2. The performance of the proposed CNN inference accelerator on different platforms is shown in
Table 5. According to the Xilinx official website, the ARM cortex-A9 power consumption is estimated. Estimating only GPU or only power consumption with a single inference program is very difficult. Therefore, the power estimation is considered the system’s total energy usage when operating an inference program. All the power estimations are measured by a socket wattmeter. The value displayed by the socket wattmeter is not the actual power consumed by the system. Because the power supply has conversion efficiency, the system’s actual power consumption has to be converted by the power supply conversion efficiency.
Table 5 lists the input power consumption displayed on the socket wattmeter. The evaluation criteria power efficiency is power efficiency = throughput/power = 1/inference time/power.
It can be observed that the accuracy rate of the three different platforms is similar (the gap is 0.23%). The inference accelerator on FPGA has an operating time of approximately 16× faster than that of the accelerator that operates on the ARM core based on experimental data analysis. The performance period of the FPGA is roughly 71× slower than that of the GPU platform. The power consumption of FPGA is 37× lower than that of the GPU. In terms of power efficiency, the FPGA has an excellent advantage over the CPU, which is 14.6× that of the CPU, but only 0.58× of the GPU’s. Since the proposed framework relies heavily on the frequency of memory, the results of each layer of computation are transferred to external storage DDR3, and then, the data are re-read for the next layer calculation. The more complex the CNN model, the greater the influence of memory frequency on inference time. FPGA platforms have price and weight advantages over GPUs.
It is hard to compare our implementations to others since their FPGA-based results are not the same as ours. There are some similarities to be obtained by using logical resources and accuracy. We used the classic LeNet-5 [
31] model to recognize handwritten digits as a comparison.
Table 6 presents a comparison of different predecessors.
It can be seen that our work has a short inference time and meanwhile employs fewer resources in terms of Look-Up Tables and Flip-Flops than the result of [
32]. Compared with [
33], more logical resources are used, and we reach a higher accuracy rate since they were implemented with 12 bits fixed-point numbers. We choose Vivado HLS as the programming language, which is easier to start with than hardware description languages(HDL) (e.g., Verilog). In terms of convenience, their work design is aimed at the specific CNN framework, and the CNN model can be easily modified by using a Python application (e.g., Jupiter Notebook) according to the developer’s needs in our work.
The most significant advantage of our design is the flexibility to modify network models at the software level, which is different from other designs. Under the condition that the resource usage and operation efficiency are not much different from traditional design methods, it can save developers much time in the redesign, synthesis, placement, and routing.
5. Conclusions
In this paper, we first used consumer-grade equipment OpenBCI to collect the EEG signals of open/close eye states. The actual experimental environment is more complicated than the public data set collection experiment, and the collected signals are more likely to be contaminated. Moreover, the subjects participating in the collection experiment are all conducting EEG signal collection experiments for the first time and only undergoing short-term training.
In this study, a lightweight CNN structure was constructed, and the hyperparameters were adjusted according to the actual situation and experimental test. We also compared the classification effect of the algorithm under different sample length conditions. The open/close eyes activities can be distinguished enough based on the 1 s window size. Compared with the RAW-CNN, STFT-CNN, and CWT-CNN methods, the CWT-CNN method shows the advantage in the average classification accuracy and higher accuracy. The CWT-CNN algorithm is worth considering for further research in BCI systems based on the above results.
A CNN inference accelerator framework was introduced and developed on a PYNQ-Z2 board. This framework can conveniently reconfigure the accelerator’s network model to better adapt to the current research environment where deep learning algorithms are updated rapidly. Compared with the ARM processor, FPGA on the PYNQ reached a significant acceleration effect. Using the HLS language and the feature of quickly refactoring the accelerator for lightweight CNN, our result can save developers time and simplify the development process. The results were statistically analyzed and showed that compared with the FPGA chip on the PYNQ, the specified GPU has the advantage in terms of running speed and power efficiency in this paper. However, FPGA still shows more substantial potential for the new generation of machine learning algorithms where deep neural networks come to play massively. This is conducive to the future use of a real-time inference system on portable devices.


