
FPGA-Based Implementation for Real-Time Epileptic EEG Classification Using Hjorth Descriptor and KNN


Abstract
:1. Introduction
2. Material and Methods
2.1. Dataset Description
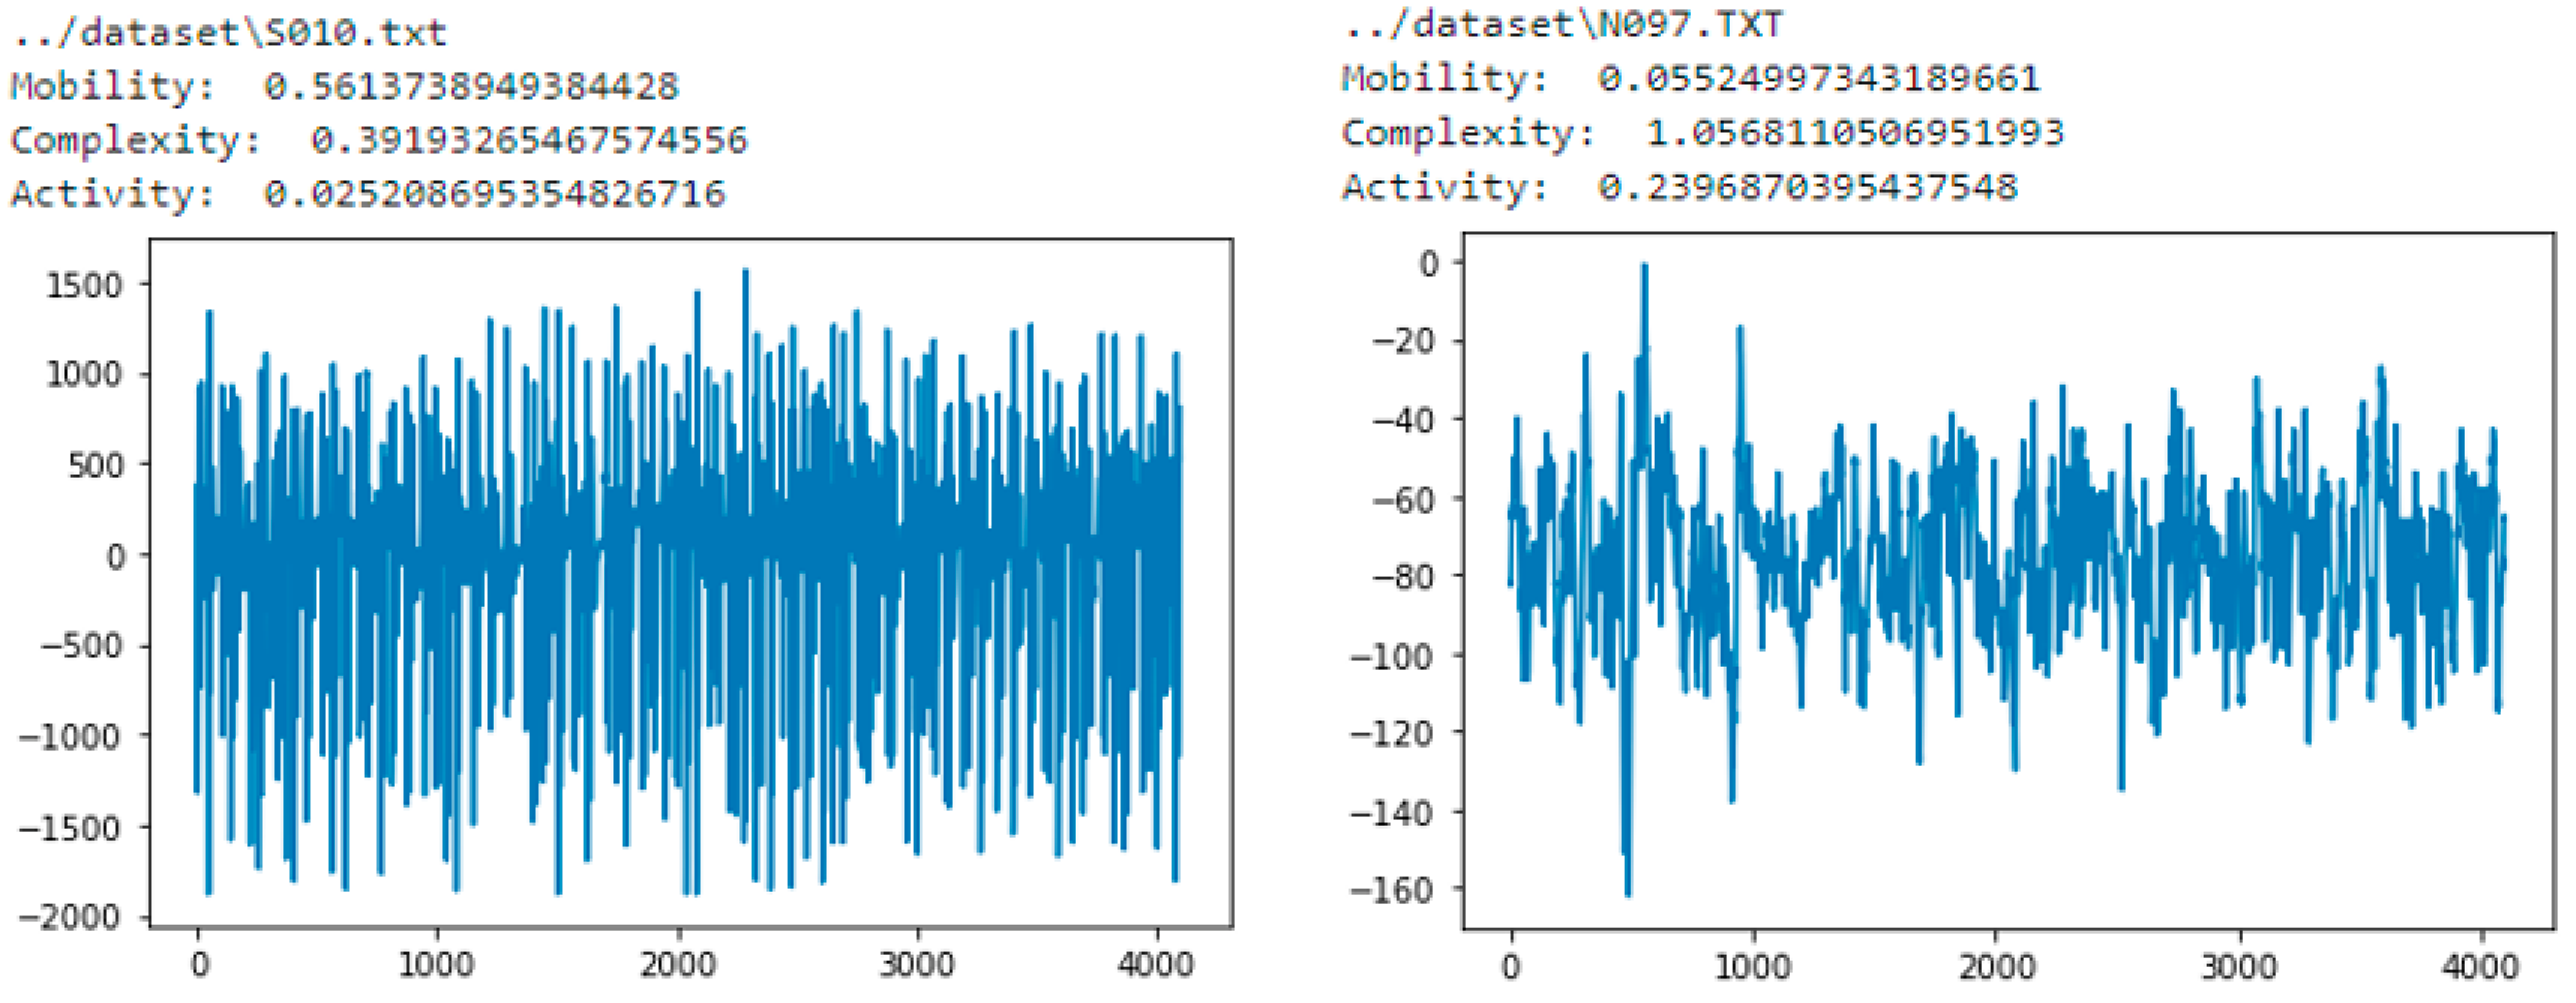
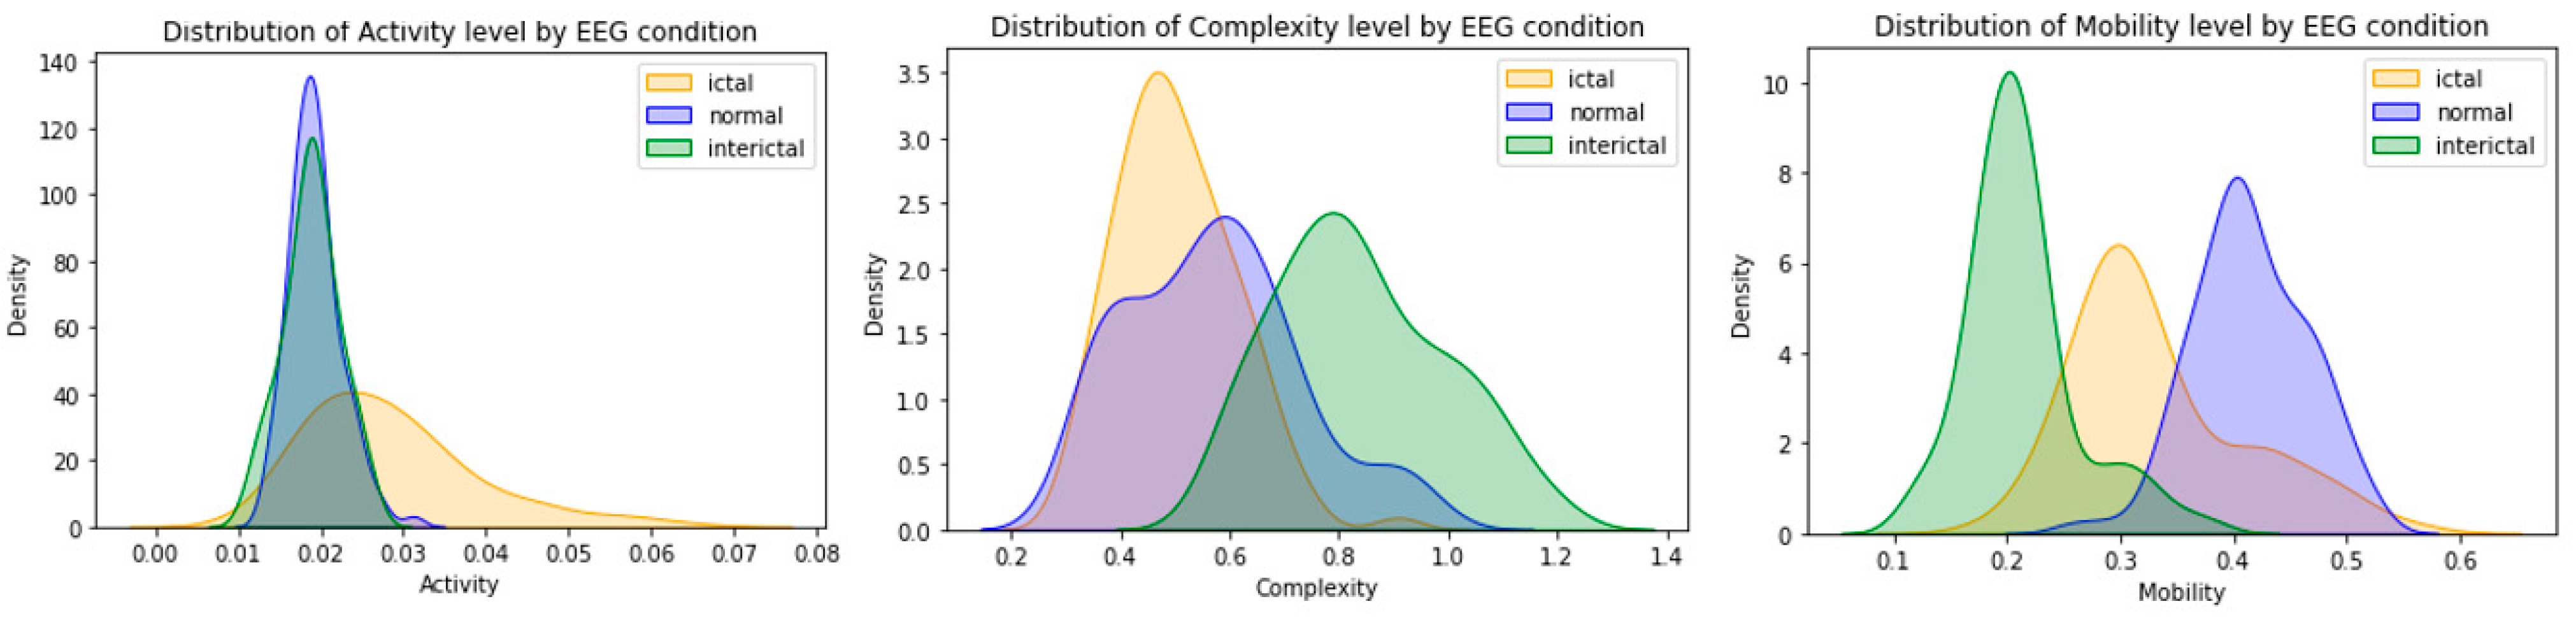
2.2. Feature Extraction
2.3. KNN Classifier
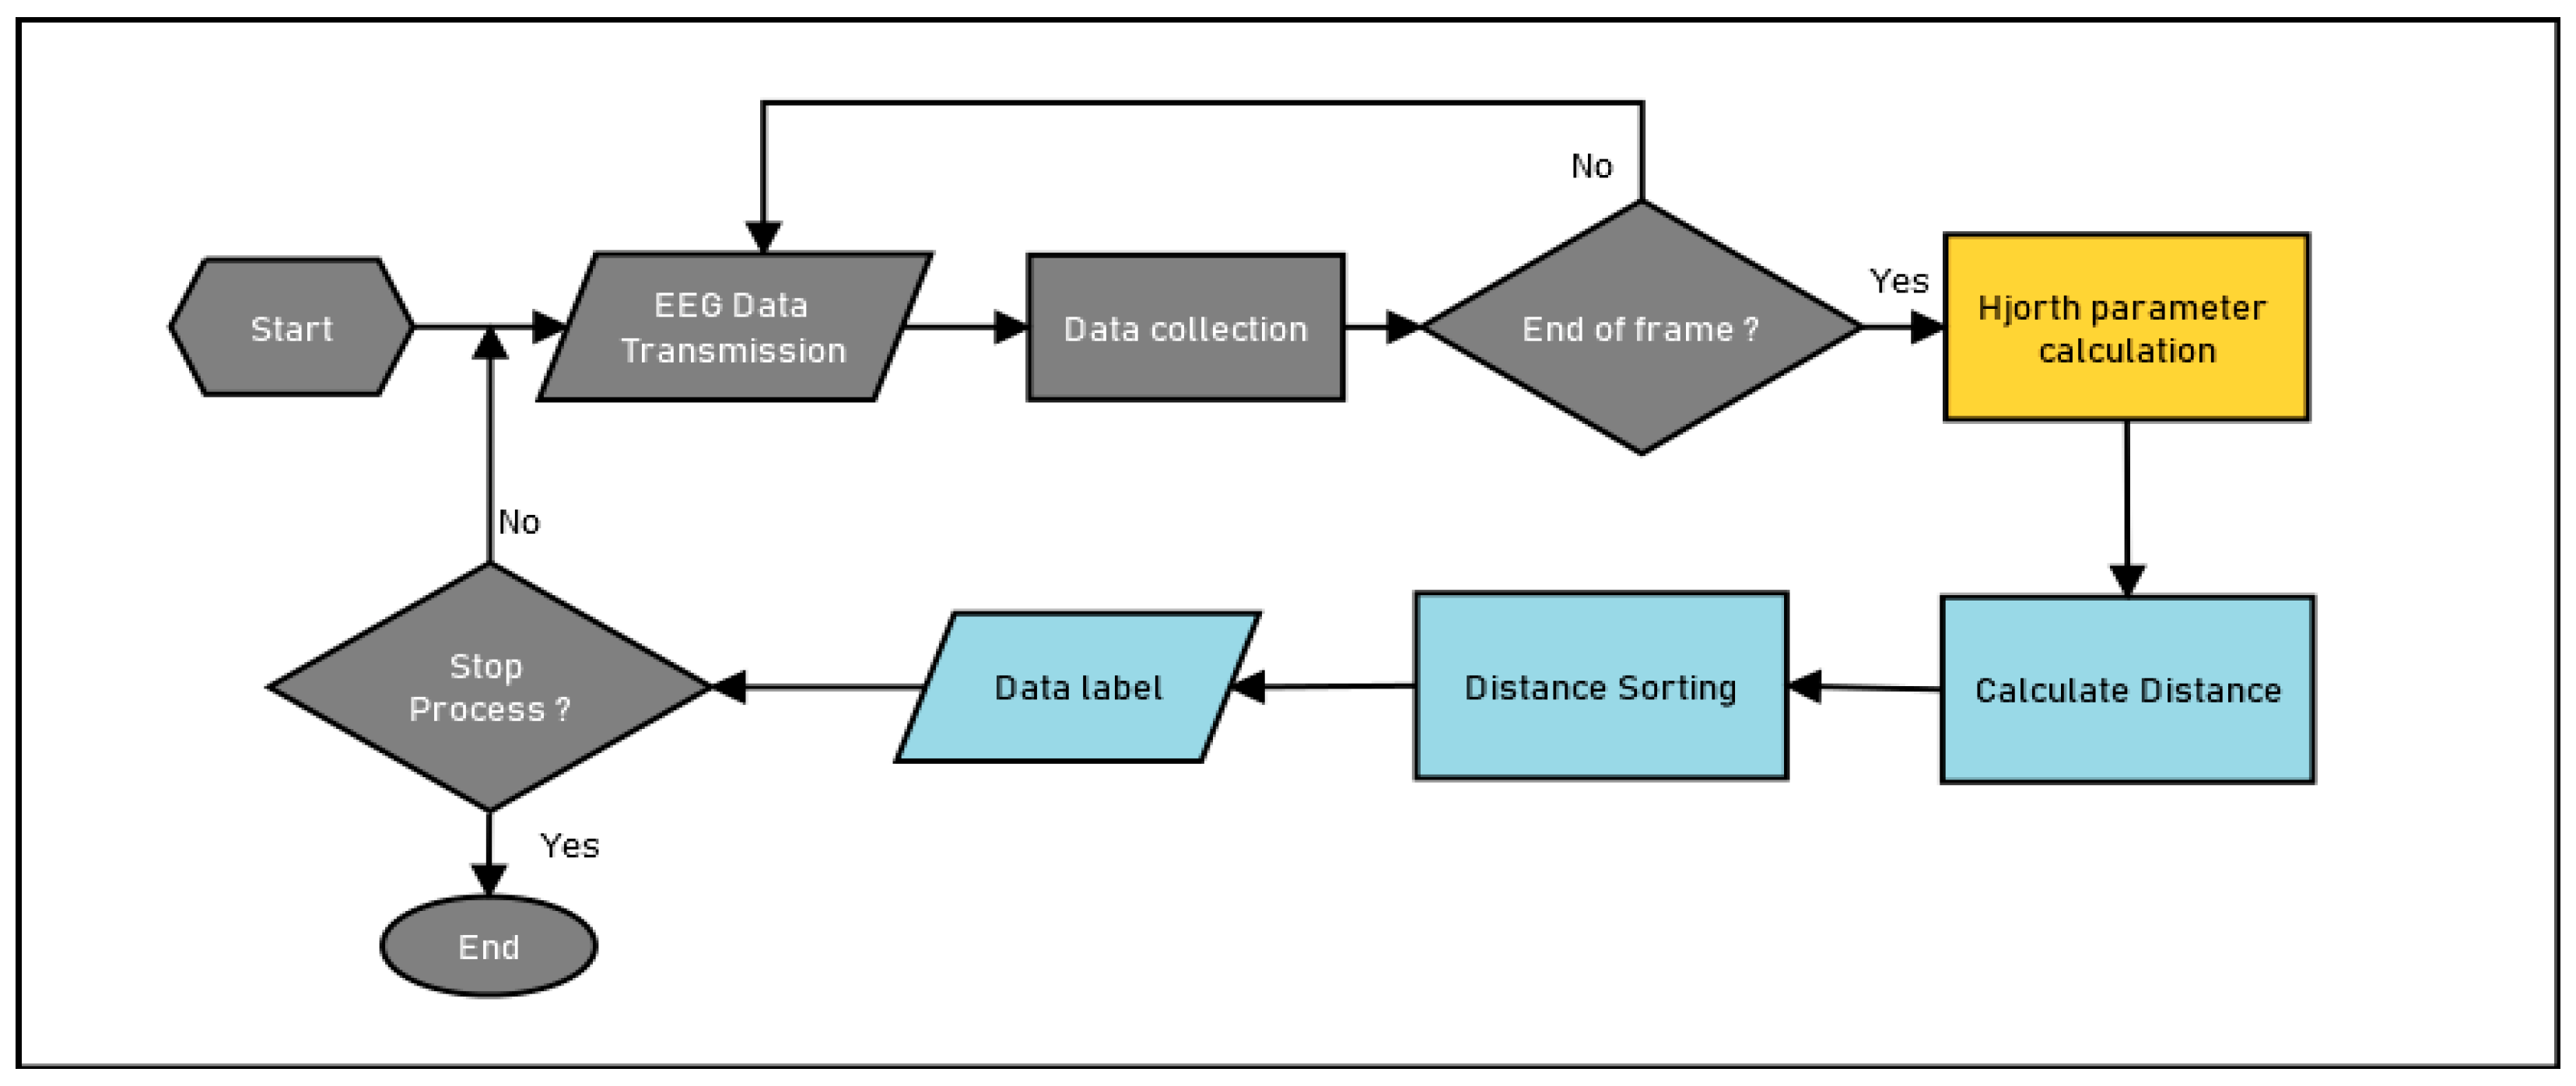
2.4. System Model
3. FPGA Hardware Architecture
3.1. Feature Extraction Datapath Architecture
3.2. KNN Processor Architecture
3.3. Simulation and Verification
4. FPGA Implementation
4.1. Experimental Setup
4.2. Resource Consumption
5. Results and Discussion
5.1. Dataset
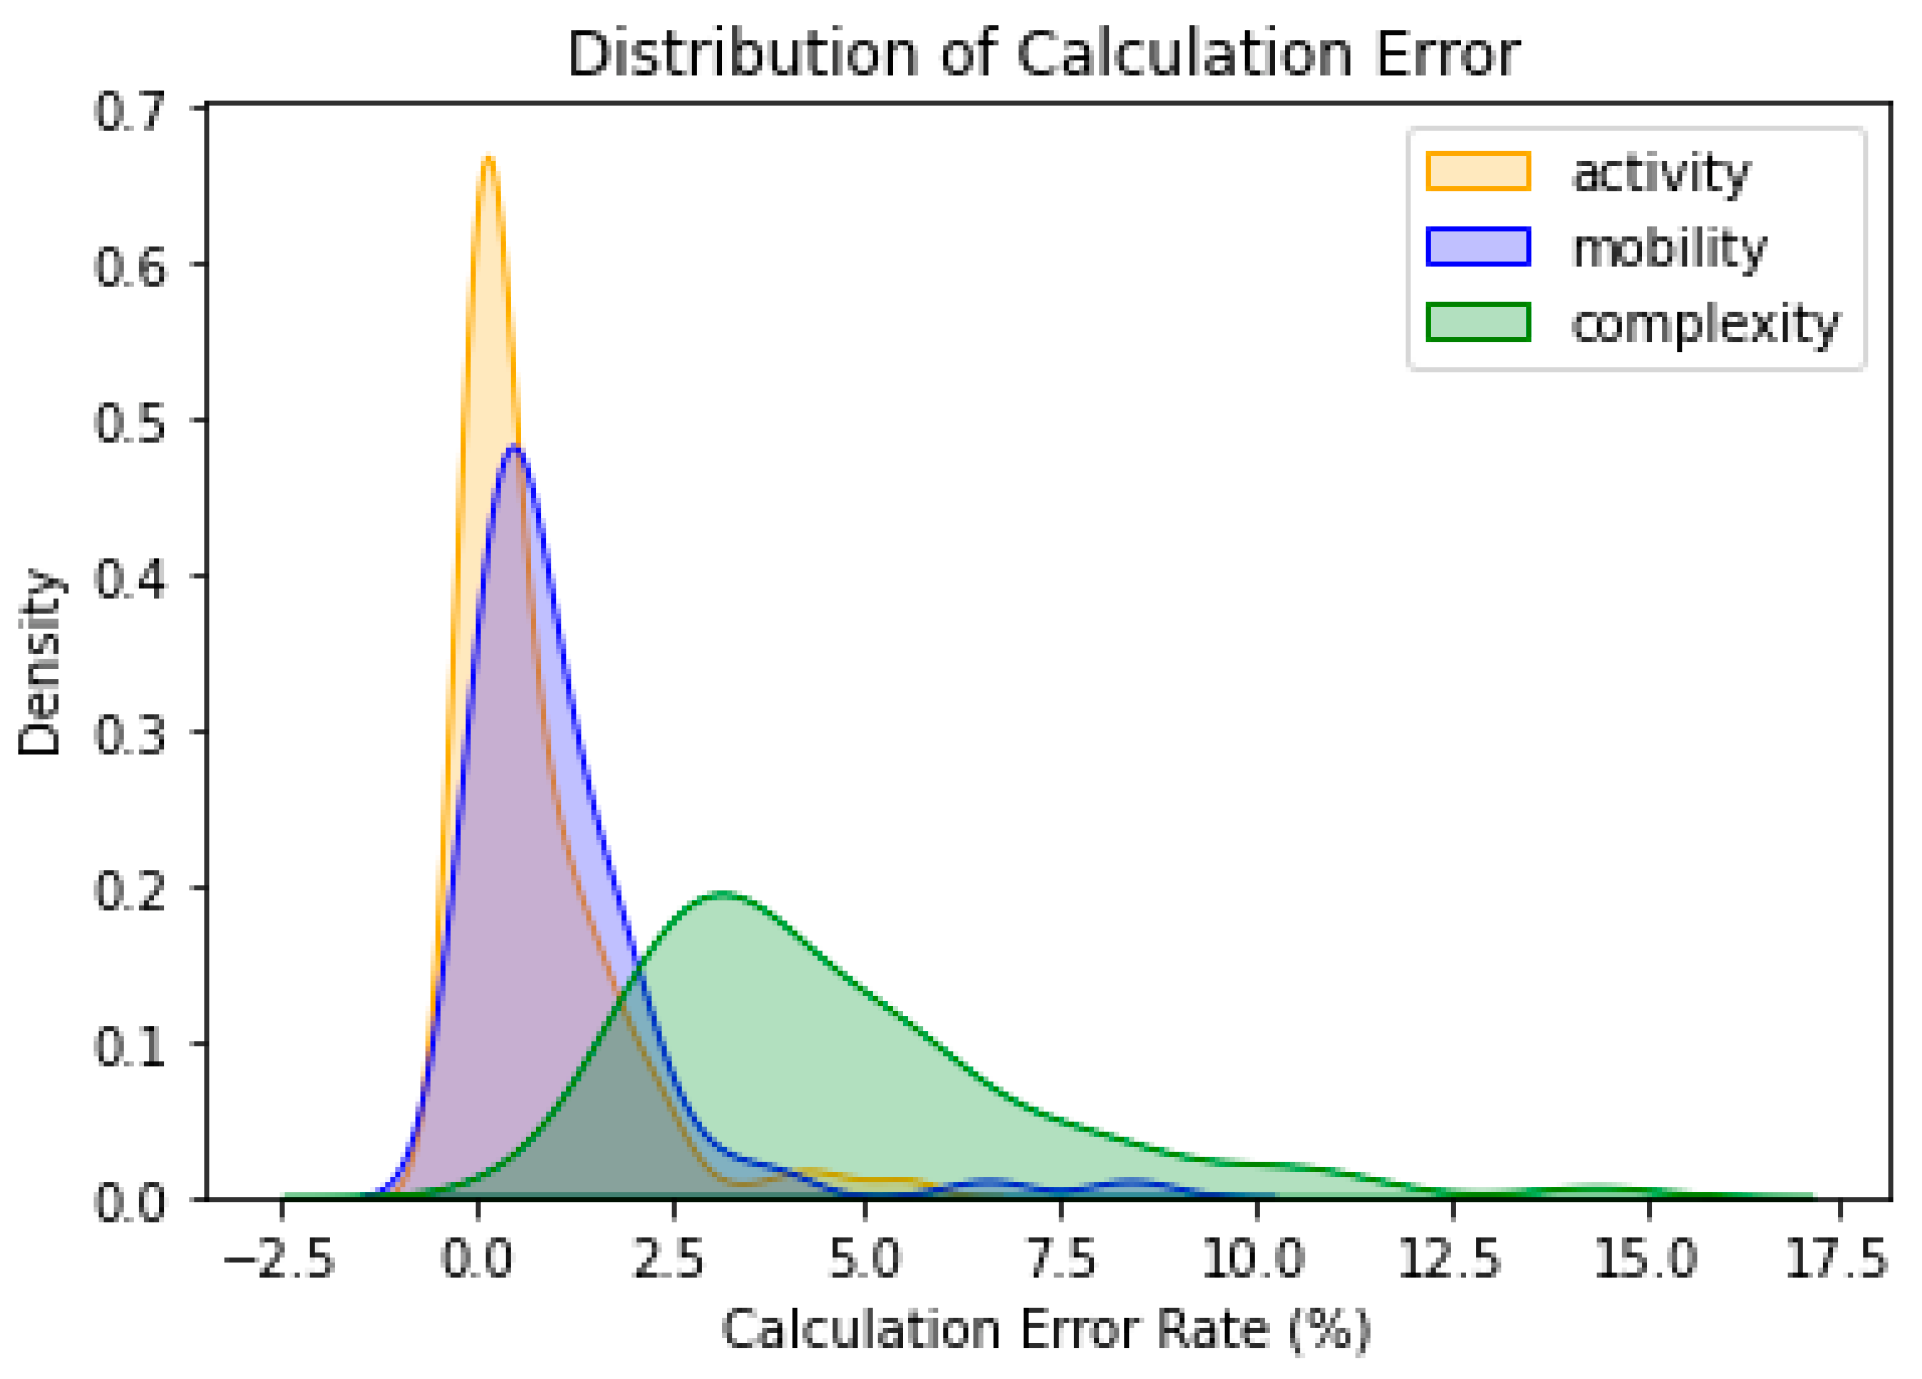
5.2. Comparison of Hjorth Parameter Calculations between VHDL and Python
5.3. Classification Accuracy
5.4. Comparison with Previous Research
6. Conclusions
Author Contributions
Funding
Data Availability Statement
Acknowledgments
Conflicts of Interest
References
- Sharma, R.; Pachori, R.B.; Acharya, U.R. Application of Entropy Measures on Intrinsic Mode Functions for the Automated Identification of Focal Electroencephalogram Signals. Entropy 2015, 17, 669–691. [Google Scholar] [CrossRef]
- Acharya, U.R.; Sree, S.V.; Ang, P.C.A.; Yanti, R.; Suri, J.S. Application of Non-Linear and Wavelet Based Features for the Automated Identification of Epileptic Eeg Signals. Int. J. Neural Syst. 2012, 22, 1250002. [Google Scholar] [CrossRef] [PubMed]
- Diykh, M.; Li, Y.; Wen, P. EEG Sleep Stages Classification Based on Time Domain Features and Structural Graph Similarity. IEEE Trans. Neural Syst. Rehabil. Eng. 2016, 24, 1159–1168. [Google Scholar] [CrossRef] [PubMed]
- B (Venkat), V.P.; Chinara, S. Automatic Classification Methods for Detecting Drowsiness Using Wavelet Packet Transform Extracted Time-Domain Features from Single-Channel EEG Signal. J. Neurosci. Methods 2021, 347, 1–22. [Google Scholar] [CrossRef] [PubMed]
- Singh, P.; Pachori, R.B. Classification of Focal and Nonfocal EEG Signals Using Features Derived from Fourier-Based Rhythms. J. Mech. Med. Biol. 2017, 17, 1740002. [Google Scholar] [CrossRef]
- Bhattacharyya, A.; Gupta, V.; Pachori, R.B. Automated Identification of Epileptic Seizure EEG Signals Using Empirical Wavelet Transform Based Hilbert Marginal Spectrum. In Proceedings of the International Conference on Digital Signal Processing, DSP, London, UK, 23–25 August 2017; pp. 1–5. [Google Scholar]
- Fu, K.; Qu, J.; Chai, Y.; Zou, T. Hilbert Marginal Spectrum Analysis for Automatic Seizure Detection in EEG Signals. Biomed. Signal Process. Control 2015, 18, 179–185. [Google Scholar] [CrossRef]
- Kiymik, M.K.; Güler, I.; Dizibüyük, A.; Akin, M. Comparison of STFT and Wavelet Transform Methods in Determining Epileptic Seizure Activity in EEG Signals for Real-Time Application. Comput. Biol. Med. 2005, 35, 603–616. [Google Scholar] [CrossRef]
- Lu, Y.; Jiang, H.; Liu, W. Classification of EEG Signal by STFT-CNN Framework: Identification of Right-/Left-Hand Motor Imagination in BCI Systems. In Proceedings of the 7th International Conference on Computer Engineering and Networks, Shanghai, China, 22–23 July 2017; pp. 1–8. [Google Scholar]
- Ambati, R.; Raja, S.; Al-Hameed, M.; John, T.; Arjoune, Y.; Shekhar, R. Neuromorphic Architecture Accelerated Automated Seizure Detection in Multi-Channel Scalp EEG. Sensors 2022, 22, 1852. [Google Scholar] [CrossRef]
- Hussain, L.; Saeed, S.; Awan, I.A.; Idris, A. Multiscaled Complexity Analysis of EEG Epileptic Seizure Using Entropy-Based Techniques. Arch. Neurosci. 2018, 5, e61161. [Google Scholar] [CrossRef]
- Wijayanto, I.; Hartanto, R.; Nugroho, H.A. Comparison of Empirical Mode Decomposition and Coarse-Grained Procedure for Detecting Pre-Ictal and Ictal Condition in Electroencephalography Signal. Inform. Med. Unlocked 2020, 19, 100325. [Google Scholar] [CrossRef]
- Silalahi, D.K.; Rizal, A.; Rahmawati, D.; Sri, B. Epileptic Seizure Detection Using Multidistance Signal Level Difference Fractal Dimension and Support Vector Machine. J. Theor. Appl. Inf. Technol. 2021, 99, 909–920. [Google Scholar]
- Sundaram, K.; Marichamy; Pradeepa. FPGA Based Filters for EEG Pre-Processing. In Proceedings of the 2016 2nd International Conference on Science Technology Engineering and Management, ICONSTEM 2016, Chennai, India, 30–31 March 2016; pp. 572–576. [Google Scholar]
- Wöhrle, H.; Tabie, M.; Kim, S.K.; Kirchner, F.; Kirchner, E.A. A Hybrid FPGA-Based System for EEG- and EMG-Based Online Movement Prediction. Sensors 2017, 17, 1552. [Google Scholar] [CrossRef]
- Mahabub, A. Design and Implementation of Cost-Effective IIR Filter for EEG Signal on FPGA. Aust. J. Electr. Electron. Eng. 2020, 17, 83–91. [Google Scholar] [CrossRef]
- Sarić, R.; Jokić, D.; Beganović, N.; Pokvić, L.G.; Badnjević, A. FPGA-Based Real-Time Epileptic Seizure Classification Using Artificial Neural Network. Biomed. Signal Process. Control 2020, 62, 102106. [Google Scholar] [CrossRef]
- Jose, J.P.; Sundaram, M.; Jaffino, G. FPGA Implementation of Epileptic Seizure Detection Using ELM Classifier. In Proceedings of the Sixth International Conference on Bio Signals, Images, and Instrumentation (ICBSII), Chennai, India, 27–28 February 2020; pp. 1–5. [Google Scholar]
- Sahani, M.; Rout, S.K.; Dash, P.K. FPGA Implementation of Epileptic Seizure Detection Using Semisupervised Reduced Deep Convolutional Neural Network. Appl. Soft Comput. 2021, 110, 107639. [Google Scholar] [CrossRef]
- Hjorth, B. EEG Analysis Based on Time Domain Properties. Clin. Neurophysiol. 1970, 29, 306–310. [Google Scholar] [CrossRef]
- Andrzejak, R.G.; Lehnertz, K.; Mormann, F.; Rieke, C.; David, P.; Elger, C.E. Indications of Nonlinear Deterministic and Finite-Dimensional Structures in Time Series of Brain Electrical Activity: Dependence on Recording Region and Brain State. Phys. Rev. E 2001, 64, 061907. [Google Scholar] [CrossRef]
- Hjorth, B. The Technical Significance of Time Domain Descriptors in EEG Analysis. Clin. Neurophysiol. 1973, 34, 321–325. [Google Scholar] [CrossRef]
- Rizal, A.; Hadiyoso, S. ECG Signal Classification Using Hjorth Descriptor. In Proceedings of the 2015 International Conference on Automation, Cognitive Science, Optics, Micro Electro-Mechanical System, and Information Technology (ICACOMIT), Bandung, Indonesia, 29–30 October 2015; pp. 3–6. [Google Scholar]
- Rizal, A.; Hidayat, R.; Nugroho, H.A. Lung Sound Classification Using Hjorth Descriptor Measurement on Wavelet Sub-Bands. J. Inf. Process. Syst. 2019, 15, 1068–1081. [Google Scholar] [CrossRef]
- Mohebbanaaz; Rajani Kumari, L.V.; Padma Sai, Y. Classification of Arrhythmia Beats Using Optimized K-Nearest Neighbor Classifier. In Intelligent Systems; Springer: Singapore, 2021; pp. 349–359. ISBN 9789813360815. [Google Scholar]
- Chen, C.H.; Huang, W.T.; Tan, T.H.; Chang, C.C.; Chang, Y.J. Using K-Nearest Neighbor Classification to Diagnose Abnormal Lung Sounds. Sensors 2015, 15, 13132–13158. [Google Scholar] [CrossRef]
- Ekaputri, C.; Fu’adah, Y.N.; Pratiwi, N.K.; Caecar; Rizal, A.; Sularso, A.N. Drowsiness Detection Based on EEG Signal Using Discrete Wavelet Transform (DWT) and K- Nearest Neighbors (K-NN) Methods. In Proceedings of the 1st International Conference on Electronics, Biomedical Engineering, and Health Informatics, Surabaya, Indonesia, 3–4 November 2021; pp. 487–498, ISBN 9789813369269. [Google Scholar]
- Putra, R.V.W. A Novel Fixed-Point Square Root Algorithm and Its Digital Hardware Design. In Proceedings of the International Conference on ICT for Smart Society, Jakarta, Indoensia, 13–14 June 2013; pp. 7–10. [Google Scholar]
- Verma, D.; Kakkar, N.; Mehan, N. Comparison of Brute-Force and K-D Tree Algorithm. Int. J. Adv. Res. Comput. Commun. Eng. 2014, 3, 5291–5297. [Google Scholar]
- Wijayanto, I.; Rizal, A. Epileptic Seizure Detection in EEG Signal Using EMD and Entropy. J. Electron. Syst. 2019, 9, 44. [Google Scholar] [CrossRef]
- Hidayati, N.; Hermawan, A. K-Nearest Neighbor (K-NN) Algorithm with Euclidean and Manhattan in Classification of Student Graduation. J. Eng. Appl. Technol. 2021, 2, 86–91. [Google Scholar] [CrossRef]
- Yusuf, S.A.A.; Hidayat, R. MFCC Feature Extraction and KNN Classification in ECG Signals. In Proceedings of the 2019 6th International Conference on Information Technology, Computer and Electrical Engineering, ICITACEE 2019, Semarang, Indonesia, 26–27 September 2019; pp. 1–5. [Google Scholar]
- Meddah, K.; Zairi, H.; Bessekri, B.; Cherrih, H.; Kedir-Talha, M. FPGA Implementation of Epileptic Seizure Detection Based on DWT, PCA and Support Vector Machine. In Proceedings of the 2020 2nd International Conference on Embedded and Distributed Systems, EDiS 2020, Oran, Algeria, 3 November 2020; pp. 141–146. [Google Scholar]
- Shah, V.; von Weltin, E.; Lopez, S.; McHugh, J.R.; Veloso, L.; Golmohammadi, M.; Obeid, I.; Picone, J. The Temple University Hospital Seizure Detection Corpus. Front. Neuroinform. 2018, 12, 83. [Google Scholar] [CrossRef]


| Configuration | Correct Result | Accuracy | |||
|---|---|---|---|---|---|
| Ictal | Interictal | Normal | Total | ||
| K = 1 | 30 | 33 | 29 | 92 | 85.18% |
| K = 3 | 30 | 34 | 32 | 96 | 88.89% |
| K = 5 | 31 | 34 | 31 | 96 | 88.89% |
| K = 7 | 31 | 35 | 31 | 97 | 89.81% |
| K = 9 | 31 | 35 | 32 | 98 | 90.74% |
| Reference | Method | Classifier | Dataset | Result |
|---|---|---|---|---|
| Meddah et al., 2020 [33] | DWT, PCA | SVM | Bonn University, 2 classes (O+ Z, S) | 98.67% |
| Jose et al., 2020 [18] | Energy, PSD, spectral entropy of EEG sub-band | ELM | Bonn University, 2 classes (S, Z) | 98.5% |
| Sarić et al., 2020 [17] | Time–frequency features of CWT | MLP-ANN | TUH EEG Corpus, 3 classes (FNS, GNSZ, NS) | 95.14% |
| Sahani et al., 2021 [19] | Optimized VMD | Semi-supervised reduced deep CNN (RDCNN) | Bonn University, 2 classes (S, Z) | 99.37% |
Publisher’s Note: MDPI stays neutral with regard to jurisdictional claims in published maps and institutional affiliations. |
© 2022 by the authors. Licensee MDPI, Basel, Switzerland. This article is an open access article distributed under the terms and conditions of the Creative Commons Attribution (CC BY) license (https://creativecommons.org/licenses/by/4.0/).
Share and Cite
Rizal, A.; Hadiyoso, S.; Ramdani, A.Z. FPGA-Based Implementation for Real-Time Epileptic EEG Classification Using Hjorth Descriptor and KNN. Electronics 2022, 11, 3026. https://doi.org/10.3390/electronics11193026
Rizal A, Hadiyoso S, Ramdani AZ. FPGA-Based Implementation for Real-Time Epileptic EEG Classification Using Hjorth Descriptor and KNN. Electronics. 2022; 11(19):3026. https://doi.org/10.3390/electronics11193026
Chicago/Turabian StyleRizal, Achmad, Sugondo Hadiyoso, and Ahmad Zaky Ramdani. 2022. "FPGA-Based Implementation for Real-Time Epileptic EEG Classification Using Hjorth Descriptor and KNN" Electronics 11, no. 19: 3026. https://doi.org/10.3390/electronics11193026