Abstract
In the electrical power system, the coordination of directional overcurrent protection relays (DOPR) plays a preeminent role in protecting the electrical power system with the help of primary and back up protection to keep the system vigorous and to avoid unnecessary interruption. The coordination between these relays should be pursued at optimal value to minimize the total operating time of all main relays. The coordination of directional overcurrent relay is a highly constrained optimization problem. The DOPR problem has been solved by using a hybridized version of particle swarm optimization (HPSO). The hybridization is achieved by introducing simulated annealing (SA) in original PSO to avoid being trapped in local optima and successfully searching for a global optimum solution. The HPSO has been successfully applied to five case studies. Furthermore, the obtained results outperform the other traditional and state of the art techniques in terms of minimizing the total operating of DOPR and convergence characteristics, and require less computational time to achieve the global optimum solution.
1. Introduction
The electrical power system operates at various voltage levels and its protection is the main concern, be it for lower voltages or high transmission lines. In the absence of a protection system, electrical power systems may suffer various accidents, such as a tree falls or touches with an overhead line which can cause a failure, lightning, which can cause insulation failure, and contamination, which can lead to degradation of isolator performance, ultimately leading to failure. These accidental operating conditions should be avoided for the safety of the electrical equipment as well as for human beings, which are in danger due to exposure to live parts in the event of faults or abnormal operating conditions [1]. In order to analyze the fault as early as possible, coordination of the protection relay along with configuration is an important aspect. Earlier, different methods were used to obtain the overcurrent protection relay configuration [2], and different optimization techniques were deployed to solve various electrical engineering and relay coordination problems [3,4,5,6]. Linear programming was used for the relay coordination in order to obtain the optimal time multiplier setting (TMS) for the relays [7]. Protection of the distribution system is multidirectional due to the connection between the distributor generator (DGs) and the system. The system will not remain unidirectional and can be operated in loops that lead to poor coordination [8]. Recently, many researchers and scholars used different evolutionary algorithms to find the optimal configuration of relay coordination. In [9,10], when firefly algorithm (FA) undergoes to chaos theory, the coordination problem has been solved as well as solution quality being improved. In [11,12], the Differential Evolution (DE) algorithm was used to find the optimal TMS and the starting current of the DOPRs. The DOPR problem was a plan for nonlinear programming, and updated DE was used to optimize the relay configuration. Genetic algorithm (GA) was used in many ways of electrical engineering such as to find out the optimal DOPR coordination problem [13,14], for the simulation of the grounding grids [15]. A hybrid version of GA was used to find the optimal result of DOPR configuration [16], used as the optimal NSGA for DOPR configuration to minimize the operative time of the primary and secondary relays [17]. In [18,19], after changing the configuration of the network, optimum coordination was obtained. Different characteristics of particle swarm optimizations (PSO) to find the optimal DOPRs were presented in [20,21,22]. There are also many techniques used for the optimal coordination of DOPRs and for optimal settings such as pattern search optimization (PS) [23], gray wolf optimization [24], invasive weed optimization (IWO) [25], electromagnetic field optimization (EFO) [26], jaya algorithm [27,28,29], whale optimization [30], and root tree algorithm [31], among others. These optimization methods perform better when the problem is simple, but if the problem is complex or any changes in topologies occur, than these algorithms show abnormalities such as more computational and convergence time [16].
In addition, premature convergence, longer computation time, initial solution sensitivity and large difference in speed have been the serious drawbacks in most evolutionary optimization techniques [32]. Metaheuristics has been presented to overcome these drawbacks but the problem of premature convergence persists. The premature convergence easily caught metaheuristics to a local optimum. In order to diminish the problem of premature convergence, the hybridization of a swarm-based algorithm has been proposed [33,34]. Hybrid algorithms have been reported in the literature to produce better results compared to conventional optimizations or heuristics alone, as hybrid GA combining GA with LP offers faster fusion and better results compared to conventional GAs [35]. SA is a metaheuristic that has high local optima search ability [36], making it suitable for hybridization with swarm-based optimization algorithms. The authors in [37] used the hybridized PSO algorithm, implemented it using objective function, and found that hybrid PSO showed astonishing results compared to conventional PSO.
In this paper, the optimal coordination of DOPRs was determined by a hybrid version of particle swarm optimization, namely as HPSO deployed in a multi-loop power system. The hybridization is achieved by introducing simulated annealing (SA) in original PSO to avoid being trapped in local optima and to successfully search for a global optimum solution. The coordination of primary directional overcurrent relay is known to be an operational time-intensive system, owing to the non-optimal execution of TMS. Indeed, the industry always focuses on optimizing the directional overcurrent relay coordination in order to the avoid mal-operation and mal-functioning of the system during troubleshooting, which ultimately will ensure the minimum baring to the healthy portion of the system. This paper is organized as follows: Section 2 presents the DOPR problem formulation. The HPSO algorithm is introduced in Section 3. Section 4 deals with the result section of different case studies. A comprehensive comparison of results is shown in Section 5 and finally, a conclusion is presented in Section 6.
2. Problem Formulating of DOPR
The DOPR coordination problem in a distribution system is formulated as an optimization problem where it is necessary to minimize the sum of the operating times of the system relays for different points of failure [38,39]. The purpose of DOPRs coordination is to detect the failure in a minimum time. To achieve this goal, Plug Setting (PS) and Time Multiplier Setting (TMS) in relay coordination must be carried out. The PS of the relay is fixed while TMS of the relay is linear function which is also expressed as linear programing. The goal is to minimize the total execution time of all primary DOPRs while meeting various constraints defined by an objective function (OF) in Equation (1).
where: m is the number of relays, is the weight, and is the operating time of the primary relay. The IEC standards are given in Equation (2).
where: is the relay operating time, TMS is the time multiplier setting, and α and k are the constant parameters that define the relay characteristics and their values, which are α = 0.14 and k = 0.02 for the normal inverse type relay. is the fault current flowing through the relays, is the pickup current and i denotes the relay. In general, fault current divided by pickup is the plug setting Multiplier shown in Equation (3).
.
Substituting Equation (3) in Equation (2) yields:
The coordination of Equation (4) illustrates that TMS is continuous and the rest of the parameters are constantly expressed as linear programming. Then, we can modify the equation as:
where:
Hence, the minimum objective function is given by:
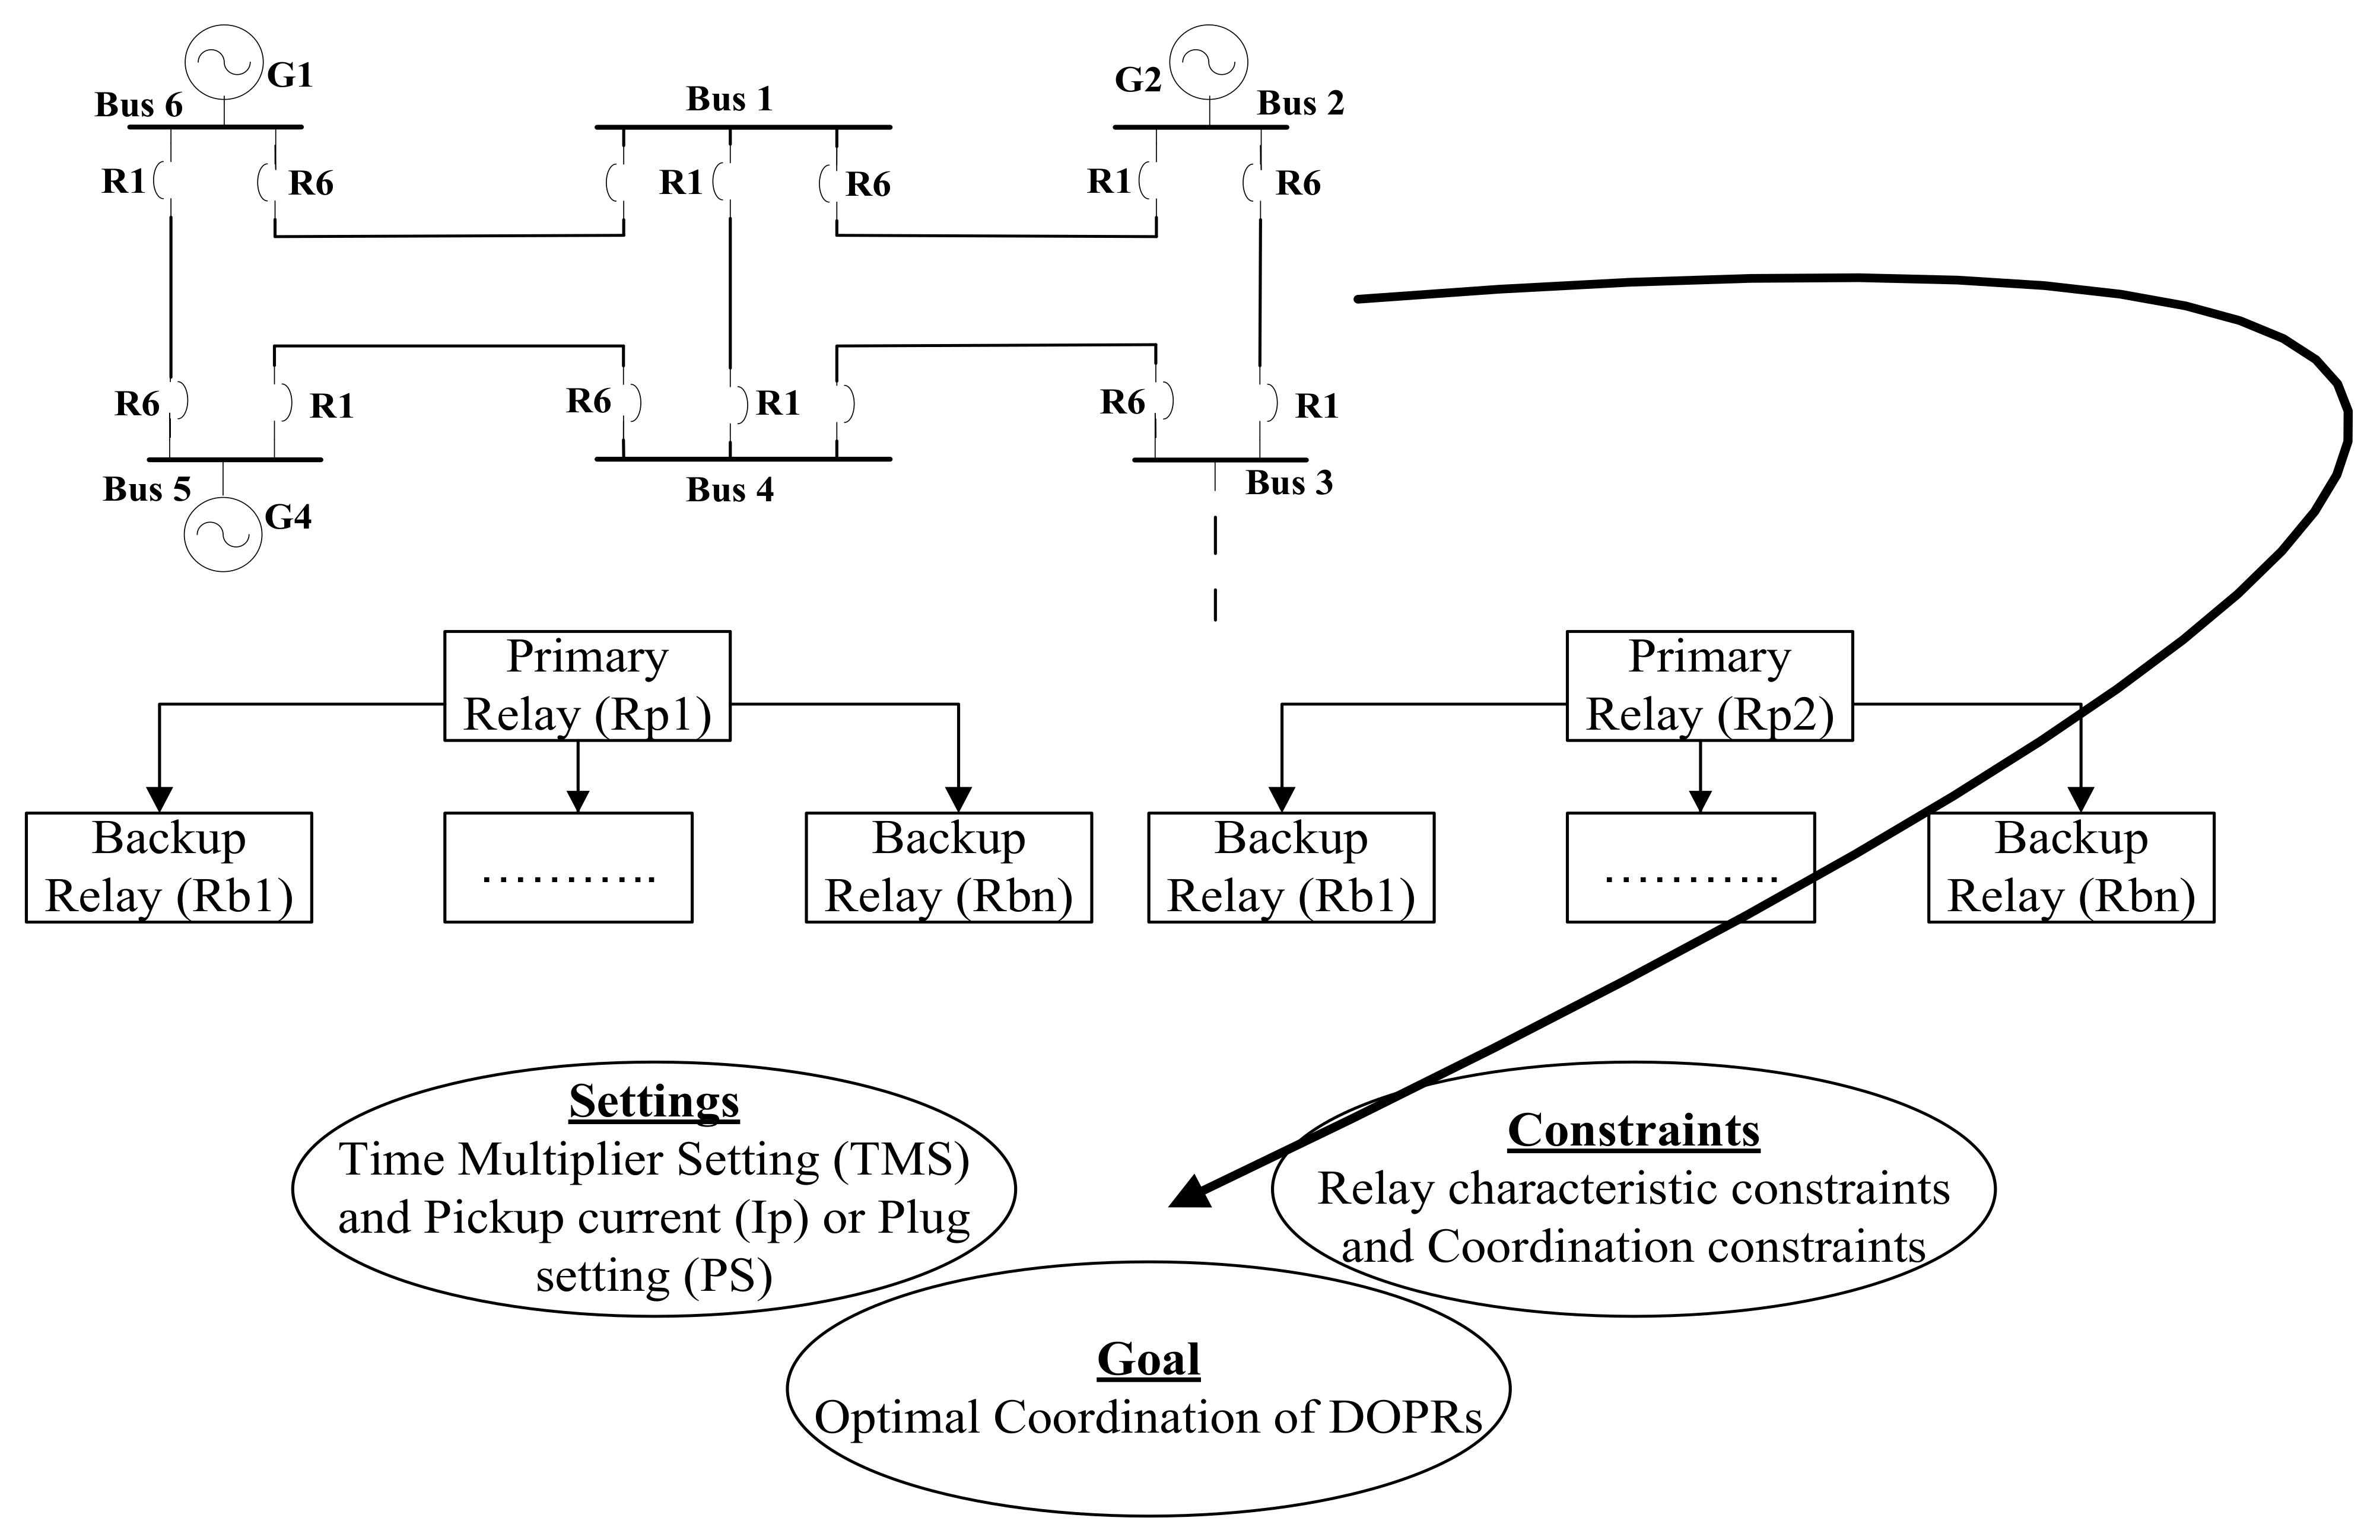
Figure 1 shows the DOPR coordination scheme in a power supply system which consists of pickup current (), plug setting multiplier (PSM), time multiplier setting (TMS), and current transfer ratio (CTR), etc. The current at which the relay starts its operation is expressed as the relay pickup current (). The plug setting multiplier (PSM) is the ratio between the fault current () and the pickup current (). The pickup current is the multiple of the rated secondary current of the CT and the current setting called the current transfer ratio (CTR). To adjust the operating time in the relay, it is necessary to adjust the setting of the time multiplier (TMS) [30]. The constraints of the DOPR are the coordination constraints and the characteristic constraints and the objective of this research is the optimal coordination of the DOPR.

Figure 1.
Schematic outline for DOPR coordination in an electrical power system.
Formulation of Constraints
The constraints should be imposed because of the restrictions in the operating time of relays, and coordination limitations. The limits of the relay configuration parameters depend upon the limitations and the design of the relay, and their ranges can be expressed mathematically by Equations (8) and (9).
In the relays problem, the focus of research is finding the minimum operating time to trace the fault.
The second type of constraint is a common practice for each primary protection to have its own backup protection to ensure a reliable protection system. The two protection schemes must coordinate together, that is, a predefined coordination time interval (CTI) collapses before the backup scheme kicks in. The CTI includes the difference between the backup relay and the primary relay. The circuit breaker (CB) is the interface between these two to avoid runtime, overshoot time, and an adequate margin of safety. Therefore, the primary relay should operate first as a fault occurs in front of the primary relay and the backup relay is used for the support [32]. This is essential to satisfy the selectivity requirement of the primary and backup relays. The coordination constraint is defined as in Equation (10).
where and are the operating times of the primary and backup relays, respectively. The CTI value could vary from 0.2 to 0.5 s [20], depending on different circumstances and factors.
3. HPSO Algorithm for DOPR Estimation
In this section, hybridization of PSO is achieved by using particle swarm optimization (PSO) with simulated annealing (SA). The PSO algorithm works on the specified objective function and keeps track of the best position of the individual, as well as that of the global, which are denoted as pbest and gbest respectively [40,41]. Personal best or individual best is denoted by pbest while the global best or population best is denoted by gbest here. Each individual in the group moves with a certain velocity that is called the initial velocity. The individual’s new position is updated based on its initial position and velocity. The updated position is called the pbest, and minimum value of this pbest is called the gbest. The PSO steps are kept on repeating until the minimum value is achieved. The initial position of the particle is given by:
where is the maximum bound of the variable and is the minimum bound of the variable, i denotes the iteration number, and is the random number whose value is between 0 and 1. After the first step in Equation (11), the next step is to compute the fitness with a given position computed given by Equation (12).
Since this is the initial step, the best fitness of each individual is denoted by itself.
Since the global best is basically the minimum value from the pbest solution, as shown in Equation (14).
The velocity and position is updated by using Equations (15) and (16) given below.
After updating the velocity and position of each particle in the specified objective function, pbest is achieved and gbest is updated by using Equation (14). By using this method, gbest is calculated iteratively until a stop criterion is met.
Simulated Annealing (SA) was first proposed in 1983 [42], based on the process of annealing in metallurgy. Annealing is a process of heating an object/solution, and after heating, controlled cooling of that solution to alter its properties. SA has miscellaneous applications with a point-to-point-based algorithm. In this technique, a good move is acknowledged while the bad move is acknowledged by a specific pattern to escape from the local optima. Therefore, if the solution is acknowledged, then it is accepted as good move, otherwise, it will go through Equation (18) until it is enabled to escape from the local optima. In the research of HPSO, SA is used to improve the local optimum of the global best solution. New solution is generated from the previous solution of gbest.
The transition of the new solution from the previous solution undergoes the probability shown in Equation (17), where Delta is the difference between the previous solution and the new solution, and T is temperature.
The probability of the minimized goal is accepted from the solutions and those solutions that would not minimize the objective are accepted too based on the following inequality given in Equation (18).
In Equation (18), rand denotes the random number whose value varies from 0 to 1. When starting SA, an initial temperature T0 is set and the cooling factor is defined. If the Delta is less than 0, then it is a good move and local optimum solution is achieved, and if not, then Equation (18) keeps on iterating until it will escape and give the global best solution. The temperature is lowered using a cooling schedule given in Equation (19).
where α is the cooling factor and is the previous temperature.
The flow chart of the proposed HPSO is shown in Figure 2. The purpose of hybridizing PSO with SA is to alleviate the problem of local optimum. The global best obtained by PSO is further processed and evaluated by SA. The results obtained after processing the PSO-SA simulation present an improved solution compared to other state of the art algorithms.
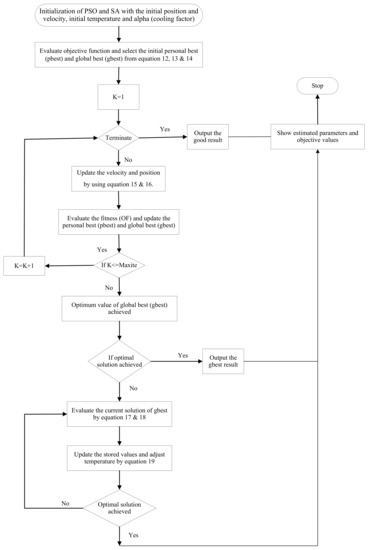
Figure 2.
Flow chart of the proposed HPSO.
4. Simulation Results of Different Cases of DOPR
Simulation results of different cases of DOPR using HPSO are presented in this section. A comparison result of two cases of a single-ended power distribution system, two cases of a multi-loop power distribution system, and one case of an IEEE three-bus system are discussed. Furthermore, the comparison of these results with the techniques mentioned in references [2,9,16,20,43,44] showed that HPSO is better in terms of finding the fault in minimum time than the other state of the art techniques.
4.1. Single-Ended Power Distribution System (Case 1)
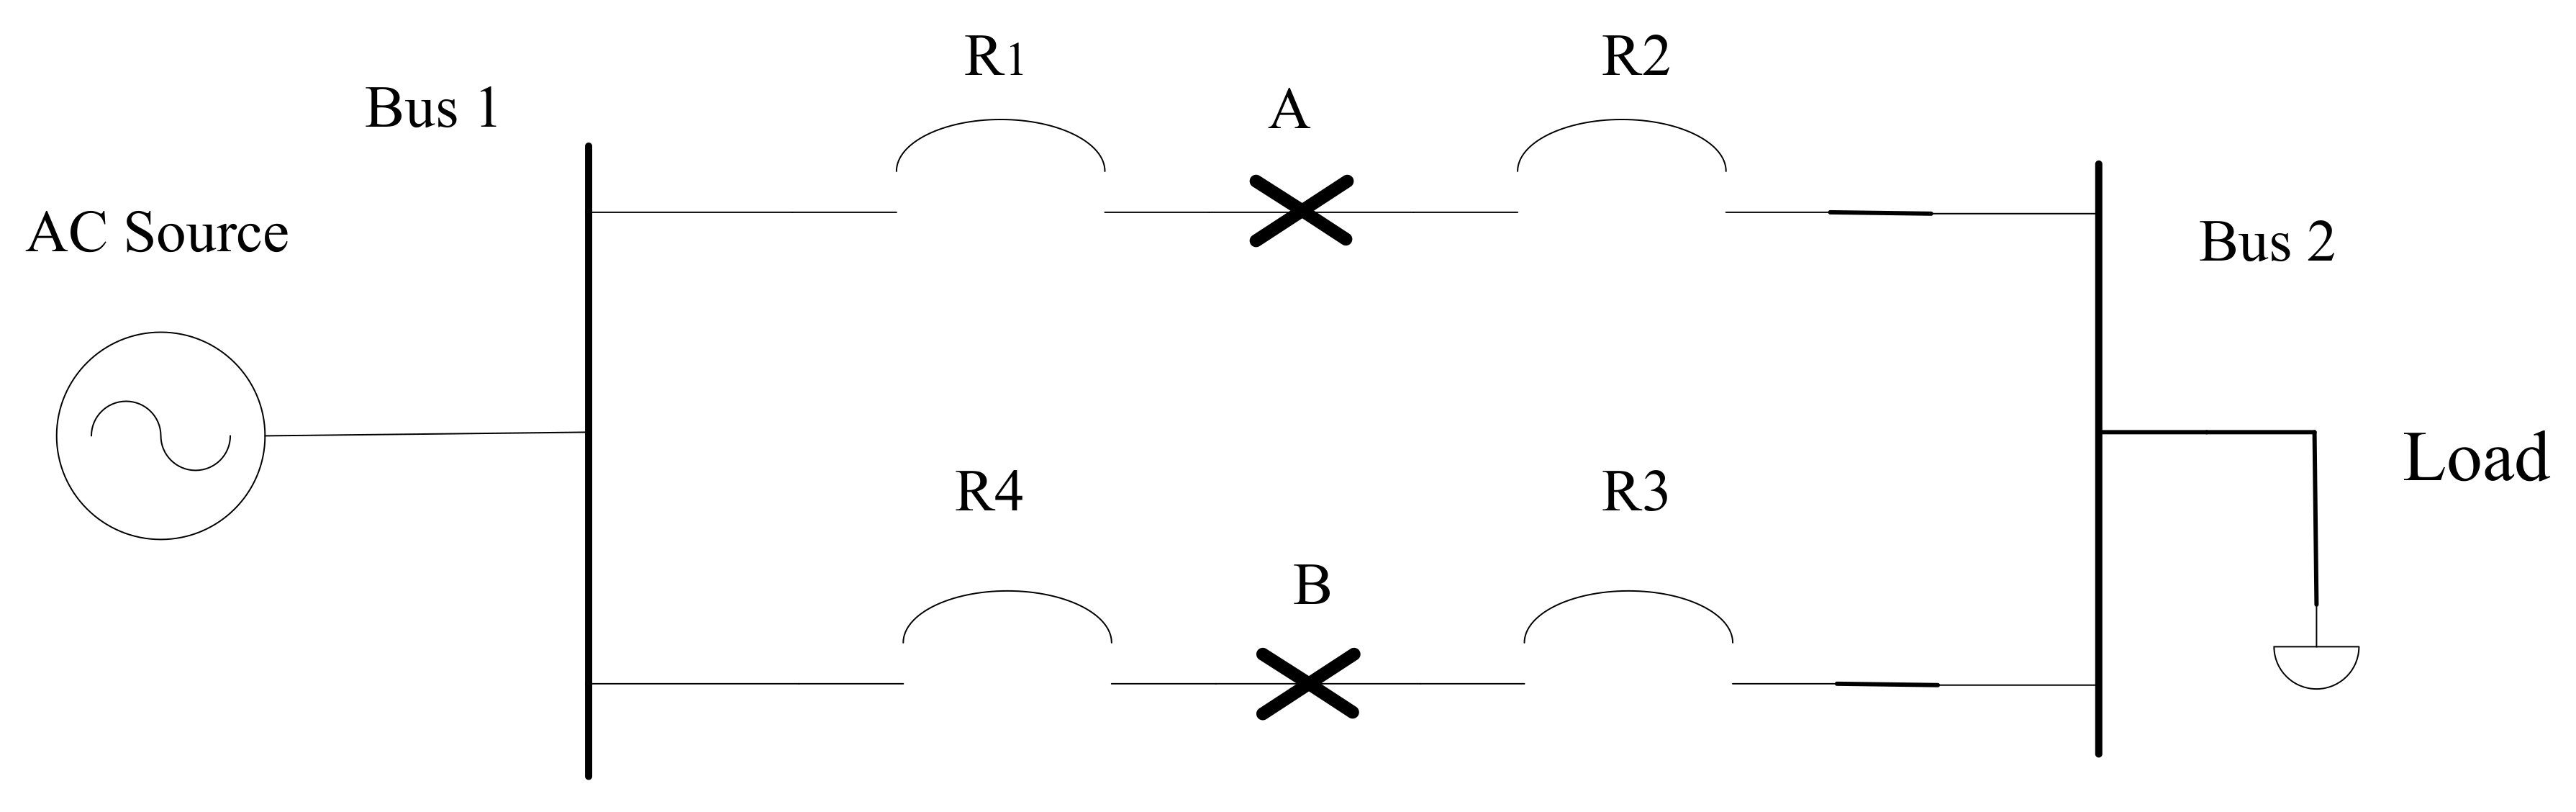
A single-ended power distribution system with four-overcurrent protection relays and two fault points are discussed in this case. Four directional overcurrent relays, R1 to R4, and two fault points, A and B, are shown in Figure 3. It must be noted that relay R1 and R4 can be non-directional but relay R2 and R3 should be directional because these relays are near to load and their direction must be towards the AC source. As discussed before, there is a backup relay for every primary relay, so in order to trace a fault at point A, the primary relay is R2 and the backup relay is R4, and for a fault at point B, the primary relay is R3 and the backup relay is R1. The load current including overload is 600 A, and the maximum fault current is 4000 A. The current transformer (CT) and plug setting (PS) ratios for each relay are shown in Table 1. For each relay, the minimum operating time (MOP) of each relay is considered to be 0.1 s and the CTI is kept at 0.3 s. Table 2 provides the detail of the relay constant and the current through the relays for different faulty points.
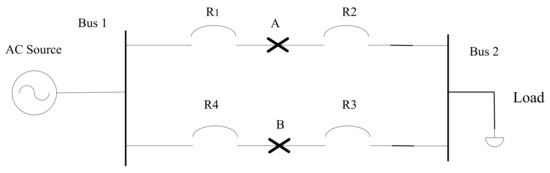
Figure 3.
A single-ended power system with parallel feeders.

Table 1.
Plug settings (PS) and CT ratios of the relays (Case 1).
Table 2.
Calculations of Irelay (current through relay) and αp (constant) (Case 1).
In this case, the number of constraints is six, in which four constraints arise as a result of the limits of the relay operation and two arise as a result of the coordination condition. The TMS range is from 0.025 to 1.1. TMS of all relays are distinguished as , respectively.
From Table 2, the objective function (OF) can be derived as:
The constraints that we obtain within the MOPs from the given relays are:
The minimum limit of TMS is 0.025, which means that the constraints of Equations (22) and (23) could not satisfy the minimum limit. To solve this problem, these constraints can be modified as:
The parameters for the HPSO algorithm are:
The minimum and maximum inertia weights (ω) are 0.4 and 0.9, respectively, the acceleration factor () is 2, the random values () are around [0, 1], the initial temperature (T0) is 1 and the cooling factor (α) is 0.99. In each case study, the number of iterations and the size of the population are 300. All the case studies in this research have been simulated by using the following parameters.
Table 3 shows that the proposed HPSO method works and performs better compared to other evolutionary techniques. Moreover, the HPSO has the ability to carry out a random and large-scale search of particle swarm optimization, and provides a lower total operating time (). The overcurrent relay problem is also found to converge faster and better and the TMS results obtained after convergence satisfy all constraints. The graphical representation of the net gain in total operating time achieved against the other algorithms are shown in Figure 4. The comparative results of the proposed algorithm with a previously developed algorithm demonstrates the superiority and advantages of HPSO over the other state of the art algorithms [20,43,44].
Table 3.
Comparison of the optimized TMS with other techniques (case 1).
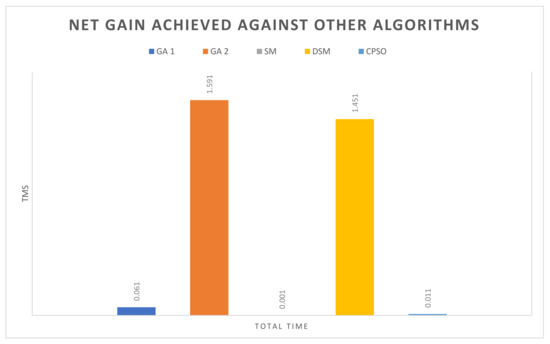
Figure 4.
Comparison analysis of HPSO with other algorithms (Case 1).
These results are obtained using the MATLAB simulation of the objective function (OF) and constraints. The graph of the convergence characteristics of the case 1 is shown in Figure 5, which shows that the convergence is faster and the best value of the objective function (OF) is achieved in fewer iterations.
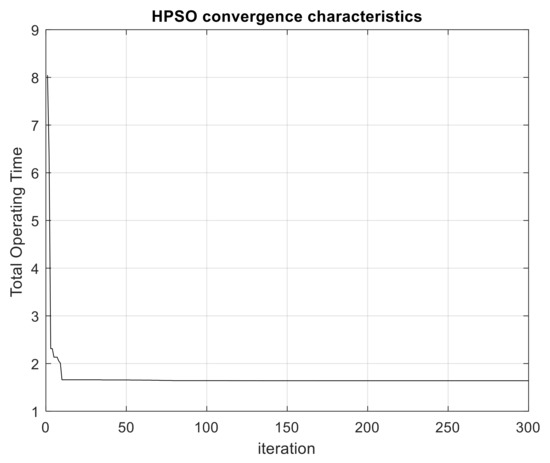
Figure 5.
Convergence characteristic graph (Case 1).
4.2. Single-Ended Parallel Distribution Power System (Case 2)
A single-ended parallel distribution power system with five-overcurrent protection relays and three fault points are discussed in this case. Five directional overcurrent relays R1 to R5 and three fault points A, B and C are shown in Figure 6. The CT ratio and the relay PS of all the relays are assumed to be 300: 1 and 1, respectively. Two fault points in the middle of four relays are A and B. In case of a short circuit at point A, relay R3 will provide backup protection for relay R2, and if closed at point B, relay R1–R4 will provide backup protection, and on failure in C, the backup will be provided by R1, R3–R5. For each relay, the minimum operating time (MOP) is 0.1 s and the CTI is 0.2 s. Table 4 provides the details of the constant and the current through the relays for different faulty points.
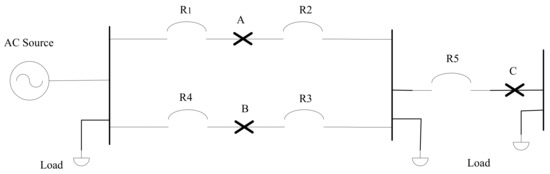
Figure 6.
A single-ended parallel distribution power system (Case 2).
Table 4.
Calculations of Irelay (current through relay) and αp (constant) (Case 2).
In this case, the number of constraints is nine, in which five constraints arise because of the boundaries of the relay operation and four emerge as a result of the coordination condition. The TMS range is from 0.025 to 1.1. TMS of all relays is , respectively.
The constraints that we obtain from the relays are:
The constraints of all equations are within the minimum value of the TMS. Therefore, the constraints that we obtain because of coordination are:
In this case, there are two objective functions; one is sum of all the constants in one variable and the other is sum of all the variables with minimum constants. The suggested HPSO has extraordinary exploration competency and speed compared to other meta-heuristic techniques; this characteristic makes the population members of HPSO more discriminative when searching for the optimal solution compared to other meta-heuristic algorithms. Objective function with sum of all the constants in one variable is compared with reference [45] and the minimum constant objective function is compared with reference [9]. Table 5 shows that the proposed HPSO method performs better than the other state of the art techniques. The graphical representation of the total net gain achieved against the TPSM, FA and CFA algorithms is shown in Figure 7. The net gain between TPSM and HPSO1 (Equation (29), OF (1)) is 0.05 sec and for the HPSO2 (Equation (30), OF (2)) net gain is 0.61 s and 0.51 s for FA and CFA, respectively. The comparative results of HPSO with TPSM, FA and CFA show the superiority and advantages of this algorithm. MATLAB simulation of both the objective function (OF) given in Equations (29) and (30) are shown in Figure 8 and Figure 9.
Table 5.
Comparison of the optimized TMS with other techniques (case 2).
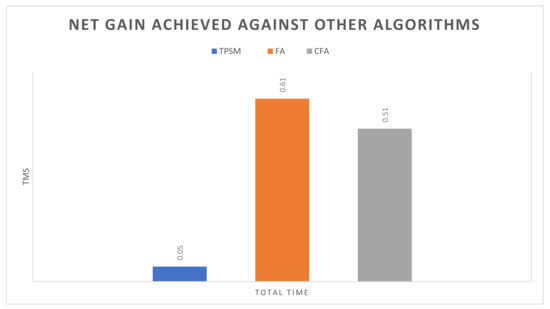
Figure 7.
Comparison analysis of HPSO with other algorithm (Case 2).

Figure 8.
Convergence characteristic graph of OF (1) (Case 1).
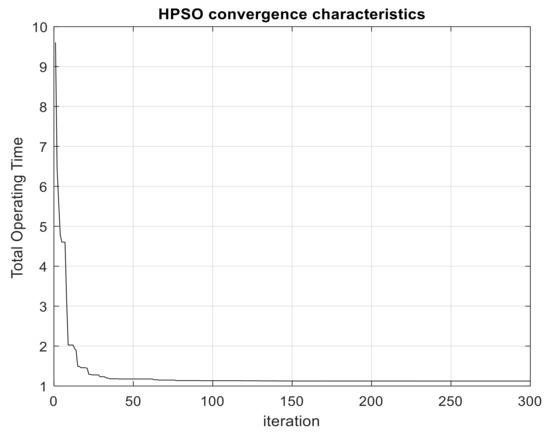
Figure 9.
Convergence characteristic graph of OF (2) (Case 2).
4.3. Multi-Loop Parallel Distribution Power System (Case 3)
A single-ended multi-loop parallel distribution power system with eight-overcurrent protection relays and four fault points are discussed in this case. Eight directional overcurrent relays, R1 to R8, and four fault points, A to D, are shown in Figure 10. The load current including overload is negligible in this case compared to the fault current. The relationship between primary and backup relay for the four different faults is shown in Table 6. The current transformer (CT) and plug setting (PS) ratio for each relay is shown in Table 7. For each relay, the minimum operating time (MOP) is 0.1 s and the CTI is 0.2 s. Table 8 provides the detail of the constant and the current through the relays for different faulty points.
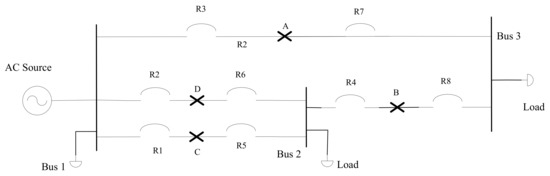
Figure 10.
A single-ended multi-loop distribution power system (Case 3).
Table 6.
Relationships between primary and backup relays (Case 3).
Table 7.
Plug settings (PS) and CT ratios of the relays (Case 3).
Table 8.
Calculations of Irelay (current through relay) and αp (constant) (Case 3).
In this case, the number of constraints is 14, in which eight constraints arise as a result of the limits of the relay operation and six emerge as a result of the coordination condition. The TMS range is from 0.025 to 1.1. TMS of eight relays are distinguished as respectively.
From Table 6, the objective function (OF) can be derived as:
The constraints that we obtain from the relays are:
The minimum limit of TMS is 0.025, which means that the constraints of Equations (44), (47) and (48) could not satisfy the minimum limit. To solve this problem, these constraints can be modified as:
The constraints of all the equations are within the minimum value of the TMS. Therefore, the constraints that we obtain because of coordination are:
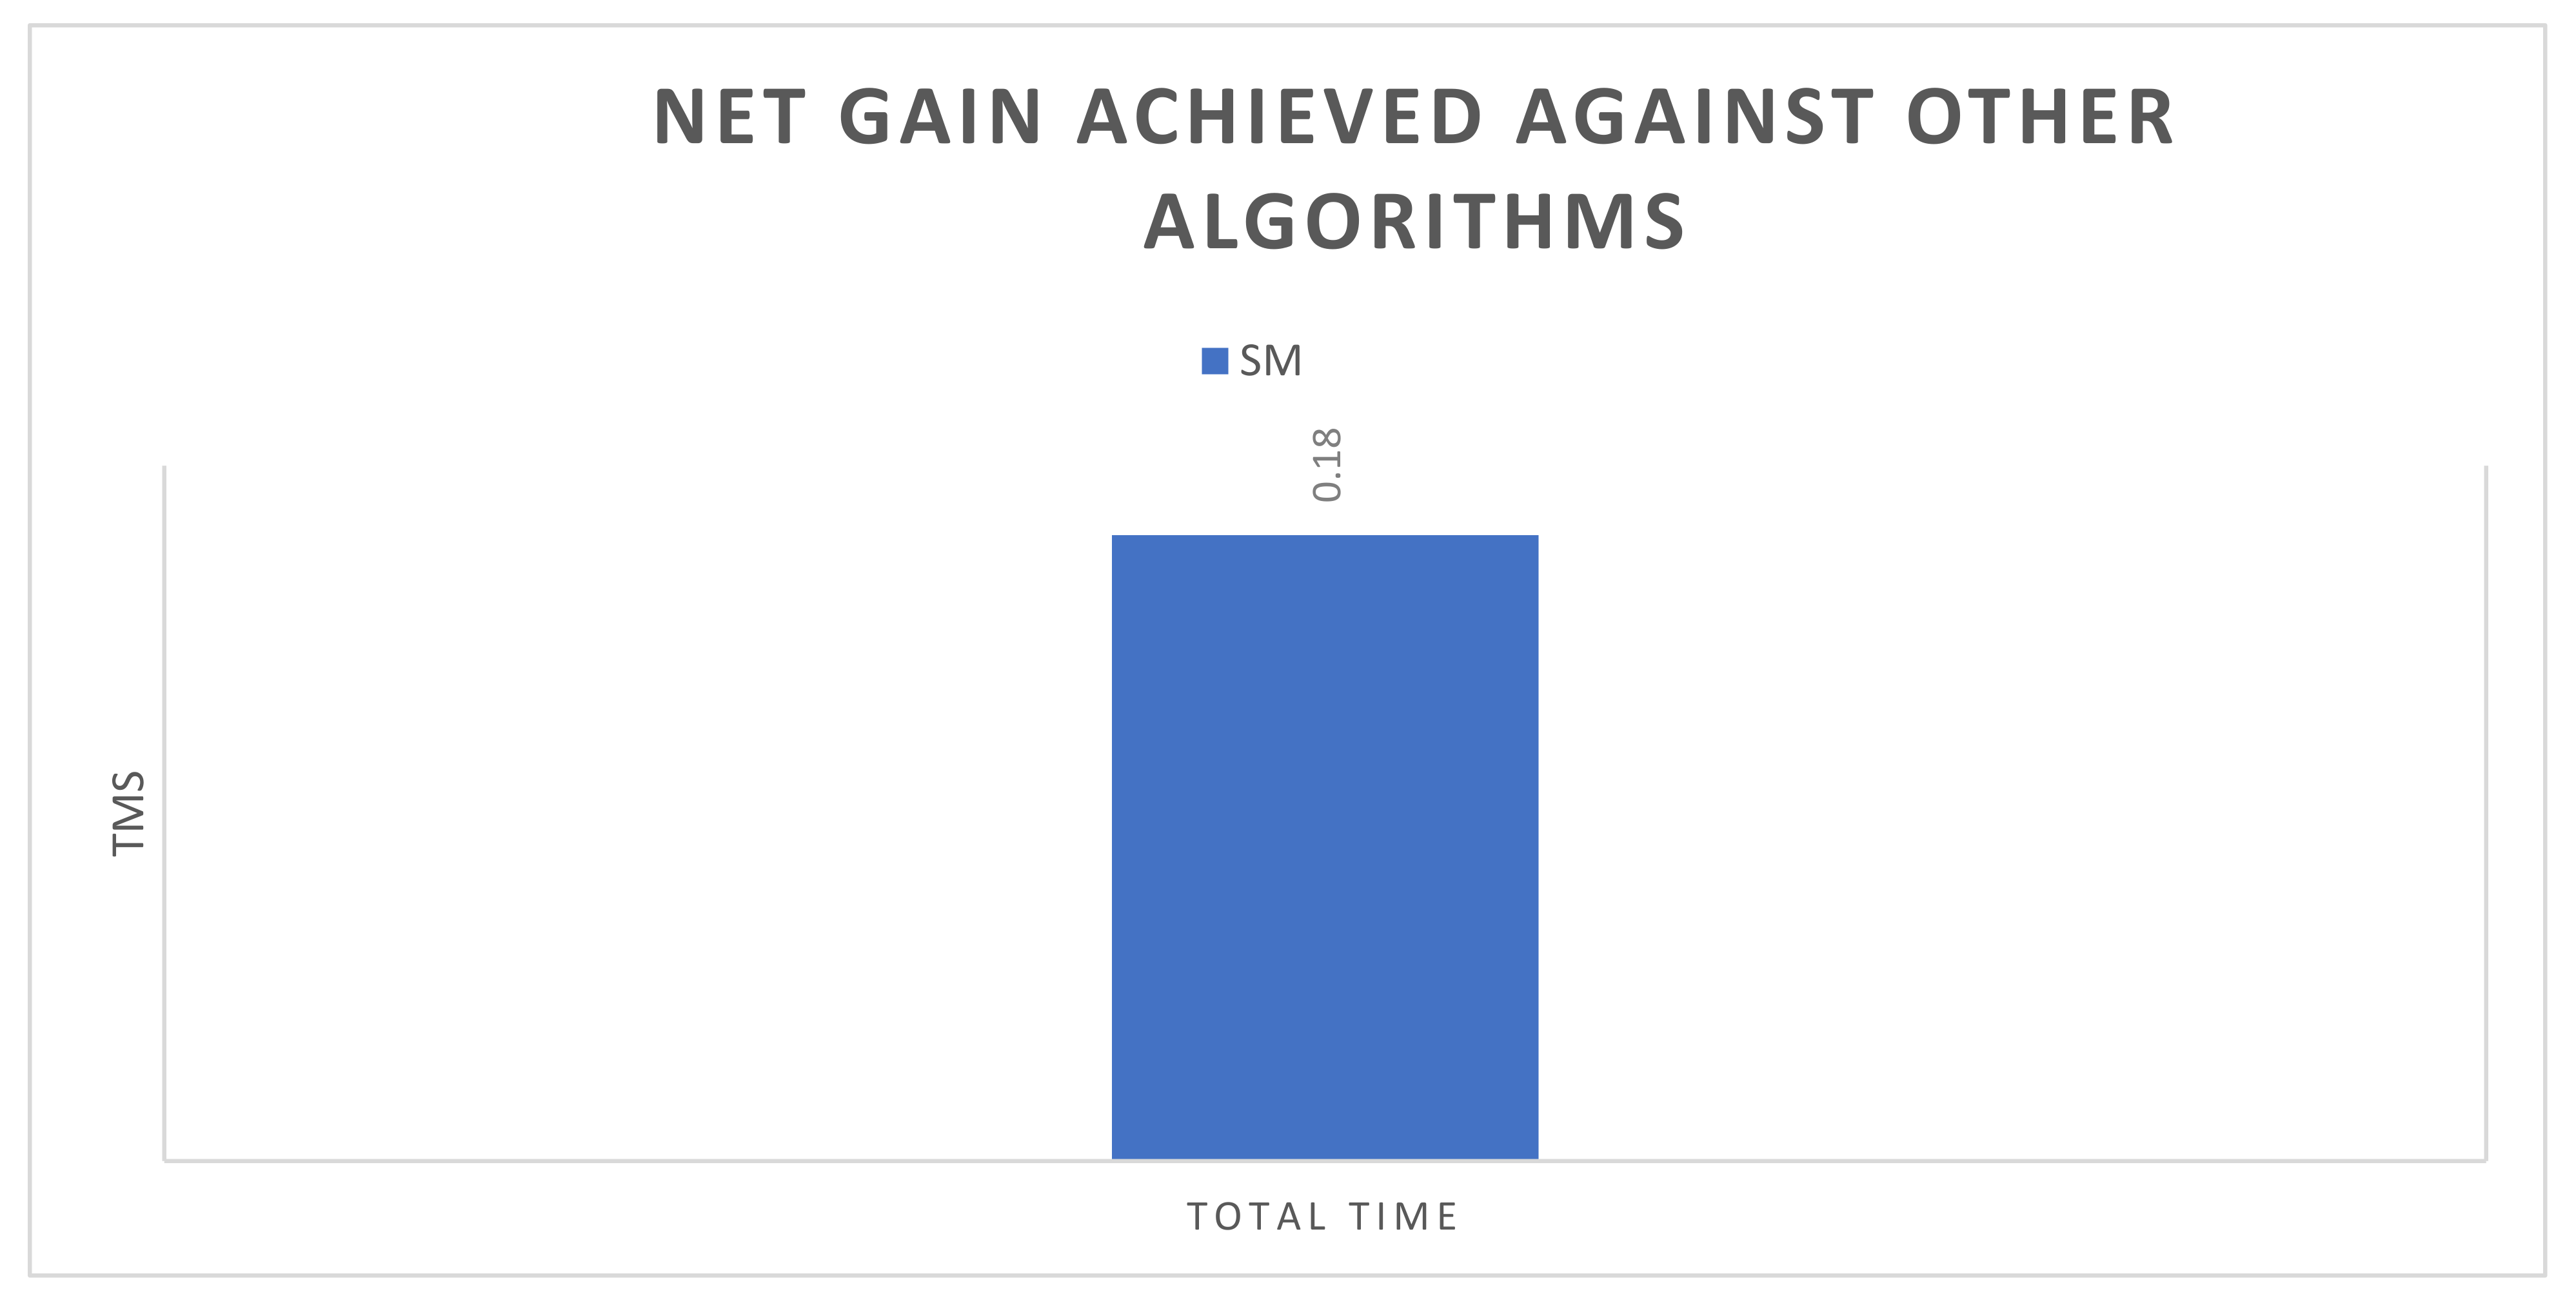
Table 9 shows that the proposed HPSO method works and performs better compared to the SM technique. The proposed algorithm solved the random initial solution drawback compared with the SA algorithm. This helped in finding the optimal solution for each subcarrier and to minimize the total operating time (). The overcurrent relay problem is also found to converge faster and better and the TMS results obtained after convergence satisfy all constraints. The graphical representation of the net gain achieved against the GA algorithms is shown in Figure 11. Comparing the results of the proposed algorithm with a previously published algorithm demonstrates the superiority and advantages of HPSO over the other algorithm [43].
Table 9.
Comparison of the optimized TMS with other techniques (case 3).

Figure 11.
Comparison analysis of HPSO with other algorithm (Case 3).
The results of HPSO in Table 9 are obtained from the MATLAB simulation of the objective function (OF) and their constraints.
4.4. Multi-Loop Parallel Distribution Power System (Case 4)
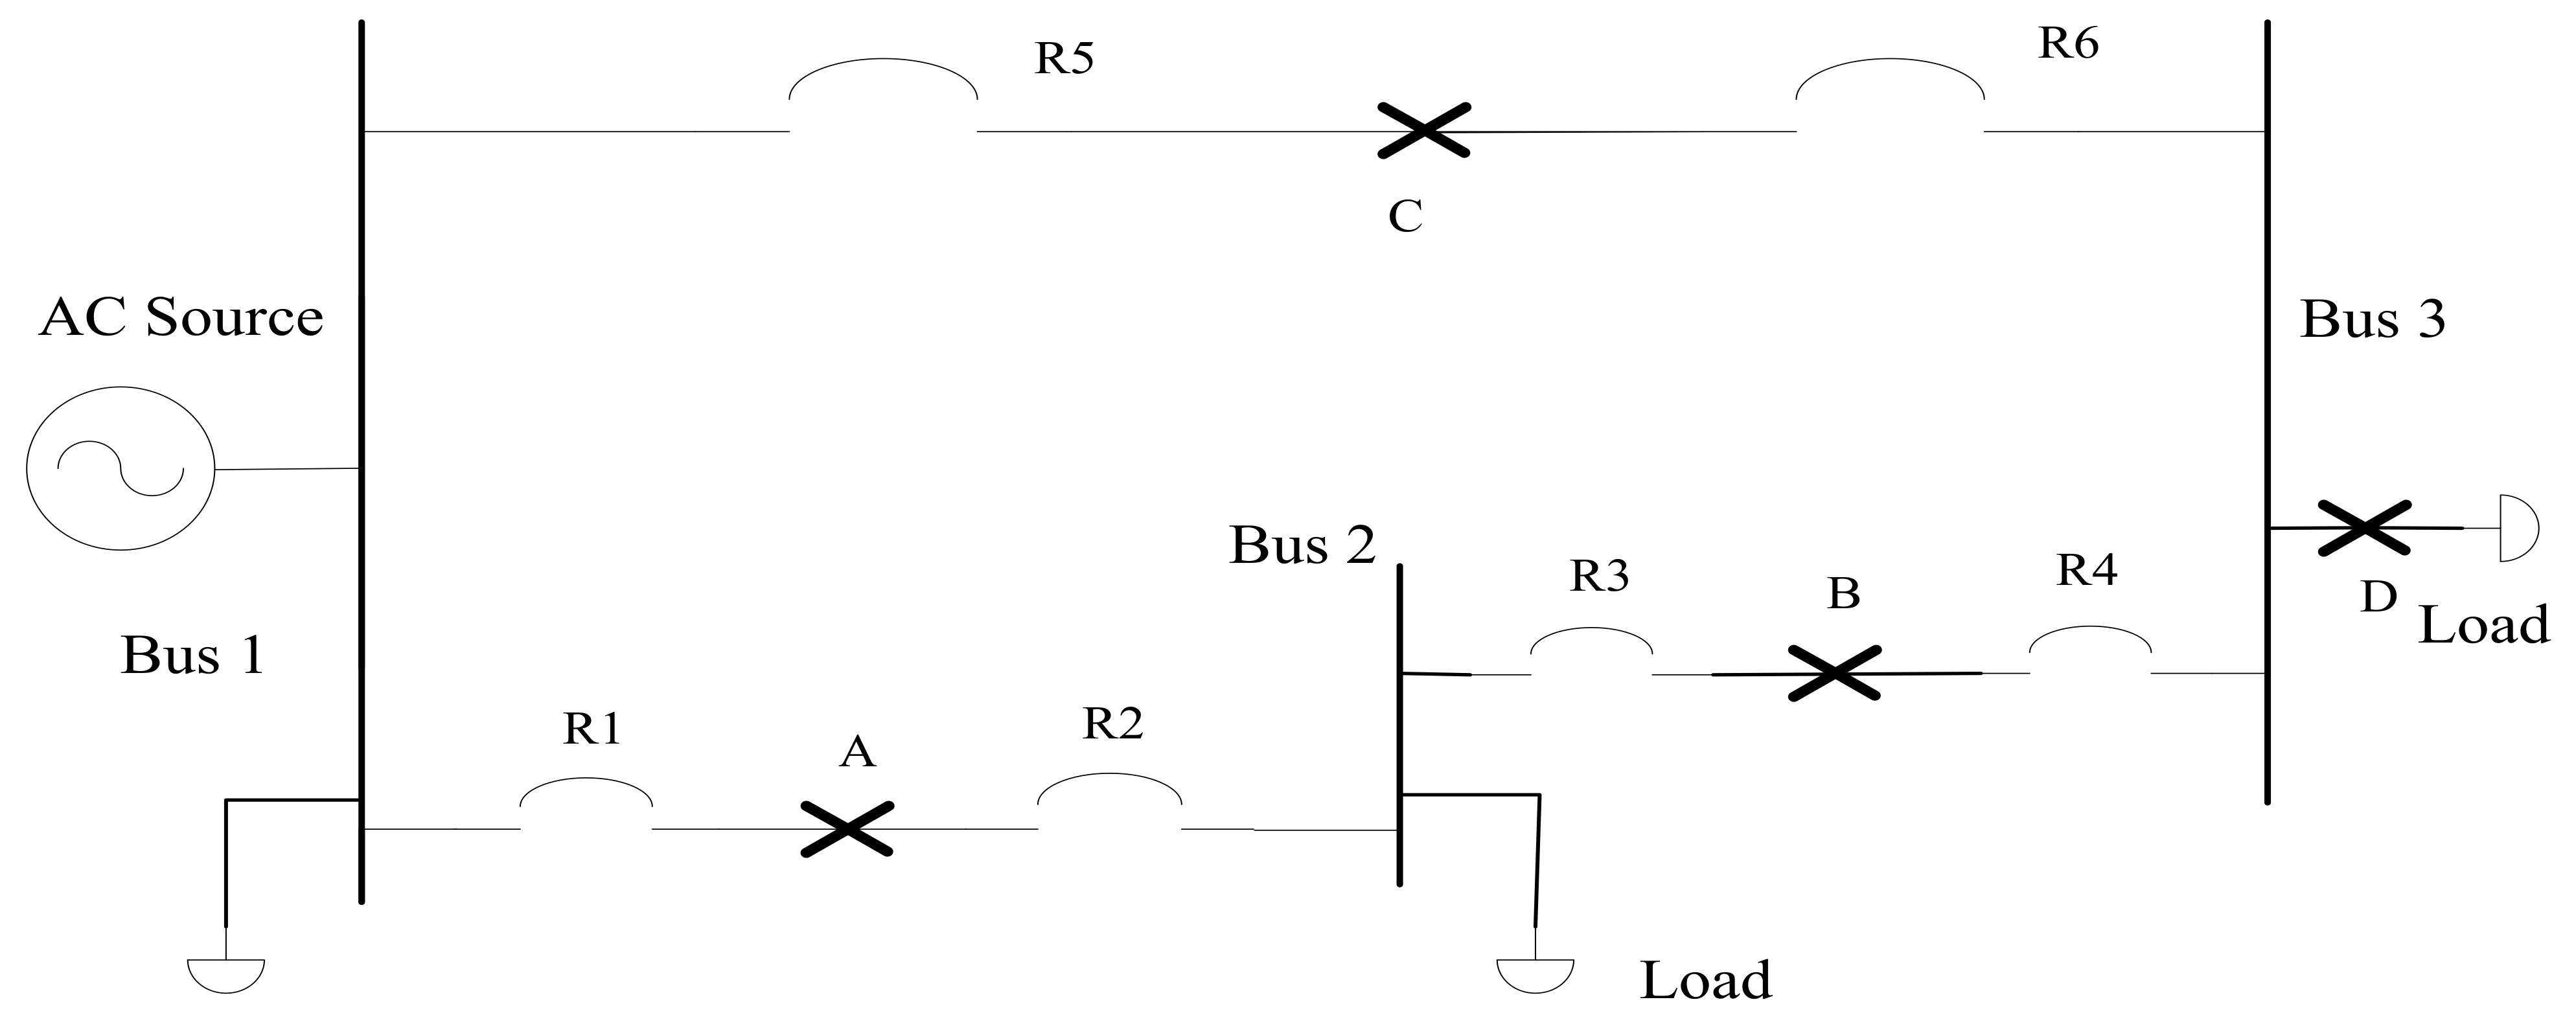
A multi-loop parallel power distribution system with six-overcurrent protection relays and four fault points is discussed in this case. Six directional overcurrent relays R1 to R6 and four fault points A to D shown in Figure 12. It must be noted that relay R4 and R6 should be directional towards the AC source others can be non-directional. For each relay, the minimum operating time (MOP) is 0.1 s and the CTI is 0.3 s. The current transformer (CT) and plug setting (PS) ratio for each relay is shown in Table 10. Table 11 shows the relationship between primary and backup relays. The constant and currents seen by the relays ( for the different fault points are given in Table 12.

Figure 12.
A multi-loop distribution power system (Case 4).
Table 10.
Plug settings (PS) and CT ratios of the relays (Case 4).
Table 11.
Plug settings (PS) and CT ratios of the relays (Case 4).
Table 12.
Plug settings (PS) and CT ratios of the relays (Case 4).
In this case, the number of constraints is 11, in which six constraints arise because of the boundaries of the relay operation and five emerge because of the coordination condition. The TMS range is from 0.025 to 1.1. TMS of all relays is , respectively.
The constraints that we obtain from the relays are:
The minimum limit of TMS is 0.025, which means that the constraints of equations from (52) to (56) could not satisfy the minimum limit. Therefore, these constraints can be modified as:
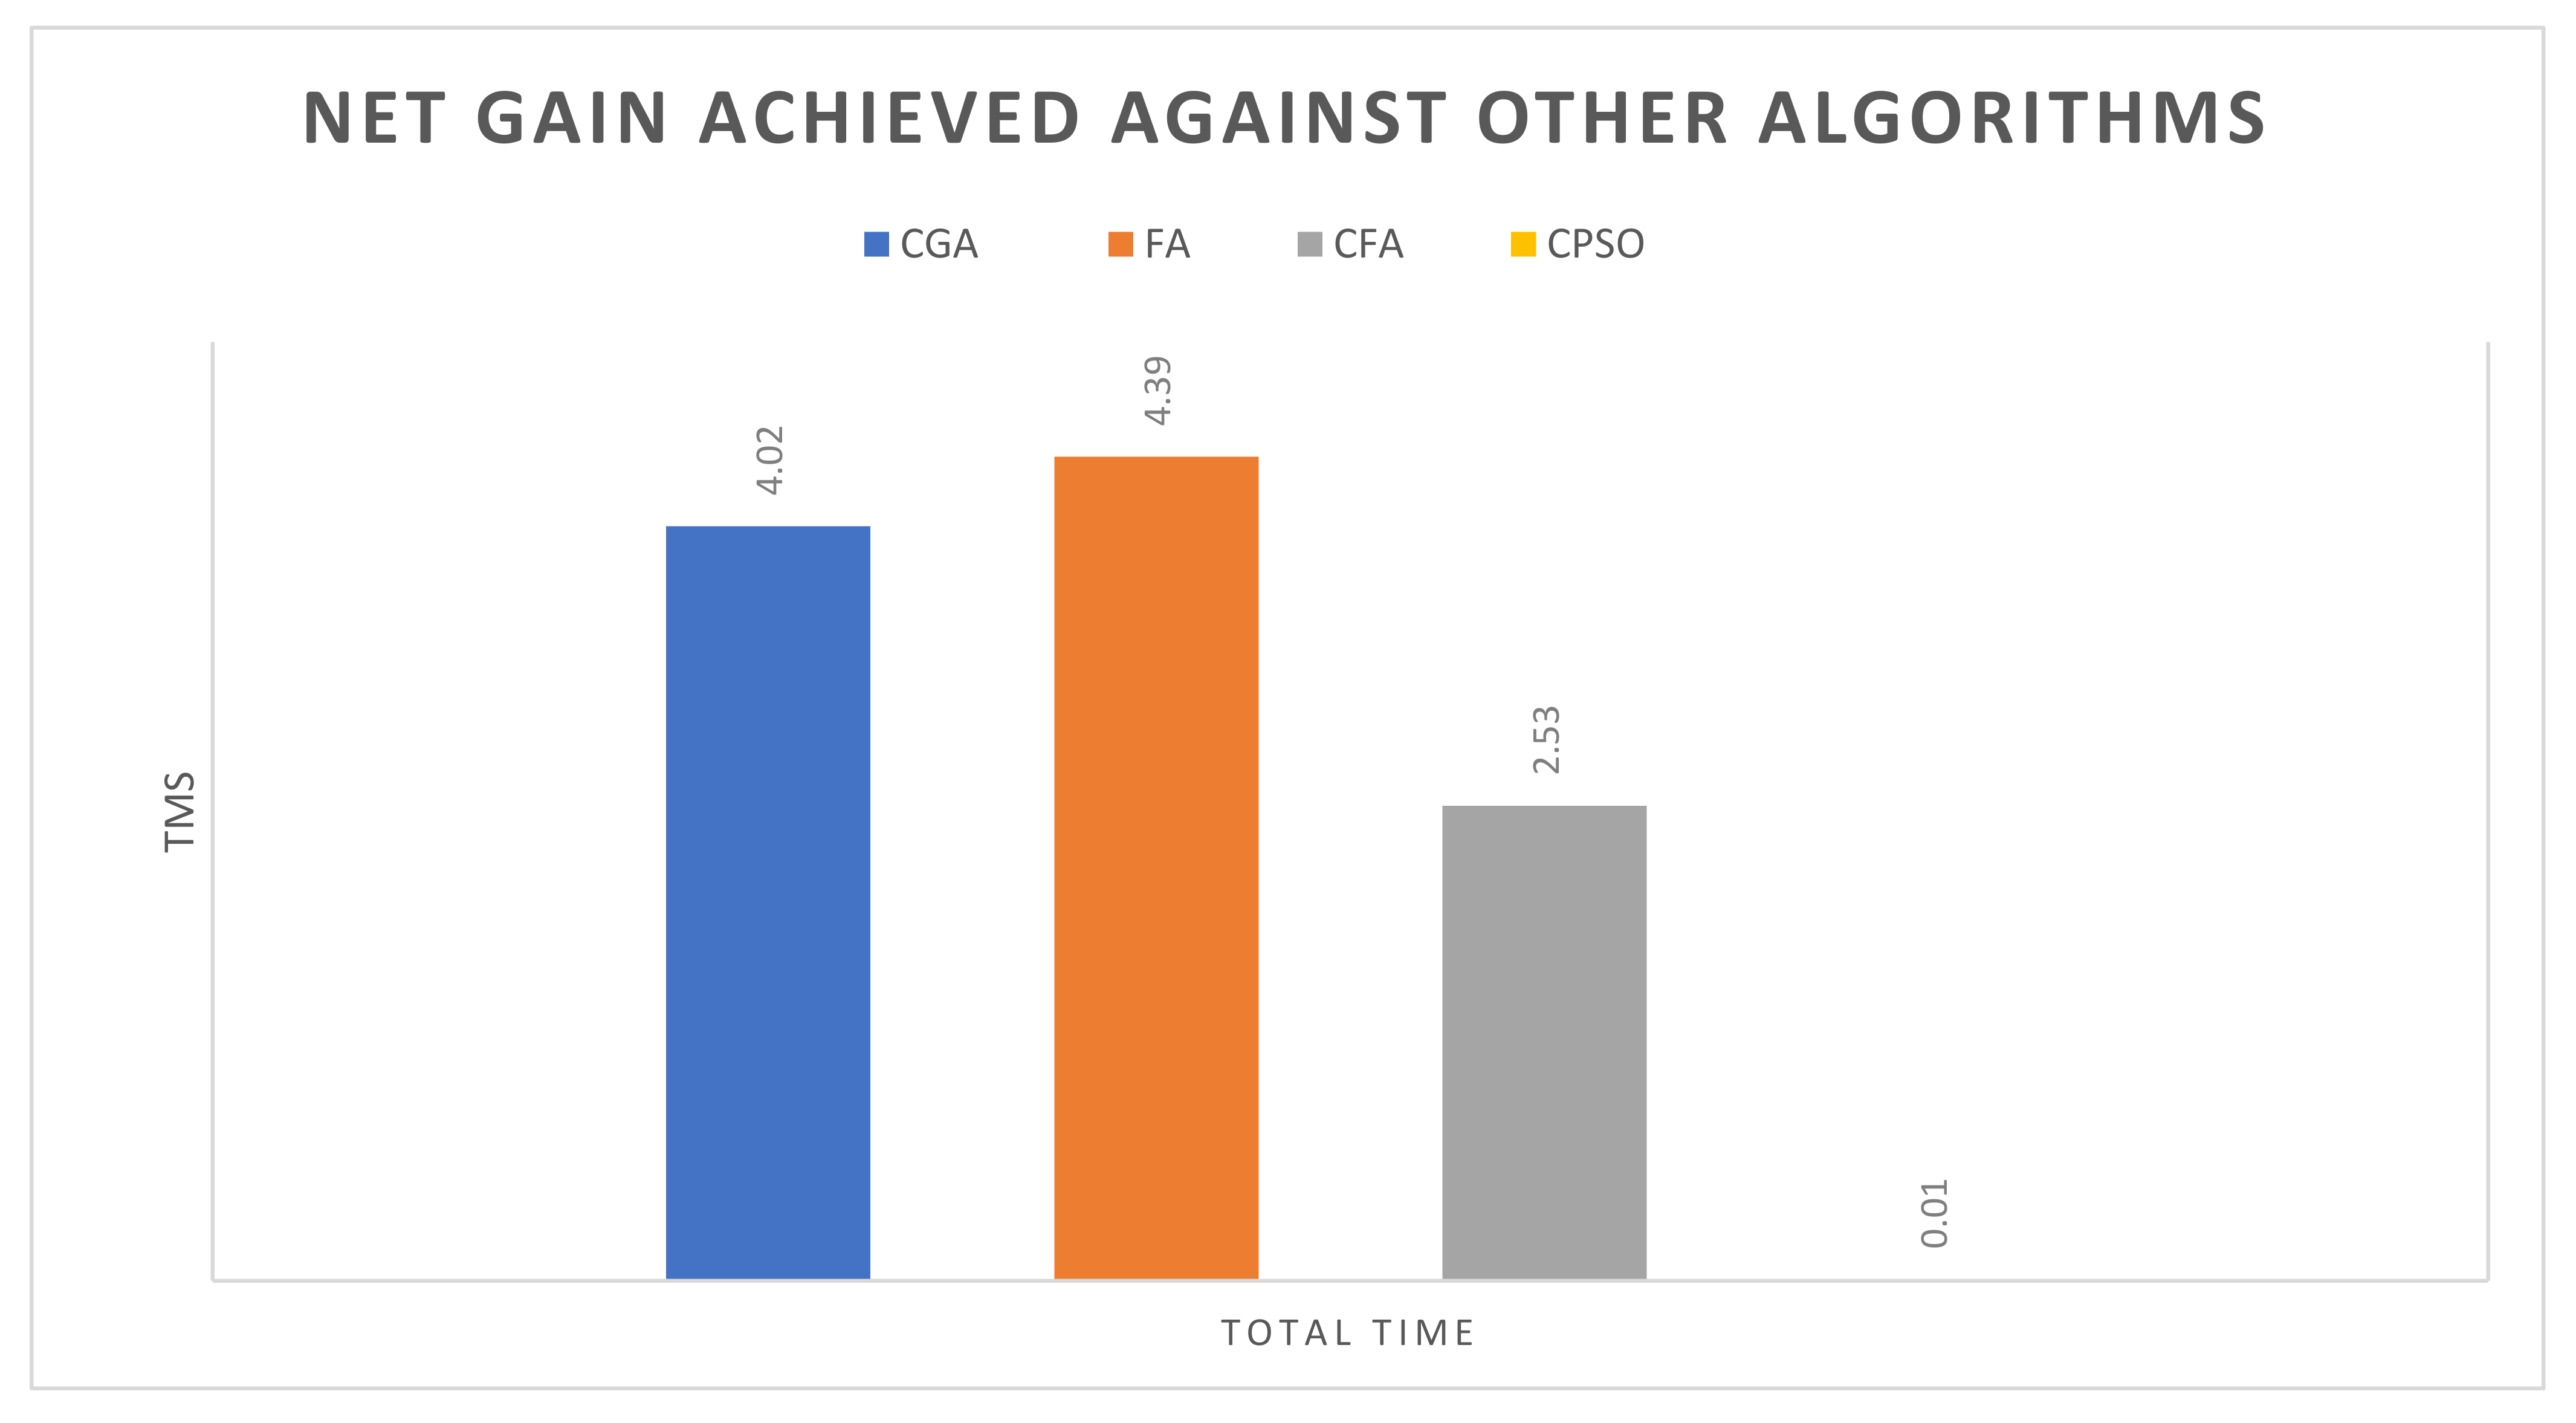
Table 13 suggests that the proposed HPSO method performs better than the other state of the art techniques. The proposed algorithm HPSO combines the exploration ability of PSO with the exploitation ability of SA, to avoid being trapped in local optima and to successfully search for global optimum solution. The suggested HPSO has extraordinary exploration competency and speed compared to other meta-heuristic techniques; this characteristic makes the population members of HPSO more discriminative when searching for the optimal solution compared to other meta-heuristic algorithms. The graphical representation of the total net gain achieved against the CGA, FA and CFA algorithms is shown in Figure 13. The net gain between CGA and HPSO is 4.02 s and for the FA and CFA net gain is 4.39 s and 2.53 s, respectively, for the HPSO. The comparative results show the superiority and advantages of HPSO over the CGA, FA, CFA, and CPSO algorithms. MATLAB simulation of the objective function (OF) with the calculated constraints are shown in Figure 14.
Table 13.
Comparison of the optimized TMS with other techniques (case 4).

Figure 13.
Comparison analysis of HPSO with other algorithm (Case 4).
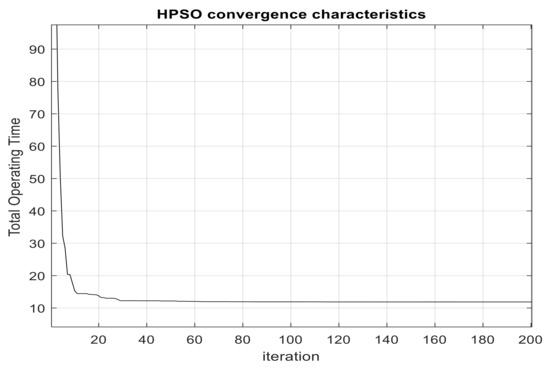
Figure 14.
Convergence characteristic graph for Case 4.
4.5. IEEE 3-Bus System (Case 5)
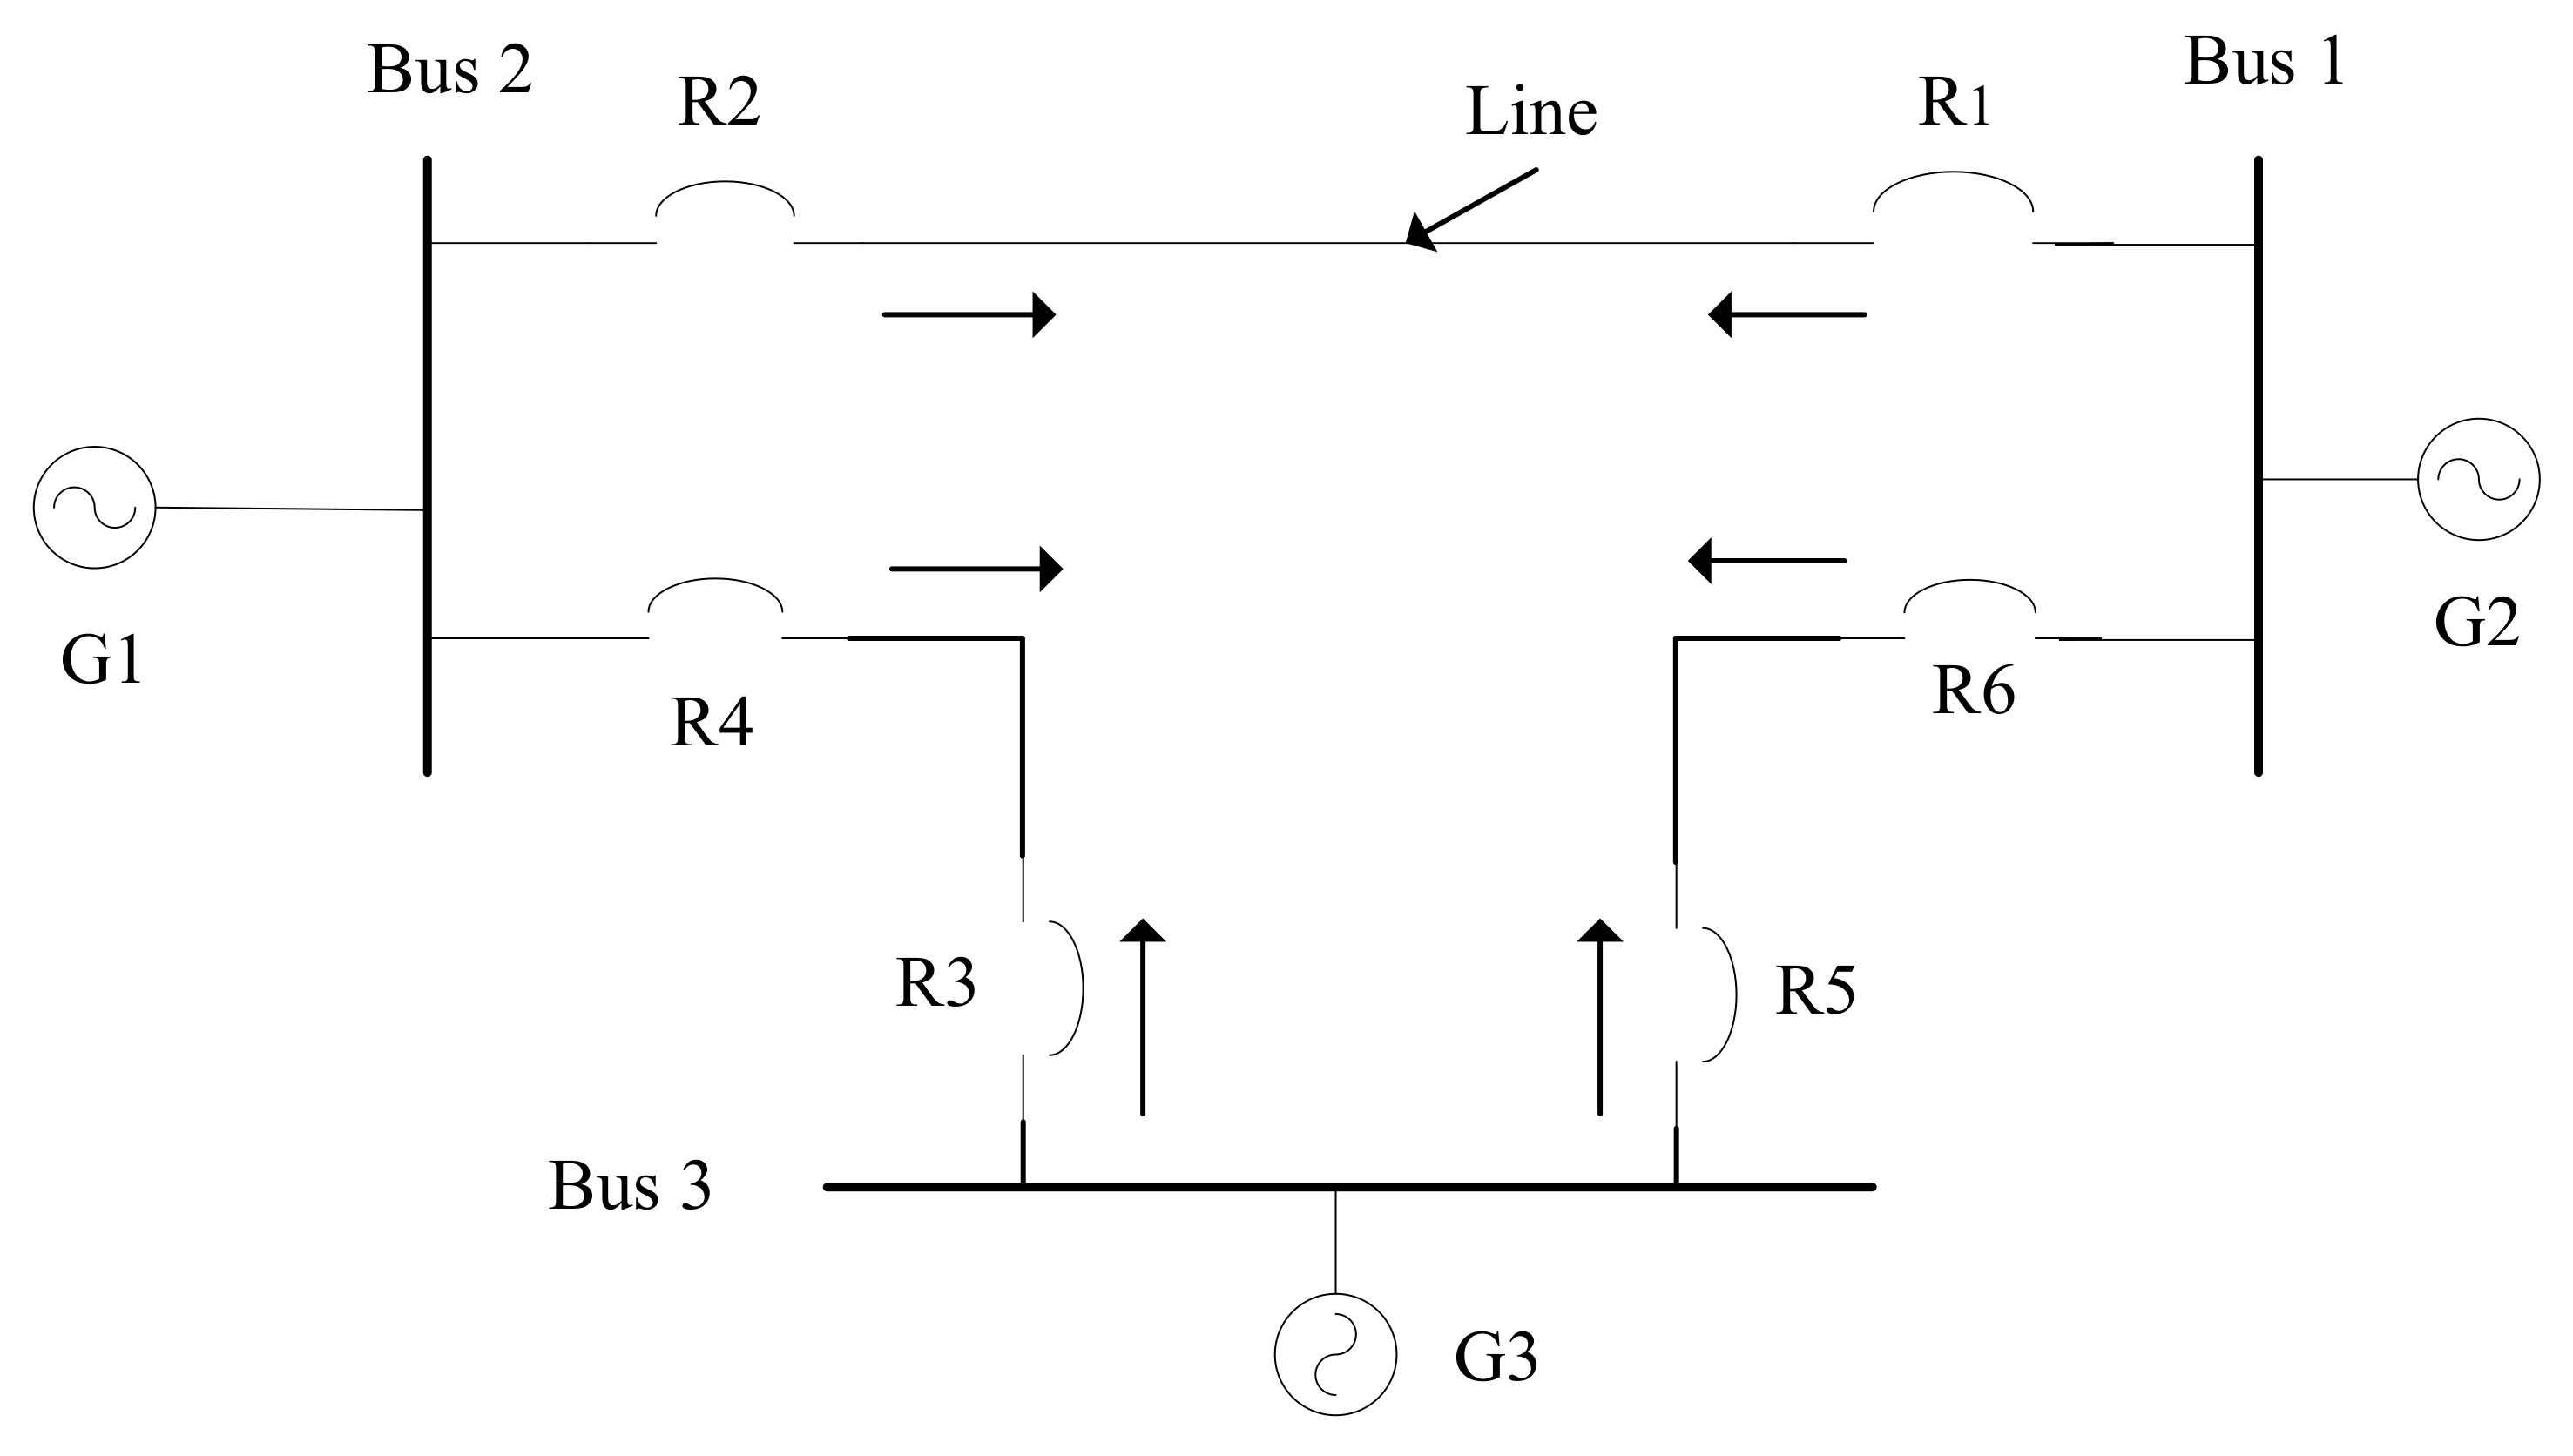
A single line diagram of power distribution system with six-overcurrent protection relays, three buses, three AC sources, and three lines is shown in Figure 15. Six directional overcurrent relays are denoted as R1 to R6, and the current transformer ratio between these relays are given in Table 14. The relationship between primary and backup relays and their fault currents are given in Table 15. The PS is kept constant at 1.5 and the TMS lower and upper bounds are set to 0.1 and 1.1, respectively. The coordination time interface (CTI) value is chosen to be 0.3 s. The optimized TMS of proposed HPSO are given in Table 16.
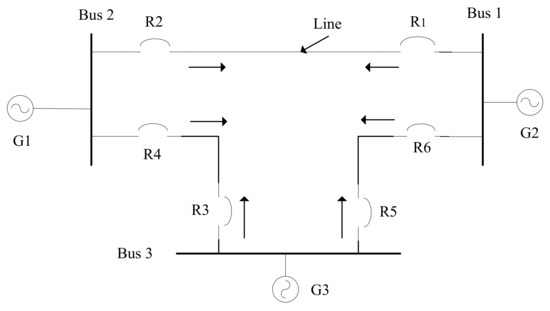
Figure 15.
IEEE 3-bus system.
Table 14.
CT ratios of the relay (IEEE 3-bus system).
Table 15.
Relationships between primary and backup relays and fault currents (IEEE 3-bus).
Table 16.
Comparison of the optimized TMS with other techniques (case 5).
Table 16 shows the comparison of the proposed algorithm with other published techniques described in the literature. The proposed HPSO method works and performs better in comparison with other evolutionary techniques. The graphical illustration of the optimized net gain in time (s) compared with the proposed HPSO is shown in Figure 16, which shows the superiority of HPSO over other methods described in the literature. The graph of the convergence characteristics of the IEEE 3-bus system is shown in Figure 17, which shows that the convergence is faster and the minimum operating time to trace a fault is achieved in fewer iterations.
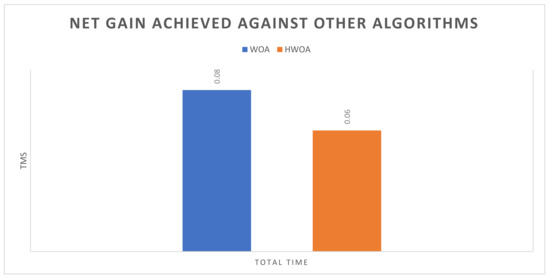
Figure 16.
Comparison analysis of HPSO with other algorithms (case 5).
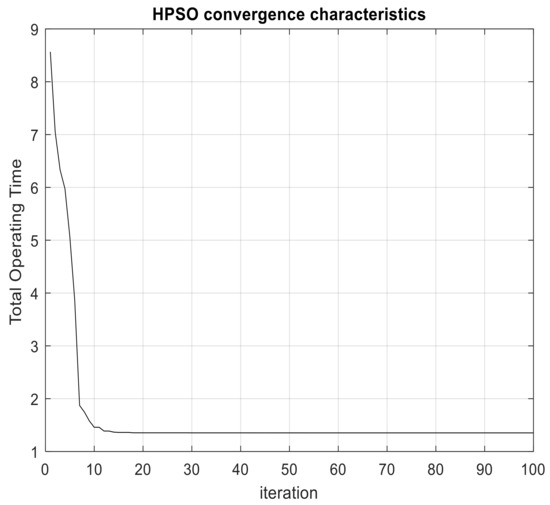
Figure 17.
Convergence characteristic graph for IEEE 3-bus system.
5. Comparison Results Analysis
The HPSO algorithm was used to assess the DOPR coordination problem. The suggested algorithm has a high search capability and convergence speed, and these distinctive features make the swarm agents of the HPSO more discriminative in finding the optimum solution. Different optimization algorithms, as shown in the literature, have also evaluated the case studies presented in this paper, and an improved optimal solution was observed from the proposed HPSO algorithm compared to other algorithms. The DOPR coordination problem is a highly constrained optimization problem. A program has been scripted in MATLAB for finding the optimum time coordination of DOPRs using the HPSO method. This scripted program can be used for setting the optimum time coordination of DOPRs in a system with any number of relays and any number of primary-backup relationships. The HPSO algorithm was simulated and the results are compared with references [2,9,16,20,43,44,45]. The proposed algorithm was found to be the best choice in terms of troubleshooting the directional relay problem in minimum time. The results confirm that HPSO has a high tide-finding ability and convergence rate when compared to other optimization methods. This study examined five case studies and all case studies were compared to optimization algorithms such as CPSO, GA, CGA, FA, CFA, DMS, SM, WOA, HWOA and TPSM. Case studies confirm that the proposed algorithm is superior to other algorithms. To achieve an accurate comparison with other methods, the same boundary conditions and parameters were used. The comparison of different techniques by using histogram are shown in Figure 3, Figure 6, Figure 10, Figure 12 and Figure 16, which shows that the operating time of HPSO is lesser than all other algorithms. For case 1, the HPSO receives net gains of 0.06 s and 1.59 s versus GA, and 0.001 s, 1.45 s, and 0.011 s versus SM, DSM, and CPSO, respectively. The result shows that when using HPSO, the operating time is improved by 3.7% vs. GA1, 49.2% vs. GA2, 0.06% vs. SM, 46.9% vs. DSM and 0.66% vs. CPSO. For case 2, there were net gains of 0.05 s versus TPSM and 0.61 s, 0.51 s versus FA and CFA algorithms, respectively. In terms of percentage, improvements of 2.2% in TPSM, 35% in FA and 31% in CFA have been achieved. For case 3, a net gain of 0.18 s was obtained over the SM, which means a 1.9% improvement in results. In case 4, HPSO earns high net gain versus CGA, FA, and CFA of 4.02 s, 4.39 s, and 2.53 s, respectively. In this case, good performance improvement in results has been by 25.3% in CGA, 27% in FA, and 17.5% in CFA. For case 5, net gain of 0.08 s and 0.06 s was obtained over the WOA and HWOA algorithm, which means a 5.49% and 4.03% improvement in results has been shown. Net gain showed how fast and earlier HPSO traces the fault in terms of time (seconds) and percentage. The graphs of the convergence characteristics for the five cases show that convergence is faster, and a good solution is achieved in fewer iterations. From all the above analysis, it can be seen that the proposed method is superior to the recently published methods mentioned in the literature in terms of the quality of the solution, convergence and minimization of the objective function to the optimal value.
6. Conclusions
In this paper, the HPSO algorithm is suggested to exactly evaluate the constraints of various DOPR models. The HPSO is analyzed over parameter identification issues of DOPR models. The simulation results demonstrate that HPSO has a better performance in terms of minimizing total operating time compared to other methods in the literature. The results obtained by the HPSO technique effectively minimize the time of all the five models of the problem. The performance of HPSO has been determined and tested in a variety of single and multi-loop power distribution systems with analysis of its superiority to other algorithms from the literature. All the five cases simulated justify that HPSO is an effective solution for solving the constraint identification problem of DOPR models. In the future work, this technique could be implemented in real time systems to solve issues of DOPR.
Author Contributions
K.H., X.L., A.W., S.K., Y.W. and S.X. contributed equally to the literature review of the directional overcurrent protection relay, then developed the first discussions about the different parameters of the proposed methodology and conducted the simulations and analysis of results together with A.W. A.W. and X.L. guided the investigation and supervised this work. S.K., Y.W. and S.X. gave suggestions and guidance for the research. All authors have read and agreed to the published version of the manuscript.
Funding
National Natural Science Foundation of China (NSFC), under Grant 61771363, funded this research.
Data Availability Statement
The data used to support the finding of this study are included within the article.
Conflicts of Interest
The authors declare no conflict of interest.
References
- Blackburn, J. Protective Relaying, Principles and Applications; Marcel Dekker Inc.: New York, NY, USA, 1987. [Google Scholar]
- Khurshaid, T.; Wadood, A.; Farkoush, S.G.; Yu, J.; Kim, C.H.; Rhee, S.B. An improved optimal solution for the directional overcurrent relays coordination using hybridized whale optimization algorithm in complex power systems. IEEE Access 2019, 7, 90418–90435. [Google Scholar] [CrossRef]
- Irfan, M.; Wadood, A.; Khurshaid, T.; Khan, B.M.; Kim, K.C.; Oh, S.R.; Rhee, S.B. An Optimized Adaptive Protection Scheme for Numerical and Directional Overcurrent Relay Coordination Using Harris Hawk Optimization. Energies 2021, 14, 5603. [Google Scholar] [CrossRef]
- Haider, Z.M.; Mehmood, K.K.; Khan, S.U.; Khan, M.O.; Wadood, A.; Rhee, S.B. Optimal Management of a Distribution Feeder during Contingency and Overload Conditions by Harnessing the Flexibility of Smart Loads. IEEE Access 2021, 9, 40124–40139. [Google Scholar] [CrossRef]
- Bukhari, A.S.B.; Mehmood, K.K.; Wadood, A.; Park, H. Intelligent Islanding Detection of Microgrids Using Long Short-Term Memory Networks. Energies 2021, 14, 18. [Google Scholar] [CrossRef]
- Wadood, A.; Khurshaid, T.; Farkoush, S.G.; Kim, C.H.; Rhee, S.B. A bio-inspired rooted tree algorithm for optimal coordination of overcurrent relays. In International Conference on Intelligent Technologies and Applications; Springer: Singapore, 2018; pp. 188–201. [Google Scholar]
- Shih, M.Y.; Enríquez, A.C.; Martín, L.; Trevi, T. On-line coordination of directional overcurrent relays: Performance evaluation among optimization algorithms. Electr. Power Syst. Res. 2014, 110, 122–132. [Google Scholar] [CrossRef]
- Yang, H.; Wen, F.; Ledwich, G. Optimal coordination of overcurrent relays in distribution systems with distributed generators based on differential evolution algorithm. Int. Trans. Elect. Energy Syst. 2013, 23, 1–12. [Google Scholar] [CrossRef]
- Gokhale, S.S.; Kale, V.S. An application of a tent map initiated Chaotic Firefly algorithm for optimal overcurrent relay coordination. Int. J. Electr. Power Energy Syst. 2016, 78, 336–342. [Google Scholar] [CrossRef]
- Khurshaid, T.; Wadood, A.; Farkoush, S.G.; Kim, C.H.; Yu, J.; Rhee, S.B. Improved firefly algorithm for the optimal coordination of directional overcurrent relays. IEEE Access 2019, 7, 78503–78514. [Google Scholar] [CrossRef]
- Singh, M.; Panigrahi, B.K.; Abhyankar, A.R.; Das, S. Optimal coordination of directional over-current relays using informative differential evolution algorithm. J. Comput. Sci. 2014, 5, 269–276. [Google Scholar] [CrossRef]
- Chelliah, T.R.; Thangaraj, R.; Allamsetty, S.; Pant, M. Coordination of directional overcurrent relays using opposition based chaotic differential evolution algorithm. Int. J. Electr. Power Energy Syst. 2014, 55, 341–350. [Google Scholar] [CrossRef]
- Bedekar, P.P.; Bhide, S.R. Optimum coordination of directional overcurrent relays using the hybrid GA-NLP approach. IEEE Trans. Power Deliv. 2011, 26, 109–119. [Google Scholar] [CrossRef]
- Razavi, F.; Abyaneh, H.A.; Al-Dabbagh, M.; Mohammadi, R.; Torkaman, H. A new comprehensive genetic algorithm method for optimal overcurrent relays coordination. Electr. Power Syst. Res. 2008, 78, 713–720. [Google Scholar] [CrossRef]
- GholamiFarkoush, S.; Khurshaid, T.; Wadood, A.; Kim, C.-H.; Kharal, K.H.; Kim, K.-H.; Cho, N.; Rhee, S.-B. Investigation and Optimization of Grounding Grid Based on Lightning Response by Using ATP-EMTP and Genetic Algorithm. Complexity 2018, 2018, 1–8. [Google Scholar] [CrossRef]
- Bedekar, P.P.; Bhide, S.R. Optimum coordination of overcurrent relay timing using continuous genetic algorithm. Expert Syst. Appl. 2011, 38, 11286–11292. [Google Scholar] [CrossRef]
- Moravej, Z.; Adelnia, F.; Abbasi, F. Optimal coordination of directionalovercurrent relays using NSGA-II. Electr. Power Syst. Res. 2015, 119, 228–236. [Google Scholar] [CrossRef]
- Bhattacharya, S.K.; Goswami, S.K. Distribution network reconfiguration considering protection coordination constraints. Electr. Power Compon. Syst. 2008, 36, 1150–1165. [Google Scholar] [CrossRef]
- Abhyaneh, H.A.; Al-Dabbagh, M.; Karegar, H.K.; Sadeghi, S.H.H.; Khan, R.A.J. A new optimal approach for coordination of directional overcurrent relays in interconnected power system. IEEE Trans. Power Deliv. 2003, 18, 430–435. [Google Scholar] [CrossRef]
- Wadood, A.; Kim, C.-H.; Khurshiad, T.; Farkoush, S.G.; Rhee, S.-B. Application of a continuous particle swarm optimization (CPSO) for the optimal coordination of overcurrent relays considering a penalty method. Energies 2018, 11, 869. [Google Scholar] [CrossRef] [Green Version]
- Ghanbari, M.; Gandomkar, M.; Nikoukar, J. Protection Coordination of Bidirectional Overcurrent Relays Using Developed Particle Swarm Optimization Approach Considering Distribution Generation Penetration and Fault Current Limiter Placement. IEEE Can. J. Electr. Comput. Eng. 2021, 44, 2. [Google Scholar] [CrossRef]
- Khurshaid, T.; Wadood, A.; Farkoush, S.G.; Kim, C.-H.; Cho, N.; Rhee, S.-B. Modified particle swarm optimizer as optimization of time dial settings for coordination of directional overcurrent relay. J. Elect. Eng. Technol. 2019, 14, 55–68. [Google Scholar] [CrossRef]
- Mosavi, S.M.A.; Kejani, T.A.; Javadi, H. Optimal setting of directional over-current relays in distribution networks considering transient stability. Int. Trans. Electr. Energy Syst. 2015, 26, 122–133. [Google Scholar] [CrossRef]
- Kim, C.-H.; Khurshaid, T.; Wadood, A.; Farkoush, S.G.; Rhee, S.B. Gray wolf optimizer for the optimal coordination of directional overcurrent relay. J. Electr. Eng. Technol. 2018, 13, 1043–1051. [Google Scholar]
- Castillo, C.; Conde, A.; Shih, M. Improvement of non-standardized directional overcurrent relay coordination by invasive weed optimization. Electr. Power Syst. Res. 2018, 157, 48–58. [Google Scholar] [CrossRef]
- Bouchekara, H.; Zellagui, M.; Abido, M. Optimal coordination of directional overcurrent relays using a modified electromagnetic field optimization algorithm. Appl. Soft Comput. 2017, 54, 267–283. [Google Scholar] [CrossRef]
- Wadood, A.; Farkoush, S.G.; Khurshaid, T.; Yu, J.-T.; Kim, C.-H.; Rhee, S.-B. Application of the JAYA Algorithm in Solving the Problem of the Optimal Coordination of Overcurrent Relays in Single- and Multi-Loop Distribution Systems. Complexity 2019, 2019, 1–13. [Google Scholar] [CrossRef]
- Yu, J.-T.; Kim, C.-H.; Wadood, A.; Khurshaid, T.; Rhee, S.-B. Jaya Algorithm With Self-Adaptive Multi-Population and Lévy Flights for Solving Economic Load Dispatch Problems. IEEE Access 2019, 7, 21372–21384. [Google Scholar] [CrossRef]
- Yu, J.; Kim, C.-H.; Wadood, A.; Khurshiad, T.; Rhee, S.-B. A Novel Multi-Population Based Chaotic JAYA Algorithm with Application in Solving Economic Load Dispatch Problems. Energies 2018, 11, 1946. [Google Scholar] [CrossRef] [Green Version]
- Wadood, A.; Khurshaid, T.; Gholami Farkoush, S.; Yu, J.; Kim, C.-H.; Rhee, S.-B. Nature-Inspired Whale Optimization Algorithm for Optimal Coordination of Directional Overcurrent Relays in Power Systems. Energies 2019, 12, 2297. [Google Scholar] [CrossRef] [Green Version]
- Wadood, A.; Gholami Farkoush, S.; Khurshaid, T.; Kim, C.-H.; Yu, J.; Geem, Z.W.; Rhee, S.-B. An Optimized Protection Coordination Scheme for the Optimal Coordination of Overcurrent Relays Using a Nature-Inspired Root Tree Algorithm. Appl. Sci. 2018, 8, 1664. [Google Scholar] [CrossRef] [Green Version]
- Rashedi, E.; Nezamabadi-Pour, H.; Saryazdi, S. GSA: A Gravitational Search Algorithm. Inf. Sci. 2009, 179, 2232–2248. [Google Scholar] [CrossRef]
- El-Naggar, K.; AlRashidi, M.; AlHajri, M.; Al-Othman, A. Simulated Annealing algorithm for photovoltaic parameters identification. Sol. Energy 2012, 86, 266–274. [Google Scholar] [CrossRef]
- Idoumghar, L.; Melkemi, M.; Schott, R.; Aouad, M.I. Hybrid PSO-SA type algorithms for multimodal function optimization and reducing energy consumption in embedded systems. Appl. Comput. Intell. Soft Comput. 2011, 2011, 138078. [Google Scholar] [CrossRef] [Green Version]
- Noghabi, A.S.; Sadeh, J.; Mashhadi, H.R. Considering different network topologies in optimal overcurrent relay coordination using a hybrid GA. IEEE Trans. Power Del. 2009, 24, 1857–1863. [Google Scholar] [CrossRef]
- Sadati, N.; Zamani, M.; Mahdavian, H.R.F. Hybrid particle swarm-based-simulated annealing optimization techniques. In Proceedings of the IECON 2006—32nd Annual Conference on IEEE Industrial Electronics, Paris, France, 6–10 November 2006. [Google Scholar]
- Zeienldin, H.; El-Saadany, E.F.; Salama, M.A. A Novel Problem Formulation for Directional Overcurrent Relay Coordination. In Proceedings of the Large Engineering Systems Conference on Power Engineering 2004 (LESCOPE-04), Halifax, NS, Canada, 28–30 July 2004; pp. 48–52. [Google Scholar]
- Urdaneta, A.J.; Restrepo, H.; Marquez, S.; Sanchez, J. Coordination of Directional Relay Timing using Linear Programming. IEEE Trans. Power Deliv. 1996, 11, 122–129. [Google Scholar] [CrossRef]
- Wadood, A.; Kim, C.-H.; Farkoush, S.G.; Rhee, S.B. An Adaptive Protective Coordination Scheme for Distribution System Using Digital Overcurrent Relays. In Proceedings of the Korean Institute of Illuminating and Electrical Installation Engineers, Gangwon, Korea, 30 August 2017; p. 53. [Google Scholar]
- Park, J.B.; Lee, K.S.; Shin, J.R.; Lee, K.Y. A Particle swarm optimization for economic dispatch with non-smooth cost functions. IEEE Trans. Power Syst. 2005, 20, 34–42. [Google Scholar] [CrossRef]
- Sevkli, M.; Guner, A.R. A continuous particle swarm optimization algorithm for uncapacitated facility location problem. In Ant Colony Optimization and Swarm Intelligence; Springer: Berlin/Heidelberg, Germany, 2006. [Google Scholar]
- Kirkpatrick, S.; Gellat, C.D.; Vecchi, M.P. Optimization by Simulated Annealing. Science 1983, 220, 671–680. [Google Scholar] [CrossRef]
- Bedekar, P.P.; Bhide, S.R.; Kale, V. Optimum Coordination of Overcurrent Relay Timing Using Simplex Method. Electr. Power Compon. Syst. 2010, 38, 1175–1193. [Google Scholar] [CrossRef]
- Bedekar, P.P.; Bhide, S.R.; Kale, V.S. Optimum coordination of over current relays in distribution system using dual simplex method. In Proceedings of the 2009 2nd International Conference on Emerging Trends in Engineering and Technology (ICETET), Nagpur, India, 16–18 December 2009. [Google Scholar]
- Bedekar, P.P.; Bhide, S.R.; Kale, V.S. Optimum time coordination of overcurrent relays using two phase simplex method. World Acad. Sci. Eng. Technol. 2009, 28, 1110–1114. [Google Scholar]


Publisher’s Note: MDPI stays neutral with regard to jurisdictional claims in published maps and institutional affiliations. |
© 2022 by the authors. Licensee MDPI, Basel, Switzerland. This article is an open access article distributed under the terms and conditions of the Creative Commons Attribution (CC BY) license (https://creativecommons.org/licenses/by/4.0/).