Article

Theoretical and Empirical Verification of Electrical Impedance Matching Method for High-Power Transducers

Department of Electronic Engineering, Kwangwoon University, Seoul 01897, Korea
*
Author to whom correspondence should be addressed.
Electronics 2022, 11(2), 194; https://doi.org/10.3390/electronics11020194
Submission received: 6 December 2021 / Revised: 6 January 2022 / Accepted: 7 January 2022 / Published: 9 January 2022
(This article belongs to the Section Industrial Electronics)

Abstract

:
In our prior study, a systematic approach was used to devise Langevin transducers for high-power applications where the energy efficiency was not considered in the design criteria. In this paper, the impedance matching methods are thus proposed to evaluate what matching topology is appropriate for their use. Both the series inductor scheme and low pass filter composed of a series inductor and shunt capacitor are examined as matching circuits. According to MATLAB simulation, the resonance frequency is seen at 36.79 kHz due to a series L circuit, and its associated impedance is reduced by 70.45% from that of its non-matching condition. The measured resonance frequency is 36.77 kHz and the corresponding impedance is decreased by 59.52%. Furthermore, the acoustic pressure is measured to determine the effect of the matching circuit on the transducer’s actual behavior. The transducer with a series L circuit shows more efficient matching results, 2.28 kPa of positive acoustic pressure is emitted without matching and 3.35 kPa is emitted with a series L element, respectively. As a result, this study demonstrates how to evaluate the influence of matching circuits by using our customized approach rather than commercial SPICE programs, as well as how to experimentally verify the acoustic behavior of high-power Langevin transducers.

1. Introduction

Bolt-clamped transducers, also known as Langevin type transducers, are high-power ultrasonic devices that have been developed for a variety of applications including ultrasonic welders [1,2] and sonochemical mixing processors [3,4]. Such instruments have widely been used because ultrasonic energy from those transducers is safe and powerful enough to provide desirable results. In particular, ultrasonic scalpel and scaling tools have commonly been exploited for medical purposes, e.g., removal of mineral deposits in teeth [5], soft tissue incision [6], and blood vessel sealing [7]. Acoustophoretic energy irradiated from transducers is converted into either mechanical or thermal energy to prompt physical or chemical reactions on those samples. Typical Langevin transducers are composed of a compression bolt, piezoelectric element, tail mass, front mass, and metal horn. A theoretical design method of those transducers used for therapeutic treatment was proposed in our previous work [8], in which the transducer was designed to achieve a specific resonance frequency by combining Mason’s model with an equivalent circuit analysis. More recently, a designed transducer was produced to investigate the effect of bolt-tightening force on its resonance characteristics [9].
In generating sufficient acoustic powers for the thermal ablation of soft tissue, Langevin transducers have conventionally been excited with continuous sinusoidal waves of finite voltage amplitude. Under this circumstance, electrical impedance mismatch between transducers and peripheral equipment frequently creates excessive heat elevation that decreases the transducer’s resonance frequency and ultimately causes the device’s failure [10,11]. In order to ease the overheating problem arising from the mismatch, the use of heat-resistant layers, porous transducer housing, and filling the housing cavity with insulation materials was proposed [12], which provides only temporary remedies. The impedance match is still a more fundamental issue in improving the various functional performances of transducers, particularly power transfer and imaging resolution. Electrical impedance mismatch between transducers and peripheral equipment adversely affects the power conversion from excitation pulsers by reflecting too much energy from those sources, in turn, degrading the transducer’s efficiency [13]. For the enhancement of axial resolution in diagnostic imaging scanners, received echoes from targets need to carry broad bandwidth signals of high sensitivity. Due to energy loss in the transducer’s components along with media attenuation [14], poor mismatch makes the imaging depth much shallower than it is supposed to be. In high frequency imaging for ophthalmology and dermatology, this becomes even worse by significantly missing the content at certain frequencies [15].
In this regard, several impedance matching approaches for ultrasonic transducers have been developed in longitudinal mode. In order to turn an inductive Langevin transducer into a resistive load, for example, a capacitive output impedance driver was designed to operate them at anti-resonance by optimizing the transducer’s driving frequency for loss reduction [16]. For sandwiched transducers, the Smith chart was employed to compensate their reactance and to finally accomplish the resistance tuning. Typically, their input impedance was moved to a point near 50 Ω at the center of the chart by adding a proper series or parallel reactive elements [17]. However, much attention has been paid to impedance characterization with little emphasis on the acoustic pressure measurement, while concrete transducer structures are not explicitly presented. Moreover, commercial SPICE programs are mainly used to quantify the effect of impedance matching on transducer performance.
In order to overcome these drawbacks, in this paper, two types of matching schemes, e.g., series L circuits and LC low pass networks, are examined along with their corresponding transducer configuration as follows.
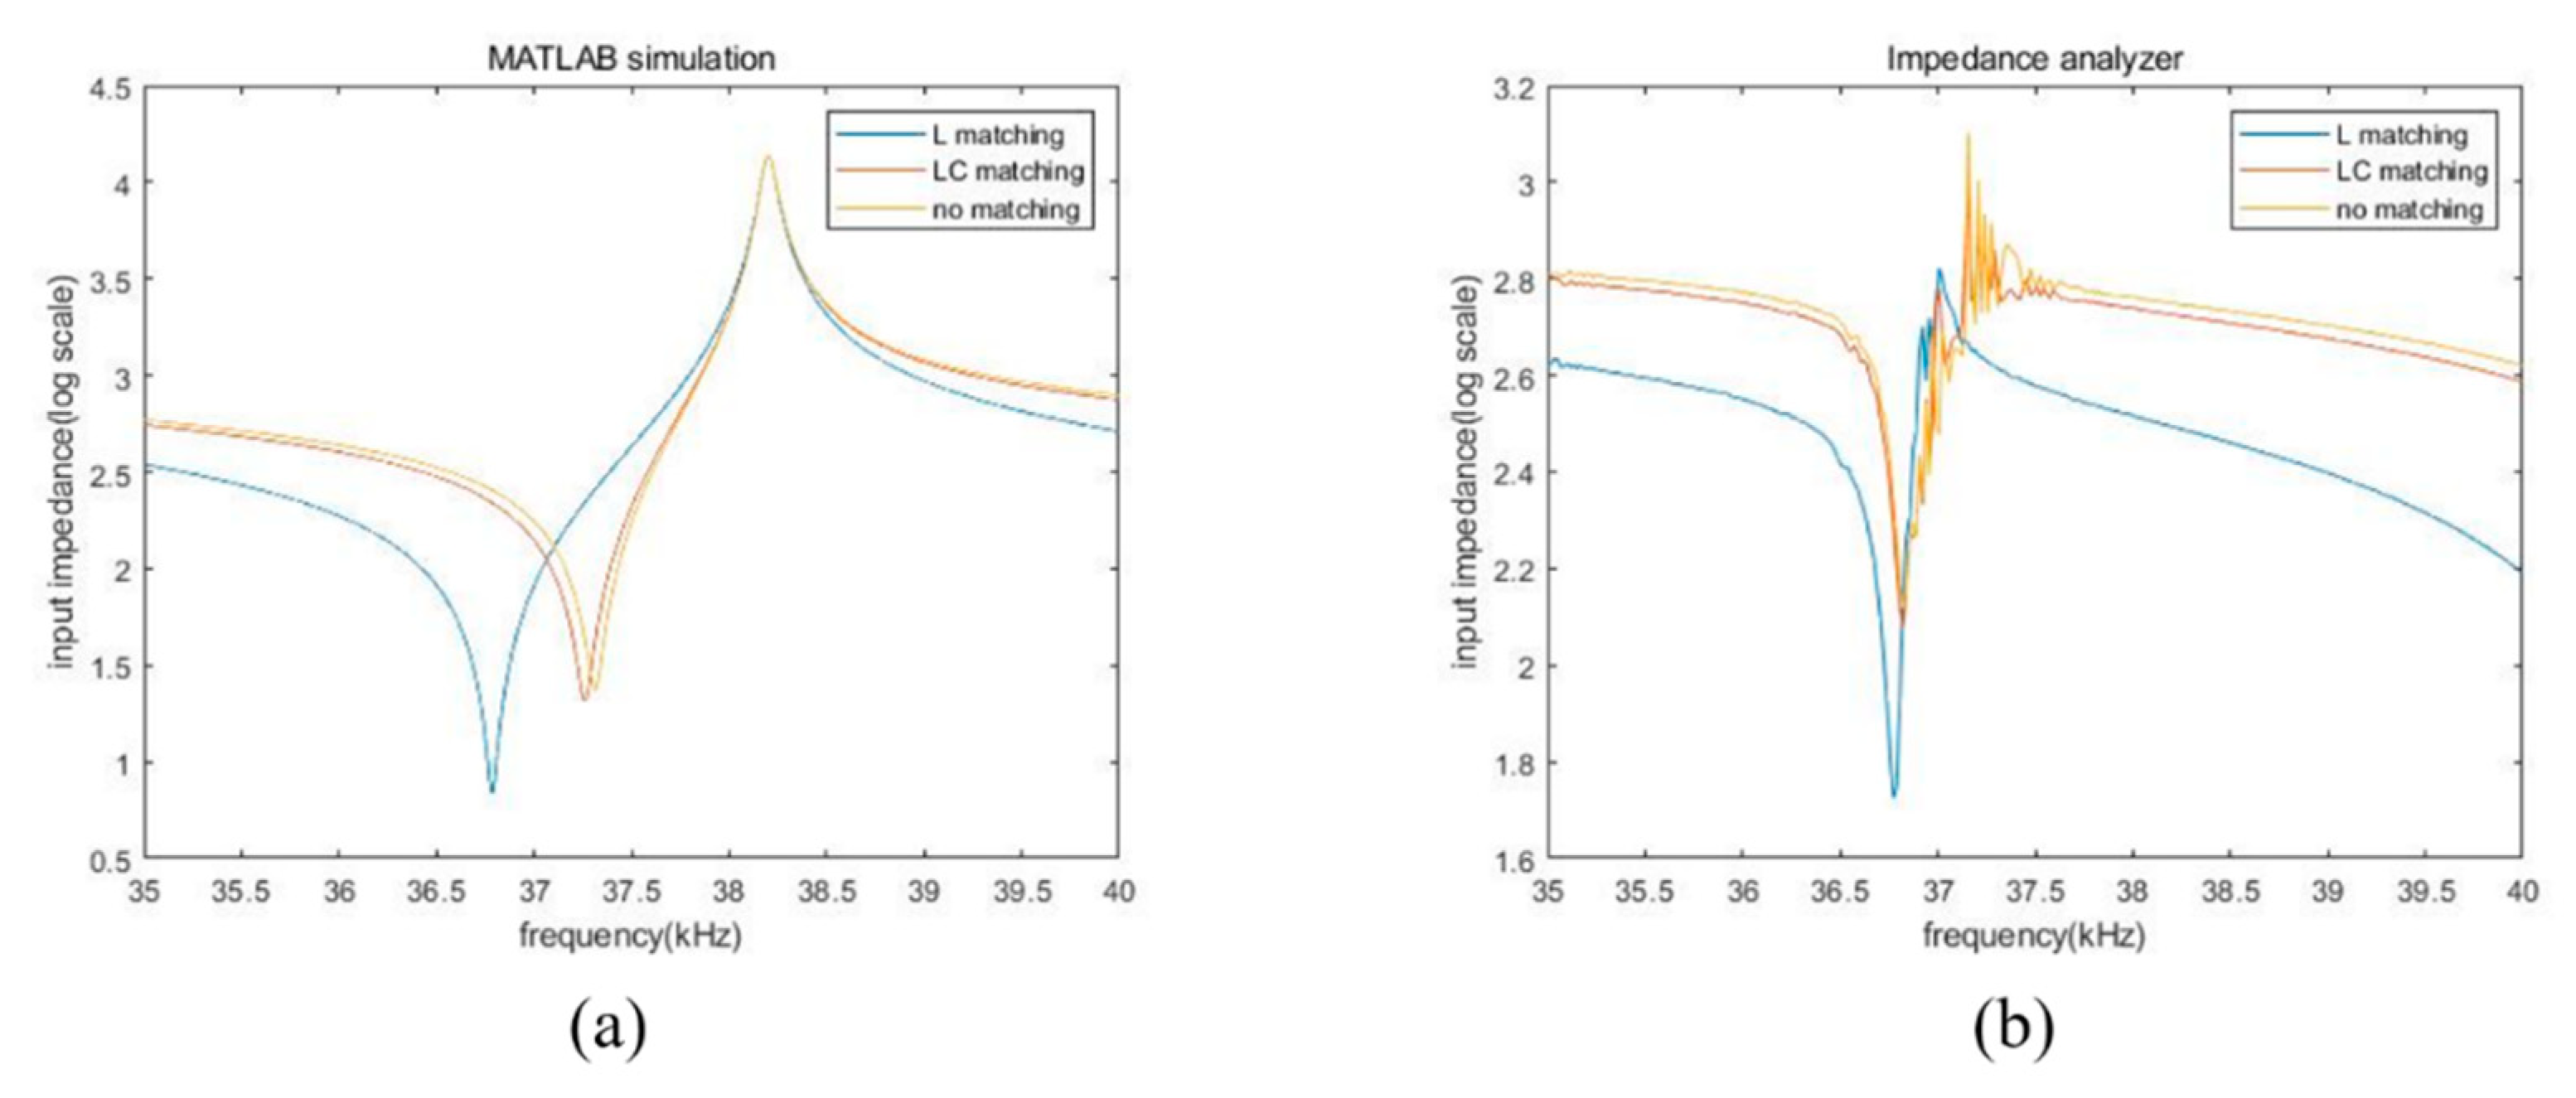
  • Parameters of their circuit components corresponding to each matching circuit are derived based on experimental values probed by the impedance analyzer.
  • To verify the electromechanical characteristics of the matched transducer, our equivalent circuit model is combined with proposed matching circuits.
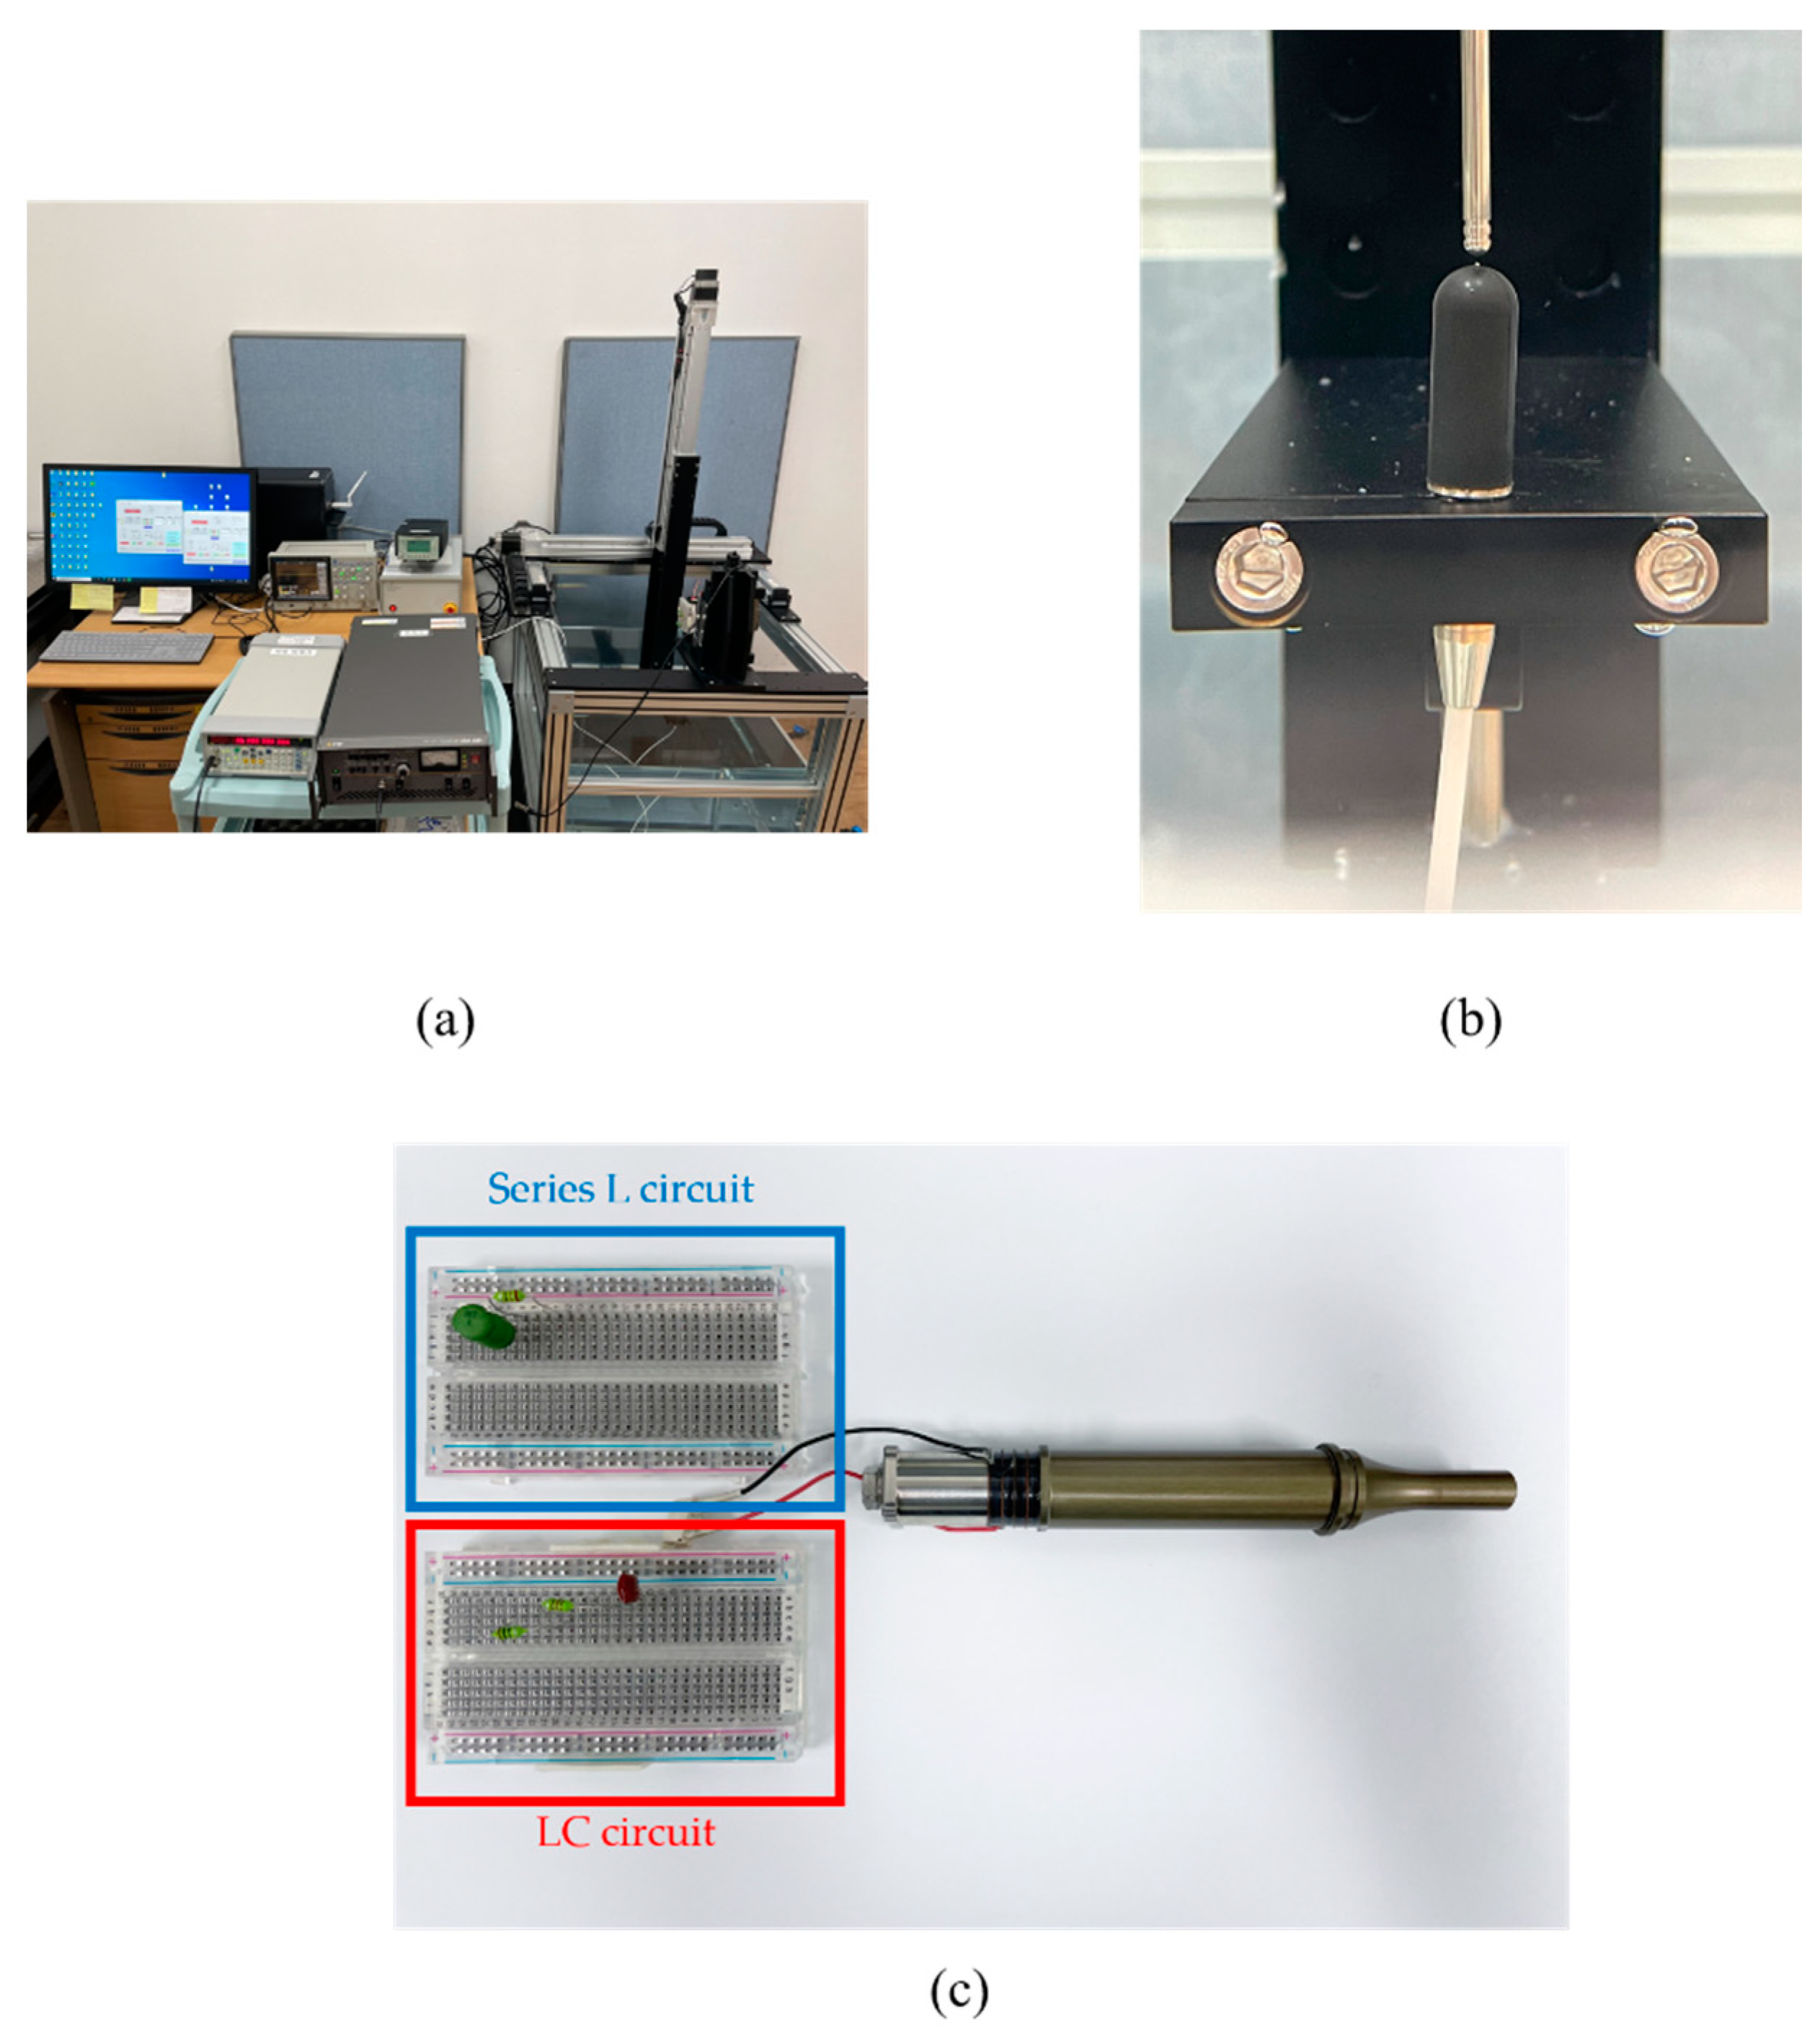
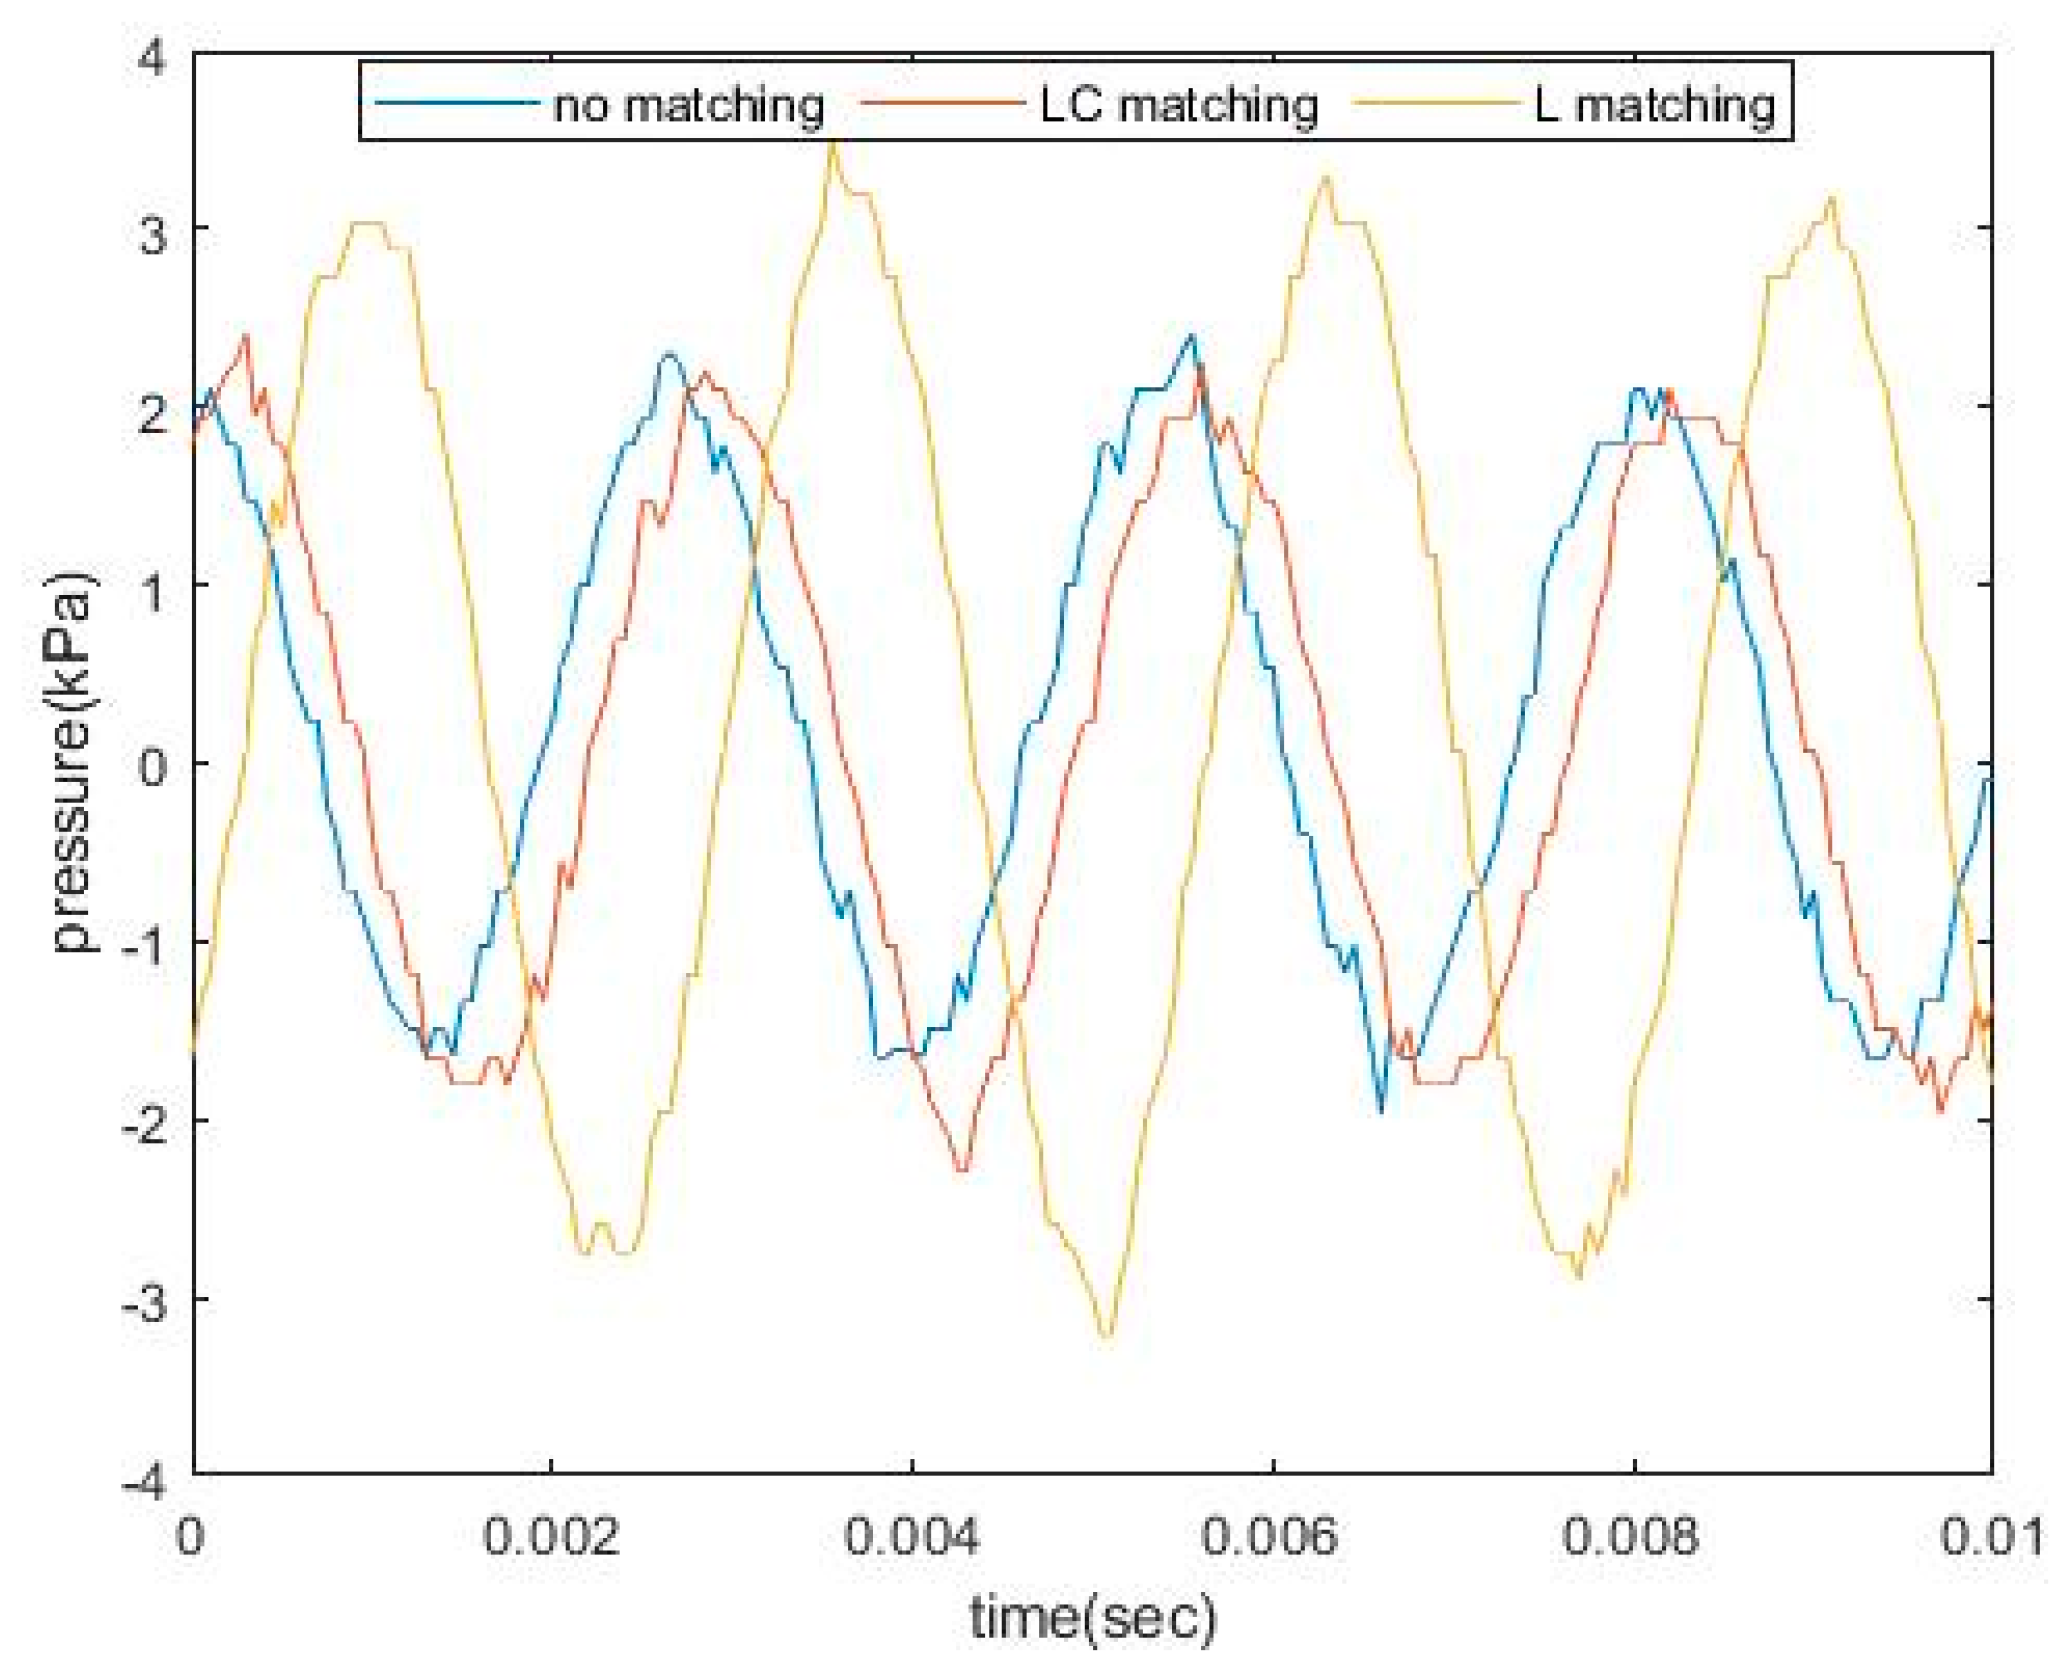
  • A hydrophone system is built to measure the acoustic pressure emitted from impedance-matched transducers for each matching scheme.
  • Mechanical quality factor, Qm, is computed to evaluate the energy efficiency of the transducer.
  • Both simulated and experimental results are compared to demonstrate the capability of our method to quantitatively design appropriate transducers for power generation.
Therefore, both electrical and acoustical behaviors influenced by the matching circuits are reported here to justify our approach for the power enhancement of bolt-clamped transducers.

2. Materials and Methods

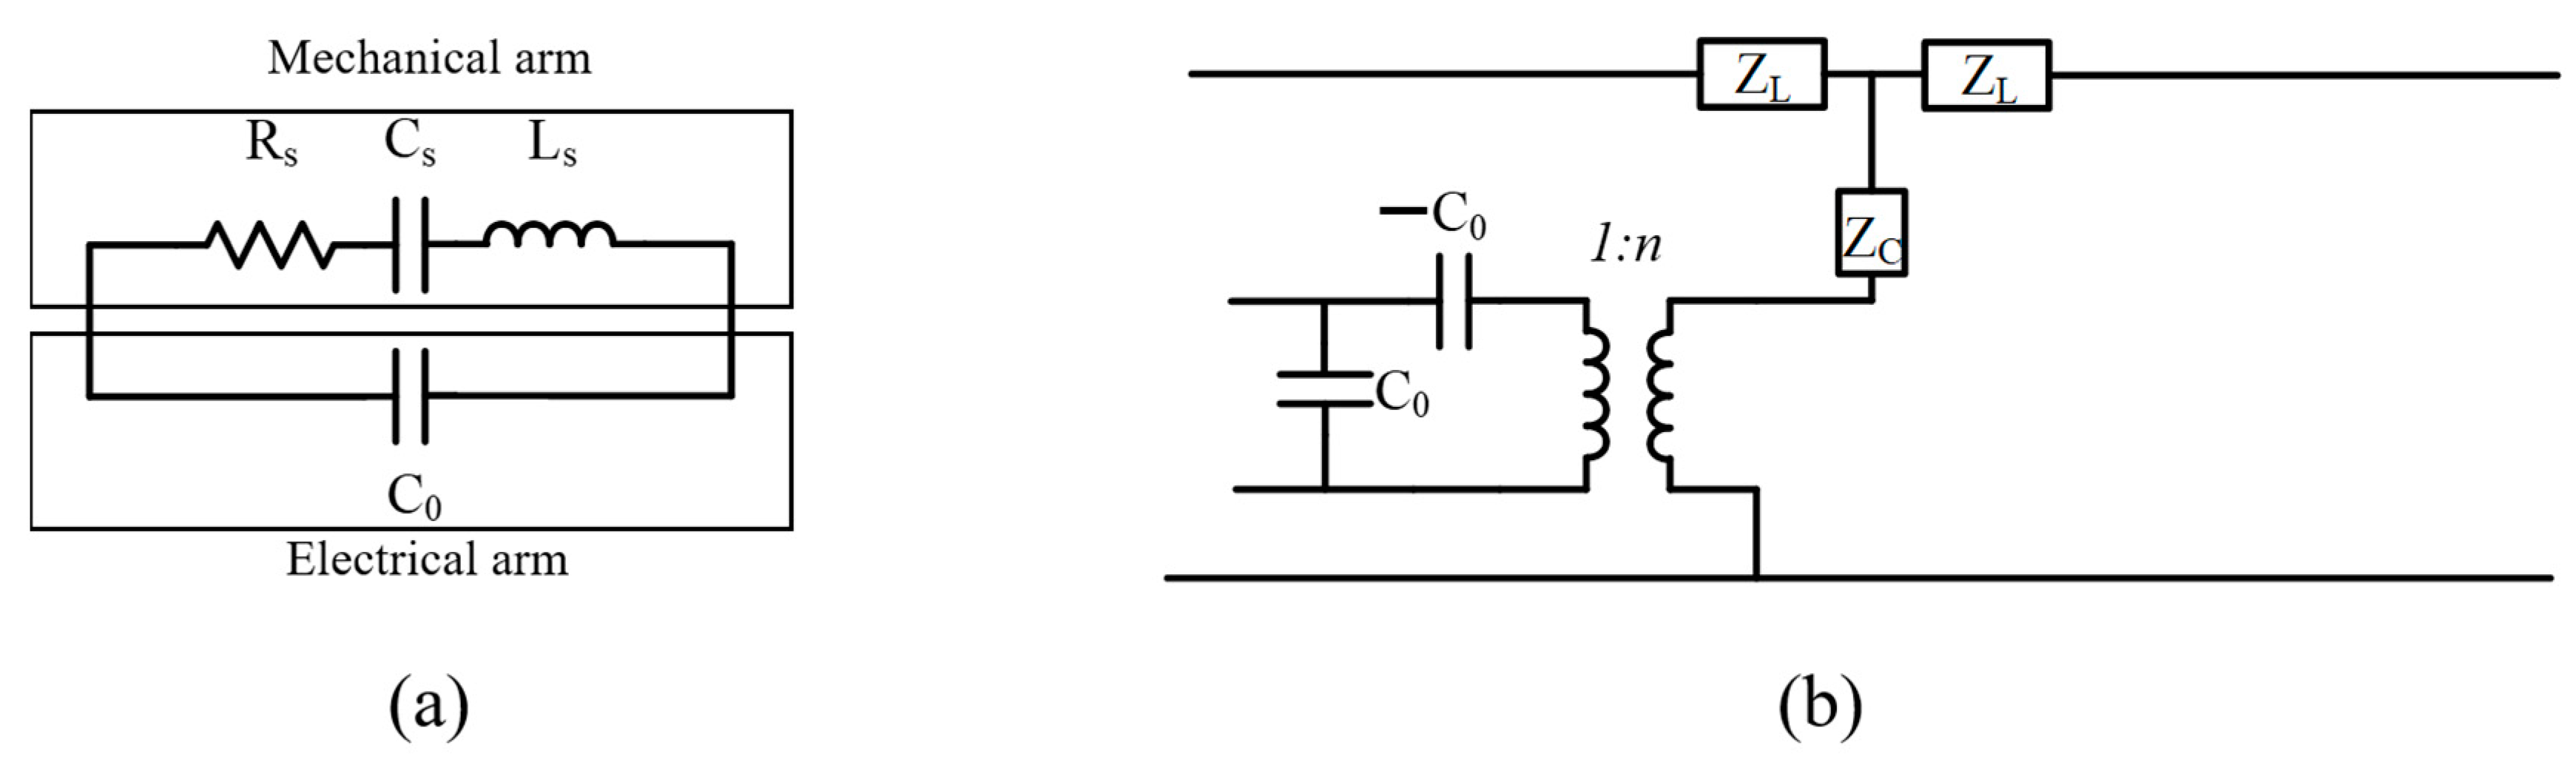
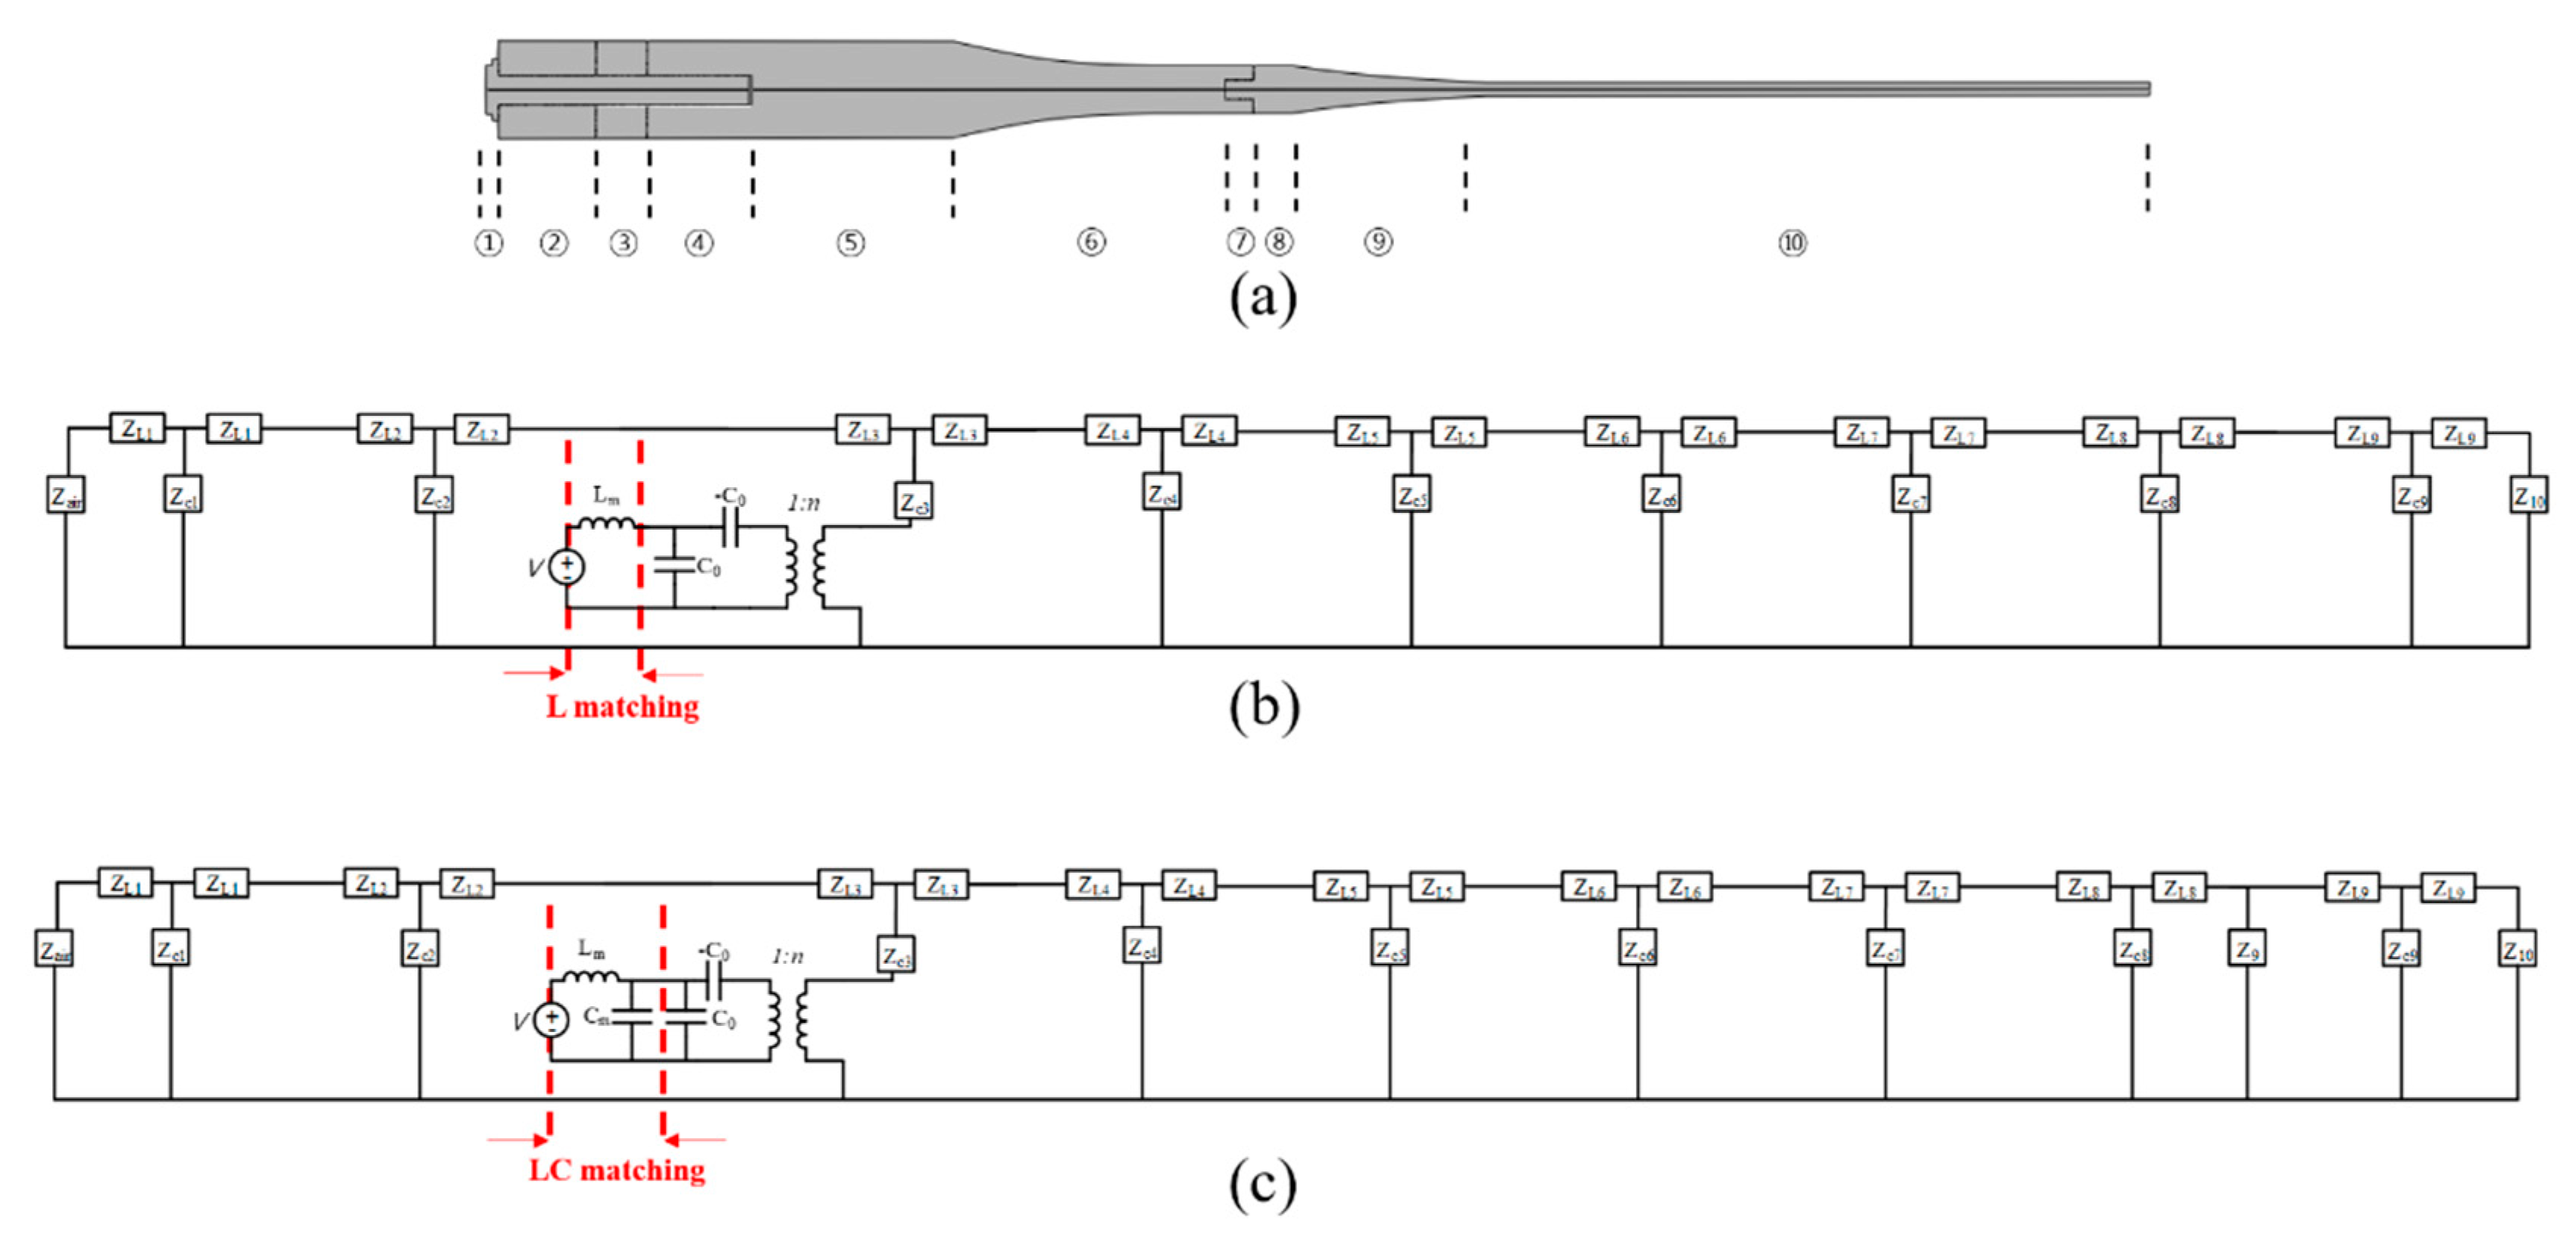
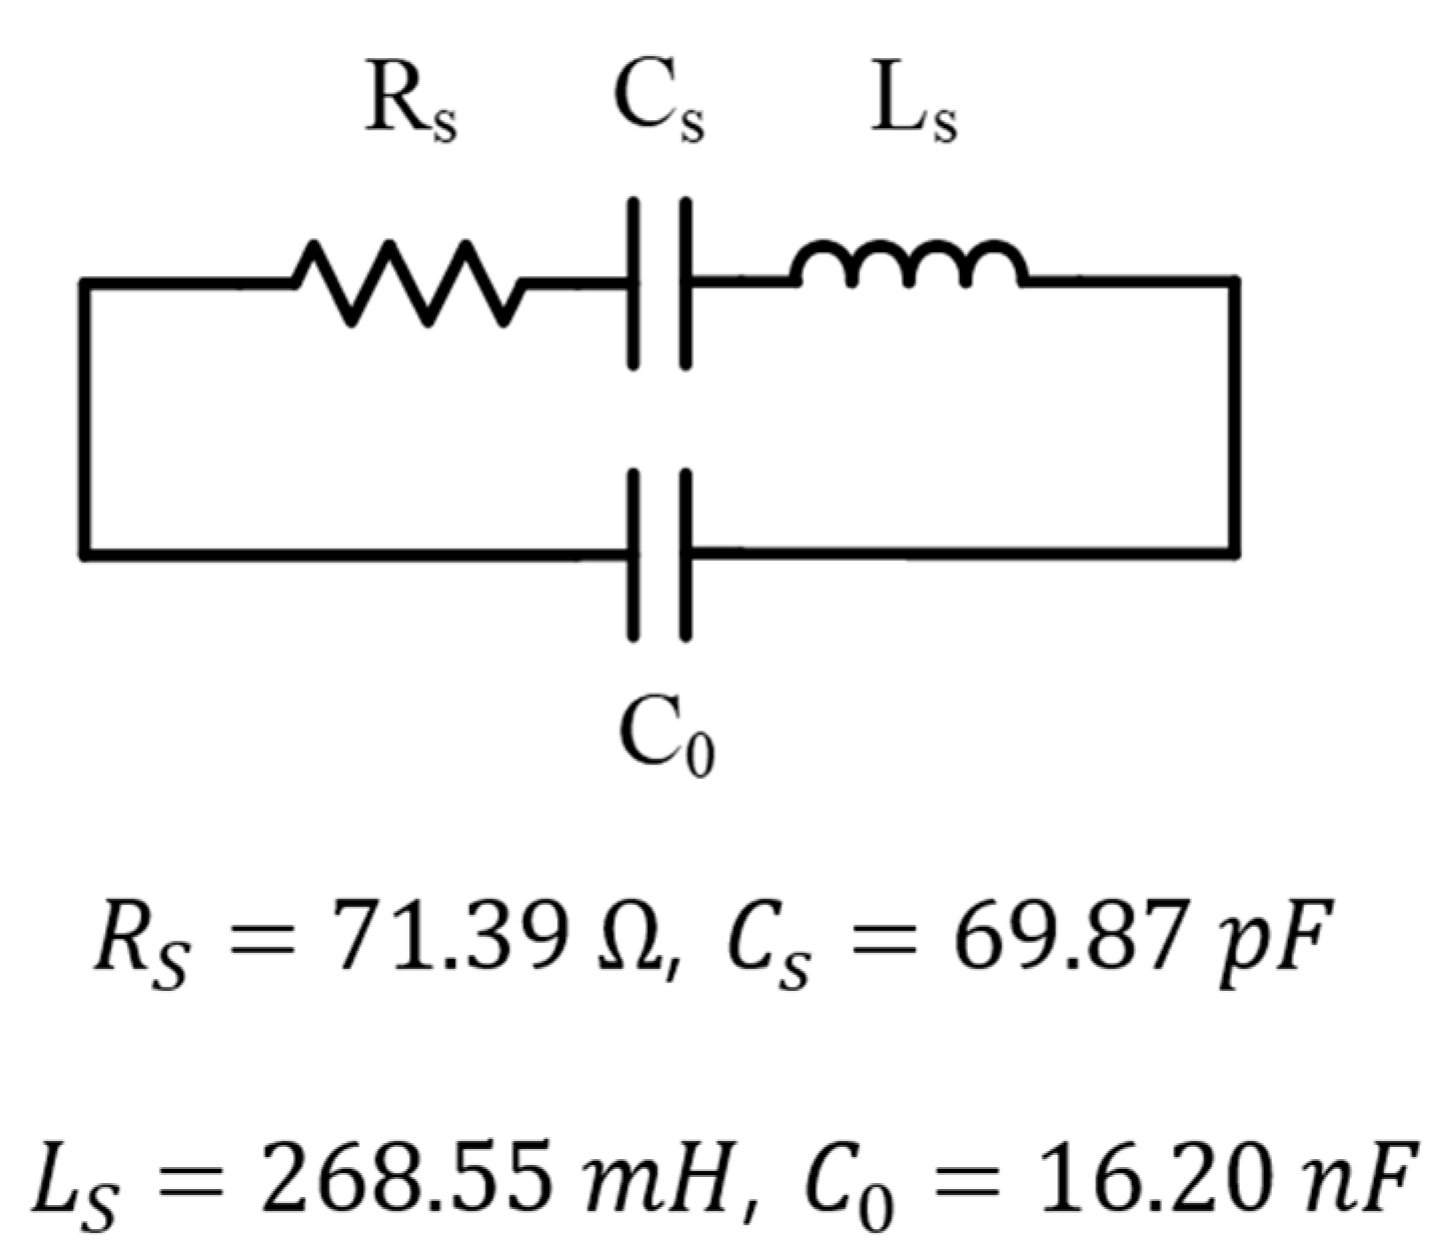
2.1. Equivalent Circuit Models

There are various types of impedance matching methods for ultrasonic transducers, such as the combination of shunt/series inductors [18], series capacitors [19], parallel damping resistances [20], and LC filters [21]. These methods are closely associated with equivalent circuits of transducers for describing complex characteristics of piezoelectric elements where Mason [22], Krimholtz–Leedom–Matthaei (KLM) [23], and Butterworth–Van Dyke (BVD) models [24] are preferred to explain their electromechanical behaviors. In particular, the BVD model has often been referred to represent a transducer with RLC parameters at resonance frequency, fr. Since our Langevin transducer investigated in this study has a single fr at low-frequency range, both BVD and Mason models are used to calculate those lumped elements and to estimate the resonance properties of the transducer over the same frequency range. As shown in Figure 1a, the BVD model is composed of a mechanical arm with a resistor Rs, an inductor Ls, a capacitor Cs in series, and an electrical arm with a parallel capacitor C0.
RS represents radiation and mechanical losses of the transducer. C s and L s model its resonant behavior, and then fr can be calculated by Equation (1) [21].
f r = 1 2 π 1 L S C S
C 0 is an equivalent clamped capacitance of the transducer as expressed by Equation (2) [8].
C 0 = n 0 ε 33 S L ( 1 k t 2 )
n 0 is the number of the piezoelectric element, ε 33 , S, kt, and L are the permittivity, surface area, electromechanical coupling coefficient, and the length of the element, respectively. According to the datasheet of C-203 material from FUJI ceramics, C0 is 17.47 nF (n0: 4, S: 28.59 mm2, L: 5 mm).
In addition, the Mason model consists of an ideal transformer, two capacitors, and three equivalent impedances, as depicted in Figure 1b. Each impedance is calculated by Equations (3) and (4) [25].
Z L = j Z A tan ( k p L / 2 )
Z C = j Z A sin ( k p L )
ZA is the radiation impedance determined by the product of Z0 and the area of the piezoelectric element, where Z0 is the acoustic impedance. kp is the wavenumber equal to angular frequency w divided by the sound speed in the element. The turn ratio n of the transformer in the model is determined by Equation (5), where d33 and s 33 E are the piezoelectric charge coefficient in thickness mode and the elastic compliance, respectively [26].
n = S L d 33 s 33 E
These types of representations are limited to describing the acoustic response, and yet they are still useful for elucidating the impedance characteristics of the transducer. T-shaped equivalent circuit for modeling other passive parts of the transducer is employed to calculate the transducer’s electrical property as presented in [8]. Finally, the impedance matching circuit developed here is paired with this Mason’s electrical port.

2.2. Matching Circuits

Both series inductor and LC filter circuit with series inductance and shunt capacitor are chosen among several matching networks to explore their effect on characteristics of high-power transducers due to their simple structure, cost-effectiveness, and widespread use. Circuit element values for those matching topologies are determined by impedance analyzer (Agilent, 4294A, Santa Clara, CA 95051, USA). The matching procedure is illustrated in Figure 2.

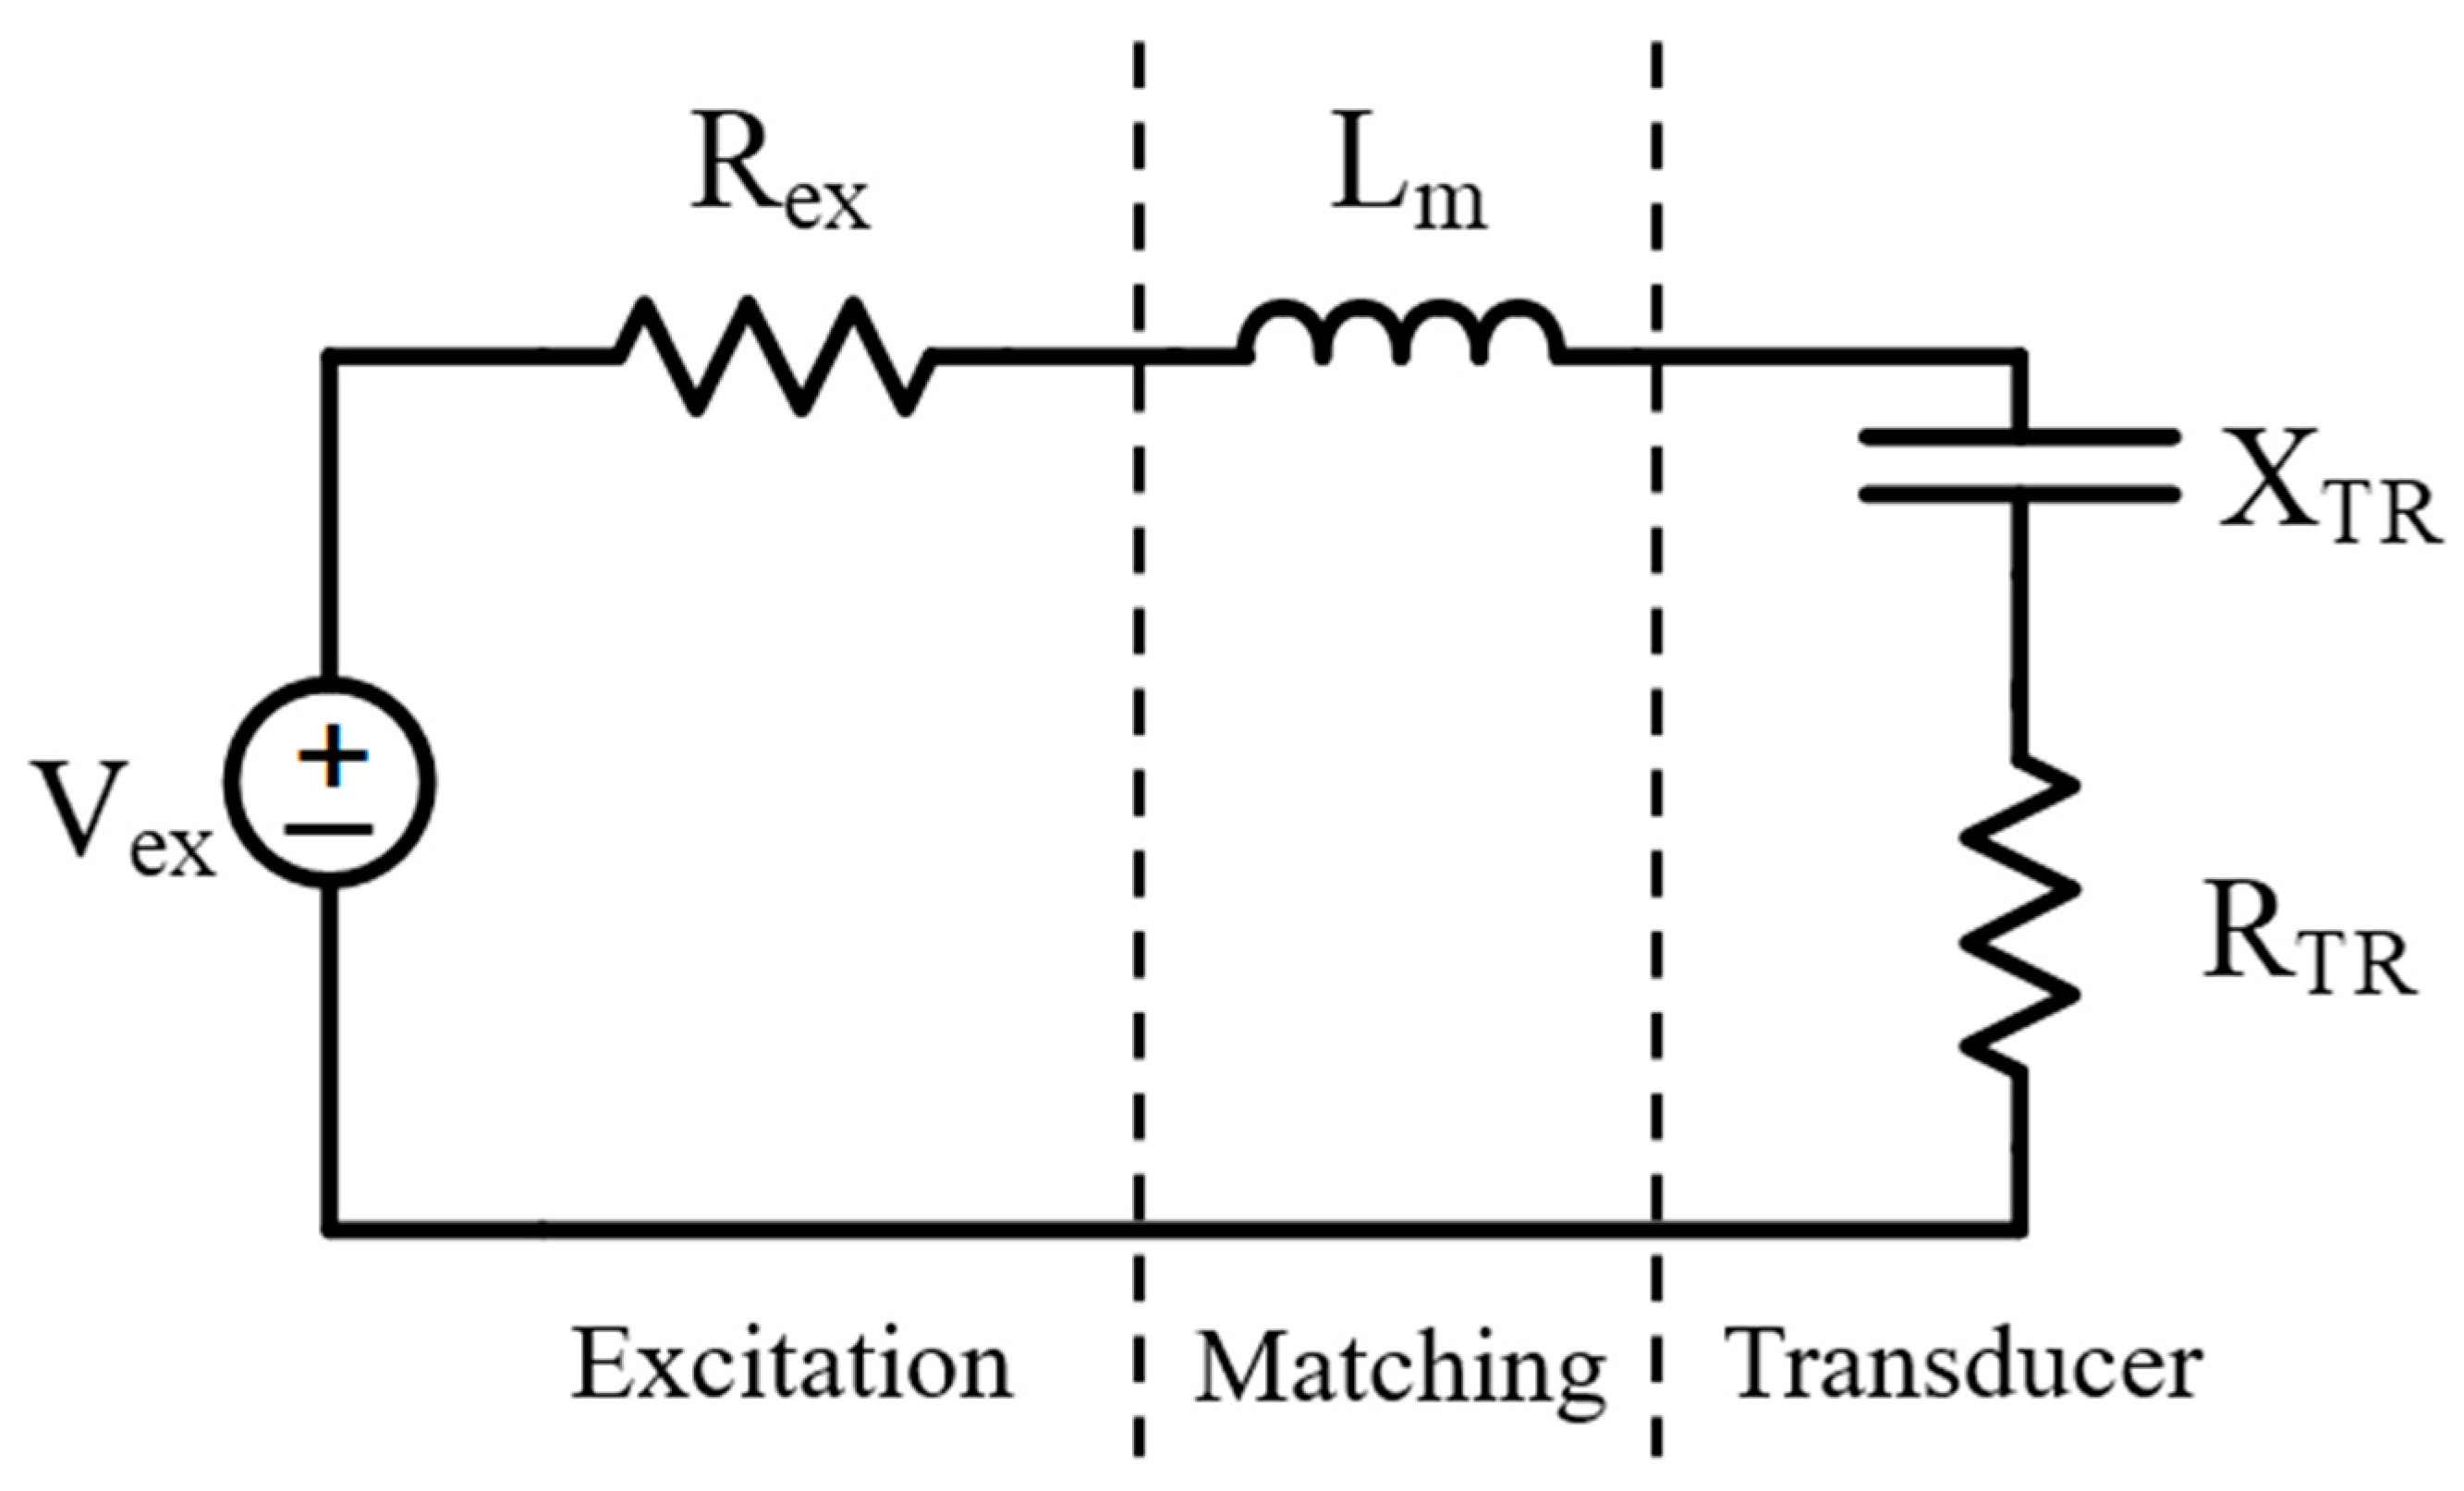
2.2.1. Series L Circuit
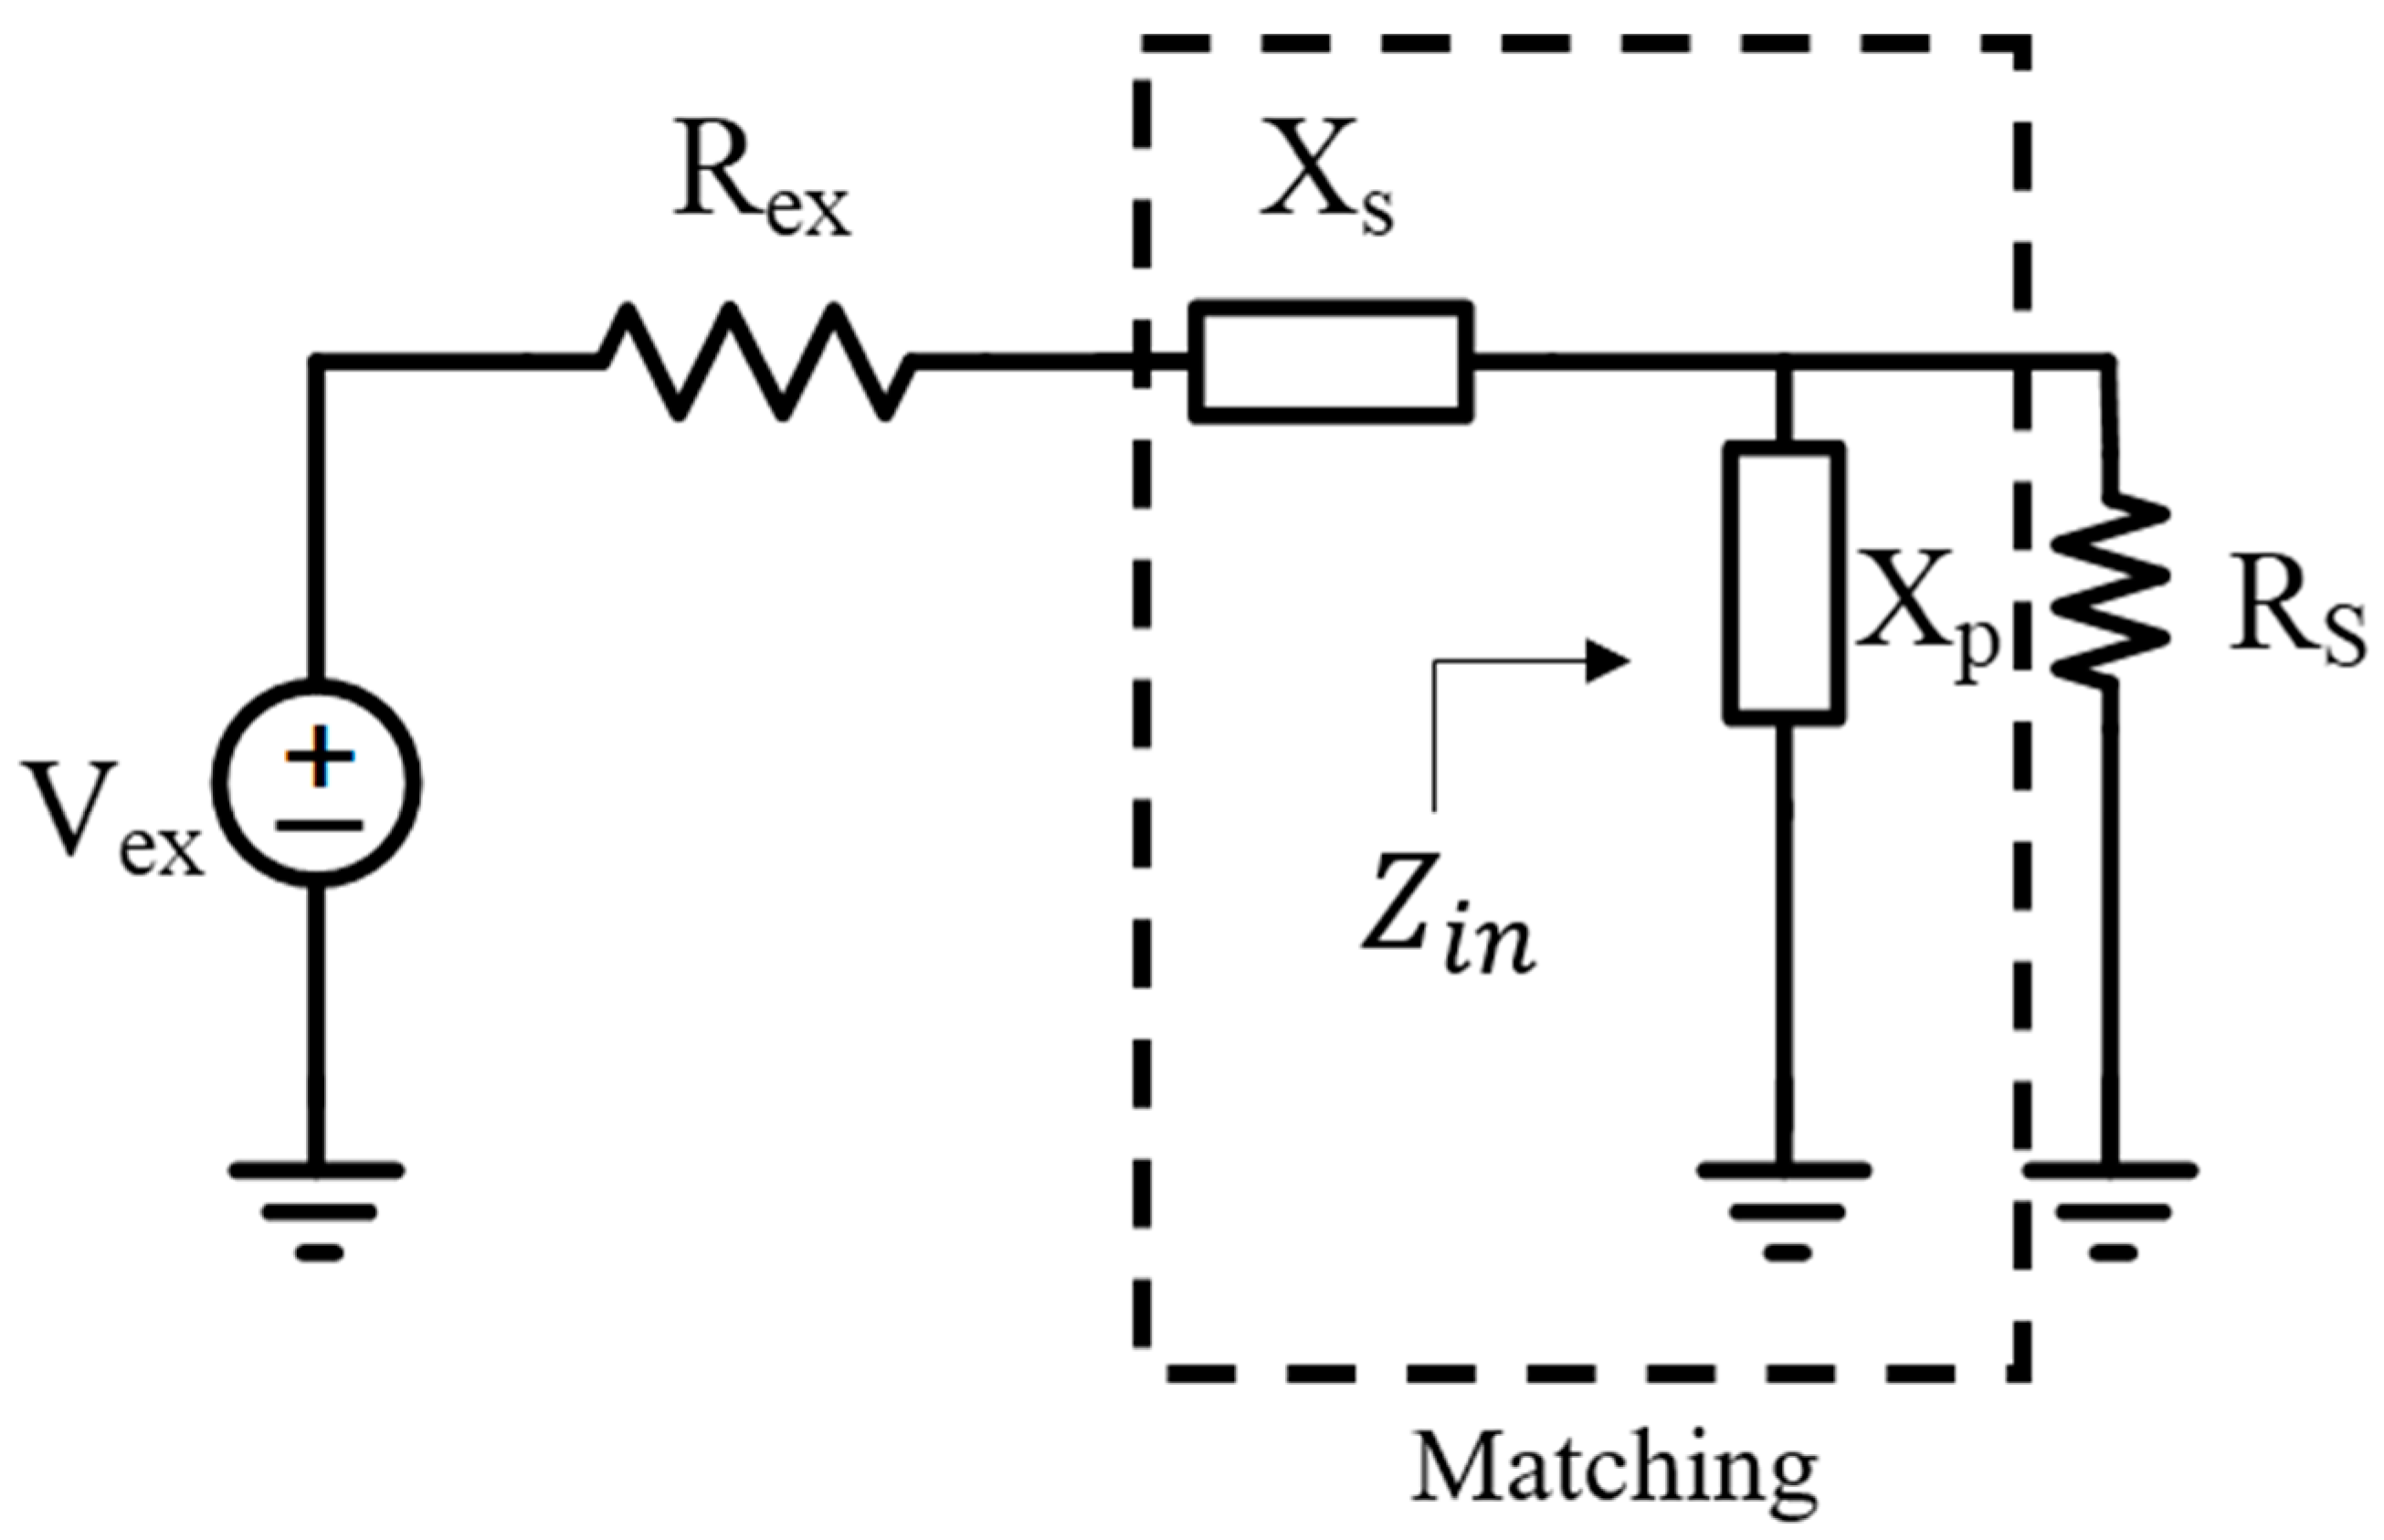
The inductance for series L matching circuit is derived by the reactance of the transducer. At fr, the impedance of the transducer modelled by BVD circuit is capacitive due to the parallel capacitance C0 [27]. To compensate the capacitive reactance generated by the clamped capacitance, a series inductor is added. The total impedance Z of the transducer in BVD model is then derived by Equation (6). The series RS, LS, CS, and parallel C0 are combined to compute the total impedance [19].
Z = ( R s + 1 j ω C S + j ω L s ) | | ( 1 j ω C 0 ) = j w R s C s ω 2 C s L s + 1 ω 2 C s C 0 R s + 1 j ω C S + j ω L s + 1 j ω C 0 = ω 2 C S L s 1 j ω ( C S L s ) ω 2 R S C S C 0 + j ω { ω 2 C 0 C S L S ( C S + C 0 ) } = R T R ( ω ) + j X T R ( ω )
RTR and XTR are the resistance and reactance components, respectively, of Z at angular frequency ω. Matching conditions for maximum acoustic output and optimal series inductance LS are then represented in Equations (7) and (8).
X L ( ω ) = | X T R ( ω ) |
L S = | X T R ( ω ) | ω
A complete circuit consisting of the transducer, the series inductor, and the excitation source is shown in Figure 3. Note that the output impedance of the source is assumed to be purely resistive Rex.

2.2.2. LC Circuit

By simplifying the BVD model at fr, the transducer can be replaced as RS in parallel with C0. This simplified model can be considered as a load seen from the excitation circuit. According to transmission line theory, L-section matching networks are utilized to guarantee the maximum power transfer for this type of circuit [28,29]. This matching topology is the simplest lumped matching method as it consists of only two lumped components. As the measured value of RS is higher than the impedance of the excitation circuit, 50 Ω, LC network as a matching circuit is preferred [30]. The designed matching circuit is shown to be a low pass filter configuration, as shown in Figure 4. For the sake of simplicity, the original clamped capacitance will be included in final step.
The electrical input impedance is determined by Equation (9).
Z i n = ( R S | | j X P ) = R S j X P R S + j X P = R S X p 2 R s 2 + X p 2 + j R s 2 X P R s 2 + X p 2
In matching condition, the transducer seen from the source can be considered as a purely resistive element by cancelling out its reactive component of Zin. Thus, Rex and Xs are defined by putting the opposite sign to the imaginary part of Zin as Equations (10) and (11).
R e x = R S X p 2 R s 2 + X p 2
X S = R s 2 X P R s 2 + X p 2
The relations between each parameter can be derived as Equations (12) and (13).
R S R e x = ( R S X P ) 2 + 1
| X S R e x | = | R S X P | = Q = R S R e x 1
The parameter Q of the whole circuit is only validated under R e x < R S condition. Consequently, the inductance of the series inductor and the capacitance of the shunt capacitor are determined by Equations (14) and (15), respectively.
X S = ω L m = R e x Q
X P = 1 ω C m = R S Q C 0
Note that the clamped capacitance of the transducer should be included in calculation of Equation (15).
The cross-sectional view of our transducer is shown in Figure 5a, where ① is a central bolt, ② a tail mass, ③ a piezoelectric layer, ④~⑥ a front mass including an exponential horn, and ⑦~⑩ an attachable rod numbered from left to right. The central bolt plays a crucial role in not only clamping components but also maintaining the piezoelectric compression mode during operation. The corresponding equivalent circuit is employed to estimate the effect of matching circuit on the transducer characteristics via MATLAB simulation. Then, we compute the numerical data, including fr, anti-resonance frequency fa, minimum and maximum impedances, and mechanical quality factor Qm according to Equation (16). In particular, Qm describes the mechanical performance of the transducer such as mechanical loss or efficiency [31]. It is, thus, crucial to prevent the loss by accomplishing high Qm with little energy leakage. In surface acoustic wave (SAW) resonators, it was shown that their sensitivities can be improved by selecting proper electrode materials such as copper, silver, and tungsten to obtain higher Qm [32]. Several approaches including external feedback control [33] and thermal-piezoresistive pumping [34] have also been developed for micro-electromechanical resonators to modify their Qm by providing them with external time-varying or static energy sources.
Q m = 1 4 π Z f r C 0 ( f a f r )
In Figure 5b,c, complete equivalent circuits including our matching models are represented to estimate the frequency response of the impedance.

2.3. Experimental Setup

Pressure measurement system in Figure 6a is composed of a hydrophone sensor (8103, Bruel & Kjaer, Naerum, Denmark), a pre-amplifier (2692-A-0S1, Bruel & Kjaer, Naerum, Denmark), an oscilloscope (DS-5652, IWATSU, Kugayama, Japan), and a water tank with motorized stage. The distance between the hydrophone and the transducer tip is 1 mm in Figure 6b. The pressure is measured by the sensor with a resolution of 10 μV/Pa and the recorded signal is shown by the oscilloscope. The time interval between each data point is set to 10 μs for data acquisition and the number of data are 1002. To protect matching circuit elements in Figure 6c, the voltage amplitude first starts with lowest level and is then gradually increased from 50 Vpp to 100 Vpp with 10 Vpp apart.

3. Results and Discussion

Numerical values of the BVD model corresponding to our fabricated transducer were investigated with the impedance analyzer. The measured results of Rs, CS, LS, and C0 were 71.39 Ω, 69.87 pF, 268.55 mH, and 16.20 nF, respectively. There was an error in C0 between the calculated and measured value is 1.26 nF. This can readily be understood since the electrodes located between the piezoelectric elements have finite thickness and thus undesirable parasitic capacitance may exist [35]. As a result, the measured capacitance is less than that of our theoretical model. In fact, such interelectrode capacitance can be reduced with thin electrode coating by taking advantage of ultra-small sized particles, e.g., nano-Ag pastes [36,37]. Figure 7 represents the BVD model together with the measured values.
fr with the minimum impedance value of 131.36 Ω was 36.82 kHz, close to the value calculated with Equation (1), 36.87 kHz. Therefore, the measured numerical parameters are considered to be reasonable. According to Equation (6), the resultant reactance of the transducer was 244.62 Ω for the series L matching circuit and, in turn, the necessary inductance derived from Equation (8) was 1.2 mH. In the case of the LC matching scheme, the series inductance and shunt capacitance were obtained from Equations (14) and (15), 0.13 mH and 22 nF, respectively. Using these components, we connected each matching circuit to the transducer and analyzed the electrical input impedance through a frequency sweep. Both simulation and experimental results are compared in Figure 8.
Under non-matching conditions, the simulation results in Figure 8a showed that fr and fa were found at 37.31 kHz and 38.20 kHz, with corresponding impedances of 23.59 Ω and 13.7 kΩ. According to Equation (16), the corresponding Qm was 217.27. Similarly, the matching effect on the transducer was further simulated for the LC circuit and series L matching cases. fr, fa, impedances, and Qm for the LC topology were 37.26 kHz, 38.20 kHz, 20.67 Ω, 13.7 kΩ, and 234.51, respectively, whereas they were 36.79 kHz, 38.20 kHz, 6.97 Ω, 13.7 kΩ, and 461.66, respectively, for the series L matching. Meanwhile, the impedance spectrum acquired from the impedance analyzer is plotted in Figure 8b. When the LC network was applied, the measured fr and fa were the same as their non-matching values of 36.82 kHz and 37.16 kHz, respectively, whereas the series L matching results indicated that each frequency was 36.77 kHz and 37.01 kHz, respectively. In addition, the minimum impedance was reduced from 131.36 Ω to 120.25 Ω, and 53.17 Ω in each matching circuit. The resultant Qm was 111.95, 122.30, and 394.79. In earlier studies, various materials were electroplated for SAW resonators to enhance Qm. For example, Qm was 1.4 × 10⁴ at 1.9 GHz with silver electrode, while it was 5.5 × 10³ at 925 MHz with tungsten [32]. For cantilevers of atomic force microscopy (AFM), it varied from 3.5 × 10⁴ to 2 × 10⁵ at 75 kHz through 300 kHz [38]. In comparison with our results, a much higher Qm was exhibited for their applications, particularly in SAW devices at a range of hundreds of MHz to GHz. Furthermore, a spurious resonance, also called parasitic resonance, was observed in the absence of matching, and LC network conditions were drastically reduced when the series inductor was connected. The above results are summarized in Table 1 and Table 2.
In the MATLAB simulation, the LC network and the series L element decreased the impedance at fr by 12.38% and 70.45%, respectively. The estimated Qm value was increased by 17.24 and 244.39, respectively, when compared to the non-matching case. Similarly, experimental results showed that the minimum impedance was reduced by 8.46% and 59.52%, respectively. The computed Qm was also improved by 10.34 and 282.38, respectively. Since many variables affecting the input electrical impedance are neglected in our equivalent circuit model, e.g., electrode thickness, complex piezoelectric properties, and shear vibration of long rods, the discrepancy in the impedance may exist between the simulation and test. Although there are mismatches in precise impedance magnitudes, the effect of each matching condition on the numerical results is similar in both tables. Typically, the series L topology is more efficient in electrical matching, demonstrating higher Qm than that of the LC matching. Since the stacked-piezoelectric layer is shown as the capacitive device, a pure inductive component can be employed to compensate for its capacitive characteristics. Moreover, the LC filter topology preferred for use in broadband transducers may not be suitable for high-power emitting transducers because its spectral components are likely to lose a considerable amount of energy over a wide frequency range. Hence, the use of a series L matching circuit is reasonable for high-power transducers at a range of tens of kHz. It is worth noting that it is possible to characterize impedance-matched power transducers via our analytical model, rather than commercial SPICE programs.
In order to evaluate the matching effect on acoustic behavior, the pressure from the transducer was measured with the hydrophone sensor immersed in a water tank. Voltage amplitudes of received signals were transferred to a PC and subsequently converted to their corresponding pressure via calibration data provided by the sensor manufacturer. Table 3 shows that the voltage gains of L matching are steadily greater than those of LC matching during the test. The measured pressure under 100 Vpp excitation is depicted in Figure 9. The maximum positive pressure is 3.35 kPa with the series L matching while the minimum positive value is 2.41 kPa in both LC topology and non-matching condition. In each case, the absolute values of negative pressure are detected as 3.21 kPa, 2.28 kPa, and 1.96 kPa, respectively. The peak-to-peak pressures are 6.46 kPa, 4.69 kPa, and 4.24 kPa, respectively, proportional to the acquired Qm.
The pressure depending on the driving voltage is given in Figure 10. Both maximum negative and positive pressures are consistently greater in the series L matching than those in other conditions, as seen in Figure 10a,b, which can be expected from the voltage gain results. Except for 70 Vpp and 80 Vpp, the peak-to-peak pressure for the LC case is slightly higher than that for the unmatched condition, as shown in Figure 10c. These results clearly indicate that the impedance matching improves the acoustic performance of the transducer.

4. Conclusions

We investigated impedance matching networks to improve the efficiency of high-power Langevin transducers. Among various types of equivalent circuits, the BVD and the Mason models were employed to calculate their lumped circuit elements and to estimate the resonance characteristics. As matching circuits, a series inductor circuit and low pass LC configuration were chosen. By using an impedance analyzer, the necessary components for series L and LC circuits were determined and added to our theoretical model of the fabricated transducer. Subsequently, the measured impedance of the transducer combined with the matching circuit was investigated in comparison with that of the simulation results. According to both simulation and experimental data, the series L matching network was found to be more suitable for impedance matching, leading to an increase in Qm. It is demonstrated that our equivalent circuit corresponding to the transducer can be useful with the matching network to characterize the impedance over a range of tens of kHz. Through the hydrophone system, the effect of the matching condition on the actual acoustic pressure in water was evaluated. The transducer with a series L circuit showed the most efficient matching results. Despite the slight increment in Qm, the LC scheme also represented an improved peak-to-peak pressure as compared to that of the unmatched condition. For future works, other impedance matching techniques can be explored further by considering the cable effect on the transducer performance based on transmission line theory [39] and a transformer [40], or by taking advantage of piezocomposite ceramics with modified clamped dielectric permittivity via volume ratio change [41].

Author Contributions

Conceptualization, J.L. and J.K.; methodology, J.K.; validation, J.L. and J.K.; formal analysis, J.K.; investigation, J.L.; writing—original draft preparation, J.K.; writing—review and editing, J.L. All authors have read and agreed to the published version of the manuscript.

Funding

This work was supported by the National Research Foundation of Korea (NRF) grant funded by the Korea government (MSIT) (No. NRF-2020R1F1A1074406 and No. NRF-2020R1A6A3A13070090). In addition, the work reported in this paper was conducted during the sabbatical year of Kwangwoon University in 2017.

Conflicts of Interest

The authors declare no conflict of interest.

References

  1. Milewski, A.; Kluk, P.; Kardyś, W.; Kogut, P. Modelling and designing of ultrasonic welding systems. Arch. Acoust. 2015, 40, 93–99. [Google Scholar] [CrossRef] [Green Version]
  2. Kogut, P.; Milewski, A.; Kardy, W.; Kluk, P.; Gawry, P. New multimode sonotrodes models designed for rotary ultrasonic welding systems. Acta Phys. Pol. A 2013, 124, 474–478. [Google Scholar] [CrossRef]
  3. Hussain, M.; Janajreh, I. Acousto-chemical analysis in multi-transducer sonochemical reactors for biodiesel production. Ultrason. Sonochem. 2018, 40, 184–193. [Google Scholar] [CrossRef]
  4. Patil, U.; Mokashe, N.; Shaha, J.; Arthekar, S.; Jagatap, H. Ultrasound-assisted improvements in biocatalytic activity and production of organic-solvent stable protease from Bacillus circulans MTCC 7942. Ultrason. Sonochem. 2018, 40, 201–205. [Google Scholar] [CrossRef]
  5. Price, G.; Tiong, T.; King, D. Sonochemical characterisation of ultrasonic dental descalers. Ultrason. Sonochem. 2014, 21, 2052–2060. [Google Scholar] [CrossRef] [Green Version]
  6. Ngo, Y.; Ripin, Z.; Yi, C.; Zaini Ridzwan, M.; Mamat Ali, W.; Awang, B. Development of an ultrasonic scalpel. IOP Conf. Ser. Mater. Sci. Eng. 2020, 815, 012014. [Google Scholar] [CrossRef]
  7. Newcomb, W.; Hope, W.; Schmelzer, T.; Heath, J.; Norton, H.; Lincourt, A.; Heniford, B.; Lannitti, D. Comparison of blood vessel sealing among new electrosurgical and ultrasonic devices. Surg. Endosc. 2009, 23, 90–96. [Google Scholar] [CrossRef]
  8. Kim, J.; Lee, J. Theoretical resonance analysis of Langevin transducers with equivalent circuit models for therapeutic ultrasound. J. Electr. Eng. Technol. 2019, 14, 2437–2445. [Google Scholar] [CrossRef]
  9. Kim, J.; Lee, J. Parametric study of bolt clamping effect on resonance characteristics of Langevin transducers with lumped circuit models. Sensors 2020, 20, 1952. [Google Scholar] [CrossRef] [Green Version]
  10. Upadhye, V.; Agashe, S. Effect of temperature and pressure variations on the resonant frequency of piezoelectric material. Meas. Control 2016, 49, 286–292. [Google Scholar] [CrossRef]
  11. Olfert, J.; Checkel, M.; Koch, C. Acoustic method for measuring the sound speed of gases over small path lengths. Sci. Instrum. 2007, 78, 054901. [Google Scholar] [CrossRef] [Green Version]
  12. Pershevska, L.; Drozdenko, O.; Drozdenko, K.; Leiko, O. Study of the influence of the housing on the cooling efficiency of the piezoceramic electroacoustic Langevin-type transducer. Technol. Audit Prod. Reserves 2021, 3, 50–55. [Google Scholar] [CrossRef]
  13. Cannata, J.; Ritter, T.; Chen, W.; Silverman, R.; Shung, K. Design of efficient, broadband single-element (20–80 MHz) ultrasonic transducers for medical imaging applications. IEEE Trans. Ultrason. Ferroelectr. Freq. Control 2003, 50, 1548–1557. [Google Scholar] [CrossRef] [PubMed]
  14. Lockwoood, G.; Turnball, D.; Christopher, D.; Foster, F. Beyond 30 MHz [applications of high-frequency ultrasound imaging]. IEEE Eng. Med. Biol. Mag. 1996, 15, 60–71. [Google Scholar] [CrossRef]
  15. Augustine, L.; Andersen, J. An algorithm for the design of transformerless broadband equalizers of ultrasonic transducers. J. Acoust. Soc. Am. 1979, 66, 629–635. [Google Scholar] [CrossRef]
  16. Dong, X.; Yuan, T.; Hu, M.; Shekhani, H.; Maida, Y.; Tou, T.; Uchino, K. Driving frequency optimization of a piezoelectric transducer and the power supply development. Rev. Sci. Instrum. 2016, 87, 105003. [Google Scholar] [CrossRef]
  17. Yang, Y.; Wei, X.; Zhang, L.; Yao, W. The effect of electrical impedance matching on the electromechanical characteristics of sandwiched piezoelectric ultrasonic transducers. Sensors 2017, 17, 2832. [Google Scholar] [CrossRef] [Green Version]
  18. Dumbrava, V.; Svilainis, L. Evaluation of the ultrasonic transducer electrical matching performance. Ultrasound 2007, 62, 16–21. [Google Scholar]
  19. Garcia-Rodriguez, M.; Garcia-Alvarez, J.; Yañez, Y.; Garcia-Hernandez, M.; Salazar, J.; Turo, A.; Chavez, J. Low cost matching network for ultrasonic transducers. Phys. Procedia 2010, 3, 1025–1031. [Google Scholar] [CrossRef] [Green Version]
  20. Makarov, O. Phenomenological method for broadband electrical matching of acousto-optical device piezotransducers. Opt. Eng. 1999, 38, 1127–1135. [Google Scholar] [CrossRef]
  21. Arnau, A.; Sogorb, T.; Jimenez, Y. A continuous motional series resonant frequency monitoring circuit and a new method of determining Butterworth-Van Dyke parameters of a quartz crystal microbalance in fluid media. Rev. Sci. Instrum. 2000, 71, 2563–2571. [Google Scholar] [CrossRef]
  22. Mason, W. Electromechanical Transducers and Wave Filters; D. Van Nostrand: New York, NY, USA, 1942. [Google Scholar]
  23. Krimholtz, R.; Leedom, D.; Mattaei, G. New equivalent circuits for elementary piezoelectric transducer. Electron. Lett. 1970, 6, 398–399. [Google Scholar] [CrossRef]
  24. Jin, H.; Dong, S.; Luo, J.; Milne, W. Generalised Butterworth-Van Dyke equivalent circuit for thin-film bulk acoustic resonator. Electron. Lett. 2011, 47, 424–426. [Google Scholar] [CrossRef]
  25. Sherrit, S.; Leary, S.; Bar-Cohen, Y.; Dolgin, B. Analysis of the impedance resonance of piezoelectric stacks. In Proceedings of the IEEE Ultrasonics Symposium, San Juan, PR, USA, 22–25 October 2000; pp. 1037–1040. [Google Scholar]
  26. Lin, S.; Xu, J. Effect of the matching circuit on the electromechanical characteristics of sandwiched piezoelectric transducers. Sensors 2017, 17, 329. [Google Scholar] [CrossRef]
  27. Rathod, V. A review of electric impedance matching techniques for piezoelectric sensors, actuators and transducers. Electronics 2019, 8, 169. [Google Scholar] [CrossRef] [Green Version]
  28. Alibakhshikenari, M.; Virdee, B.; Azpilicueta, L.; See, C.; Abd-Alhameed, R.; Althuwayb, A.; Falcone, F.; Huynen, I.; Denidni, T.; Limiti, E. Optimum power transfer in RF front end systems using adaptive impedance matching technique. Sci. Rep. 2021, 11, 11825. [Google Scholar] [CrossRef] [PubMed]
  29. Couraud, B.; Vauche, R.; Daskalakis, S.; Flynn, D.; Deleruyelle, T.; Kussener, E.; Assimonis, S. Internet of things: A review on theory based impedance matching techniques for energy efficient RF systems. J. Low Power Electron. Appl. 2021, 11, 16. [Google Scholar] [CrossRef]
  30. Sibanda, M.; Janse Van Rensburg, P.; Ferreira, H. Impedance matching with low-cost, passive components for narrowband PLC. In Proceedings of the IEEE International Symposium on Power Line Communications and Its Applications, Udine, Italy, 3–6 April 2011. [Google Scholar]
  31. Yuan, T.; Dong, X.; Shekhani, H.; Li, C.; Maida, Y.; Tou, T.; Uchino, K. Driving an inductive piezoelectric transducer with class E inverter. Sens. Actuator A Phys. 2017, 261, 219–227. [Google Scholar] [CrossRef]
  32. Anas, A.; Resmi, R. Electrode optimization for enhancement of Q-factor in SAW resonators. In Proceedings of the 2nd International Conference on Trends in Electronics and Informatics, Tirunelveli, India, 11–12 May 2018. [Google Scholar]
  33. Mertz, J.; Marti, O.; Mlynek, J. Regulation of a microcantilever response by force feedback. Appl. Phys. Lett. 1993, 62, 2344. [Google Scholar] [CrossRef]
  34. Steeneken, P.; Phan, K.; Goossens, M.; Koops, G.; Brom, G.; van der Avoort, C.; van Beek, J. Piezoresistive heat engine and refrigerator. Nat. Phys. 2011, 7, 354–359. [Google Scholar] [CrossRef]
  35. Beltran, N.; Finger, R.; Santiago-Aviles, J.; Espinoza-Vallejos, P. Effect of parasitic capacitances on impedance measurements in microsensors structures: A numerical study. Sens. Actuators B Chem. 2003, 96, 139–143. [Google Scholar] [CrossRef]
  36. Zhang, S.; Wang, Q.; Lin, T.; Zhang, P.; He, P.; Paik, K. Cu-Cu joining using citrate coated ultra-small nano-silver pastes. J. Manuf. Process. 2021, 62, 546–554. [Google Scholar] [CrossRef]
  37. Wang, Q.; Zhang, S.; Lin, T.; Zhang, P.; He, P.; Paik, K. Highly mechanical and high-temperature properties of Cu-Cu joints using citrate coated nano-sized Ag paste in air. Prog. Nat. Sci. Mater. 2021, 31, 129–140. [Google Scholar] [CrossRef]
  38. Lubbe, J.; Troger, L.; Torbrugge, S.; Bechstein, R.; Richter, C.; Kuhnle, A.; Reichling, M. Achieving high effective Q-factors in ultra-high vacuum dynamic force microscopy. Meas. Sci. Technol. 2010, 21, 125501. [Google Scholar] [CrossRef]
  39. Jian, X.; Li, Z.; Han, Z.; Xu, J.; Liu, P.; Cui, Y.; Huang, W. The study of cable effect on high-frequency ultrasound transducer performance. IEEE Sens. J. 2018, 18, 5265–5271. [Google Scholar] [CrossRef]
  40. Daft, C.; Wagner, P.; Bymaster, B.; Panda, S.; Patel, K.; Ladabaum, I. cMUTs and electronics for 2D and 3D imaging: Monolithic integration, in-handle chip sets and system implications. In Proceedings of the IEEE Ultrasonics Symposium, Rotterdam, The Netherlands, 18–21 September 2005. [Google Scholar]
  41. Zhang, Z.; Li, F.; Chen, R.; Zhang, T.; Cao, X.; Zhang, S.; Shrout, T.; Zheng, H.; Shung, K.; Humayun, M. High-performance ultrasound needle transducer based on modified PMN-PT ceramic with ultrahigh clamped dielectric permittivity. IEEE Trans. Ultrason. Ferroelectr. Freq. Control 2018, 65, 223–230. [Google Scholar] [CrossRef]
Figure 1. Equivalent circuit of transducer. (a) BVD model, (b) Mason model.
Electronics 11 00194 g001
Figure 2. Flow chart of impedance matching process.
Electronics 11 00194 g002
Figure 3. Matched transducer with series inductor and excitation part.
Electronics 11 00194 g003
Figure 4. L-shaped section network for transducer.
Electronics 11 00194 g004
Figure 5. Overall equivalent circuit with matching circuit. (a) cross-sectional view of transducer, (b) with series L matching, (c) with LC matching.
Electronics 11 00194 g005
Figure 6. Pressure measurement setup. (a) overall system, (b) enlarged view of hydrophone and transducer tip in water tank, (c) transducer with matched circuits.
Electronics 11 00194 g006
Figure 7. Measurement result of BVD components.
Electronics 11 00194 g007
Figure 8. Comparison between simulation and experiment results. (a) MATLAB simulation, (b) impedance analyzer.
Electronics 11 00194 g008
Figure 9. Acoustic pressure depending on matching conditions.
Electronics 11 00194 g009
Figure 10. Measured pressure depending on excitation voltage. (a) Maximum positive pressure (b) absolute value of maximum negative pressure, (c) peak-to-peak pressure.
Electronics 11 00194 g010aElectronics 11 00194 g010b
Table 1. Summary of MATLAB simulation results.
Non-MatchingLC MatchingSeries L Matching
fr (kHz)37.3137.2636.79
fa (kHz)38.2038.2038.20
Impedance (fr) (Ω)23.5920.676.97
Impedance (fa) (kΩ)13.713.713.7
Qm217.27234.51461.66
Table 2. Experimental results under different matching schemes.
Non-MatchingLC MatchingSeries L Matching
fr (kHz)36.8236.8236.77
fa (kHz)37.1637.1637.01
Impedance (fr) (Ω)131.36120.2553.17
Impedance (fa) (kΩ)1.261.000.66
Qm111.95122.30394.79
Table 3. Voltage gains depending on matching conditions.
50 Vpp60 Vpp70 Vpp80 Vpp90 Vpp100 Vpp
LC matching1.121.101.001.001.171.07
Series L matching1.501.301.551.501.501.50
Publisher’s Note: MDPI stays neutral with regard to jurisdictional claims in published maps and institutional affiliations.

