Abstract
Because of the lack of upstream grid support and low inertia, independent microgrids are very susceptible to load variations and uncertainty in the generation of renewable energy sources. Disruption of microgrid frequency stability causes severe damage to various system equipment and frequency-sensitive loads. By taking into account the effects of electric vehicles (EVs), this paper introduces an innovative control strategy with a master-slave configuration for frequency control of interconnected microgrids. In the proposed configuration, an integer-order controller serves as the master, while a merely fractional-order integrator acts as the slave controller. The master and slave controllers are concurrently optimized by the JAYA intelligent algorithm to achieve robust effectiveness. Additionally, nonlinearities in the system are implemented, such as diesel generator operating limits, signal controllers, and sending/receiving time delays. To assess the effectiveness of the proposed control strategy in a two-area microgrid, six basic scenarios are investigated: sudden load changes, perturbations at the inputs of renewable energy-based units, parametric uncertainties, time-delay effects as a nonlinear factor, complicated working conditions, and EVs impacts. Moreover, the controller’s performance on a simple closed-loop system has been carried out in order to confirm the viability of its practical implementation, and a comparison of experimental and simulation findings has also been provided. Studies demonstrate the proposed controller’s robustness as well as its fast-response capability. Besides, this controller features a simple structure that allows extra design flexibility.
1. Introduction
1.1. Background and Motivation
Fossil fuels are non-renewable energy sources that are unevenly distributed throughout the earth. Non-renewability raises concerns about availability for present and future generations, and their uneven distribution poses challenges to energy security. Moreover, the instability of markets and prices of this type of energy is another issue related to fossil fuels, which has adverse economic effects. On the other hand, environmental issues, greenhouse gas emissions, and consequently air pollution and global warming are unavoidable disadvantages in exploiting these depleting resources [1]. These problems have shifted attention to renewable energy sources (RESs) to be used to generate electrical power. Two significant supremacies of RESs-based power plants are fuel cost elimination and their environmentally-friendly features [2]. Despite the RESs-related technologies, such as solar and wind power plants, evolving year by year, the issues of intermittency and inherent uncertainties of RESs have been a controversial and much-disputed subject within the field of the Load-Frequency Control (LFC) task. Storage devices are one of the well-known solutions to overcome the issues related to the widespread penetration of RESs-based power generation plants and the mismatch between power generation and consumption in the low-inertia off-grid microgrids (MGs). Storage devices can be used as power reserve devices and eliminate power imbalances in MGs [3].
Using high-capacity centralized energy storage to deal with power curtailments, while feasible, is costly. A better and more efficient way is to use Electric Vehicles (EVs) facilities. The advantages of EVs compared to other transportation alternatives, particularly in the environmental protection and transportation costs, have caused much attention to this technology [4,5,6]. EVs are known as consumers when they are charging, whereas the charged EVs can act as power producers in the system. Bidirectional power electronics as EVs interfaces with the grid affords quick response and performance, presenting EVs as fast and suitable alternatives for primary and secondary frequency control participation. In addition, studies in [7] indicate that injected power from EVs’ battery decreased power losses, so network’s bus voltage would be improved.
Basically, for the participation of plug-in EVs in frequency regulation and control, a large number of EVs operate collectively according to the aggregator management procedures. The aggregators or aggregation agents are companies or computational entities responsible for organizing small-scale distributed generation units or energy storages to render services on a larger scale in line with predetermined purposes [5]. According to statistics, personal cars are idle for around 95% of the day. So superseding personal vehicles with EVs makes it possible to access an aggregation of EVs with the proper dimensions to suppress the system’s frequency fluctuations [4].
MGs with the integration of EVs are in the scope of the smart grid [8]. The new generation of power systems includes a wide range of different types of communication systems. Accordingly, real-time control of an aggregation of EVs based on the processing of data collected from communication systems will be possible. However, besides the undeniable benefits of the communication systems’ influence on the structure of modern power systems, issues such as time delays have been the point of intense debate within the scientific community. Communication channels’ sudden congestion or crashed data packets may be the sources of time delays [9].
Unlike grid-connected MGs, islanded MGs do not have the main grid’s support for frequency or voltage stability. For solving the LFC problem, the primary approach is to maintain the entire system’s operating frequency/scheduled tie power at nominal values under normal operating conditions or small disturbances and generally balance the power in the system. In the presence of diesel generators in the MGs, the economical and optimal operation of the hybrid MGs is aimed at reliable service to consumers [4,10]. Therefore, it is necessary to design robust controllers that, while responding quickly to perturbations, can withstand various disturbances caused by different sources. The frailty of common old controllers in the face of the new challenges of modern MGs highlights the need to design controllers that perform competently in different operating conditions. Traditional controllers, despite their undeniable capabilities, face profound challenges in the face of vast modern systems with different equipment, uncertainties, nonlinearities, storages, and demand-side management strategies, along with the high penetration of RESs. Hence, extensive studies have been conducted to design optimal controllers for the MG LFC task [11,12].
1.2. Literature Review
Due to their valuable technologies, smart networks are empowered to be utilized for control purposes. LFC has always been a challenge in both conventional power systems known as AGCs and current MGs [12,13]. In [14], the classical IO PID controller has been studied as a secondary strategy in a single-area MG. The Fractional-Order (FO) types of the conventional controllers were also applied to the frequency control of the different MGs [15]. In [16], solving the LFC problem of an MG using the FO-based PID controller was reported, where the Krill Herd optimization algorithm was employed to obtain its optimal gains. By modifying the configuration of the same IO classical controllers, modern controllers with cascaded/multi-staged structures have been introduced in various studies. The authors in [17] have raised the controller response speed, using the cascade control structure and shifting the integral action to the second part of the controller. The idea of using cascaded controllers with ESS support in power systems with different power generation sources has also been investigated by Choudhary et al. [18].
Utilizing fuzzy supervisors is one of the well-known approaches to reaching adaptive and robust controllers. Shayeghi et al. [19] designed a fuzzy P-PID controller for an islanded MG considering nonlinear system elements and uncertainties based on a multi-objective approach. Controllers with a cascade structure under the supervision of a fuzzy observer were also used to perform the LFC task [12]. Also, a hybrid fuzzy FOPID controller was suggested for frequency control of an MG including ESSs [20]. However, expert knowledge, the fitness of membership functions, rules base, and defuzzification methods profoundly affect the output quality of the fuzzy controllers and are among the main challenges in utilizing these stalwart adaptive controllers. In order to successfully deal with the AGC problem of IPS, a novel PIDN-FOPIDN controller was proposed as an expert control technique [13]. For controller parameter optimization, the imperialist competitive method is used, and its performance is robust, according to the research findings. In [21], it is decided to use a unique optimum CF-FOIDF controller for 2-area thermal and hydrothermal power systems, considering different limitations and the batteries of EVs. A combination model of electric vehicle fleets is implemented in the control regions, and to verify the robustness and superiority of the proposed control approach over currently used methods, several simulations are carried out. The PDn-PI master-slave controller in a traditional two-area IPS is investigated in [22], and the superiority of the suggested master-slave configuration over the PI and PID controllers is studied. This study also emphasizes the necessity of selecting a suitable optimization approach, and the Coyote optimization algorithm is employed for this purpose. Considering the multistage and fuzzy controllers concept, Sharma et al. have introduced a non-integer multi-stage fuzzy controller to deal with the frequency anomalies of a hybrid power system [23]. Despite the acceptable performance of this controller compared to the IO or non-fuzzy forms, the optimality of the rule base and membership functions of this controller is discussible.
A considerable amount of literature has been published on employing master-slave controllers for power systems control. Most of these studies focused on applying the master-slave controllers in the traditional power systems’ AGC [24,25]. However, they have not been appropriately addressed in the MGs LFC issue. An IO master-slave controller known as cascade PI-PD was introduced by considering various storage devices along with EVs [26]. Oshnoei et al. [27] applied a controller with three degrees of freedom (3DOF) as a master controller and a FOPID as the slave controller to control the frequency of the single-area MG. In this study, the battery is used as an energy storage system, and a new mechanism is applied to deal with the system’s low inertia. It should be noted that although increasing the number of handles in the controller structure increases the designers’ discretion, increasing the number of decision variables leads to quandaries in attaining optimal values invariably.
1.3. Contributions
In general, master-slave control configurations allow engineers to improve present control performance by adding or modifying one of the ICLs or OCLs if possible. It also facilitates the possibility of contemporizing control strategies in the future if necessary.
The contribution of this paper lies in introducing a new combined master-slave controller for the interconnected MGs LFC solving, with EVs partnership in the secondary stage. The controller’s gains and parameters must be optimally adjusted to deal with various operating conditions such as RESs intermittency, demand-side disturbances, the effects of nonlinear factors, or possible uncertainties in the system parameters. Here, the optimal parameters of master and slave controllers are concurrently determined by JAYA intelligent optimization algorithm [28] for granting the interplays between controllers’ responses in the ICL and the OCL to increase control strategy efforts. Hence, the master and slave controllers will be in the best settlement. It is possible to optimize the slave controller according to the master’s settings. However, the simultaneous adjustment of master and slave controllers makes it easier to reach a better compromise. The proposed controller consists of an IO controller, i.e., a proportional-double-derivative with filter (PDDN) as a master part and a simple FO integrator (I) in the ICL as a slave controller.
Although FO controllers make more freedom for controller designers, they increase decision variables and make it more challenging to solve complex control problems such as LFCs problem. In addition, the IO approximations of the FO control operators are generally used during modeling, and the best approximation is always in dispute [29]. This paper sheds new light on the master-slave controlling idea by uniting IO and FO control operators easily and practically. In terms of problem dimensions, the proposed structure has only one more decision variable than a conventional and popular controller such as PID. Also, the parallel configuration of the traditional controllers has been renewed in the form of nested control loops. This facilitates the challenge of the direct effects of control operators on each other in parallel structures in the design of controllers.
To validate the proposed control strategy, an interconnected two-area system is simulated in the MATLAB/Simulink environment. The two areas are heterogeneous, and each area contains RESs-based units and lumped EVs. Also, nonlinear factors have been incorporated into the system design to bring the simulation closer to reality. The performance of the suggested PDDN-I master-slave controller in various working conditions such as sudden load changes, uncertainty in system parameters, and output power of the RESs-based units, and the impacts of nonlinear factors are compared with two other classic controllers, i.e., PID and PIDA, and their dynamic behaviors are evaluated. The substantial superiority of the PDDN-I controller in the face of various disturbances and conditions indicates the efficiency of this controller. Also, its functional and straightforward design, along with its potency and robustness in complex working conditions, makes this controller an attractive choice for performing the LFC task. So, the following is a summary of this paper’s contributions:
- By combining integer and fractional order control operators as master and slave controllers, a novel control approach is introduced which is PDDN-I. The master controller is an IO controller, and the slave is a simple FO integrator.
- Master and slave controllers are tuned concurrently using the JAYA optimization method to obtain optimal control strategy performance.
- In a master-slave control mechanism, the impacts of electric vehicles on the LFC process are evaluated. The quality and speed of the controllers’ performance shows the degree of reliance on EVs’ capacities to establish system stability.
- Commonly-used controllers, i.e., PID and PIDA controllers, are also tuned to compare the proposed master-slave control framework under different operating scenarios. The superiority of the proposed PDDN-I controller is highlighted by performing comparisons in different working conditions.
- In order to verify the feasibility of the practical implementation of the controller, its performance on a sample system has been performed and the comparison of experimental and simulation results has also been presented.
1.4. Paper Organization
This paper is divided into six sections, the rest of which is as follows: in Section 2, the system under study is described. The power generation units and how EVs contribute to the interconnected MG system are scrutinized in this section. In Section 3, first, a brief intro to FO controllers concept and master-slave controlling is presented. Afterward, the proposed controller synthesis is explained. The optimization intention and the LFC problem-solving method are discussed in Section 4. Eventually, after examining the proposed controlling method in different conditions, i.e., disturbances in the demand side, system parametric uncertainties, perturbations in RESs-based power units, and the RCP tests in Section 5, the conclusions are reviewed in Section 6.
2. System Modeling
In this section, the modeling of the system under study is expressed. Linear models are used in most frequency-domain studies. Here, to bring the responses closer to reality, some nonlinear elements are also applied in the MG modeling. The validity of the models used in this paper has been confirmed in past related studies through real-time tests [4,30]. The general scheme of the non-identical two-zone system under study is depicted in Figure 1. diesel engine generator (DEG) has been used in both areas. Area 1 is equipped with a wind turbine generator (WTG), and part of its power is utilized to provide hydrogen for the fuel cell (FC). In area 2, photovoltaic (PV) cells have also been employed to generate power. EV sets are also present in both areas. The features/capacities of available EVs are also different. Details of the study system model are available in [3,4], though a brief explanation is provided.
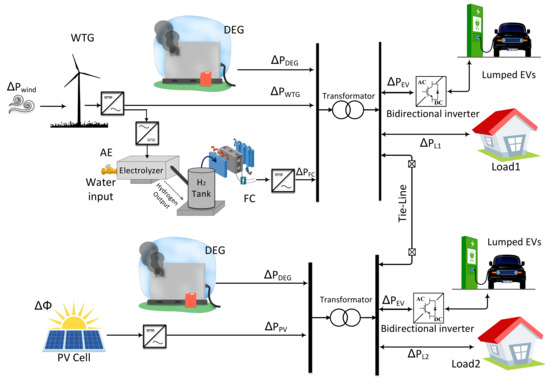
Figure 1.
General scheme of the system under study.
2.1. MG Power System Model
The first-order transfer function of the MG power system in area j, considering its components, will be the same as (1).
Accordingly, for frequency changes/deviations (), it could be written as below:
So, for net generated power in area 1 () and area 2 (), we have:
2.2. EVs Modeling
One approach to modeling EVs in the MG LFC task is based on their state of charge (SOCs). Accordingly, it is assumed that EVs whose SOC reaches the threshold of 90% of their total capacity will not charge anymore in response to the LFC signal. On the other hand, where the SOC reaches a lower bound of 80%, it will not be expedient to discharge EVs for frequency regulation in the LFC issue. Thus, the number of EVs available for establishing the system’s frequency stability will vary based on their SOC or deriving patterns in varying states. The lumped model of EVs illustrated in Figure 2 is used in this study [31].
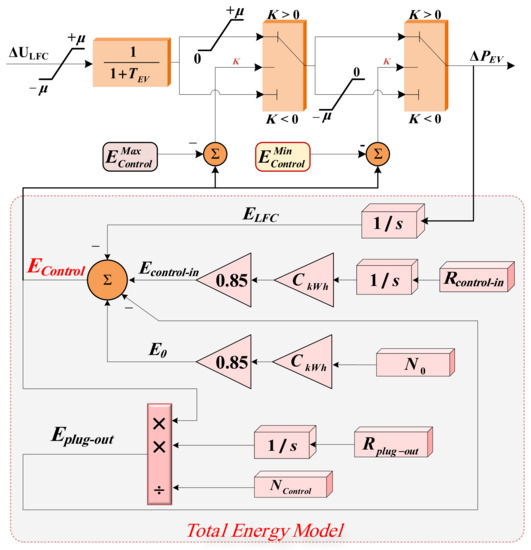
Figure 2.
Block diagram of the lumped EVs model.
In this figure, the input is the LFC signal and the output is the charge or discharge power of an aggregation of EVs. Also, is the number of initial available EVs whose SOC is assumed 85%. According to [31], the quantity of initial charging of the augmented equipment of EVs is considered to be 85% since the performance of EVs is transient. Additionally, as EVs are centralized, the average maximum and minimum charge of the vehicles that may participate in the LFC tasks are taken into account as the starting value at the time of disruptions. The EVs’ rate of entering the controlling state and the rate of their plug-out is indicated with and , respectively.
There two primary operational constraints which have to be counted. The first constraint is the inverter capacity which is indicated as in the Figure 2. This constraint highlights that the rate of charging/discharging has prescribed limit. The other constraint is the EVs’ total battery capacity limitations. If is the number of vehicles available with battery capacity, then the second constraint, called the EV MWh (or kWh) limit, would be as follows [32]:
3. Controller Synthesis
3.1. The FO Calculus and Transfer Functions
In the frequency domain, there are three basic control actions affecting system behaviors: Proportional, derivative, and integral. The effects of these actions are summarized as follows [33]:
- Proportional action: Increasing response speed, decreasing steady-state error, and relative stability;
- Derivative action: Increasing relative stability and sensitivity to noise;
- Integral action: Eliminating steady-state error and decreasing relative stability.
Therefore, any action, along with positive effects, may have negative consequences. The positive impacts of the derivative action are relative speed and stability improvement, and the adverse effects are increased sensitivity to high-frequency noises. Likewise, for the integrator, its positive effects, eliminating the steady-state error, can be discerned by the infinite gain at zero frequency and its adverse impacts by the introduced phase lag. Based on this, it can be said that by generalizing the control actions in , , , form, the best compromise can be reached between their positive and negative effects. Finally, using FO control actions, more robust and more flexible controllers can be achieved by coupling their features [33,34].
When it comes to FO controllers, we are talking about dealing with differential equations by fractional calculus. Simply, fractional calculus is the generalization of ordinary calculus to a more comprehensive range. More details about calculations in the field of FO are available in Refs. [35,36]. The implementation and simulation of transfer functions that include s with a FO is done with the help of appropriate approximations of the IO ones. Although the best approximation would consist of an infinite number of zeros and poles, it is achievable to perform an approximation with a limited number of zeros and poles [35].
3.2. Master-Slave Control Strategy
As shown in Figure 3, there are two control loops in master-slave control mechanism: inner and outer loops. In this control structure, the output of the ICL is the input of the OCL. In the OCL, a reference signal is considered that the output of the OCL must attain. The controller in the OCL is called the master controller and is responsible for controlling the final output quality. The master controller will be subjected to the sudden/step load perturbation (SLP) as input signal. If is the OCL input, it could be said that:
where is the outer process. ICL includes as supply/process and as slave controller. This control loop is responsible for mitigating the effects of possible internal loop perturbations on the outer process. ICL’s output signal where is input signal will expressed as (6).
The main merit of employing master-slave controllers in the LFC of the interconnected MGs is that in addition to the area control error signal (), they also use area frequency deviations () as input signal. In general, these controllers will perform more reliable against disturbances if properly designed. Because the fast dynamics of the internal process follow the rapid response of the inner loop controller. So the effects of the internal aberrations on the final output will be diminished [37].
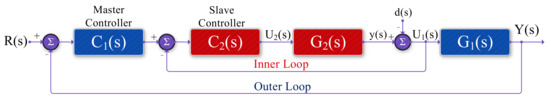
Figure 3.
General scheme of the master-slave controlling.
3.3. Proposed PDDN-I Controller
Finding a compromise between controller components’ actions is the main challenge of using the parallel structure controllers. For example, in the PID controller, which is broadly used in different applications, this challenge manifests itself in transient states, where a slower response is the cost of reducing the overshoot.
Master-slave controllers improve the system’s control performance and minimize the controllers’ components adverse interactions against each other to achieve the deisred system level. In the proposed PDDN-I control structure, a proportional-double-derivative with filter works as master strategy and a simple FO integrator (), services as slave controller. So, the FO and IO controller’s advantages are combined with the master-slave mechanism, minimizing their interactions. In addition, the system response speed improves by transferring the integral action to the ICL. The transfer functions of the proposed master and slave controllers are given in (7) and (8), respectively.
Finally, the proposed master-slave controller configuration for LFC task of MG is shown in Figure 4. According to this figure, if the output of the master controller is and the frequency fluctuations of jth area are equal to , then the final output control signal for jth control area is described as follows:
In (9), the is the j-th area’s control error signal which is defined as the instantaneous difference between a net actual and scheduled power interchange with all adjacent interconnected MGs.
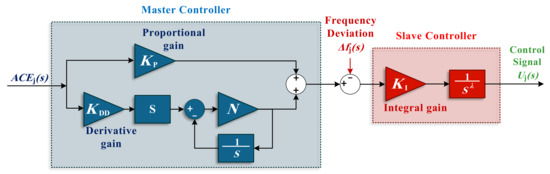
Figure 4.
The proposed master-slave controller block diagram.
Finally, in a master-slave control structure, the total closed-loop transfer function for system performance is defined according to the (10) [38]:
4. Problem Definition and Solving Method
4.1. Objective Function
Without proper parameters adjustment of the controller, we can not hope for its adequate performance. The suitable functioning of a controller is deeply dependent on its parameter adjustment according to the system under control. Defining an appropriate cost function plays an essential role in guiding optimization algorithms toward the designer’s goals. Establishing system stability and clearing steady-state errors in the shortest time and with the most accuracy is the main issue in solving the LFC problem. Frequency fluctuations due to imbalances in power generation and consumption, and consequently out-of-plan changes in power flow between areas in interconnected systems, can cause severe damage to various equipment in the network. Therefore, defining the appropriate objective function and solving the problem with the suited method is necessary to achieve optimal performance.
Among the various Objective Cost (OC) employed for LFC design in MGs, the Integral of Time-weighted Absolute Error (ITAE) has attracted much attention. Due to the time coefficient in its formula, this OC boosts the impacts of long-term errors. Although this OC decreases the error value between 0 and 1 second, if used as an OC for controller design, increases control response speed compared to other OCs that do not have time weights. The OC for the proposed master-slove controller design is as below:
where, and indicates amount of frequency and tie-power deviations participation in the OC’s value. Also, refers to the tie-line power fluctuations between jth and qth control areas. Although and could be units, keeping in mind that fast-response EVs appliances are included in the MGs, fast generation-consumption equilibrium could be reached. So in this work, the focus is kept on frequency durability. Accordingly, is considered to be 1 while is 0.8.
4.2. Optimization Method
Most intelligent optimization algorithms, in addition to the usual control parameters such as the number of population members, elite size, number of iterations, etc., include some specific parameters. These algorithm-specific parameters earnestly affect its execution and performance. In some cases, determining the optimal values of these parameters becomes a challenge to solve the optimization problem. In the PSO, for example, parameters such as individual and collective learning rates and inertia coefficient are influential values. In the famous genetic algorithm (GA), the parameters of mutation and crossover probabilities and the parent-choosing method influence the algorithm’s performance. Furthermore, designing and optimizing the controller to accomplish the LFC task is a challenging problem. As a result, the problem-solving algorithm should not exacerbate the difficulties of problem-solving. The JAYA algorithm is preferable in this regard since the population size is the only configuration parameter. This intelligent algorithm is designed in such a way that no special parameters are required [28]. In this algorithm, if the problem to be optimized is a function such as and has D decision variable (), and also the number of problem-solving agents in the algorithm (population size) is equal to P (), the jth variable for kth solving-agent in the ith iteration is calculated as follows:
where the worst population member worst is obtained the worst value of (i.e., ), while the best value of (i.e., ) is achieved by the best solving-agent best. Also, and are two positive random coefficient which are smaller than 1. Considering the proposed controller, we have . The scope of determining the parameters of the controller to solve the optimization problem is expressed as follows, where the superscripts max and min show the upper and lower limits of the parameters, respectively.
The block diagram of the system under study and controller design process is illustrated in the Figure 5.
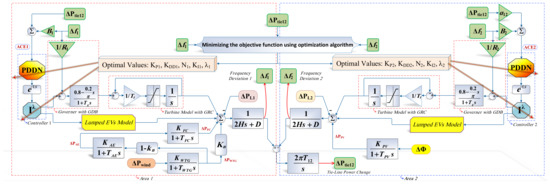
Figure 5.
Block diagram of the system under study and the controller design process.
5. Numerical Study
In this section, the proposed controller performance is compared in six different scenarios with the PID the PIDA controllers according to Table 1. The PIDA controller, like the PID controller, has a parallel structure, except that it also has an acceleration operator (second derivative) in its structure [39]. The transfer function of this controller is given in (14), while an alternative representation could be as (15).
The interconnected MG model is implemented in the MATLAB/Simulink environment. The parameters of the model, given in Appendix A, are taken from references [3,4]. Usually, higher-order integer approximations with a negative real part and a restricted frequency range as , known as the Oustaloup approach, are used to represent the FO operators. The FOMCON toolbox for implementation of the FO controllers with Hz and Hz has been employed in the simulations, where the approximation order is equal to five [40].

Table 1.
Assumptions of system operating conditions in each scenario.
When performing the LFC task, regulating the output power of units whose input fuel may be adjusted is considered. Because of the aim to maximize the use of available RESs capacity and the low levels of their power at the MG level, the focus in modifying controller performance is typically on striking the balance of generation and consumption of power via units with adjustable input. Furthermore, RESs are a resource with uncertain input. So, wind and solar units do not participate in the LFC task [12]. Therefore, by regulating the fuel consumption of DEGs, the generation-consumption balance and consequently the system’s stability is established. The optimal parameters of the controllers considering 5% and 3% load perturbations are obtained for areas 1 and 2, respectively. Also, in sending the control signal from the master controller to the slave controller, a delay of 20 ms (one cycle at a frequency of 50 Hz) is considered. For the PID and the PIDA controllers, this nonlinearity is applied in the controller output signal. For this purpose, the JAYA optimization algorithm introduced in Section 4 has been employed, where the population size has been equal to 30 over 100 iterations. Also, to show the supremacy of the JAYA algorithm for solving this optimization problem, the PSO algorithm is used to find the best solution, where its parameters are given in the Appendix B. The optimization algorithms are repeated five times to design each controller. From the second repetition onward, the optimal response of the previous execution of each algorithm is assigned to one of the population members as a potential optimal solution. In this way, the exploration of the algorithms is dramatically increased, and the chance of the algorithm being stuck in local optima decreases. Figure 6 shows the convergence curves of the best (fifth and last) execution of the algorithms. Also, the summary of the results of the algorithms is presented in Table 2. According to Table 3 and Figure 6, it can be seen that for all three controllers, after five times of stage-by-stage execution, the results of the JAYA algorithm are better than PSO. Therefore, the continuation of studies and comparisons has been done with the optimal values obtained from the implementation of the JAYA algorithm. The optimal parameters of the proposed Master-slave controllers using the JAYA algorithm are presented in Table 3.
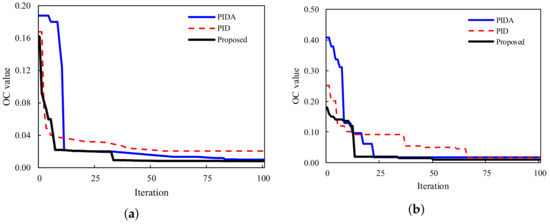
Figure 6.
The best convergence curves in the five-time running of the optimization algorithms, (a) JAYA, (b) PSO.
Table 2.
OC values after five-time algorithm execution.
Table 3.
Optimal parameters of the controllers.
To evaluate the suggested controller efficiency, the load demand perturbations are studied in the first case. In the latter case, perturbations in the production of renewable energy sources are investigated. In the third case, the uncertainty in the system parameters is studied, and in the fourth case, The effect of time delay on the performance of controllers has been investigated as one of the important nonlinear factors. The EVs are ready to support the control mechanism in cases I–V. It is also assumed in Case VI that no vehicle is available to engage in the LFC at the moment of the disruption. The system conditions in each scenario are demonstrated in Table 1. Moreover, for more detailed comparison, the integral of absolute error (IAE) and the integral of time-weighted square error (ITSE) indices, as given in (16), (17) respectively, along with each case’s OC value, are designated in Table 4.
Table 4.
Performance indexes of controllers in different cases.
5.1. Case I: Load Disturbances
In this scenario, disturbances in load demand are applied to investigate the system’s behavior. The disturbances are assumed to be like what is depicted in Figure 7. The dynamic response, including frequency fluctuations in areas 1 and 2 ( and ) and tie-line power fluctuations (), are displayed in Figure 8a–c. Smooth dynamic response and more minor frequency fluctuations are achieved using the proposed PDDN-I controller than the other ones. The robust performance of the PDDN-I controller makes the influences of disturbances in one area less pronounced in the other area compared to the other two controllers. Also, after s with the occurrence of load changes in area 2, the PID controller is unable to maintain system stability and massive undershoot also occurred after this perturbation in tie-line power for systems which are controlled by PID and PIDA controllers.
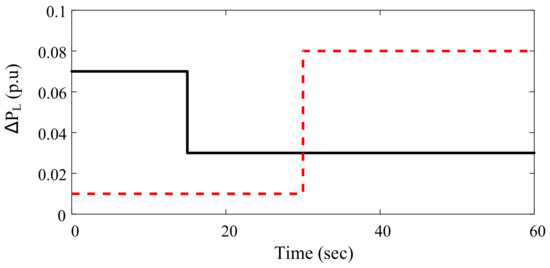
Figure 7.
Applied load disturbances in case 1 Solid: Area1, dashed: Area2.
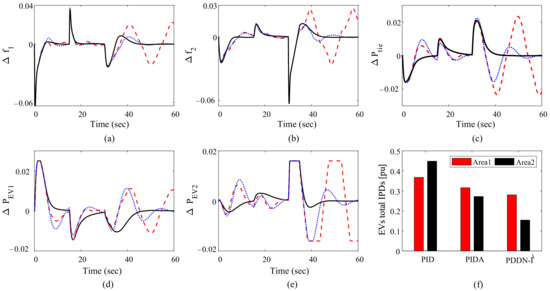
Figure 8.
Dynamic response of the system in case 1: (a) frequency deviations of area 1, (b) frequency deviations of area 2, (c) tie-line power fluctuations, and (d) IPD of the EVs. (e) area 2 EVs ouput, and (f) IPD of the EVs. Solid: Proposed controller, dashed: PID controller, and dotted PIDA.
It will be difficult for aggregators to guarantee the rapid entry/exit of different amounts of EVs into the network, because the availability of an adequate number of controllable vehicles at any given time is a coincidence. So, despite the need for fast system frequency recovery, EVs’ high speeds enter/exit are not exacted in frequency control. The key to EVs participating in the LFC is to provide regular and cognitive signals. Figure 8d,e show the output power of EVs () in control areas 1 and 2. The robust performance of the proposed controller results in a stable waveform of . In area 2, EVs have less participation capacity (due to the constraints assumed during the design for the inverter output), so according to Figure 8f, fewer injected power deviations (IPDs) of the EVs in this area using The PDDN-I controller indicates greater reliance on controller capabilities and less on the limited capacity of EVs. According to Table 4, with the help of the proposed master-slave PDDN-I controller, the IAE index is improved by about 2 and 2.5 times compared to the PID and PIDA controllers, respectively. Also, the ITSE and OC indices are about 2.5 times and 10% lower than the PIDN and 3.2 times and 32% lower than the FOPID controllers, respectively. For a better representation, these comparisons are also shown in Figure 9. Therefore, the results indicate the superiority of the proposed PDDN-I controller over the other two controllers.
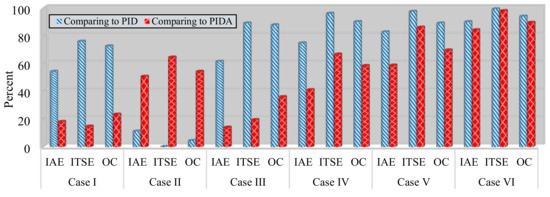
Figure 9.
Performance indexes improvements using proposed PDDN-I compared to two other controllers.
5.2. Case II: Renewable Energy Sources Perturbations
The changing nature of weather conditions and the dependence of RESs production, is caused uncertainties in the output power of these environmentally friendly units. The effective performance of controllers for maintaining system stability should be reduced these concerns. In this scenario, changes in the output power of PV and WTG units are considered, as shown in Figure 10 during a 100 s time period, where 15% load disturbances is also applied at in area 1. Various situations of RESs output power have been applied. In addition to the dynamic response of the system which is shown in Figure 11, the ISE and ITSE indices along with the OC values related to this case for numerical comparisons are recorded in Table 4. In this case, according to the values of evaluation indicators presented in Table 4 and their comparison which are illustrated in Figure 9, as well as changes in , , and shown in Figure 11, the proposed controller has achieved better efforts. This supremacy is especially evident in the overshoots and undershoots are caused by changes in RESs production. Also, the abnormal dynamic response of the system where the PIDA controller is used is evident especially in Figure 11b,c. Again in this scenario, the better performance of the proposed control strategy in each area causes the regions to be independent in frequency regulation, and as a result, tie power changes as well as the sum of EVs IPDs fluctuate less than the other two controllers which is clear in Figure 11c–f.
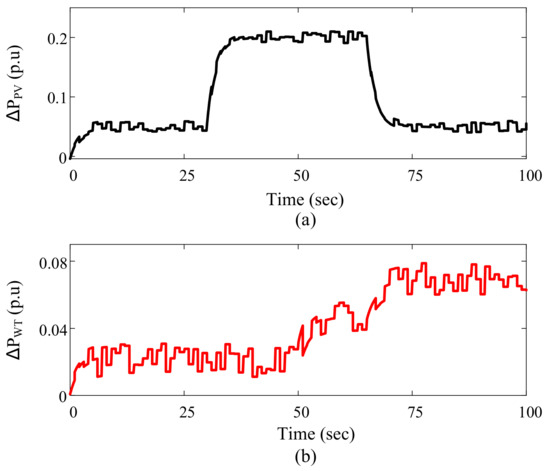
Figure 10.
RESs output power deviations in case 2 (a) PV and (b) WTG.
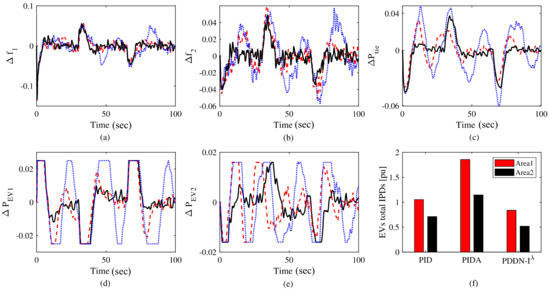
Figure 11.
Dynamic response of the system in Case 2: (a) frequency deviations of area 1, (b) frequency deviations of area 2, (c) tie-line power fluctuations, (d) area 1 EVs ouput, (e) area 2 EVs ouput, and (f) IPD of the EVs. Solid: Proposed controller, dashed: PID controller, and dotted PIDA.
5.3. Case III: Parametric Uncertainties
Any model’s usefulness depends in part on the correctness and reliability of its output. Generally, all considered models are imperfect reflections of reality, and well-defined input data are rarely available, so all output values are subject to imprecision. One of the potential sources of uncertainties in model output results from uncertain estimations of different model parameter values. This case has been examined with the assumption of a 40% increasing in inertia () and a concomitant decreasing of 40% in the damping co-factor () for controllers performance evaluation in the exhibition of notable uncertainties in the system modeling. In such a situation, the load perturbations is applied in both areas without retuning the controllers. Step load changes as 0.03 pu and 0.07 pu are imposed in area 1 and area 2 at , respectively. The dynamic response of the system in this situation is shown in Figure 12. The output power status of EVs in both areas along with their total IPDs are also presented in this figure. The values of evaluation performance indicators and the improvement percentage applying the proposed control strategy are shown in Table 4 and Figure 9, respectively. It is observed that the proposed PDDN-I controller is significantly robust against the basic parameters of the system changing. Numerically, the ITSE index has been averagely improved about 48% and 54% compared to the FOPID and PID controllers using the proposed control mechanism. Also, the improvements for ISE and OC indexes, are about 39% and 28% compared FOPID, and compared to PID controller are 21% and 50%, respectively.
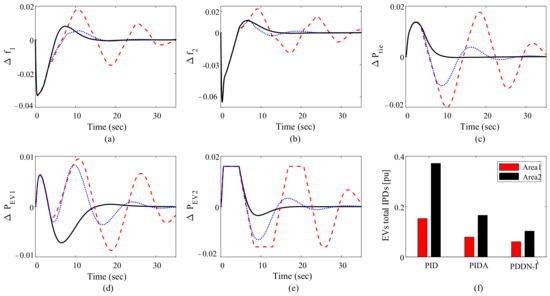
Figure 12.
Dynamic response of the system and IPDs of the EVs in Case 3: (a) frequency deviations of area 1, (b) frequency deviations of area 2, (c) tie-line power fluctuations, (d) area 1 EVs ouput, (e) area 2 EVs ouput, and (f) IPD of the EVs. Solid: Proposed controller, dashed: PID controller, and dotted PIDA.
5.4. Case IV: Time-Delay Effects
One of the most important nonlinear factors affecting the performance of the control mechanisms is time delays. Undesired congestion on communication lines or blocked data is a factor in causing time delays. In this case, the time delay in sending-receiving the control signal between the master and slave controllers has been tripled from the amount of 20 ms considered during the design process and assumed to be 60 ms. Also, the time delay in the sending/receiving control signal of the other two controllers has been tripled. Here, a 10% increase in power demand has been applied at s in area 2 and then, at s, a 6% step load increase is imposed in area 1. Figure 13 shows the system’s dynamic response in this situation including frequency and tie-line power oscillations. The evaluation indices presented in Table 4 related to this scenario show that if the value of the nonlinear time delay factor increases, the IAE index where the proposed master-slave controller is used is 74% better than the PID controller and 41% better than the PIDA controller. This comparison is 96% and 66% for the ITSE index, respectively. In this scenario, the OC value used by the PID and the PIDA controllers are respectively about 10 times and 2.5 times higher than the condition where the PDDN-I controller controls the system. Comparisons of these indicators in this case along with other cases are shown in Figure 9.
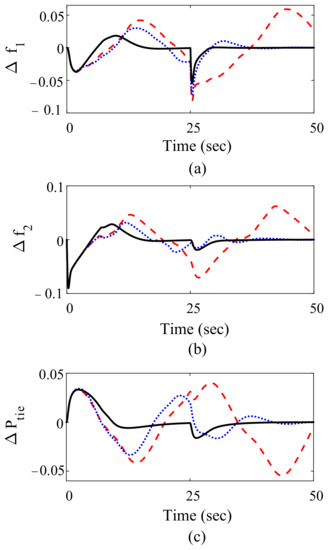
Figure 13.
Dynamic response of the system in Case 4. (a) frequency deviations of area 1, (b) frequency deviations of area 2, (c) tie-line power fluctuations. Solid: PDDN-I, dotted: PIDA, and dashed: PID controller.
5.5. Case V: Complicated Operating Condition
There is no assurance of an independent occurrence of the cases examined so far in practical terms. The event of a bunch of different disturbances simultaneously may challenge control systems. In this scenario, as the last test of the controllers’ performance, we examine a combination of different disturbances. Over a period of 120 s, at s there is first a 6% step-like increase in power demand in area 1 and then at s a 12% increase in in area 2. The status of changes in the output power of WTG and PV units is as shown in Figure 14.
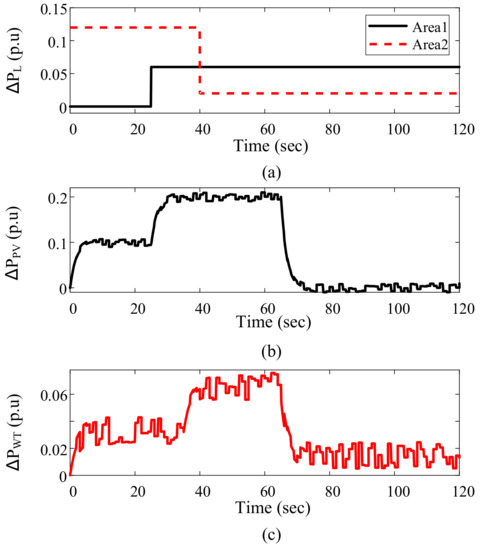
Figure 14.
Applied RES’s perturbations to the system in Case V: (a) Load perturbations, (b) PV unit fluctuations, and (c) WTG unit fluctuations.
Dynamic response of the system in this case is illustrated in Figure 15. In this scenario, the total IPD of the EVs in the area 1 using PID controller is 2.13 pu and using PIDA is 2.17 pu, while the value of this index is 1.14 pu where the PDDN-I controller is used for LFC of the system. Also, in area 2, the value of total IPD where the PID or PIDA is used is more than two times bigger than when the suggested master-slave controller is applied.
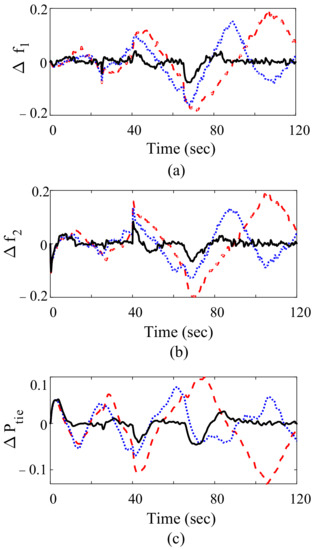
Figure 15.
Dynamic response of the system in Case 5: (a) frequency deviations of area 1, (b) frequency deviations of area 2, (c) tie-line power fluctuations. Solid: PDDN-I, dotted: PIDA, and dashed: PID controller.
5.6. Case VI: Availability of EVs
According to findings of the study in the preceding scenarios, as well as Figure 8f, Figure 11f and Figure 12f, it is obvious that the suggested master-slave control technique performs well enough to rely less on the capabilities of EVs. As a result, if EVs are not accessible at the time of the fault, the PDDN-I controller is expected to operate better than the conventional controllers. While taking into consideration the uncertainty in the system’s parameters, as well as the time delay of 40 ms in the control signal, perturbations in the area power demand and output power of RESs are considered in this scenario as shown in Figure 16. The uncertainty in inertia (M) and damping co-factor (D) parameters in both areas is considered, where inertia parameters M are decreased by 25% in both areas and damping factors D are increased by 25% from the nominal value. Figure 17 depicts the dynamic reaction of the system to this circumstance, and Table 4 displays the time-domain system assessment indicators. Figure 9 also shows a comparison of the values of evaluation indicators utilizing the suggested control strategy to existing control approaches to better illustrate controller performance.
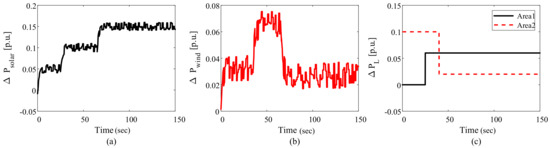
Figure 16.
Applied disturbances in (a) PV unit, (b) WTG unit, and (c) power demand, in Case 6.
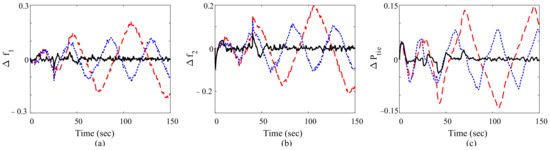
Figure 17.
Dynamic response of the system in Case 6. (a) frequency deviations of area 1, (b) frequency deviations of area 2, (c) tie-line power fluctuations. Solid: PDDN-I, dotted: PIDA, and dashed: PID controller.
5.7. Controller Laboratory Examination—The RCP Experiments
Implementing control strategies without detailed analysis and assurance of their validity in different practical aspects may result in exorbitant costs. Laboratory-scale investigations are the next step following mathematical modeling and computer simulation analyses. Various lab-based experiments like HIL, PIL, MIL, and RCP studies must be properly undertaken, and the suggested control method must pass them successfully.
Given the introduction of a novel control approach, a first-order closed-loop system is employed to evaluate the suggested controller’s real-time performance. The RCP tests were also carried out on a practical RC circuit, with the Arduino-Mega2560 control board serving as the interface, to investigate the feasibility of employing the proposed control strategy in practice. Simulink/MATLAB is used to implement the suggested controller model. The optimization algorithm utilized in this study (JAYA) determines the optimal controller coefficients for the closed-loop system, with the ITAE index standing as the objective function. The controller model is then implemented in the MATLAB Simulink environment and interfaced with the plant using the Arduino control board. The plant is built with a 10 k resistor and a 330 F electrolytic capacitor. As a result, the intended system’s time constant is 3.3 s.
The desired circuit output (reference voltage) is set at 4 V. To guarantee that the capacitor is empty at the start of the test, the reference voltage is zero for up to 20 s. At t = 20 s, the reference voltage is applied as a step with a magnitude of 4. The experiment was performed with the PI, PID, and PDDN-I controllers. The controllers’ optimal parameters are reported in Table 5. Also, the dynamic behavior of the closed-loop system with various controllers resulting from the simulation in the Simulink/MATLAB environment is shown in Figure 18. The configuration of the system studied for the RCP test is shown in Figure 19. Figure 20 shows the circuit’s output voltage as viewed on the oscilloscope. This signal does not have an overshoot when using the suggested PDDN-I controller. This figure also includes the output of the closed-loop system, where the typical controllers in the industry, particularly PID and PI, are utilized. Also, for a better comparison, the data extracted from the RCP experiment has been plotted using MATLAB, which is shown in the Figure 20d. The acceptable agreement of the laboratory test results with the simulation results shows the operability of the introduced controller.
Table 5.
Controller optimal parameters for RCP test on first-order system.
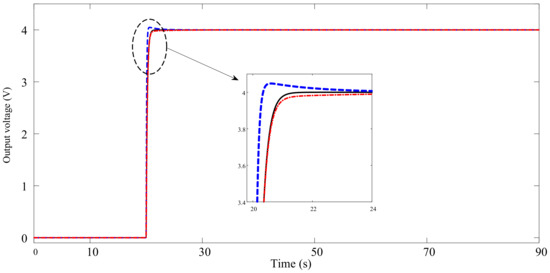
Figure 18.
Dynamic behavior of the closed-loop test system with different controllers. Solid: Proposed controller, dashed: PID controller, and dashed&dotted: PI Controller.
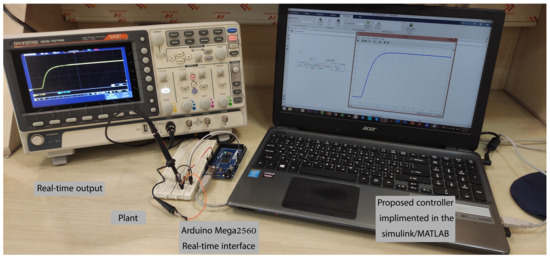
Figure 19.
System configuration for RCP test.
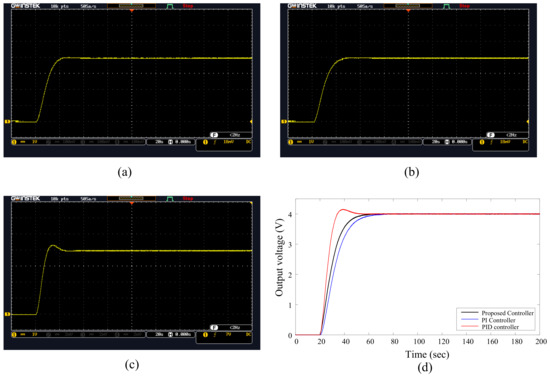
Figure 20.
Output voltage waveform (capacitor voltage) in closed-loop system with different controllers. (a) PDDN-I, (b) PI, (c) PID, and (d) All-in-one plot using extracted real-time data in MATLAB.
6. Conclusions and Discussion
This paper introduced a novel master-slave PDDN-I controller to frequency control of an interconnected MG. The proposed controller consists of an IO controller (PDDN) in the OCL as the master controller. In the ICL, there is only a simple FO integrator (I) as the slave controller. For improving the system control efforts, its parameters are optimized using the JAYA algorithm. Various studies, including sudden load changes in the both areas, output deviations of the RESs-based units, and uncertainties in the system’s basic parameters, are investigated. Studies have been performed with and without the participation of EVs. In each case, the system’s dynamics behavior by applying the proposed controller, is compared with the PIDN and PIDA controllers. Studies of the system behavior in different conditions and evaluation of performance indicators as well as the quality of the and waveforms indicate the complete dominance of the proposed PDDN- I controller over the other two controllers. Optimal use of EVs capacities in the MG due to the high-quality of the proposed controller in error-clearing without having to make sudden changes in the entry/exit of different amounts of EVs in the LFC process, is the main advantage of the proposed controller. After testing the performance of the controllers in the presence of EVs and demonstrating the superior efficiency of the suggested controller, the system was evaluated in the lack of EVs. Under these conditions, the PDDN-I master-slave controller is performed a robust performance. In the absence of EVs, the IAE, ITSE, and OC indices are 90%, 98%, and 94% better than the PID controller, as well as 84%, 98%, and 98% better than the PIDA controller. Also, the verification of the real-time performance of the proposed controller has been done on a first-order closed-loop system, and the good match between the simulation results and the RCP test is a confirmation of the possibility of real implementation of the controller.
In short, the simplistic and operational structure, independence and high capabilities of the controller in error correction, meliorating various time-domain indicators, great capabilities in the face of parametric uncertainties in the presence of nonlinear factors, are of the proposed PDDN- controller’s important advantages. Thus, this control mechanism can be useful for a realistic multi-are MG frequency control.
Author Contributions
Conceptualization, H.S. and N.B.; methodology, H.S.; software, A.R. and R.M.; validation, H.S., N.B. and A.R.; formal analysis, H.S.; investigation, A.R. and R.M.; resources, N.B., L.M.I. and A.G.M.; data curation, N.B., L.M.I. and A.G.M.; writing—original draft preparation, A.R.; writing—review and editing, H.S. and N.B.; visualization, A.R.; supervision, H.S. and N.B.; project administration, H.S.; funding acquisition, N.B., L.M.I. and A.G.M. All authors have read and agreed to the published version of the manuscript.
Funding
This research received no external funding.
Conflicts of Interest
The authors declare no conflict of interest.
Nomenclature
| Abbreviations | |
| ACE | Area control error |
| AGC | Load frequency controlss |
| ESS | Energy storage system |
| EV | Electric vehicle |
| FO | Fractional order |
| GDB | Governor dead-band |
| GRC | Generation rate constraint |
| HIL | Hardware in the loop |
| IAE | Integral of absolute error |
| ICL | Inner control loop |
| IO | Integer order |
| IPD | Injected power deviation |
| IPS | Inter connected power system |
| ITAE | Integral of time-weighted absolute error |
| ITSE | Integral of time-weighted square error |
| LFC | Load frequency controls |
| MG | Microgrid |
| MIL | Model in the loop |
| OC | Objective cost |
| OCL | Outer control loop |
| PDDN | Proportional-double-derivative with filter |
| PEV | Plug-in electric vehicle |
| PI | Proportional-integral |
| PID | Proportional-integral-derivative |
| PIDA | Proportional-integral-derivative-acceleration controller |
| PIL | Processor in the loop |
| PSO | Particle swarm optimization |
| RCP | Rapid control prototyping |
| RES | Renewable energy source |
| SLP | Step load perturbation |
| SOC | State of charge |
| Parameters & Variables | |
| Frequency fluctuations of the j-th area | |
| Changes in the reference power of the unit | |
| Euler’s gamma function | |
| Fractional operator | |
| Quantities related to aqua electrolyzer | |
| D | Damping factor |
| Quantities related to diesel engine generators | |
| Quantities related to the fuel cell | |
| Optimization algorithm number of iterations | |
| K | Gains |
| k | Number of iterated differentiations |
| Proportional, integral, and derivative gains | |
| M | Inertia factor |
| PSO algorithm number of population | |
| Quantities related to phtovoltaic cells | |
| T | Time constants |
| Self and global learning coefficients of the PSO Algorithm | |
| Quantities related to wind turbine Generator | |
Appendix A. Model Parameters
.
Appendix B. PSO Algorithm Parameters]PSO Algorithm Parameters
.
References
- Martins, F.; Felgueiras, C.; Smitkova, M.; Caetano, N. Analysis of Fossil Fuel Energy Consumption and Environmental Impacts in European Countries. Energies 2019, 12, 694. [Google Scholar] [CrossRef]
- Arya, Y.; Kumar, N.; Dahiya, P.; Sharma, G.; Çelik, E.; Dhundhara, S.; Sharma, M. Cascade-IλDμN controller design for AGC of thermal and hydro-thermal power systems integrated with renewable energy sources. IET Renew. Power Gener. 2021, 15, 504–520. [Google Scholar] [CrossRef]
- Khooban, M.H. Secondary Load Frequency Control of Time-Delay Stand-Alone Microgrids With Electric Vehicles. IEEE Trans. Ind. Electron. 2018, 65, 7416–7422. [Google Scholar] [CrossRef]
- Khooban, M.H.; Niknam, T.; Blaabjerg, F.; Dragičević, T. A new load frequency control strategy for micro-grids with considering electrical vehicles. Electr. Power Syst. Res. 2017, 143, 585–598. [Google Scholar] [CrossRef]
- Pham, T.N.; Nahavandi, S.; Hien, L.V.; Trinh, H.; Wong, K.P. Static Output Feedback Frequency Stabilization of Time-Delay Power Systems with Coordinated Electric Vehicles State of Charge Control. IEEE Trans. Power Syst. 2017, 32, 3862–3874. [Google Scholar] [CrossRef]
- Pham, T.N.; Trinh, H.; Hien, L.V. Load Frequency Control of Power Systems With Electric Vehicles and Diverse Transmission Links Using Distributed Functional Observers. IEEE Trans. Smart Grid 2016, 7, 238–252. [Google Scholar] [CrossRef]
- Singh, M.; Kumar, P.; Kar, I. Implementation of Vehicle to Grid Infrastructure Using Fuzzy Logic Controller. IEEE Trans. Smart Grid 2012, 3, 565–577. [Google Scholar] [CrossRef]
- Alhelou, H.H.; Hamedani-Golshan, M.E.; Zamani, R.; Heydarian-Forushani, E.; Siano, P. Challenges and Opportunities of Load Frequency Control in Conventional, Modern and Future Smart Power Systems: A Comprehensive Review. Energies 2018, 11, 2497. [Google Scholar] [CrossRef]
- Escudero-Garzas, J.J.; Garcia-Armada, A.; Seco-Granados, G. Fair Design of Plug-in Electric Vehicles Aggregator for V2G Regulation. IEEE Trans. Veh. Technol. 2012, 61, 3406–3419. [Google Scholar] [CrossRef]
- Shayeghi, H.; Younesi, A. Mini/Micro-Grid Adaptive Voltage and Frequency Stability Enhancement. J. Oper. Autom. Power Eng. 2019, 7, 107–118. [Google Scholar]
- Saxena, A.; Shankar, R. Improved load frequency control considering dynamic demand regulated power system integrating renewable sources and hybrid energy storage system. Sustain. Energy Technol. Assess. 2022, 52, 102245. [Google Scholar] [CrossRef]
- Shayeghi, H.; Rahnama, A.; Alhelou, H. Frequency control of fully-renewable interconnected microgrid using fuzzy cascade controller with demand response program considering. Energy Rep. 2021, 7, 6077–6094. [Google Scholar] [CrossRef]
- Arya, Y.; Dahiya, P.; Çelik, E.; Sharma, G.; Gözde, H.; Nasiruddin, I. AGC performance amelioration in multi-area interconnected thermal and thermal-hydro-gas power systems using a novel controller. Eng. Sci. Technol. Int. J. 2021, 24, 384–396. [Google Scholar] [CrossRef]
- Sundararaju, N.; Vinayagam, A.; Veerasamy, V.; Subramaniam, G. A Chaotic Search-Based Hybrid Optimization Technique for Automatic Load Frequency Control of a Renewable Energy Integrated Power System. Sustainability 2022, 14, 5668. [Google Scholar] [CrossRef]
- Latif, A.; Hussain, S.S.; Das, D.C.; Ustun, T.S.; Iqbal, A. A review on fractional order (FO) controllers’ optimization for load frequency stabilization in power networks. Energy Rep. 2021, 7, 4009–4021. [Google Scholar] [CrossRef]
- Mohamed, R.; Helaimi, M.; Taleb, R.; Gabbar, H.A.; Othman, A.M. Frequency control of microgrid system based renewable generation using fractional PID controller. Indones. J. Electr. Eng. Comput. Sci. 2020, 19, 745–755. [Google Scholar] [CrossRef]
- Shayeghi, H.; Rahnama, A. Designing a PD-(1+PI) Controller for LFC of an Entirely Renewable Microgrid Using PSO-TVAC. Int. J. Tech. Phys. Prob. Eng. (IJTPE) 2020, 12, 19–27. [Google Scholar]
- Choudhary, R.; Rai, J.; Arya, Y. Cascade FOPI-FOPTID controller with energy storage devices for AGC performance advancement of electric power systems. Sustain. Energy Technol. Assess. 2022, 53, 102671. [Google Scholar] [CrossRef]
- Shayeghi, H.; Ghasemi, A. Improvement of Frequency Fluctuations in Microgrids Using an Optimized Fuzzy P-PID Controller by Modified Multi Objective Gravitational Search Algorithm. Iran. J. Electr. Electron. Eng. 2016, 12, 241–256. [Google Scholar]
- Pan, I.; Das, S. Fractional order fuzzy control of hybrid power system with renewable generation using chaotic PSO. ISA Trans. 2016, 62, 19–29. [Google Scholar] [CrossRef]
- Arya, Y. Effect of electric vehicles on load frequency control in interconnected thermal and hydrothermal power systems utilising CF-FOIDF controller. IET Gener. Transm. Distrib. 2020, 14, 2666–2675. [Google Scholar] [CrossRef]
- Abou El-Ela, A.A.; El-Sehiemy, R.A.; Shaheen, A.M.; Diab, A.E.G. Design of cascaded controller based on coyote optimizer for load frequency control in multi-area power systems with renewable sources. Control Eng. Pract. 2022, 121, 105058. [Google Scholar] [CrossRef]
- Sharma, M.; Saxena, S.; Prakash, S.; Dhundhara, S.; Arya, Y. Frequency stabilization in sustainable energy sources integrated power systems using novel cascade noninteger fuzzy controller. Energy Sources Part A Recovery Util. Environ. Eff. 2022, 44, 6213–6235. [Google Scholar] [CrossRef]
- Sariki, M.; Shankar, R. Optimal CC-2DOF(PI)-PDF controller for LFC of restructured multi-area power system with IES-based modified HVDC tie-line and electric vehicles. Eng. Sci. Technol. Int. J. 2021, 32, 101058. [Google Scholar] [CrossRef]
- Kumari, S. Maiden application of cascade tilt-integral–tilt-derivative controller for performance analysis of load frequency control of interconnected multi-source power system. IET Gener. Transm. Distrib. 2019, 13, 5326–5338. [Google Scholar] [CrossRef]
- Khokhar, B.; Dahiya, S.; Singh Parmar, K. A robust Cascade controller for load frequency control of a standalone microgrid incorporating electric vehicles. Electr. Power Comp. Syst. 2020, 48, 711–726. [Google Scholar] [CrossRef]
- Oshnoei, S.; Aghamohammadi, M.; Oshnoei, S.; Oshnoei, A.; Mohammadi-Ivatloo, B. Provision of Frequency Stability of an Islanded Microgrid Using a Novel Virtual Inertia Control and a Fractional Order Cascade Controller. Energies 2021, 14, 4152. [Google Scholar] [CrossRef]
- Jena, S.; Mishra, S.; Ganthia, B.P.; Samal, S.K. Load Frequency Control of a Four-Area Interconnected Power System Using JAYA Tuned PID Controller and Derivative Filter. In Sustainable Energy and Technological Advancements; Springer: Berlin/Heidelberg, Germany, 2022; pp. 497–511. [Google Scholar]
- Wiora, J.; Wiora, A. Influence of methods approximating fractional-order differentiation on the output signal illustrated by three variants of Oustaloup filter. Symmetry 2020, 12, 1898. [Google Scholar] [CrossRef]
- Kumar, B.; Adhikari, S.; Datta, S.; Sinha, N. Real time simulation for load frequency control of multisource microgrid system using grey wolf optimization based modified bias coefficient diagram method (GWO-MBCDM) controller. J. Electr. Eng. Technol. 2021, 16, 205–221. [Google Scholar] [CrossRef]
- Shimizu, K.; Masuta, T.; Ota, Y.; Yokoyama, A. Load Frequency Control in power system using Vehicle-to-Grid system considering the customer convenience of Electric Vehicles. In Proceedings of the 2010 International Conference on Power System Technology, Hangzhou, China, 24–28 October 2010; pp. 1–8. [Google Scholar]
- Datta, M.; Senjyu, T. Fuzzy Control of Distributed PV Inverters/Energy Storage Systems/Electric Vehicles for Frequency Regulation in a Large Power System. IEEE Trans. Smart Grid 2013, 4, 479–488. [Google Scholar] [CrossRef]
- Monje, C.A.; Chen, Y.; Vinagre, B.M.; Xue, D.; Feliu-Batlle, V. Fractional-Order Systems and Controls: Fundamentals and Applications; Springer Science & Business Media: London, UK, 2010. [Google Scholar]
- Padula, F.; Visioli, A. Advances in Robust Fractional Control; Springer: Berlin/Heidelberg, Germany, 2015. [Google Scholar]
- Debbarma, S.; Saikia, L.C.; Sinha, N. AGC of a multi-area thermal system under deregulated environment using a non-integer controller. Electr. Power Syst. Res. 2013, 95, 175–183. [Google Scholar] [CrossRef]
- Podlubny, I. Fractional Differential Equations, 1st ed.; Elsevier Science Publishing Co. Inc.: Amsterdam, The Netherlands, 1998; Volume 198. [Google Scholar]
- Jeng, J.C.; Liao, S.J. A Simultaneous Tuning Method for Cascade Control Systems Based on Direct Use of Plant Data. Ind. Eng. Chem. Res. 2013, 52, 16820–16831. [Google Scholar] [CrossRef]
- Tasnin, W.; Saikia, L.C. Maiden application of an sine–cosine algorithm optimised FO cascade controller in automatic generation control of multi-area thermal system incorporating dish-Stirling solar and geothermal power plants. IET Renew. Power Gener. 2018, 12, 585–597. [Google Scholar] [CrossRef]
- Puangdownreong, D. Application of Current Search to Optimum PIDA Controller Design. Intel. Contr. Autom. 2012, 3, 303–312. [Google Scholar] [CrossRef]
- Tepljakov, A. Fractional-Order Modeling and Control of Dynamic Systems; Springer: Berlin/Heidelberg, Germany, 2017. [Google Scholar]


Publisher’s Note: MDPI stays neutral with regard to jurisdictional claims in published maps and institutional affiliations. |
© 2022 by the authors. Licensee MDPI, Basel, Switzerland. This article is an open access article distributed under the terms and conditions of the Creative Commons Attribution (CC BY) license (https://creativecommons.org/licenses/by/4.0/).