Article

Optimising Health Emergency Resource Management from Multi-Model Databases

1
Grupo TIC-144 del Plan Andaluz de Investigación, Universidad de Jaén, 23071 Jaén, Spain
2
Department Tecnologías de la Información y Comunicación aplicadas a la Educación, Universidad Internacional de La Rioja, 26006 Logroño, Spain
3
Department Ingeniería Cartográfica, Geodésica y Fotogrametría, Campus Las Lagunillas, Universidad de Jaén, Edif. A3, 23071 Jaén, Spain
*
Author to whom correspondence should be addressed.
Electronics 2022, 11(21), 3602; https://doi.org/10.3390/electronics11213602
Submission received: 27 September 2022 / Revised: 26 October 2022 / Accepted: 3 November 2022 / Published: 4 November 2022
(This article belongs to the Special Issue Knowledge Engineering and Data Mining)

Abstract

:
The health care sector is one of the most sensitive sectors in our society, and it is believed that the application of specific and detailed database creation and design techniques can improve the quality of patient care. In this sense, better management of emergency resources should be achieved. The development of a methodology to manage and integrate a set of data from multiple sources into a centralised database, which ensures a high quality emergency health service, is a challenge. The high level of interrelation between all of the variables related to patient care will allow one to analyse and make the right strategic decisions about the type of care that will be needed in the future, efficiently managing the resources involved in such care. An optimised database was designed that integrated and related all aspects that directly and indirectly affected the emergency care provided in the province of Jaén (city of Jaén, Andalusia, Spain) over the last eight years. Health, social, economic, environmental, and geographical information related to each of these emergency services was stored and related. Linear and nonlinear regression algorithms were used: support vector machine (SVM) with linear kernel and generated linear model (GLM), and the nonlinear SVM with Gaussian kernel. Predictive models of emergency demand were generated with a success rate of over 90%.

1. Introduction

The health sector is one of the most sensitive sectors in our society, and proof of this are the resources and efforts that are invested worldwide in trying to improve the management of the health system, especially in the optimisation of health resources [1]. Although there has been a huge change in the way diseases are diagnosed and treated, there has been little change in the way health services are managed in the 21st century. A number of academic studies have emerged in the field of service design, but not much of this research is available, especially in the field of health services [2]. An overview of the current state-of-the-art in this area shows that the vast majority of it is aimed at achieving greater economic efficiency in some aspects of the sector. There is scientific work in which different techniques have been tested in order to improve the management of health care resources. In this sense, Cubillas et al. [3] used tools of data mining to improve the appointment scheduling in primary health care centres. The results show that it is possible to predict, with a very acceptable level of precision, the number of patients who will attend the health centre each day. For this purpose, a series of historical assistance data were used. In this type of work, the quantity and quality of available data are the keys to generate an adequate predictive model. Similarly, other research has used spatial analysis to improve the effectiveness of these predictive algorithms, and confirms that the use of spatial data extends the scope of predictive models [4]. Additionally, the use of statistical methods to anticipate patient arrival rates in health care organisations allows one to schedule the internal staff in order to meet the demand for service driven by the patient arrival rate [5]. Nevertheless, this research had the limitation of the use of a few months of data to draw inferences about the patient arrival. This issue generates insights that are less reliable and more subject to short-term idiosyncrasies in data. In short, all types of research based on models that provide advance information on the behaviour of a phenomenon such as the demand for health resources are highly dependent on aa large volume of available data with a high spatio-temporal quality.
There is no relevant history of the implementation of systems that provide a daily and sufficiently early forecast of the demand for resources in emergency health services (i.e., that provide direct location and management of the resources that attend to patients on a daily basis) [6]. There are some studies that have highlighted an important increase in the need to optimise the structure of databases in order to face the demand for new necessary data in health care management [7,8]. An example of this is the implementation of telemedicine systems and the adaptation to the new information laws, thanks to the new broadband communications that are beginning to become generalised [9].
In the second decade of the 21st century, there has been an increase in publications aimed to improve the structure of databases adapted to daily management as a way to obtain more detailed health information. New channels of communication between the patient and health care services are proliferating by means of portable devices such as tablets and smartphones, or using a PC [10,11]. Subsequently, research in this sector has maintained this line of work and new challenges appear on the horizon. Moreover, the global pandemic initiated in 2020 by the novel severe acute respiratory syndrome (SARS)-CoV-2 virus (coronavirus disease 2019 [COVID-19]), has led to drastic changes in health priorities. Biomedical priorities have come to dominate the agenda, highlighting the multi-sectoral knowledge gaps and the challenges to be addressed for health management of the pandemic. In contrast, information management and decision support systems took a back seat [12]. However, once the process of immunisation of the population has begun, it is time to take stock and analyse how health resources have been managed and whether, in some way, correct decision making could have prevented the saturation of health services. There are many and varied data to be assessed in order to carry out an adequate management of health care resources. Despite the current pandemic, the demand for health care continues to be motivated by different pathologies and for different reasons.
In short, nowadays, more and more data are available, all from different sources, with different formats and different temporality and resolution. It is therefore necessary to properly manage and integrate a variety of data from new input devices used in health into centralised databases. It is also important that these databases are able to integrate any new variables resulting from the progress of health research. In this way, the usefulness of the database, in addition to assuming an effective resource management tool and providing quality to the service, would also have an important role in disease monitoring [13,14]. This scenario requires the development of specific tools and methodologies aimed at achieving these health management goals such as Hamami et al. (2019) [15], who highlighted that achieving the best model is a complex task due to the interaction of many components and the variability of parameter values that lead to radically different dynamics. It therefore points out that the modelling process can be improved through the use of data mining techniques [16]. Another example of the use of data mining techniques in health care management for decision making has already concluded that they can influence the costs, revenue, and operational efficiency while maintaining a high level of patient care [17].
There are, therefore, many aspects to consider and, above all, the large amount of data that is generated every day around a health service must be managed. Thus, in addition to data mining tools, it is an important area of application for big data [18], which is known as medical big data [19]. Medical big data comes from a variety of sources such as administrative records, clinical records, biometric data, data from patient reports, etc. They also are large in scale, extremely fast in update, polymorphic, incomplete, and time sensitive [20]. In addition, whether or not the data are used appropriately remains an open question. The data warehouse (DW) is the answer to data processing, but the applications of traditional DW methods in the health care domain require considerable attention due to the unique business nature of this industry [21]. Muji et al. (2010) [22] proposed a data-driven approach to the development of health information systems, which involved a database-centric system where different applications share the same integrated data source. The database design provides the necessary scalability to cover other specialised applications without the need for structural changes at the database level. The achievement of this objective requires databases with administrative and health care information data from several consecutive years [6,23,24] as well as an efficient model for storing and retrieving big health data to achieve valid estimates for optimal and quality management [25]. In short, in terms of offering an improvement in the quality of health care, it is essential to adapt database systems for use in DW and big data technologies and in their exploitation techniques.
In the field of health emergencies, we can cite the work of Graham et al. 2018 [26] in which a predictive study was carried out on the flow of patients to the emergency department from hospitals by using records from two large hospitals in the city of Northern Ireland. This work achieved a reliability of more than 80%.
Other more recent studies such as those by Gurazada et al. (2022) [27] have conducted predictive work on the length of stay of patients in the emergency department. Sixteen potentially relevant factors impacting on waiting times were identified through a literature review.
All of this work contributes to improving patient care by providing health care resource managers with advance information. These studies handle a large volume of patient data. However, in an emergency department, a large amount of data is recorded. Not only patient data, but also data about the service provided, the resources used, and external factors at the time of the emergency. The correct organisation and storage of this heterogeneous information in a database multiplies the possibilities of extracting hidden knowledge as well as predictive capabilities from the data.
This work focused on the management aspect of emergency health resources. It presents the design of a database that is complex enough, that is, with multiple variables extracted from each health emergency demand, to integrate all types of health information to allow for advanced knowledge and better management of these resources, thus providing quality patient care. The aim of this work was the design and implementation of a multidisciplinary database containing all of the information of the complete process of management and resolution of emergencies in the city of Jaén, in Andalusia, southern Spain. This database will serve as a source to apply and analyse regression algorithms of data mining in order to predict the demand for emergency resources that will occur in the coming days.

2. Methodology/Methods

2.1. Methodology of Work in Emergencies in Andalusia

An emergency is defined as a situation in which a person’s life is in danger, otherwise, it is identified as an urgency. Currently, there is a free emergency telephone number available to citizens in Andalusia (061), Spain, and an urgency number (902505061). This service is provided by EPES (Public Company of Sanitary Emergencies) [28], which has eight provincial services in Andalusia, one per province. The provincial services are the headquarters from which all of the urgencies and emergencies of each province are managed. The most important nucleus of each provincial service is the coordination room, where all calls made by citizens to the emergency number of each province are received. Each coordination room is formed by one or several coordinating doctors and by a set of telephone managers that manage the citizen’s health demand. These telephone managers attend to the citizen by gathering as much information as possible about the current request, the coordinating doctor participates in this management and finally decides, depending on the seriousness of the patient, which resource is mobilised to resolve the request.
All of the necessary health resources for all of the urgencies and emergencies of the province are mobilised from the coordination room. EPES has its own resources such as the terrestrial emergency teams (mobile UVI) and the air emergency teams (Sanitary Helicopters) as well as coordinating and mobilising all of the emergency resources of the Andalusian Health Service (SAS) and all ambulances from the province’s urgent transport network (RTU). There are approximately 60 units in the Provincial Service of Jaen.
Once the resources have been activated from the coordination room, they are directed to the place of assistance, with all movements of said units being recorded in the computer system, knowing in real-time the geolocation of all of them and the exact moment of resolution of the assistance where it is. All emergency and emergency units have electronic devices (tablets) in which they register the patient’s medical history of the care provided (HCDM Digital Clinical History in Mobility), which is computerised at the same time as the resolution. The most relevant information of this history is sent to the coordinating centre for storage, along with the demand created by the telephone manager at the beginning of the process, ending this demand and giving the cycle a new start (Figure 1).
The previously indicated units are located in pre-set and static locations. A significant improvement in this system would be to change the position of the available resources dynamically, according to the type of assistance they provide, the number of them, and the time of year they are available. For this purpose, the database presented in this work can be an important step forward, as the design, structure, and level of detail of the information stored allow for this objective to be achieved.

2.2. Dataset

The first phase of the work carried out consisted of information gathering, which involved data collection from various agencies involved in the health emergency service. The idea was to identify the idiosyncrasies of the emergency event at each point in time, together with the factors that may have influenced its occurrence, thus enriching the information currently stored in the system. This also involves downloading data from different websites with official statistical data, meteorological, social, and economic data. In the case of this research, data from the last eight years (2013–2020) of health activity in urgencies and emergencies were used. The main characteristic of most of the information integrated in the system is its spatial component. The geolocated data and their descriptions are as follows:
-
Health data: All information related to the health care that the patient has received is stored, since the telephone call is received in the coordinating centre, until the medical team states the case as finished. EPES provided us with all of the data corresponding to the user’s requests for assistance in urgency and emergency situations including diagnosis, clinical trial, treatment, antecedents, resources mobilised and detailed action times as well as the geolocation and their resolution.
In order to enrich the data stored in the system, the following data were included:
-
Atmospheric data: Data collected by the environmental information network of Andalusia (REDIAM) [29]. Data on temperatures, rainfall, humidity, and air quality were downloaded.
-
Sociological data: Data related to the personal information of users were divided into:
o
Economic level of the patients in each area: Analysing, on one hand, the cadastral value of real estate, extracted from the Directorate General for Cadastre of Spain website [30]. We also added an analysis of the current price of housing in each district of the city through real estate web portals.
o
Level of unemployment in patients and their family units: This variable was obtained from data provided by the Spanish National Statistics Institute [31]. This public institution provided us with the type of population in each census tract. In Spain, a census tract composes a small region of the city, 1000 and 2500 residents.
o
Level of study, age of citizens, and members of the family unit: These data were obtained from the website of the Institute of Statistics and Cartography of Andalusia [32].

2.3. Data Mining Algorithms

As indicated in the introduction, in this work, data mining techniques were used, based on the attributes stored in the designed database. Prior to the development of the models, the following techniques were revised:
The predictive study carried out in this work was based on the use of regression algorithms. These included linear regression, logistic regression, the generalised regression model, one-class support vector machine (SVM), etc. In this study, the nature of the variables a priori was unknown, in fact, as discussed above, they are heterogeneous in nature. Linear and nonlinear regression algorithms were used as follows:
-
Linear: Purely linear algorithms have great strength due to their characteristics and simplicity as they are calculated with a simple weighted sum of the variables:
y = β0 + β1 × 1 +...+ βpxp + ϵ
The first algorithm selected in this study was the generalised linear models (GLM) algorithm, which works mathematically as the weighted sum of the features with the mean value of the distribution assumed by the link function g, which can be chosen flexibly depending on the type of result.
g(EY(y|x)) = β0 + β1 × 1 +...βpxp
In other words, this algorithm is an extension of linear algorithms that allows linear or normal distributions and non-constant variances to be modelled. Linear models make a set of restrictive assumptions, in which the target is normally distributed conditional on the value of the predictors with a constant variance, regardless of the value of the predicted response. In this sense, GLM relaxes these restrictions, and for a binary response example, the response is a probability in the range [0, 1] [33,34].
Another linear algorithm selected was SVM, which has the advantage of being able to be used with different kernels. Kernels allow the data to be distributed on a hyperplane according to a function, which facilitates the adaptation of the algorithm to the nature of the data, allowing for infinite transformations.
In this study, we worked with the SVM with linear kernel. When the linear kernel is used, the following transformation is performed
K(x,x′) = x⋅x’
This algorithm has the advantage that it fits very well if the nature of the data is linear, and if there are many predictor variables (as in the case study). Note that in this algorithm, there is no upper limit on the number of predictor attributes, and the only limitations are those imposed by the hardware.
-
Nonlinear: In this case, the SVM algorithm is applied with a Gaussian kernel. This kernel applies the following transformation to the data:
K(x,x′) = exp(−γ||x−x′||2)
The value of γ controls the behaviour of the kernel. When it is very small, the final model is equivalent to that obtained with a linear kernel, as its value increases, the data move away, forming a Gaussian bell in the hyperplane, fitting very well when the nature of the data does not have a linear distribution.
In summary, these are the advantages of these three algorithms in this study, starting from the hypothesis of a priori ignorance of the relationship between the variables with the target attribute and also considering that the training data we had were limited and the predictor variables were numerous. Moreover, the complexity of these algorithms means that the relationship between the attributes used cannot be described by a specific equation.
In short, the following algorithms were applied in this study:
-
Minimum description length (MDL) algorithm [35]: For attribute importance detection, all attributes that do not relate to the target attribute are discarded.
-
Regression algorithms: Once the valid attributes are known, several algorithms are tested in order to determine which of them has better accuracy. Generalised linear models (GLM) [33] and support vector machines (SVM) (linear and Gaussian kernel) [36] algorithms are used. The GLM algorithm is a pure linear model. On the other hand, support vector machines (SVM) is a powerful algorithm based on statistical learning theory. The main advantage of the SVM algorithm is that it can be configured with different kernels, in this case, we used a linear and Gaussian kernel.

3. Results and Discussion

3.1. Database

The workflow of the database design was divided into three phases. The first consisted of data collection from all sources described above. In the second, a data cleaning process was developed to facilitate data management and analysis. In this phase, a process of cleaning, normalisation, and grouping was carried out. We started with the original table, demands, which had 84 attributes, in which all the details of the assistance demands made by the emergency teams can be found. In order to prepare the structure of the database for different types of exploitation, this information was restructured into specific blocks that include several tables. These blocks are as follows:
  • Resources mobilised in emergency assistance
This is the most important block in the database as they are tables that contain the health data. These tables contain all the information corresponding to the assistance provided by the emergency teams during the last eight years in the province of Jaen.
  • Patient personal data
This block includes the patient information fields that contain the personal information of each patient. Most significant fields are the age, sex, date of birth, and address (Table 1).
  • Patient health information fields
These contain the health information of all patients attended. The most significant fields are shown in Table 2.
  • Chronological information fields of the assistance
In relation to the information on the ambulance mobilised for each assistance, the start and end time of each assistance interval is recorded. This information includes the time at which the mobile resource is activated by the coordinating centre, the time at which it arrives at the site of medical assistance, the time elapsed during the action on the patient, the time of transport of the patient to the hospital, and the time at which the mobile resource is available again for the next assistance (Table 3).
  • Weather information
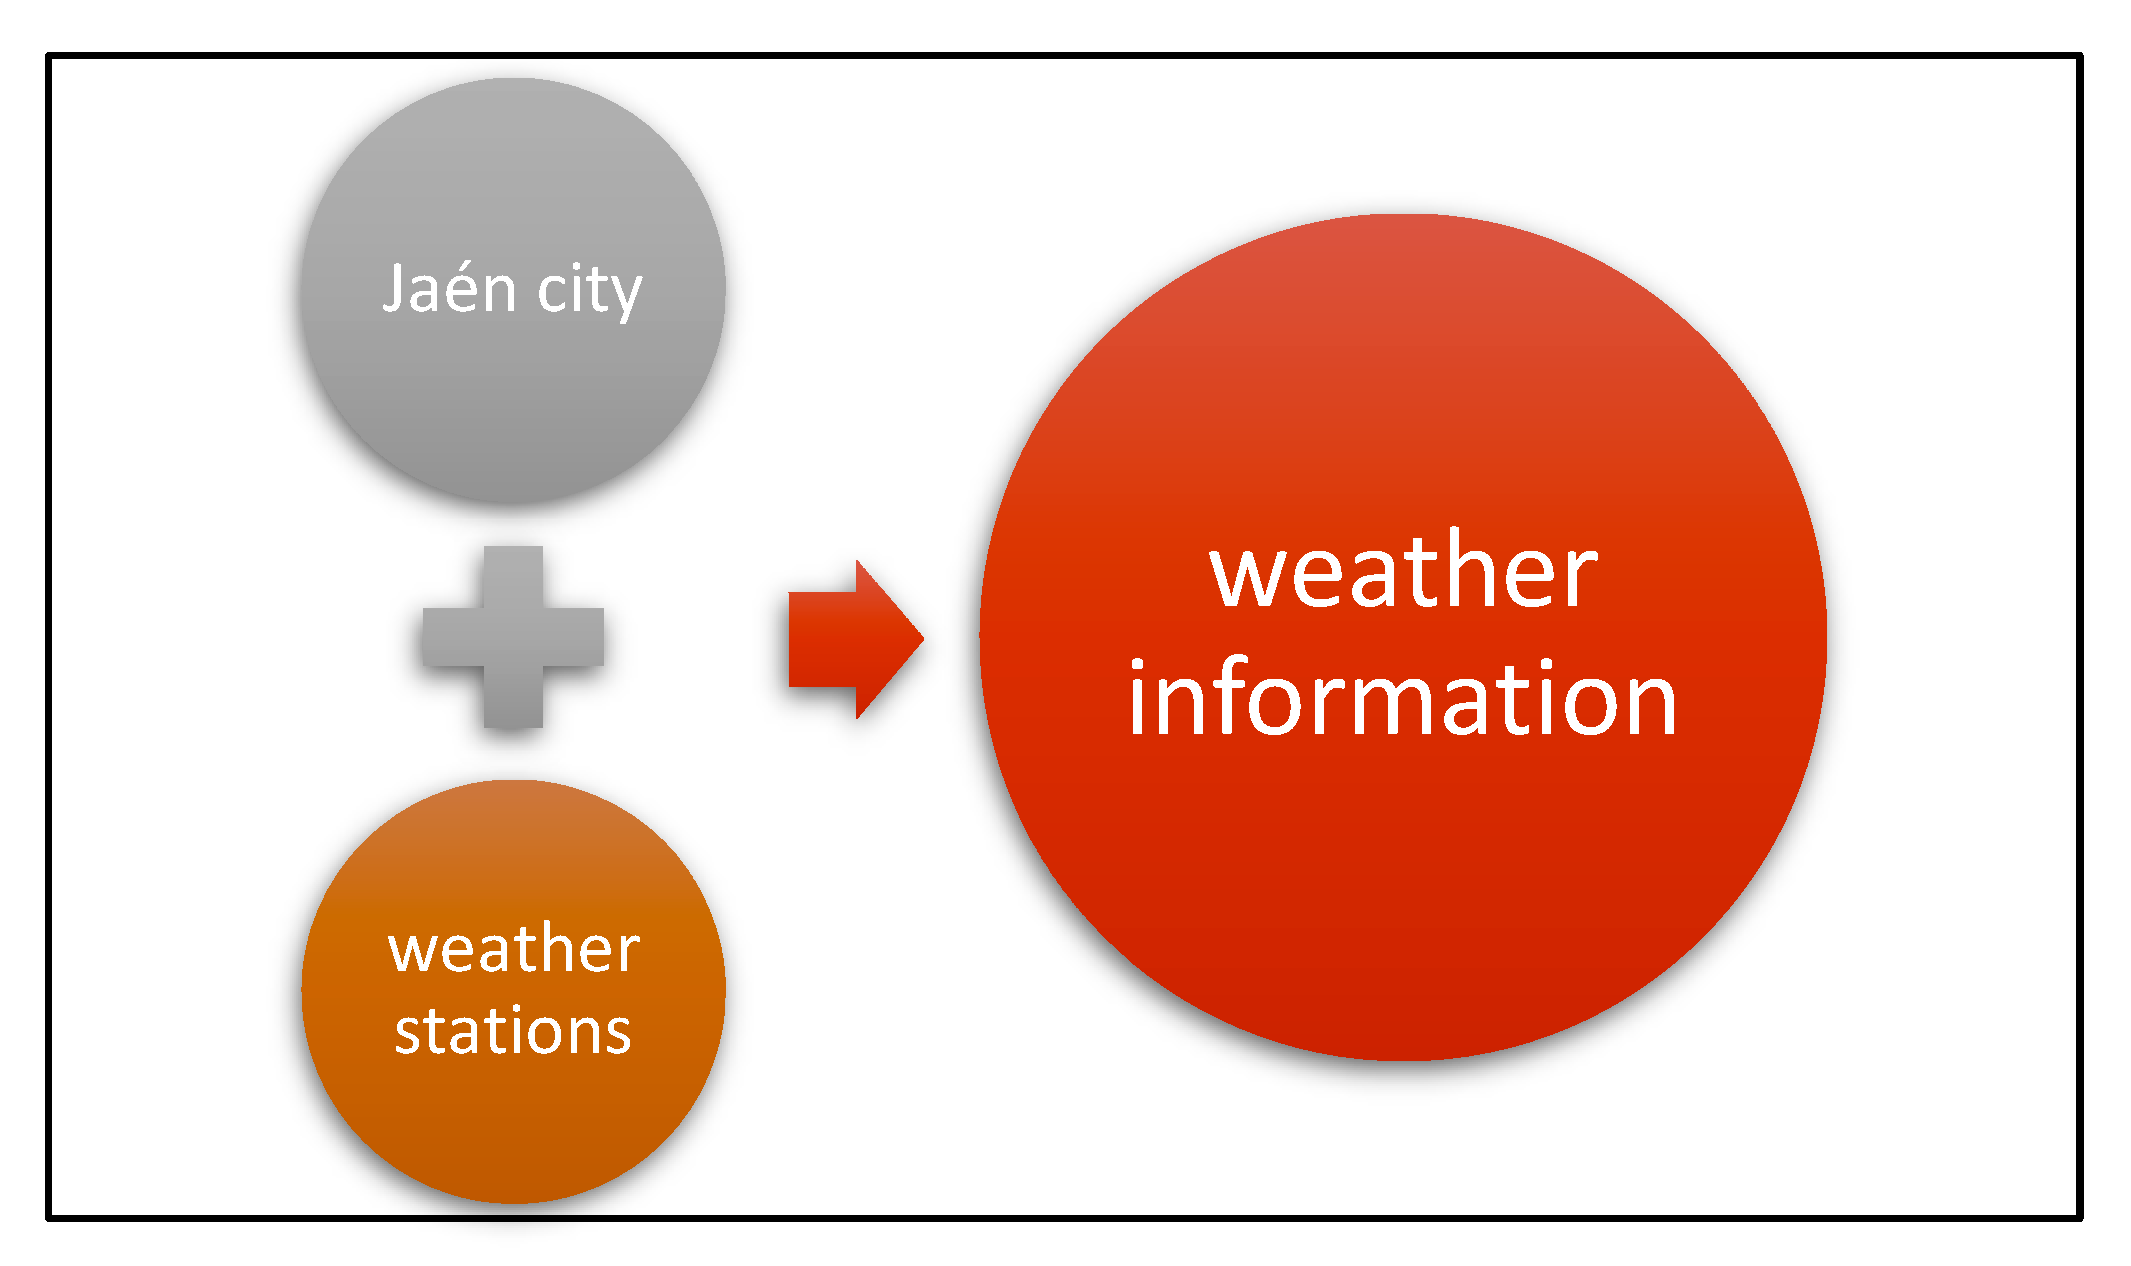
Numerous studies indicate that environmental and weather factors directly influence conditions such as allergies and directly influence the onset of certain diseases such as allergies or certain chronic illnesses. Thus, it is important to bear in mind that Jaén is the largest oil producer in the world and, therefore, the flowering of the olive tree in spring, when temperatures are high, means that many people allergic to pollen demand emergency services. Adverse weather conditions also lead to a proliferation of accidents requiring emergency services. Therefore, it is clear that for a better management of emergency resources, these meteorological factors have to be considered as they can influence a sudden increase in the demand for emergency assistance. In this study, some external factors have been considered that can influence the number of required assistance such as meteorological factors (e.g., minimum, maximum, and average temperature, precipitation, humidity, and daily air quality data). The data downloaded from the website of the Environmental Information Network of Andalusia REDIAM [29] has a field ESTACION_ID, indicating the number of meteorological stations, with a total of 20 meteorological stations monitored throughout the province of Jaén. All atmospheric data collected in the meteorological stations of the urban core of the city of Jaén corresponded to the same period of assistance considered in this research (Figure 2).
  • Sociological information
The urban core is divided into nine districts called postcodes. Because the location of the assistance provided is given by postcode, as much information as possible was collected for each postcode. The source of information used was the Institute of Statistics and Cartography of Andalusia [32], distributed in 100 fields with these generic areas: (1) total number of inhabitants, by sex and age group; (2) marital status of the population, by age group; (3) level of studies, by age group; (4) types of housing, use, regime, size; and (5) households, and number of people that compose it.
  • Geolocated quadrants
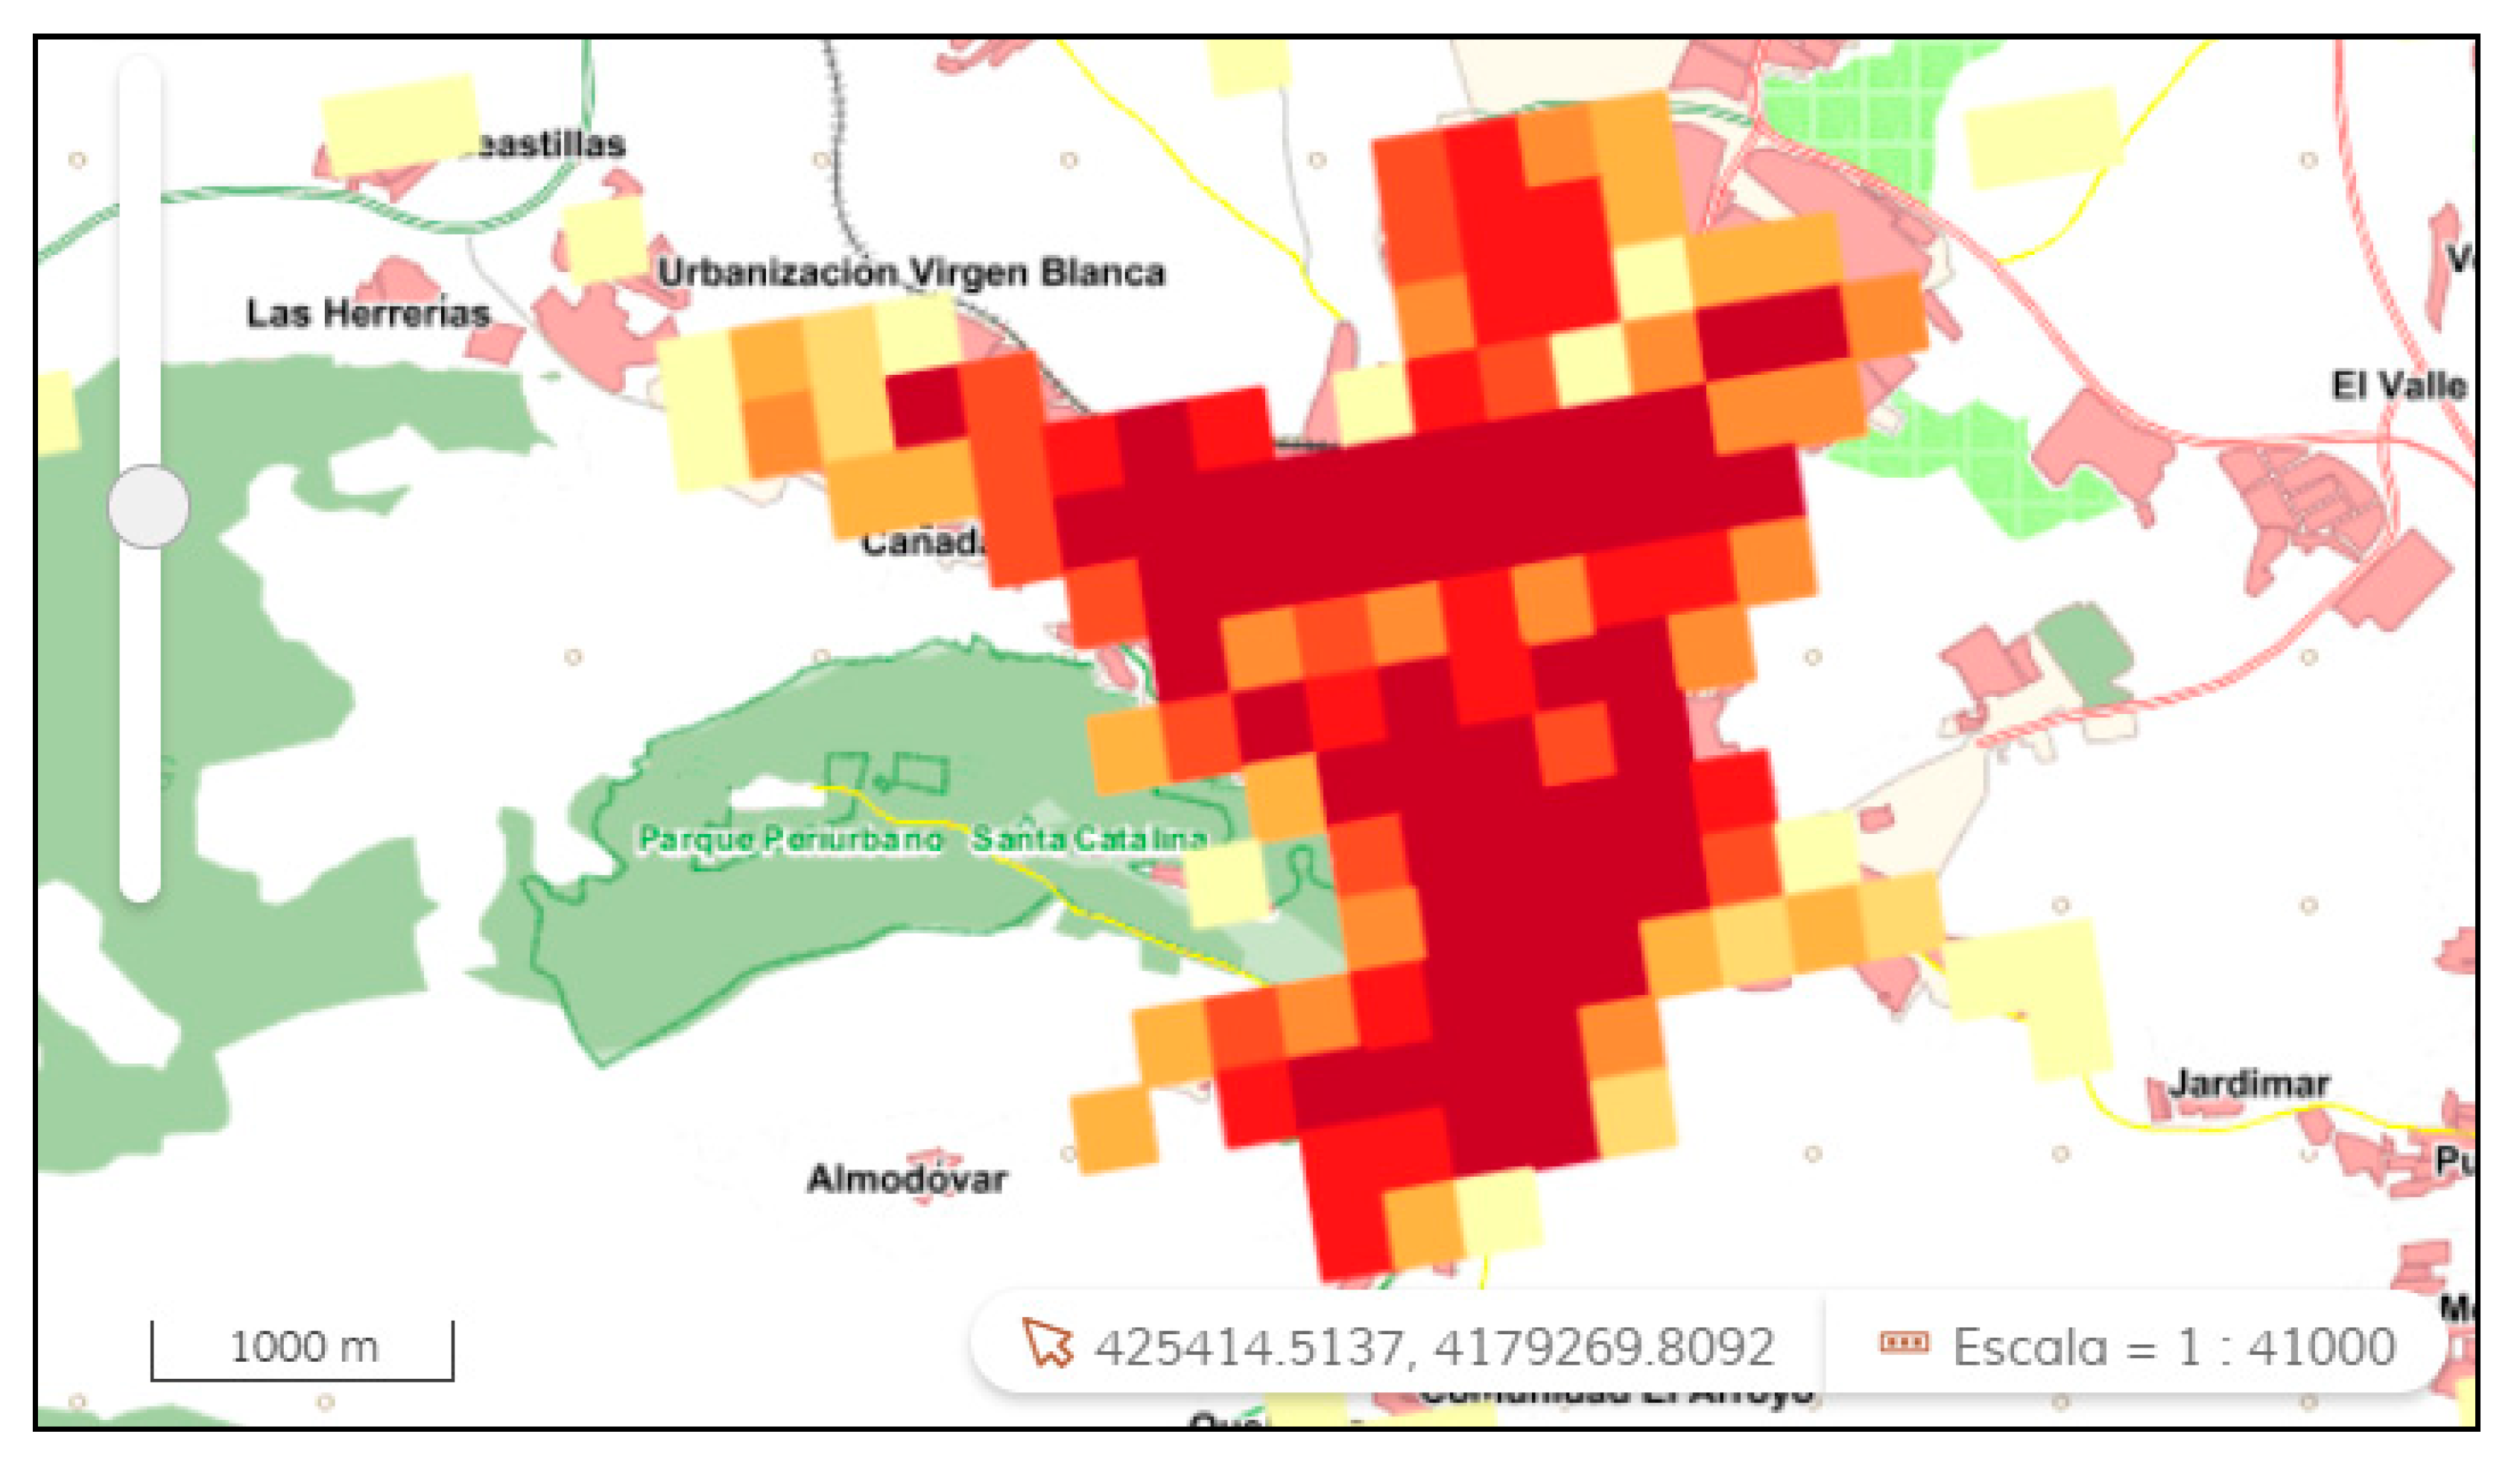
One of the factors that enriches the database is the incorporation of geolocated information. This allows the exploitation of the database to take into account the variability of the information depending on its location. The minimum geographical unit considered is a geolocated quadrant of 250 m, which is the one used by the Institute of Statistics and Cartography of Andalusia [32]. This was not considered in the fragmentation of the urban core map of Jaén in 128 quadrants with cells of 250 m (Figure 3). The information stored for each quadrant was:
-
Quadrant identification;
-
X, Y (UTM Zone 30, ETRS89) coordinates of the four corners;
-
Streets and numbers of them included;
-
Total population by age groups;
-
Employment information: affiliates, for others, in their own and pensioners;
-
Link with zip code.
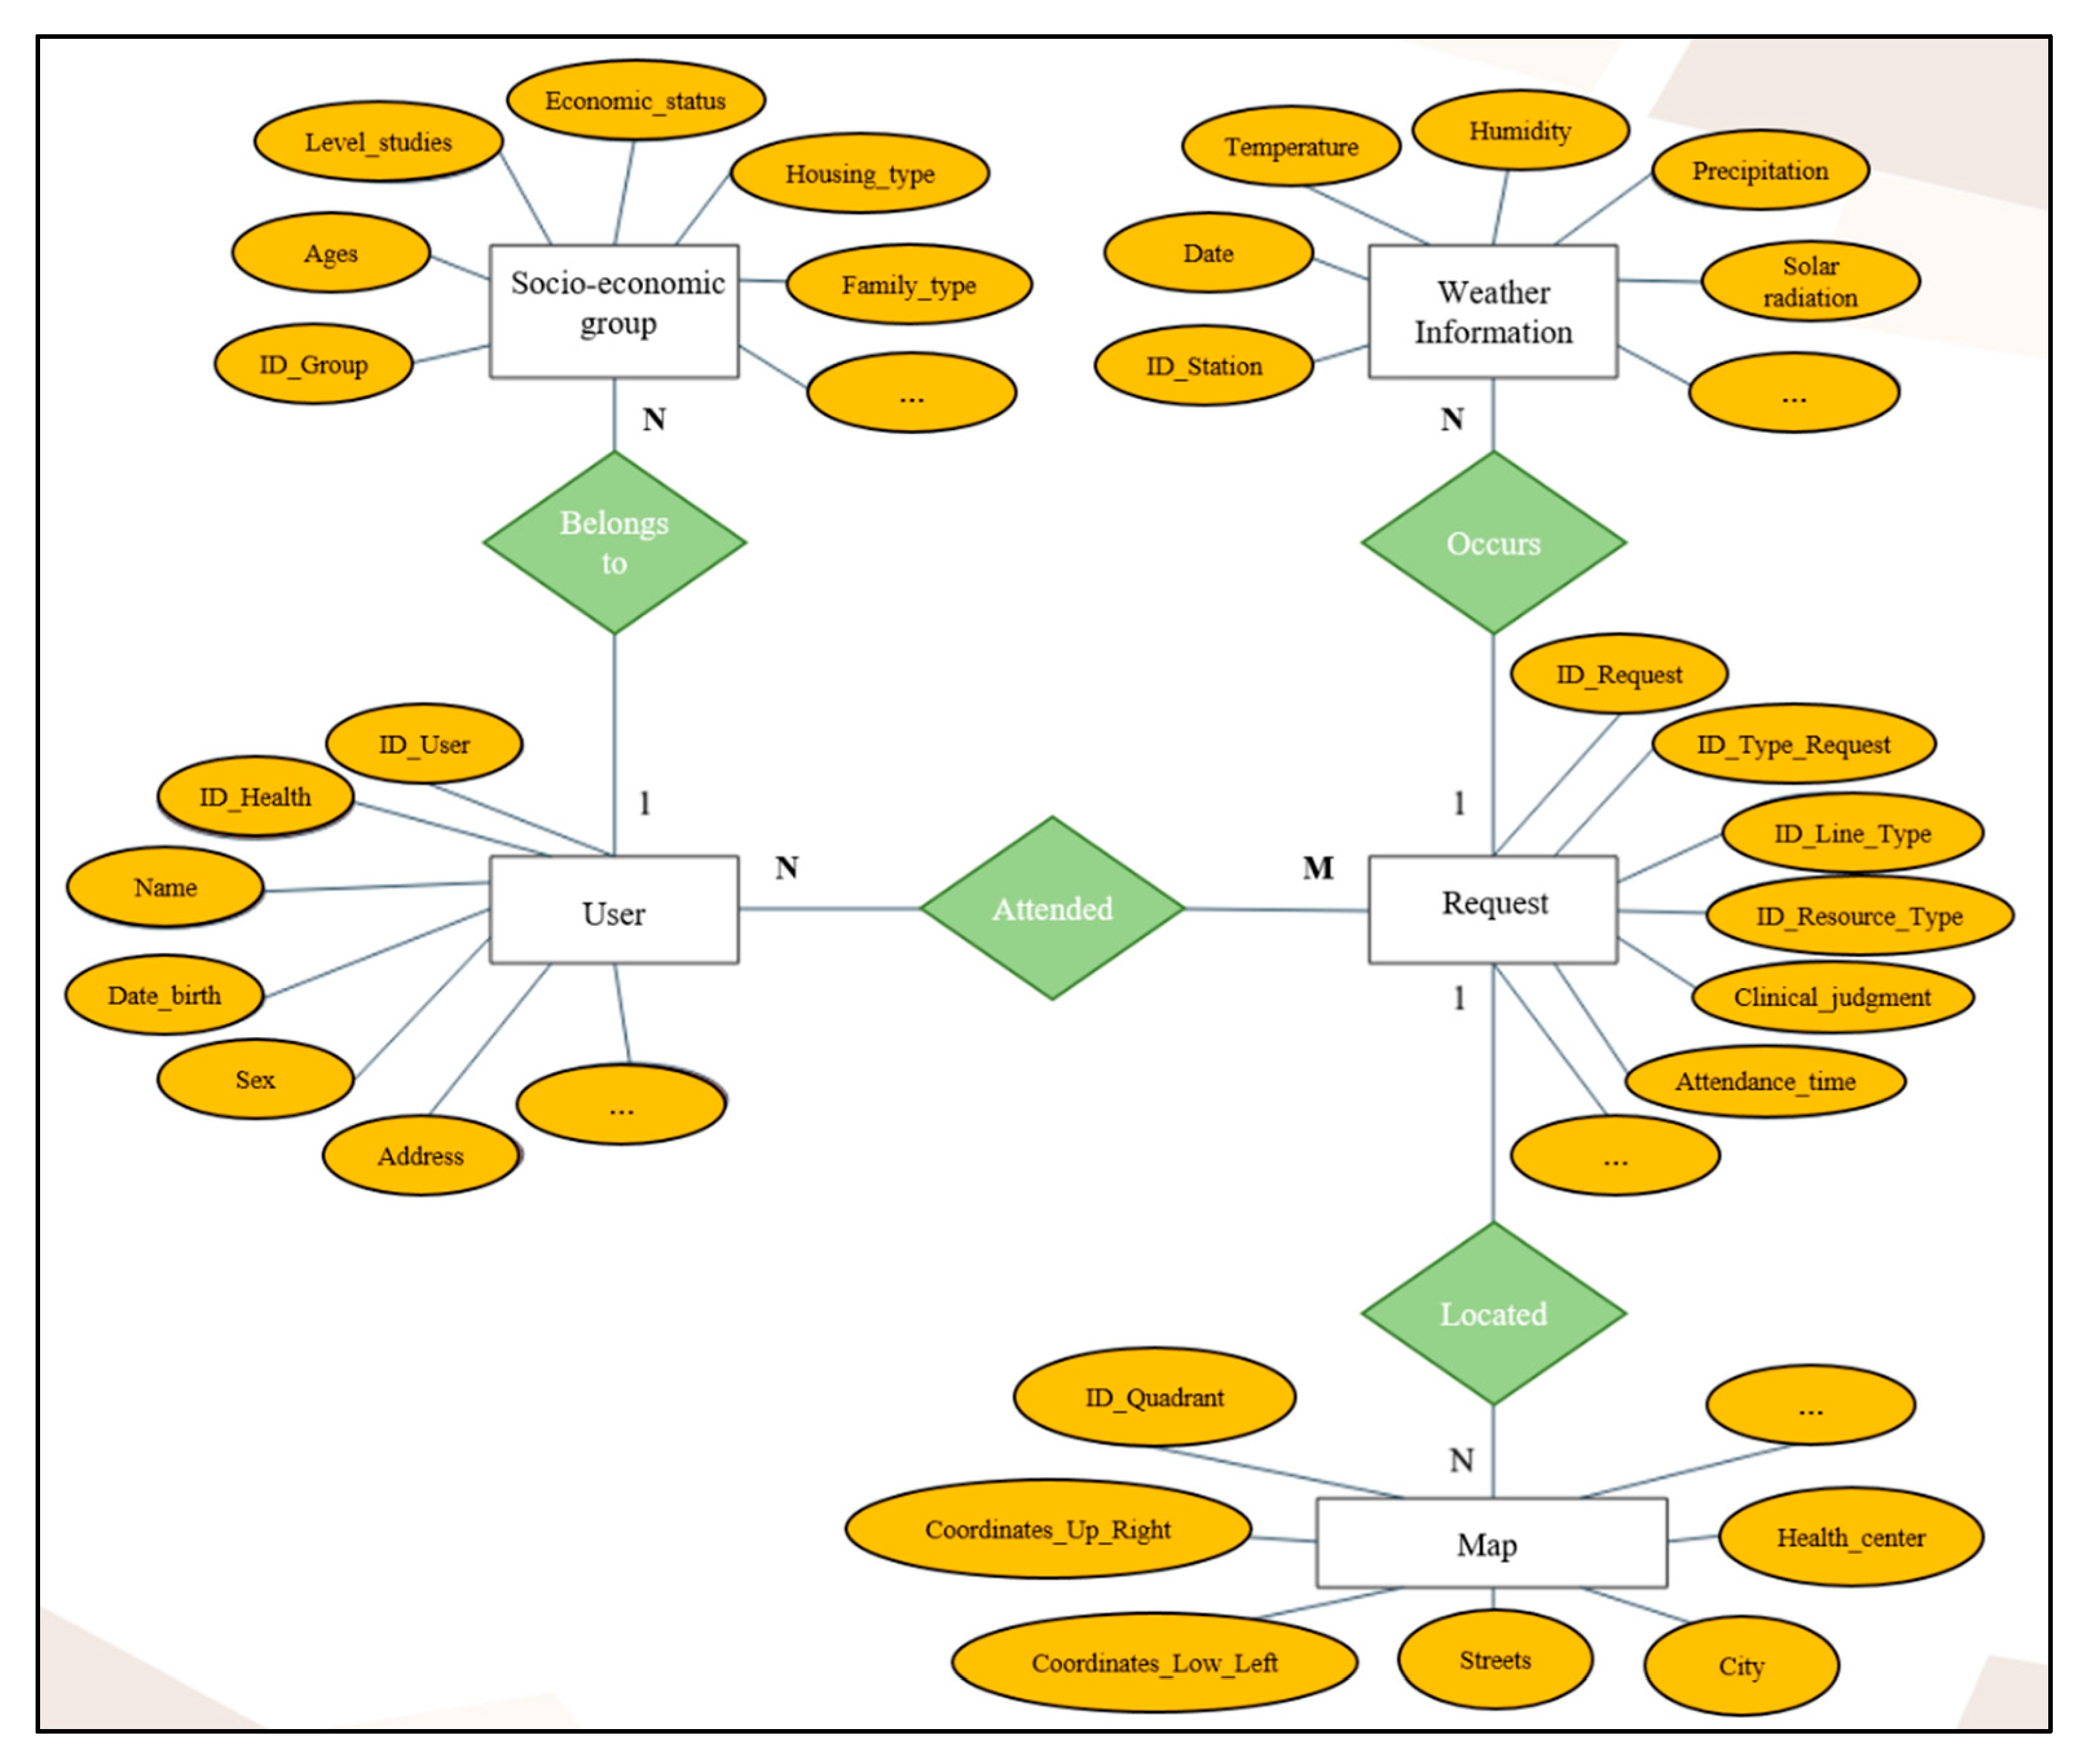
Finally, in the third phase, the database was designed and created. The structure of the entity relationship diagram (ERD) is presented in Figure 4.
The entity relationship model conceptually represents the organisation and relationship of the data in the designed database. In this case, it is a simplified representation as the database has multiple tables (more than 50 tables). The purpose of Figure 4 is to show the type of information stored and its relationship. Each entity was grouped as a block of information, and the data blocks represented were as follows: socio-economic data of the users that can potentially be attended, meteorological and environmental information, clinical data of the users, geographical information of the users, registers of, and finally, the emergency resources mobilised.
The database management system used was the Oracle Database [37], which is a system of object-relational type (ORD). The development environment used was Oracle SQL Developer [38], an integrated development environment that allows working with SQL in Oracle databases. This environment allowed us to create and execute SQL queries and procedures for the integration of different types of information.
  • Debugging tables and preparing data
The structure explained above has many applications, one of the most important is to study the number of attendances that are expected by demarcation, taking into account the different variables that affect the result. Deepening this assumption, new tables in which the information grouped by days, zones, and resources will be stored can be generated. A forecast of the number and type of expected attendances will be obtained as well as valuable information on the mobilisation of resources that is expected at different times of the year, also taking into account variables such as atmospheric data, day of the week, holiday, or work, economic values of the area, and all the variables that surround an assistance (Table 4).
As indicated above, the urban core of Jaén was divided into 128 quadrants, which allowed us to exploit the information in a georeferenced manner. Each of the quadrants were stored using the coordinates that defined them, which allowed us to study the information of the demands and the population in a detailed and geographical manner.
The way the database was designed and the inclusion of geographic information and other external factors such as meteorological factors allowed the data to be exploited for predictive analysis. The growth of the database and the increase in the volume of information stored means that valuable historical data are now available. Future exploitation and analysis of these data such as detecting patterns of behaviour and relationships between variables will allow advance planning of the emergency resources available at each time of the year and in each part of the city.

3.2. Predictive Model

The results of the first phase of the study corresponded to the application of the MDL algorithm to identify which attributes had the most influence on the target attributes. In this case, the number of resources mobilised (Table 5) shows the attributes that are related to the target attribute and are therefore used by the algorithms. The attributes in the database were checked by the minimum description length (MDL) algorithm, which returned a value between 0 and 1, with 0 indicating that the attribute has no relationship with the target attribute, and 1 indicating that the attribute has the maximum relationship. The attributes that were related to the target and that were used to train the model are shown below. The model was trained with real demand data from 2011 to 2019, and 2020 was left out to produce the result of the predictive algorithms with real demand data from 2020.
In this work, as mentioned in Section 2.3, two types of regression algorithms were used: linear and nonlinear. In the case of the linear algorithms, support vector machine (SVM) with linear kernel and the generated linear model (GLM) were used; on the part of the nonlinear models, SVM with Gaussian kernel was used. Each model has its advantages and disadvantages, in the case of SVM, it provides great performance when there is little training data available, however, GLM is an extension of a linear regression model, which is very useful when the conditional distribution of the target attribute is not normal, introducing a link function g (2). Its adjustment in practice is conducted using the maximum likelihood method, therefore, this model was based on calculating the weighted sum of the predictors. These models were formulated by John Nelder and Robert Wedderburn as a way of unifying statistical models such as linear regression, logistic regression, and Poisson regression
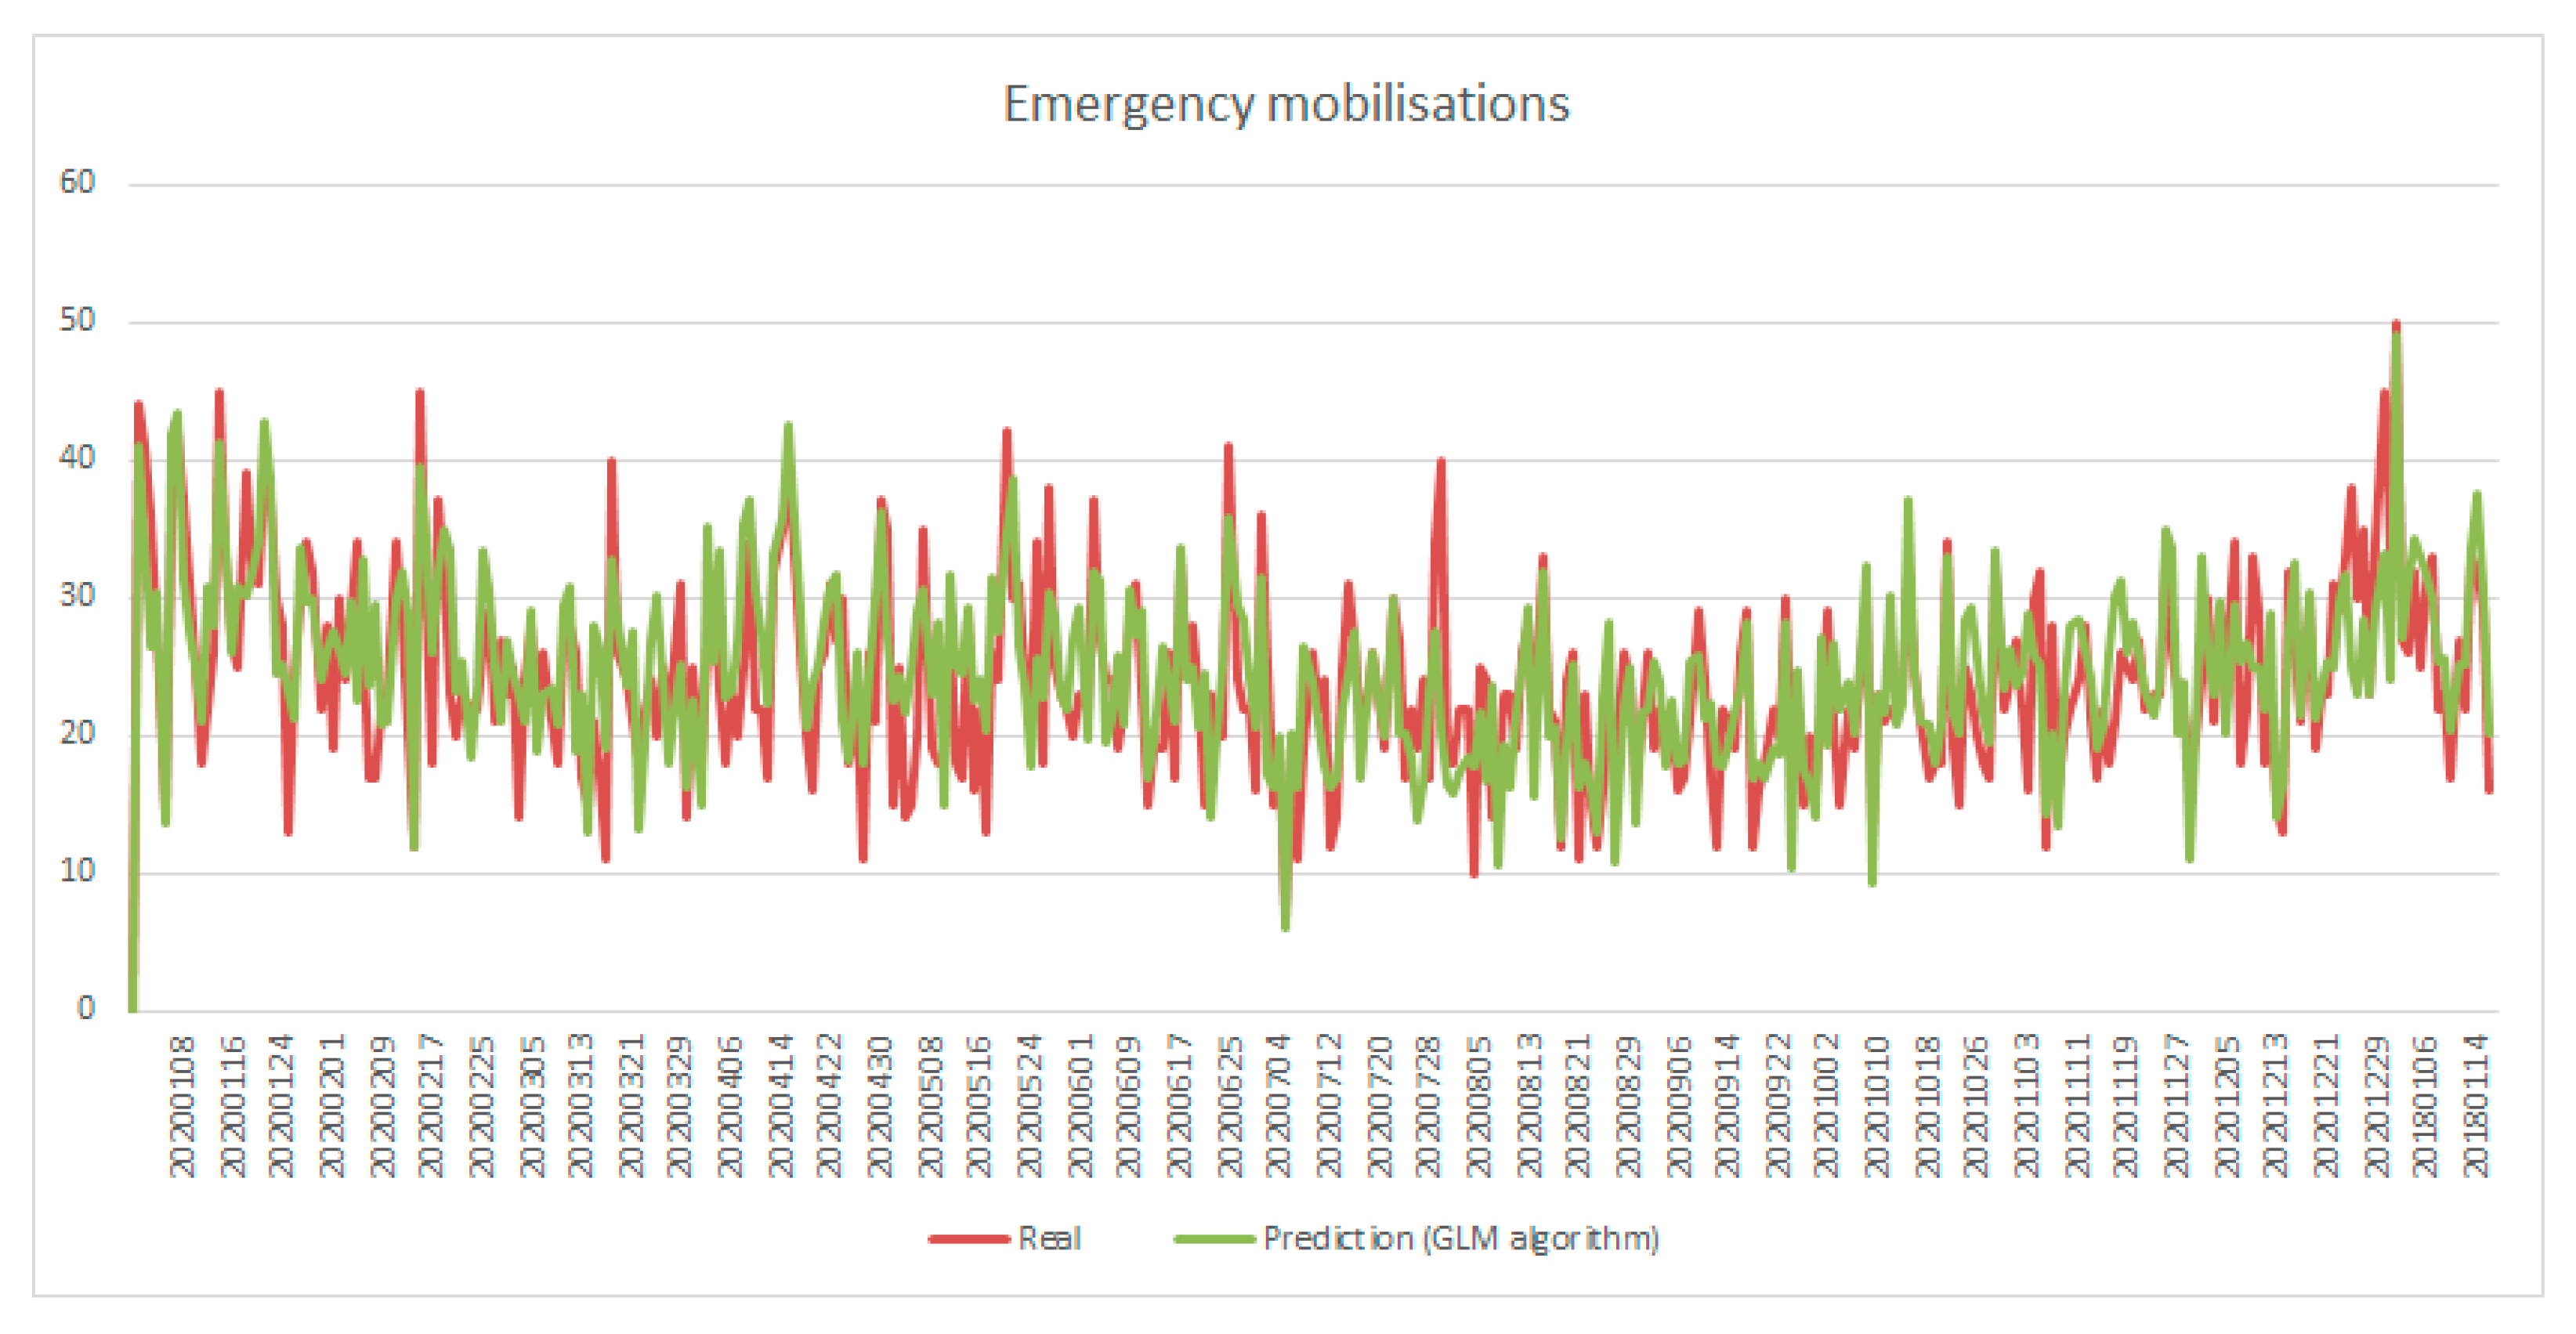
The prediction focuses on determining the number of emergency resource activations that will be required to meet the demand for emergency health care, for which the three regression models were tested, and to measure their efficiency, a model was generated with data for the years 2011–2019 and the prediction was made for the year 2020, comparing the absolute error of the prediction with the real data for the year 2021. The results obtained were as follows: GLM had an error of 9%, SVM with linear kernel 16%, and SVM with Gaussian kernel 21%. The efficiency of the model can be seen in the form of a graph. Figure 5 shows the actual number of emergency resource mobilizations each day during 2020. For this purpose, a predictive model was generated with the training data of the actual realised demands in the year 2011 until 2019. Then, from the three models tested, it the prediction of resources to be mobilized in 2020 was generated, and finally, it calculated the absolute error by comparing the prediction with the actual value of the mobilised resources. The graph showed the prediction of the GLM model for each day (red line) and the blue line represents the actual number of resources mobilised in this year, so the accuracy of the model could be seen graphically. The absolute error of the GLM regression algorithm was 9%; this value was very good since the variation in the mobilisation of the demands can vary from 50 on the day when the most were mobilised and nine on the day when the least were mobilised (i.e., the variation was higher than 555%).
Considering that the number of activations varies greatly, ranging from 20 to 45 per day, it is very important to be able to have a temporary forecast in advance, as each ambulance is equipped with a doctor, nurse, and driver. Therefore, it involves a significant expenditure of health care resources.

4. Conclusions

The general objective of the project was to create a database as complete as possible and with a great diversity of information, which would represent in detail all possible aspects of the emergency health activity. We did not just want to store data, but to obtain the maximum details of the entire process of attending to an emergency, that is, from the moment the call is received in the coordination room until the end of the assistance received by the patient, thus closing the health claim that said patient originated.
An additional objective that we addressed was to study and store all the non-health aspects that surround an emergency and that may affect that emergency. As previously mentioned, the economic, social, environmental, and geographical aspects of each of the emergencies have been studied. The next step was to analyse all of this information and study the percentage of relationship that each variable had with the appearance or alteration of said emergencies. In this sense, it has been concluded that there is a direct relationship between the environmental factors and the activation of emergency services in Jaén. This relationship was statistically quantified with the MDL algorithm, which quantifies the relationship of each attribute with the target attribute.
Another important achievement is that a model was designed using the multi-model database where not only clinical data, but also other very basic environmental and air quality factors are stored, these attributes being precisely some of the input system data for the prediction. These data are available on several websites with up to a 10-day forecast.
The main conclusion of this work is that we managed to develop models that are able to predict the number of activations of the emergency services with an absolute error of 6%, considering the large variation in the number of activations from one day to another, with variations of more than 110%. Other predictive studies in the health sector have achieved a reliability of around 80% [26]. This study achieved better accuracy. It is also important to note that this study worked with health data captured at the time of care by the doctor or nurse. These data are stored in the optimised database, which allows these data to form part of the training data of the predictive model by recalculating the predictions and readjusting the model each day as the database grows. This is disruptive to other work [39], where public or non-clinical data sources are used.
There are predictive works that use machine learning to address the evolution of patients in the emergency department, more specifically, the level of mortality [40], and others have focused on predicting the population groups that are more likely to use health services [41]. In this sense, what is innovative about the study presented here is that it focused on accounting for the resources that will be mobilised each day (i.e., being able to know in advance the emergency health demand that will be received on a given day). It is therefore a prediction that makes it possible to anticipate the resources available, improving the quality of patient care. This information, in advance, is an indicator that can be very important for emergency resource managers, being a useful tool, better than a naïve model based on the average of historic values. The use of this tool can also help to improve several aspects of health care management. The first is the economic plan, if the demand is known well in advance. Another important aspect is that the application of the model will increase efficiency, as we will be able to anticipate the demand for resources, a key aspect in health emergencies.
Finally, it can be concluded that this multi-model database allowed us to exploit the information with predictive models. Furthermore, it is a first step toward further work in the future to analyse the type of resources requested in the demands and the main pathologies of the activations, or even determine or predict the location where the emergency activation will take place.

Author Contributions

All authors whose names appear on the submission made substantial contributions to the conception or design of the work, nevertheless, here are the concrete contributions of each author: Writing—original draft: J.C.A.; Methodology and formal analysis: J.C.A. and J.J.C.; Writing—Reviewing and Editing, M.I.R. All authors have read and agreed to the published version of the manuscript.

Funding

This research received no external funding.

Informed Consent Statement

All methods were carried out in accordance with the relevant guidelines and regulations. All experimental protocols were approved by EPES (Empresa Pública de Emergencias Sanitarias) Consejería de Salud y Familias. Junta de Andalucía (Spain). No clinical data were used in this research. Informed consent was obtained from all subjects and/or their legal guardian(s).

Data Availability Statement

Data included in the database cannot be shared due to the data protection law in Spain. The design of the database is available and can be shared openly. To request the data, please contact the first author. In this work, clinical data were not used.

Acknowledgments

This work would not have been possible without the support of EPES (Public Company for Health Emergencies), a company belonging to the Andalusian Health System. This work was also partially supported by the Graphics and Geomatics Group of Jaén (TIC-144), and the research PREDIC_I-GOPO-JA-20-0006 which is co-financed with European agricultural fund for rural development and the Junta de Andalucía funds.

Conflicts of Interest

We confirm that there are no potential competing interests and all authors have approved the manuscript for submission.

References

  1. Institute of Medicine (US). Improving the Nation’s Health Care System; National Academies Press (US): Washington, DC, USA, 2009. [Google Scholar]
  2. Vaz, N.; Venkatesh, R. Service Design in the Healthcare Space with a Special Focus on Non-Clinical Service Departments: A Synthesis and Future Directions. Health Serv. Manag. Res. 2022, 35, 83–91. [Google Scholar] [CrossRef] [PubMed]
  3. Cubillas, J.J.; Ramos, M.I.; Feito, F.R.; Ureña, T. An Improvement in the Appointment Scheduling in Primary Health Care Centers Using Data Mining. J. Med. Syst. 2014, 38, 89. [Google Scholar] [CrossRef] [PubMed]
  4. Ramos, I.; Cubillas, J.J.; Feito, F.R.; Ureña, T. Spatial Analysis and Prediction of the Flow of Patients to Public Health Centres in a Middle-Sized Spanish City. Geospat. Health 2016, 11, 452. [Google Scholar] [CrossRef] [PubMed] [Green Version]
  5. Ganguly, A.; Nandi, S. Using Statistical Forecasting to Optimize Staff Scheduling in Healthcare Organizations. J. Health Manag. 2016, 18, 172–181. [Google Scholar] [CrossRef]
  6. Wiréhn, A.-B.E.; Karlsson, H.M.; Carstensen, J.M. Estimating Disease Prevalence Using a Population-Based Administrative Healthcare Database. Scand. J. Public Health 2007, 35, 424–431. [Google Scholar] [CrossRef]
  7. Kerr, K.; Norris, T.; Stockdale, R. Data Quality Information and Decision Making: A Healthcare Case Study. In Proceedings of the 18th Australasian Conference on Information Systems, Toowoomba, Australia, 5–7 December 2007. [Google Scholar]
  8. Salman, O.H.; Rasid, M.F.A.; Saripan, M.I.; Subramaniam, S.K. Multi-Sources Data Fusion Framework for Remote Triage Prioritization in Telehealth. J. Med. Syst. 2014, 38, 103. [Google Scholar] [CrossRef]
  9. Pérez, J.; Iturbide, E.; Olivares, V.; Hidalgo, M.; Martínez, A.; Almanza, N. A Data Preparation Methodology in Data Mining Applied to Mortality Population Databases. J. Med. Syst. 2015, 39, 152. [Google Scholar] [CrossRef] [Green Version]
  10. Trifirò, G.; Coloma, P.M.; Rijnbeek, P.R.; Romio, S.; Mosseveld, B.; Weibel, D.; Bonhoeffer, J.; Schuemie, M.; van der Lei, J.; Sturkenboom, M. Combining Multiple Healthcare Databases for Postmarketing Drug and Vaccine Safety Surveillance: Why and How? J. Intern. Med. 2014, 275, 551–561. [Google Scholar] [CrossRef]
  11. Ramos, M.I.; Cubillas, J.J.; Feito, F.R. Improvement of the Prediction of Drugs Demand Using Spatial Data Mining Tools. J. Med. Syst. 2016, 40, 6. [Google Scholar] [CrossRef]
  12. Burkle, F.M.; Bradt, D.A.; Ryan, B.J. Global Public Health Database Support to Population-Based Management of Pandemics and Global Public Health Crises, Part I: The Concept. Prehospital Disaster Med. 2021, 36, 95–104. [Google Scholar] [CrossRef]
  13. Mezghani, E.; Exposito, E.; Drira, K.; Da Silveira, M.; Pruski, C. A Semantic Big Data Platform for Integrating Heterogeneous Wearable Data in Healthcare. J. Med. Syst. 2015, 39, 185. [Google Scholar] [CrossRef] [PubMed]
  14. Wang, Y.; Kung, L.; Byrd, T.A. Big Data Analytics: Understanding Its Capabilities and Potential Benefits for Healthcare Organizations. Technol. Forecast. Soc. Chang. 2018, 126, 3–13. [Google Scholar] [CrossRef] [Green Version]
  15. Hamami, D.; Atmani, B.; Cameron, R.; Pollock, K.G.; Shankland, C. Improving Process Algebra Model Structure and Parameters in Infectious Disease Epidemiology through Data Mining. J. Intell. Inf. Syst. 2019, 52, 477–499. [Google Scholar] [CrossRef]
  16. Benhar, H.; Idri, A.; Fernández-Alemán, J.L. A Systematic Mapping Study of Data Preparation in Heart Disease Knowledge Discovery. J. Med. Syst. 2018, 43, 17. [Google Scholar] [CrossRef] [PubMed]
  17. Silver, M.; Sakata, T.; Su, H.C.; Herman, C.; Dolins, S.B.; O’Shea, M.J. Case Study: How to Apply Data Mining Techniques in a Healthcare Data Warehouse. J. Healthc. Inf. Manag. JHIM 2001, 15, 155–164. [Google Scholar] [PubMed]
  18. Oussous, A.; Benjelloun, F.-Z.; Ait Lahcen, A.; Belfkih, S. Big Data Technologies: A Survey. J. King Saud Univ. Comput. Inf. Sci. 2018, 30, 431–448. [Google Scholar] [CrossRef]
  19. Lee, C.H.; Yoon, H.-J. Medical Big Data: Promise and Challenges. Kidney Res. Clin. Pract. 2017, 36, 3–11. [Google Scholar] [CrossRef] [PubMed] [Green Version]
  20. UNDP. Human Development Report 2015; UNDP: New York, NY, USA, 2015. [Google Scholar]
  21. George, J.; Kumar, B.V.; Kumar, V.S. Data Warehouse Design Considerations for a Healthcare Business Intelligence System. In Proceedings of the WCE 2015, London, UK, 1–3 July 2015; Available online: http://www.iaeng.org/publication/WCE2015/ (accessed on 17 March 2022).
  22. Muji, M.; Ciupa, R.; Dobru, D.; Bică, C.; Olah, P.; Bacarea, V.; Marusteri, M. Database Design Patterns for Healthcare Information Systems. In Proceedings of the International Conference on Advancements of Medicine and Health Care through Technology, Cluj-Napoca, Romania, 23–26 September 2009; pp. 63–66, ISBN 978-3-642-04291-1. [Google Scholar]
  23. Brookhart, M.A.; Stürmer, T.; Glynn, R.J.; Rassen, J.; Schneeweiss, S. Confounding Control in Healthcare Database Research: Challenges and Potential Approaches. Med. Care 2010, 48, S114–S120. [Google Scholar] [CrossRef] [Green Version]
  24. Yue, X.; Wang, H.; Jin, D.; Li, M.; Jiang, W. Healthcare Data Gateways: Found Healthcare Intelligence on Blockchain with Novel Privacy Risk Control. J. Med. Syst. 2016, 40, 218. [Google Scholar] [CrossRef]
  25. Goli-Malekabadi, Z.; Sargolzaei-Javan, M.; Akbari, M.K. An Effective Model for Store and Retrieve Big Health Data in Cloud Computing. Comput. Methods Programs Biomed. 2016, 132, 75–82. [Google Scholar] [CrossRef]
  26. Graham, B.; Bond, R.; Quinn, M.; Mulvenna, M. Using Data Mining to Predict Hospital Admissions From the Emergency Department. IEEE Access 2018, 6, 10458–10469. [Google Scholar] [CrossRef]
  27. Gurazada, S.G.; Gao, S. (Caddie); Burstein, F.; Buntine, P. Predicting Patient Length of Stay in Australian Emergency Departments Using Data Mining. Sensors 2022, 22, 4968. [Google Scholar] [CrossRef] [PubMed]
  28. Empresa Pública de Emergencias Sanitarias. EPES—061 | Gestión de las Emergencias y Urgencias Sanitarias en Andalucía; Empresa Pública de Emergencias Sanitarias: Malaga, Spain, 2021. [Google Scholar]
  29. Red de Información Ambiental de Andalucía—Portal Ambiental de Andalucía. Available online: https://www.juntadeandalucia.es/medioambiente/portal/acceso-rediam (accessed on 21 February 2020).
  30. Sede Electrónica Del Catastro—Inicio. Available online: http://www.sedecatastro.gob.es/ (accessed on 18 January 2020).
  31. INE. Instituto Nacional de Estadística. Available online: https://www.ine.es/ (accessed on 10 January 2020).
  32. Instituto de Estadística y Cartografía de Andalucía. Available online: https://www.juntadeandalucia.es/institutodeestadisticaycartografia (accessed on 13 January 2020).
  33. Dobson, A.J. An Introduction to Generalized Linear Models, 2nd ed.; Chapman & Hall/CRC texts in statistical science series; Chapman & Hall/CRC: Boca Raton, FL, USA, 2002; ISBN 978-1-58488-165-0. [Google Scholar]
  34. Bolker, B.M.; Brooks, M.E.; Clark, C.J.; Geange, S.W.; Poulsen, J.R.; Stevens, M.H.H.; White, J.-S.S. Generalized Linear Mixed Models: A Practical Guide for Ecology and Evolution. Trends Ecol. Evol. 2009, 24, 127–135. [Google Scholar] [CrossRef]
  35. Grünwald, P.D.; Myung, J.I.; Pitt, M.A. (Eds.) Advances in Minimum Description Length: Theory and Applications; Neural Information Processing series; Bradford Books: Cambridge, MA, USA, 2005; ISBN 978-0-262-07262-5. [Google Scholar]
  36. Cortes, C.; Vapnik, V. Support-Vector Networks. Mach. Learn. 1995, 20, 273–297. [Google Scholar] [CrossRef]
  37. Gestión de Datos Autónoma. Available online: https://www.oracle.com/es/autonomous-database/ (accessed on 23 February 2020).
  38. SQL Developer. Available online: https://www.oracle.com/database/technologies/appdev/sqldeveloper-landing.html (accessed on 23 February 2020).
  39. Bobashev, G.; Warren, L.; Wu, L.-T. Predictive Model of Multiple Emergency Department Visits among Adults: Analysis of the Data from the National Survey of Drug Use and Health (NSDUH). BMC Health Serv. Res. 2021, 21, 280. [Google Scholar] [CrossRef] [PubMed]
  40. Sánchez-Salmerón, R.; Gómez-Urquiza, J.L.; Albendín-García, L.; Correa-Rodríguez, M.; Martos-Cabrera, M.B.; Velando-Soriano, A.; Suleiman-Martos, N. Machine Learning Methods Applied to Triage in Emergency Services: A Systematic Review. Int. Emerg. Nurs. 2022, 60, 101109. [Google Scholar] [CrossRef]
  41. Garcia-Canton, C.; Rodenas, A.; Lopez-Aperador, C.; Rivero, Y.; Anton, G.; Monzon, T.; Diaz, N.; Vega, N.; Loro, J.F.; Santana, A.; et al. Frailty in Hemodialysis and Prediction of Poor Short-Term Outcome: Mortality, Hospitalization and Visits to Hospital Emergency Services. Ren. Fail. 2019, 41, 567–575. [Google Scholar] [CrossRef]
Figure 1. Complete cycle of urgencies and emergencies management.
Electronics 11 03602 g001
Figure 2. Definitive table composition of meteorological information.
Electronics 11 03602 g002
Figure 3. Geolocated quadrants that divide the town of Jaén.
Electronics 11 03602 g003
Figure 4. Entity relationship diagram (ERD).
Electronics 11 03602 g004
Figure 5. Prediction on the emergency resource activation. Comparison of the actual data and predictions for the year 2020.
Electronics 11 03602 g005
Table 1. Personal patient information.
AttributeDescription
AgePatient’s years old
SexMan/Woman
BirthDate of birth
Id_ProvinceZIP code
Id_DistrictDistrict code
Id_TownTown code
Id_StreetStreet code
Id_NumberNumber
Id_DoorDoor
Table 2. Patient health information.
AttributeDescription
IdTypeofdemandClassification of demand
Type of demand:
A Attendance/T Transport/
I Informative
IdTypeofdemand1First level of detail of the type of demand. E.g:
01 Transport accident
02 Alteration of vital signs
04 Dyspnoea…
IdTypeofdemand2Second level of detail of the type of demand
IdTypeofdemand3Third level of detail of the type of demand
IdSResourceResource Code
IdAssistanceAttendance Code
ZipCodeZipcode
ClinicalJudgment1First Clinical Trial
ClinicalJudgment2Second Clinical Trial
ClinicalJudgment3Third Clinical Trial
IdResolveCodeResolution Code:
1* do not arrive to see patient
2* Arrive but do not act
3* Attend to patient
IdFinanceFinancing code. (State funding, Private companies…)
AdrDTDestination
Situation
Destination code of the resource.
Team attending:
U Urban
P Peripheral, if the assistance is covered by either of the two teams.
AdrDTSituationEquipment Coverage Zone: Urban/Peripheral
IdAdmissionCenterHospital Admission Centre
Table 3. Chronological information of the assistance.
AttributeDescription
Year_DYear of date of attendance.
Month_DMonth of date of attendance.
Day_D Day of date of attendance.
IdProvinceProvince code.
RequestdateRequest date
IdRequestRequest code
IdCallCall code
IdLineLine code
IdLineTypeLine type code
IdAlertantAlert source code (User, General emergency service…)
InLetTimeIncoming call time
RingTimeTime at which the system rings
AnswerTimeTime the call is answered
ResourceCreationTimeTime of resource creation
ActivationTimeResource activation time
ExitTimeTime of departure of the resource
ArrivalTimeTime of arrival of the resource
LoadTimeTime of patient loading in the ambulance (resource)
DestinationTimeTime of arrival at destination
OperationTimeTime at which the resource becomes operational
AvailableTimeTime when you are fully available for other assistance
CoordinationTimeDemand coordination time
ActivationTimingTime taken to activate the resource
AttentionTimingPatient care time
AnswerTimingResponse time (from the time the call comes in until the resource reaches the patient)
IdExclusionGroundReason for exclusion in case of failure to send the appropriate resource for that request
IdResourceUnitResource unit sent.
IdResourceTypeResource unit sent.
Table 4. New generated table for resource management optimisation.
AttributeDescription
DateDate of data registered
YearYear of data registered
MonthMonth of data registered
WeekdayThis field records whether it is a weekend or not.
HolidayThis field records whether it is a holiday or not.
Day_MonthNumber between 1 and 12
Day_YearNumber between 1 and 365
Week_MonthNumber between 1 and 5
Week_YearNumber between 1 and 52
Max_TemperatureHighest temperature recorded on that date
Min_TemperatureLowest temperature recorded on that date
Avg_TemperatureAverage temperature recorded on that date
Max_HumidityHighest humidity recorded on that date
Min_HumidityLowest humidity recorded on that date
Avg_HumidityAverage humidity recorded on that date
Wind_SpeedAverage wind speed value recorded on that date
RadiationAverage solar radiation value recorded on that day
PrecipitationAverage precipitation value recorded on that day
DemarcationDelimitation
Resource_TypeType of resource
Number_ResourcesTotal number of resources mobilised on that date
Table 5. Attributes used in the model.
NameDescription
Demarcation Location of the demand requested
Type of holidayWorking day or public holiday
Month Month of the request
Day weekDay of the week (Monday, Tuesday, …)
Maximum humidityPredicted maximum relative humidity
Average humidityExpected average relative humidity
Minimum humidityPredicted minimum relative humidity
PrecipitationPrecipitation forecast
Solar radiationSolar radiation
Max temperaturePredicted maximum temperature
Average_temperaturePredicted average temperature
Minimum_temperaturePredicted minimum temperature
Type of resource mobilisedType of resource mobilised (ambulance, intensive care unit, doctor, nurse, etc.)
Wind speedWind speed
Publisher’s Note: MDPI stays neutral with regard to jurisdictional claims in published maps and institutional affiliations.