Abstract
Perovskites have exceptional physical and chemical features in different fields. Perovskites have an ABO3 formula with similar sizes of A-site and B-site cations. This research explores the challenges of developing new perovskite solar cells with high performance. Therefore, this article proposes a deep learning model for the prediction of perovskites performance measures. The measures are: energy conversion performance, ABO3 stability, ion volume, and induced oxygen vacancy dimension. These performance measures are very crucial electrochemical reactions in energy conversion in fuel crystals. The challenges in any deep learning model are the lack of the presence of sufficient data and training time. Consequently, in this research, we propose a transfer learning perovskites model. Perovskite performance detection is critical to offer operative energy resources. In the proposed model, the constructed detection model uses a perovskites feature set. The transfer learning model utilizes other materials with large-sized datasets to predict the four performance measures with high accuracy. The output of the transfer learning is then utilized for the proposed deep learning model to predict perovskites performance measures with a small-sized dataset. A dataset of 8500 perovskite samples is utilized in the research. The results prove that a deep learning F2-Score with transfer learning attains high accuracy of 98.95%, recall of 96.91% and F2-score of 97.05%.
1. Introduction
Perovskites have exceptional physical and chemical features in different fields. Perovskites have an ABO3 formula with similar sizes of A-site and B-site cations [1]. If sluggish kinetics in these perovskites occur, a decline in energy conversion performance will happen. This sluggish kinetics in perovskite has to be detected and limited [2,3,4,5]. Perovskite decline in energy conversion is triggered by a few chemical features of perovskites. Detection depends on deep learning methods to detect such vacancies. Deep learning methods include optical imaging and oxygen vacancies detection techniques [2]. Figure 1 depicts perovskites’ ABO3 crystal structure.
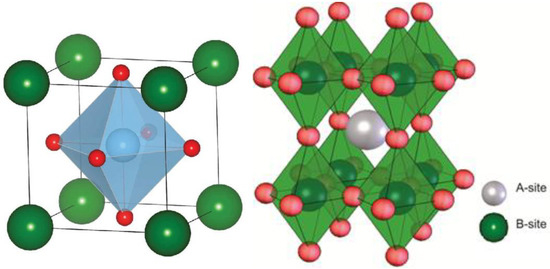
Figure 1.
Perovskites ABO3 with similar sizes of A-site and B-site cations; red circles comprise anions.
The recent research in materials is founded on the preparation of the dataset instances. The different features of instances are measured to comprehend the different physical features, and the materials are investigated and predicted via various performance parameters [3,4,5,6,7,8]. The classical material preprocessing has a resilient dependence on the data instances. Repetitive research throughout the experiments yields long process times [9,10,11]. Recent research, namely first-principles, phase field computation, and finite element process, are used to study materials performance. These methods comprise long CPU time and high cost [12,13,14].
With the progress of artificial intelligence and deep learning models, many authors employed machine learning models to advance material sciences [15,16,17]. Deep learning can perform a learning process on material structure and classify material structures accurately. Several machine learning models can classify material performances from large size inputs [18,19,20].
The signs that can be perceived spatially are the oxygen vacancies of the perovskites [21,22,23,24,25]. The alterations of the oxygen vacancies can be detected in perovskites’ performance stages, consequently perovskites’ performance detection can be enhanced [26].
Perovskite topography is an important method for the perovskites’ performance detection [27]. Proposed crystal structure imaging detection methods yield to quantitative metrics for its various structures. CNN transfer learning techniques are also employed in the detection of perovskite topography. The problematic matter with these models is that they are expensive, with high maintenance. These techniques necessitate trained personnel and need precise laboratory sites.
In this article, we are proposing a model for detecting perovskites’ performance, employing image analysis and deep learning models. Consequently, in this paper we explore computerized procedures that employ imaging technology with computerized analysis of digital images. Computerized detection can be conducted with the help of deep learning. We are proposing an intelligent application to help in the detection of perovskites’ performance. In this article we are introducing an image analysis technique by extracting the visual parameters of the perovskite crystal structures. These parameters are selected from perovskites’ crystal optical images. Experts confirm the important features from the shape parameters of the captured image of the perovskite crystals. In this research, we are concerned with crystal shape and color feature selection to develop a computerized model for detection. Such parameters are classified confirming their implication to distinguish between perovskite performances.
2. Literature Survey
Computerized detection is always accomplished in laboratory sites via investigative tools such as perovskites’ topography capturing devices [13]. This detection is usually done by examining perovskite topography imaging. The perovskite topographical map is processed using machine or deep learning [14,15].
Authors in [16], proposed a novel method for computerized perovskites dissection of a crystal perovskite topography map. The introduced method used a convolutional network with edge detection of the topography map. Perovskite surface reconstruction can help in the detection of several perovskites’ surface syndromes [17,18,19]. The researchers in [20], used image analysis of the perovskites crystal by extracting shape parameters employing visual and geometrical parameters. Their model revealed and extracted high correlation parameters. Their comprehensive experiments termed several groups of contour and roughness factors to classify other perovskites’ surface performances. In their method, one dominant characteristic can always be chosen. The authors in [17] employed the dimension of the perovskites’ crystal layer as the key metric in perovskite computerized detection. The laboratory computing is usually performed manually, which is a long process that can cause errors. They employed U-Net image integration CNN to distinguish among perovskites’ performance. They measured their technique performance in hue gray images with different perovskites’ performances. In [18], the researchers performed crystal integration from optical images of perovskites crystals. Crystal identification was performed through supervised learning of optical images. In [19], the researchers performed crystal status detection from the contour of the perovskites crystals in digital imagery. They applied U-Net CNN for optic image integration. In [20], the researchers employed central crystal thickness computation of the perovskites from OCT images of both normal and unnatural perovskites structures. In [21], they measured markers of perovskites’ performances to obtain computerized detection.
In [22], the researchers predicted geographical map images from the Pandacan dataset, using decision trees to predict perovskites oxygen vacancies. Researchers in [23] employed an SVM machines for detection of perovskites crystal structures, utilizing a mixture of structural images from perovskites crystal maps and images from a Scheimpflug capturing device.
Intelligent imaging was used to generate perovskites map images and utilized image analysis methods to find perovskites crystal abnormalities. Authors in [24] took perovskites crystal images utilizing an intelligent device. They attained an accuracy of 93% of detecting abnormal structures in 16 cases out of 30 cases; the other fourteen cases were normal crystal structures and were identified as normal, with the exception of one mild defected structure detected as a false negative. In [25], the model performed a preprocessing stage by cropping the perovskites images, by estimating the perovskites crystal, employing an edge computation algorithm. The preprocessing stage was trailed by a prediction stage for detecting the perovskites crystal curvature.
In [26], the authors applied machine learning for perovskite materials design and discovery. They added regression modeling before deep learning and achieved high accuracy but with more training time. In [27], the proposed model, namely perovskite neural trees, utilized random forest trees to predict if the substance was perovskite or not (binary classification). In [28], the authors adopted a machine learning approach for the prediction of formability and thermal stability of perovskite oxides. They attained high accuracy but with low recall. In [29] the authors constructed a 3D spatial model to represent perovskite substances for further identification. In models proposed in [30,31,32], machine learning was utilized to predict perovskite performance but used small-sized data.
In our research, we proposed a successful methodology to detect perovskites’ performance through optical images. We performed comparison of our results to other state-of-the-art methods using image maps. Our study used color and roughness feature extraction from digital images to identify perovskites’ performance. Our results are evaluated by comparing them to ground truth from expert labelling. Table 1 depicts recent research in perovskites’ performance prediction using deep learning models.

Table 1.
Recent research in perovskites’ performance prediction using deep learning models.
In our research, we added the following contributions:
- Deep learning model is employed to develop new perovskite solar cells by measuring perovskites’ performances utilizing perovskites ABO3 of A-site and B-site cations crystals dataset.
- A transfer learning CNN is defined using smaller datasets of different materials.
- The proposed CNN extracts hidden features from and defines the required information utilized in its predictions.
- The prediction of the perovskite performance measures: energy conversion performance, ABO3 stability, ion volume, and induced oxygen vacancy dimension.
3. Materials and Methods
3.1. Dataset
The perovskite dataset was constructed using the density functional theory. The dataset was selected for the training phase [33]. For deep learning models, using just two markers (electronegativity and ionic radius) can classify formation energies of ABO3 with small mean square errors (MSE) [21]. In [24], the authors described deep learning methods to classify the stability of perovskite oxides (ABO3), utilizing a dataset of 2100 DFT perovskite instances. The experiments depicted that MSE is in the range of formation dynamisms versus elemental states to be used in full calculations [28]. Using several deep learning models, the formation dynamisms, volume, and oxygen vacancy of perovskite crystals are classified [20,21,22,23,24,25].
Figure 2 depicts the dataset cycle and workflow and data preparation. The data cycle is comprised of four stages
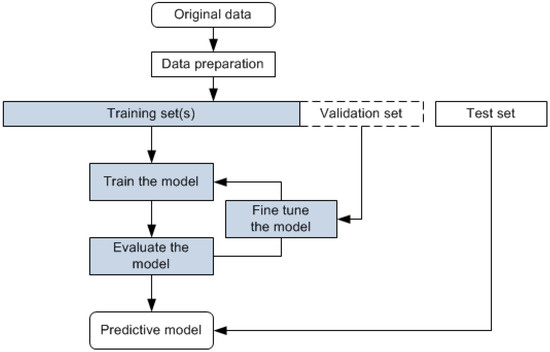
Figure 2.
Workflow and data preparation.
Stage 1: The original data is distributed into training and testing subsets.
Stage 2: The proposed model is trained using the training subset.
Stage 3: The classifier is used to classify the testing subset.
Stage 4: Experiments are performed by computing the difference between the classified class and the ground truth.
The used dataset includes 8500 ABO3 perovskite data items. There are four representative performance features, namely formation energy, thermodynamic threshold, crystal structure volume, and oxygen vacancy.
Table 2 depicts representative energy factors of the input dataset. The model predicts formation energy, stability, and volume of perovskite ABO3 crystal structure.
Table 2.
Representative performance factors of the perovskite datasets.
3.2. The Proposed Model
The proposed deep learning neural model has both feedforward and backpropagation modules, where training is improved by a loss backpropagation module. The backpropagation module has the features of self-learning by reducing the loss and return back for re-training. The backpropagation process has intelligent reasoning for data processing and has the adaptive features for an uncertain regular system. Backpropagation utilizes the training of instances to compute the mapping of a nonlinear relationship from the input data to the classified output and realize its internal commutations from the mapping.
In forward propagation, the input is processed by the hidden layers to produce the output. Each layer impacts the neuron state of the succeeding layer; if the output does not meet the expected requirements, it is returned back to the backward propagation procedure, which modifies the weights of the neural layers such that the predicted class is close to the expected one, as depicted in Figure 3.
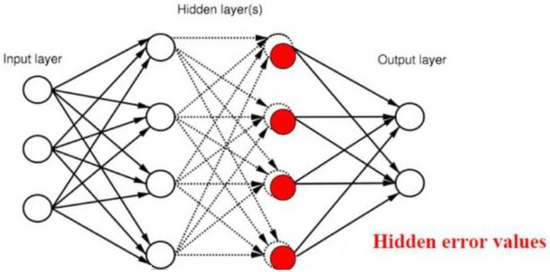
Figure 3.
Forward and backward propagation.
The selected features (F1–F12) are utilized for the perovskite performance CNN training. One of the challenges of using deep learning for materials performance is the inadequate training data size for the utmost features, namely: conductivity, thermal, and formation energy [22]. In our research, the proposed model utilizes a transfer learning technique for the learning model. The model trains a perovskite performance prediction model using elemental properties. The first step will have generality performance using the structural properties. The general pre-trained model is utilized to classify the perovskite performance of a large-sized dataset (DAT2) [23], of which the data items only possess structural features short of perovskite formation energy. DAT2 predicts materials perovskite performance from features similar to the features used by our model but on materials that are not perovskite. The perovskite formation energy labelling stage from the small-sized perovskite dataset (DAT1) features an adequate transferable knowledge with formation energy property. It is then possible to develop the deep learning process screening model using the new labeled data items, using the elemental properties only.
3.2.1. The Deep Learning CNN
The proposed deep learning model’s CNN has a distinctive network compared to convolutional shallow neural models. The deep learning CNN is fed with multi-dimensional input. The CNN model significantly decreases the weight computation structure and lessens the computational load [12,13,14,15]. A CNN structure contains an input layer, several convolutional layers and pooling layers. At the end, there are a number of fully connected layers (FC) and it ends with an output layer.
The multiple convolutional layers (CL) utilize several scale kernels to navigate the input through weight sharing and extract different levels of data features for the same data sample through different parameter distributions. The CL layers’ extract feature representative maps of various features in stacking forms of high-dimensional matrix, to be utilized in the following computation. The computation equation of the CL KS kernel size is as depicted:
where n is the number of inputs and m is the number of outputs.
The deep learning process is the prediction of the boundary among different classes for classification. MSE loss function is the mean of squared differences between the actual value and the predicted value. It is utilized as a loss function as defined below.
where, MSE is the loss function, Yi is the expected class and Pi is the predicted class, m is the number of classes.
The max pooling function downsamples the input data layer. After obtaining the 13 features via the CL layers, it then employs the max pooling function to downsample the utilized features computed by the prior CL to decrease the input dimension and the calculation complexity according to the constraint of calculating resources and the time complexity. The feature reprehensive maps computed by the first CL are partitioned into non-overlapping areas, and the function of the optimum area for each area through the max pooling. Figure 4 depicts the downsample computed by the max pooling.
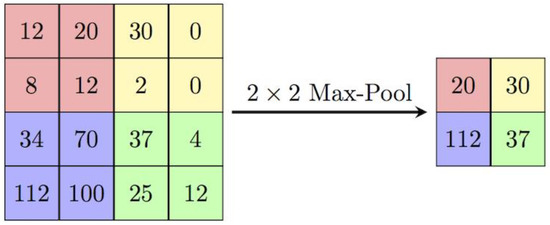
Figure 4.
The downsample computed by the max pooling.
The FC layers are the last CNN layers and are connecting the computed features from the prior CL to the output classes to perform the prediction. The CNN structure is depicted in Figure 5.
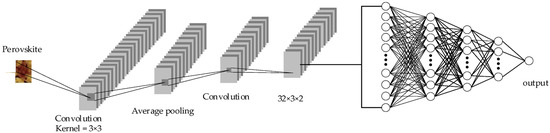
Figure 5.
The CNN structure.
3.2.2. The Training Process
The training process of the proposed CNN denotes the training CL with labelled data items to extract the input/output mapping. It comprises two phases: forward and backward propagation [30]. Forward propagation connects the input and the output of the CNN and is depicted by scoring the weight, ReLu, and FC factors of the CL kernel. Backpropagation computes the difference between the predicted value from the forward propagation output and the ground truth. The model results in a backward reaction, using the error to obtain the error figures of all CL, and utilizes the computed gradients to correct the CNN parameters for converging to the stopping condition.
Forward propagation inputs the training subset and adjusts the input parameters of each CL. Forward computation produces the output resultant of the input data items. In prediction phase, the output classes illustrate the probability of the data item fitting in the corresponding class, which is computed by the CNN.
The classified output from the forward propagation of the CNN is matched to the ground truth and the variance is depicted as the loss function. The mean square error (MSE) error function is utilized. The computed loss rate and the CL parameters are corrected to optimize the error function. The CL parameters are the offsets of the FC layer, and the weights of the CL layers. For the FC layer, the offsets of the CNN are computed using backpropagation.
The structure of the proposed transfer learning CNN is depicted in Table 3. The proposed CNN for the small-sized dataset is depicted in Table 4.
Table 3.
The transfer learning proposed CNN configuration.
Table 4.
The proposed CNN for the small-sized dataset.
3.2.3. Classification of ABO3 Material
The CNN model is depicted as follows:
- Dataset division: partition the input into training, validation and testing subsets, (70%, 15%, 15%, respectively).
- Training process: Four representative performance measures, namely: energy conversion performance, ABO3 stability, ion volume and oxygen vacancy dimension of perovskite crystal are trained.
The evaluation metrics are as follows:
where, TP is the true positives, and FN is the false negatives.
In multi-classification the definitions of TP and FP are defined as follows:
- True Positive (TP) for an instance in class A: the instance is predicted in Class A and the true label is in Class A (correctly predicted)
- False Negative (FN) for an instance in class A: the instance is predicted in Class B and the true label is in Class A (incorrectly predicted)
- False Positive is the number of instances wrongly predicted as positive out of the total actual negatives.
- True negative (TN) is an outcome where the model correctly predicts the negative class.
4. Experiments
4.1. Experiment Settings
The evolution of transfer learning is conducted by selecting various parts of the target data. Experiments are devised to identify the subdomain variation that can produce higher precision. We utilized five parts of the target data tangled with the source data (zero, 20%, 40%, 60%, 80%. Zero depicts the model without transfer learning). The residual target data are used for validation and testing phases. As depicted in Table 5, the precision is enhanced by 9%.
Table 5.
Precision for various parts of the target data.
Precision (Positive Predictive Value) in multi-class classification is computed for a specific class against all other classed combined as one class. For example, for the energy conversion performance, we have four classes, as depicted; to calculate the TP for the class “High value of Energy conversion performance” it will be equal to the number of times it is correctly predicted as the “high value of energy conversion performance”. The FP is the number of times other classes are predicted as the high value of energy conversion performance. Figure 6 depicts the comparison of the prediction of features versus size of training data.
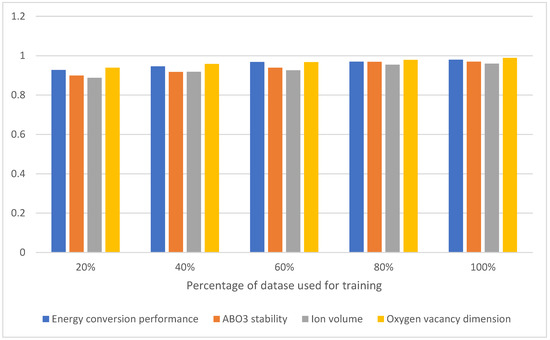
Figure 6.
Comparison of the precision of prediction of features versus size of training data.
4.2. Results
Confusion matrices for the four output features are depicted in Table 6, Table 7, Table 8 and Table 9. The confusion matrices are performed for the CNN model with and without transfer learning. It can be seen that transfer learning increases the performance by 15% on average. The dataset for the perovskites’ performance measures includes 8500 samples. Figure 7 and Figure 8 depict the predicted oxygen vacancy dimension using ion volume without/with transfer learning.
Table 6.
Confusion matrices for value of energy conversion performance without the transfer learning.
Table 7.
Confusion matrices for value of energy conversion performance with the transfer learning.
Table 8.
Confusion matrices for value of ABO3 stability without transfer learning.
Table 9.
Confusion matrices for value of ABO3 stability with transfer learning.
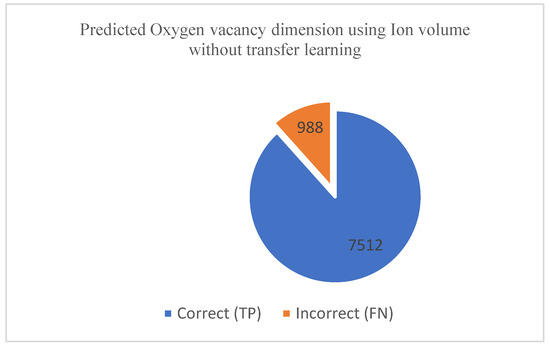
Figure 7.
Predicted oxygen vacancy dimension using Ion volume without transfer learning.
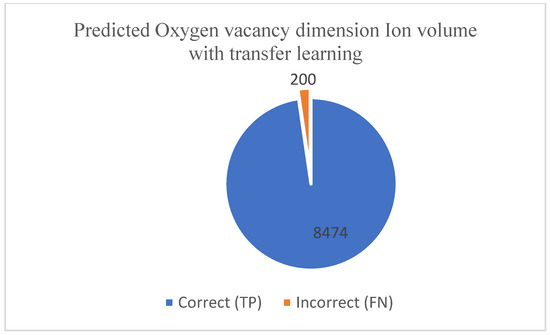
Figure 8.
Predicted oxygen vacancy dimension using Ion volume with transfer learning.
Table 10 depicts the comparison of error rate, training time and prediction time for our proposed model versus other state-of-the-art models. The error rate of our model decreases as well as training and CPU time. Figure 9 depicts the performance comparison among the three models under investigation.
Table 10.
Comparison results.
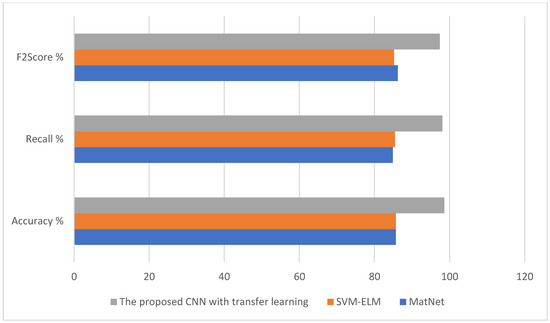
Figure 9.
The performance comparison among the three models under investigation.
4.3. Ablation Experiments
To validate the efficiency of the proposed model, we performed ablation experiments on control structures of forward propagation, backward propagation or both excluded; it is shown that best accuracy is when both forward and backward propagation modules are included, as depicted in Table 11.
Table 11.
The ablation results with formation energy, thermodynamic threshold, crystal structure volume, and oxygen vacancy.
4.4. Discussion
It is depicted from the results that the proposed perovskite performance prediction model classified 97% of the instances precisely. Moreover, from Table 5, it is proven that the precision of the model is increased by increasing the training set size. The confusion matrices, that are depicted in Table 6, Table 7, Table 8 and Table 9, prove that the four classes are correctly classified with a rate of 0.98 on average with transfer learning. To present our results with a detailed investigation of the validation of the proposed model, the accuracy rates of the four output classes are displayed in Figure 10.
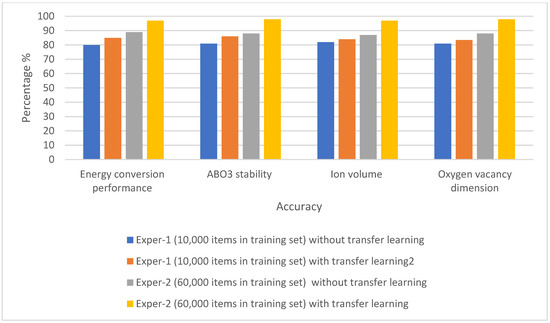
Figure 10.
Classification accuracy rate for the four output LSCD classes.
This research depicts the impact of the size on the training dataset on the classification accuracy. As we can see, the the classification accuracy is enhanced with the increase of the training data size. Figure 11 displays the impact of the training data size on the classification accuracy of the compared models against the actual classes.
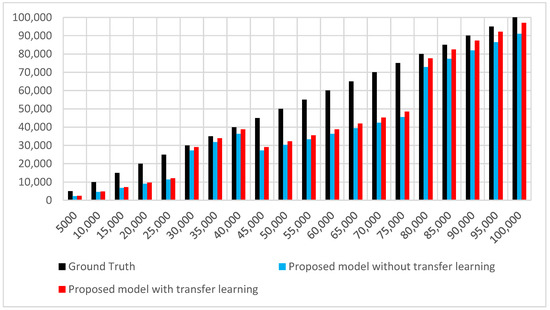
Figure 11.
The effect of the training data size on the classification accuracy of the proposed models compared to the ground truth.
5. Conclusions
In this research, we presented a deep learning model augmented by transfer learning using a feature set for perovskite performance prediction. The feature set includes twelve geometrical and chemical features. Utilizing these twelve features, the proposed transfer learning process is utilized to solve the inadequate data challenge characteristic of deep learning material performance prediction. It performs prediction by conducting training on a labelled large-sized dataset of different materials, then applying the transfer learning module on the labelled perovskite dataset. The second phase is the prediction phase of the unlabeled perovskite performance features. The experimental results depict that the proposed transfer learning DNN model has higher accuracy than deep learning alone.
The transfer learning CNN model proves a CNN perovskite performance features model to be highly effective in predicting four performance measures. The predicted features are energy conversion performance, ABO3 stability, ion volume, and induced oxygen vacancy dimension.
We performed a comparison of the proposed model with the state-of-the-art models in a materials performance measures prediction model (MatNet and SVM-ELM). The results depict that our CNN model with transfer learning is more accurate in the four measures prediction of perovskites material given the small-sized perovskites dataset. The accuracy of our model reached 98.6%, which was 9.8% higher than those two models with less training and prediction CPU time (Appendix A).
Funding
This research was funded by Princess Nourah bint Abdulrahman University Researchers Supporting Project number (PNURSP2022R113), Princess Nourah bint Abdulrahman University, Riyadh, Saudi Arabia.
Conflicts of Interest
The author declares no conflict of interest.
Appendix A. Nomenclature
| CNN | Convolutional Neural Network |
| Perovskites: | A substance with ABO3 formula with similar sizes of A-site and B-site cations. |
| CNN U-Net | CNN for optic image integration |
| FC | Fully connected layers |
| CL | Convolutional layers |
| KS | Kernel size |
| n | Number of inputs |
| m | Number of outputs. |
| MSE | Mean Squared Error |
| F2-Score | Weighted mean of the precision and recall |
| accuracy | The number of correct classification predictions divided by the total number of predictions |
| Precision | When the model predicted the positive class, what percentage of the predictions were correct? |
| Recall | The percentage of predictions the model correctly predicted as the positive class |
| TP | True positives (correct predictions). |
| TN | True negatives (correct predictions). |
| FP | False positives (incorrect predictions). |
| FN | False negatives (incorrect predictions). |
| Ablation study | Experiments where module of the system is removed to measure its influence on the accuracy of the model. |
References
- Suntivich, J.; Gasteiger, H.A.; Yabuuchi, N.; Nakanishi, H.; Goodenough, J.B.; Shao-Horn, Y. Design principles for oxygen-reduction activity on perovskite oxide catalysts for fuel cells and metal–air batteries. Nat. Chem. 2011, 3, 546–550. [Google Scholar] [CrossRef] [PubMed]
- Suntivich, J.; May, K.; Gasteiger, H.A.; Goodenough, J.B.; Shao-Horn, Y. A Perovskite Oxide Optimized for Oxygen Evolution Catalysis from Molecular Orbital Principles. Science 2011, 334, 1383–1385. [Google Scholar] [CrossRef] [PubMed]
- Lee, M.M.; Teuscher, J.; Miyasaka, T.; Murakami, T.N.; Snaith, H.J. Efficient Hybrid Solar Cells Based on Meso-Superstructured Organometal Halide Perovskites. Science 2012, 338, 643–647. [Google Scholar] [CrossRef]
- Liu, M.; Johnston, M.; Snaith, H.J. Efficient planar heterojunction perovskite solar cells by vapour deposition. Nat. Cell Biol. 2013, 501, 395–398. [Google Scholar] [CrossRef]
- Bian, H.; Li, D.; Yan, J.; Liu, S.F. Perovskite—A wonder catalyst for solar hydrogen production. J. Energy Chem. 2021, 57, 325–340. [Google Scholar] [CrossRef]
- Cao, J.; Su, C.; Ji, Y.; Yang, G.; Shao, Z. Recent advances and perspectives of fluorite and perovskite-based dual-ion conducting solid oxide fuel cells. J. Energy Chem. 2021, 57, 406–427. [Google Scholar] [CrossRef]
- Hwang, J.; Rao, R.R.; Giordano, L.; Katayama, Y.; Yu, Y.; Shao-Horn, Y. Perovskites in catalysis and electrocatalysis. Science 2017, 358, 751–756. [Google Scholar] [CrossRef] [PubMed]
- Bednorz, J.G.; Müller, K.A. Possible high Tc superconductivity in the Ba-La-Cu-O system. Z. Phys. B Condens. Matter 1986, 64, 189–193. [Google Scholar] [CrossRef]
- Tao, S.; Irvine, J. A redox-stable efficient anode for solid-oxide fuel cells. Nat. Mater. 2003, 2, 320–323. [Google Scholar] [CrossRef]
- Ohtomo, A.; Hwang, H.Y. A high-mobility electron gas at the LaAlO3/SrTiO3 heterointerface. Nat. Cell Biol. 2004, 427, 423–426. [Google Scholar] [CrossRef]
- Kojima, A.; Teshima, K.; Shirai, Y.; Miyasaka, T. Organometal Halide Perovskites as Visible-Light Sensitizers for Photovoltaic Cells. J. Am. Chem. Soc. 2009, 131, 6050–6051. [Google Scholar] [CrossRef] [PubMed]
- Burschka, J.; Pellet, N.; Moon, S.-J.; Humphry-Baker, R.; Gao, P.; Nazeeruddin, M.K.; Grätzel, M. Sequential deposition as a route to high-performance perovskite-sensitized solar cells. Nat. Cell Biol. 2013, 499, 316–319. [Google Scholar] [CrossRef] [PubMed]
- Stranks, S.D.; Eperon, G.E.; Grancini, G.; Menelaou, C.; Alcocer, M.J.P.; Leijtens, T.; Herz, L.M.; Petrozza, A.; Snaith, H.J. Electron-Hole Diffusion Lengths Exceeding 1 Micrometer in an Organometal Trihalide Perovskite Absorber. Science 2013, 342, 341–344. [Google Scholar] [CrossRef] [PubMed]
- Besegatto, S.V.; da Silva, A.; Campos, C.E.M.; de Souza, S.M.A.G.U.; de Souza, A.A.U.; González, S.Y.G. Perovskite-based Ca-Ni-Fe oxides for azo pollutants fast abatement through dark catalysis. Appl. Catal. B Environ. 2021, 284, 119747. [Google Scholar] [CrossRef]
- Yashima, M.; Tsujiguchi, T.; Sakuda, Y.; Yasui, Y.; Zhou, Y.; Fujii, K.; Torii, S.; Kamiyama, T.; Skinner, S.J. High oxide-ion conductivity through the interstitial oxygen site in Ba7Nb4MoO20-based hexagonal perovskite related oxides. Nat. Commun. 2021, 12, 556. [Google Scholar] [CrossRef]
- Tao, Q.; Xu, P.; Li, M.; Lu, W. Machine learning for perovskite materials design and discovery. NPJ Comput. Mater. 2021, 7, 23. [Google Scholar] [CrossRef]
- Peña, M.A.; Fierro, J.L.G. Chemical Structures and Performance of Perovskite Oxides. Chem. Rev. 2001, 101, 1981–2018. [Google Scholar] [CrossRef]
- Fop, S.; McCombie, K.; Wildman, E.J.; Skakle, J.M.S.; Irvine, J.T.S.; Connor, P.A.; Savaniu, C.; Ritter, C.; McLaughlin, A.C. High oxide ion and proton conductivity in a disordered hexagonal perovskite. Nat. Mater. 2020, 19, 752–757. [Google Scholar] [CrossRef]
- Zhang, H.T.; Park, T.J.; Zaluzhnyy, I.A.; Wang, Q.; Wadekar, S.N.; Manna, S.; Andrawis, R.; Sprau, P.O.; Sun, Y.; Zhang, Z.; et al. Perovskite neural trees. Nat. Commun. 2020, 11, 2245. [Google Scholar] [CrossRef]
- Zhao, J.; Gao, J.; Li, W.; Qian, Y.; Shen, X.; Wang, X.; Shen, X.; Hu, Z.; Dong, C.; Huang, Q.; et al. A combinatory ferroelectric compound bridging simple ABO3 and A-site-ordered quadruple perovskite. Nat. Commun. 2021, 12, 747. [Google Scholar] [CrossRef]
- Butler, K.T.; Davies, D.W.; Cartwright, H.; Isayev, O.; Walsh, A. Machine learning for molecular and materials science. Nat. Cell Biol. 2018, 559, 547–555. [Google Scholar] [CrossRef] [PubMed]
- Pilania, G.; Wang, C.; Jiang, X.; Rajasekaran, S.; Ramprasad, R. Accelerating materials property predictions using machine learning. Sci. Rep. 2013, 3, 2810. [Google Scholar] [CrossRef] [PubMed]
- Belsky, A.; Hellenbrandt, M.; Karen, V.L.; Luksch, P. New developments in the inorganic crystal structure database (ICSD): Accessibility in support of materials research and design. Acta Crystallogr. Sect. B Struct. Sci. 2002, 58, 364–369. [Google Scholar] [CrossRef] [PubMed]
- Ramprasad, R.; Batra, R.; Pilania, G.; Mannodi-Kanakkithodi, A.; Kim, C. Machine learning in materials informatics: Recent applications and prospects. NPJ Comput. Mater. 2017, 3, 54. [Google Scholar] [CrossRef]
- Olivares-Amaya, R.; Amador-Bedolla, C.; Hachmann, J.; Atahan-Evrenk, S.; Sánchez-Carrera, R.S.; Vogt, L.; Aspuru-Guzik, A.; Vogt-Maranto, L. Accelerated computational discovery of high-performance materials for organic photovoltaics by means of cheminformatics. Energy Environ. Sci. 2011, 4, 4849–4861. [Google Scholar] [CrossRef]
- Koh, J.C.; Spangenberg, G.; Kant, S. Automated Machine Learning for High-throughput Image-based Plant Phenotyping. Remote. Sens. 2021, 13, 858. [Google Scholar] [CrossRef]
- Patil, A.; Lad, K. Chili Plant Leaf Disease Detection Using SVM and KNN Classification. In Rising Threats in Expert Applications and Solutions; Rathore, V., Dey, N., Piuri, V., Babo, R., Polkowski, Z., Tavares, J., Eds.; Springer: Singapore, 2021; pp. 223–231. [Google Scholar]
- Anjana, T.; Blas, U.P.; Christopher, S.R.; Ghanshyam, P. A Machine Learning Approach for the Prediction of Forma-bility and Thermodynamic Stability of Single and Double Perovskite Oxides. Chem. Mater. 2021, 33, 845–858. [Google Scholar]
- Zandi, S.; Saxena, P.; Razaghi, M.; Gorji, N.E. Simulation of CZTSSe Thin-Film Solar Cells in COMSOL: Three-Dimensional Optical, Electrical, and Thermal Models. IEEE J. Photovolt. 2020, 10, 1503–1507. [Google Scholar] [CrossRef]
- Ren, F.; Ward, L.; Williams, T.; Laws, K.J.; Wolverton, C.; Hattrick-Simpers, J.; Mehta, A. Accelerated discovery of metallic glasses through iteration of machine learning and high-throughput experiments. Sci. Adv. 2018, 4, eaaq1566. [Google Scholar] [CrossRef]
- Juan, Y.; Dai, Y.; Yang, Y.; Zhang, J. Accelerating materials discovery using machine learning. J. Mater. Sci. Technol. 2021, 79, 178–190. [Google Scholar] [CrossRef]
- Tabor, D.P.; Roch, L.M.; Saikin, S.K.; Kreisbeck, C.; Sheberla, D.; Montoya, J.H.; Dwaraknath, S.; Aykol, M.; Ortiz, C.; Tribukait, H.; et al. Accelerating the discovery of materials for clean energy in the era of smart automation. Nat. Rev. Mater. 2018, 3, 5–20. [Google Scholar] [CrossRef]
- Ganesan, K. How to Compute Precision and Recall for a Multi-Class Classification Problem. Available online: https://kavita-ganesan.com/how-to-compute-precision-and-recall-for-a-multi-class-classification-problem/#.YzMV93ZByM8 (accessed on 10 June 2021).


Publisher’s Note: MDPI stays neutral with regard to jurisdictional claims in published maps and institutional affiliations. |
© 2022 by the author. Licensee MDPI, Basel, Switzerland. This article is an open access article distributed under the terms and conditions of the Creative Commons Attribution (CC BY) license (https://creativecommons.org/licenses/by/4.0/).