Article

An S-Band-Receiving Phased-Array Antenna with a Phase-Deviation-Minimized Calibration Method for LEO Satellite Ground Station Applications

1
National Satellite Operation and Application Center, Korea Aerospace Research Institute (KARI), Daejeon 34133, Republic of Korea
2
DUTA Technology Co., Ltd., Daejeon 34077, Republic of Korea
3
AFARM Co., Ltd., Sejong 30150, Republic of Korea
4
Department of Information and Communication Engineering, Hanbat National University, Daejeon 34158, Republic of Korea
*
Author to whom correspondence should be addressed.
Electronics 2022, 11(23), 3847; https://doi.org/10.3390/electronics11233847
Submission received: 31 October 2022 / Revised: 16 November 2022 / Accepted: 18 November 2022 / Published: 22 November 2022
(This article belongs to the Section Microwave and Wireless Communications)

Abstract

:
This study presents a new S-band-receiving phased-array antenna with a phase-deviation-minimized calibration method for the ground station of a low Earth orbit (LEO) satellite. The proposed antenna consists of 16 subarrays, 16 beamforming receiving RF modules (BF-RFMs), a power/control board, and a 16-way feed network. The subarray was achieved by joining two 8 × 1 arrays with a two-way power combiner. The 16-element antenna subarrays showed a gain of 16.1 dBi and a reflection coefficient of less than −10 dB from 2.12 GHz to 2.45 GHz. The BF-RFM, which consists of three low-noise amplifiers (LNAs), a power combiner, a phase shifter, and a digital attenuator, was designed and fabricated. The BF-RFMs were provided by the power/control board and showed a gain of 30.8 ± 0.8 dB, an amplitude root-mean-square (RMS) error from 0.25 dB to 0.28 dB, and a phase RMS error from 1.8° to 2.5° over the Rx frequency range. The arrangement procedures of the 16 BF-RFMs are presented to increase beam pointing accuracy at the desired angle. A commercial 16-way feed network was employed to combine all the output ports of the 16 BF-RFMs. The assembled antenna, which has dimensions of 1.58 m × 1.58 m × 0.2 m, was measured by partial and full scans in the near-field scanning system. The back-projected algorithm was employed to calibrate the antenna’s gain patterns in the partial scan. The implemented phased-array antenna had a gain greater than 28.14 dBi, sidelobe levels less than −17.1 dB, and beam pointing errors less than 0.07° over the beam pointing angle of −20~+20°. Based on the implemented antenna system, we conducted a field test using KOMPSAT-5, which is actually operating in South Korea, in order to verify the performance of the low Earth orbit (LEO) satellite ground station system.

1. Introduction

Phased-array antennas have the ability to quickly control beam pointing angles using electrical beam scanning techniques. These antennas have been widely used in radar systems, satellite antenna systems, and military applications [1,2,3,4,5,6,7]. These antennas consist of numerous radiating elements, TR active modules, combining circuits, and control boards. When developing phased-array antennas, great attention is paid to low sidelobe levels, precise beam scanning performances, and multibeam generations [8,9,10].
Radiating elements are affected by mutual coupling efforts and surrounding environments when operating a phased-array antenna. In developing antenna systems, all subsystems are individually measured and integrated, and their radiation patterns are calibrated to increase beam pointing accuracy. Therefore, it is necessary to accurately measure not only individual subsystems but also the entire integrated system.
The measurement methods for subarrays are diverse. Essentially, it is very important to compare the properties of the subarray itself and the properties of the entire system [11]. Inverse-source techniques are employed as diagnostic tools for a subarray or a single radiating element when measuring entire antenna systems [12]. This method takes equivalent currents and calculates the complex electric fields of a subarray or a single element. Spatial convolution and the multiplication of beam patterns can be employed when the far-field condition does not satisfactorily measure a subarray [13]. Reduction techniques of sidelobe levels in the stacked subarray have also been proposed [14].
Recently, the active TR modules for phased-array antennas have mainly been dominated by their design concepts rather than their fabrications. Bräutigam and his colleagues developed and measured 384 modules for applications with the TerraSAR-X satellite [15]. Nauyer proposed a TR module based on 65 mm CMOS technology [16]. TR modules are fabricated and measured with their RMS errors of magnitude and phase, and LSB values for a digital attenuator and a phase shifter.
Studies on the measurements of phased-array antennas have mainly dealt with radiation pattern calibrations. Due to their large size, radiation patterns are usually measured with the far-field outdoor system [17] or the near-field scanning system [18,19]. Specially designed systems for pattern calibrations have sometimes been applied [20,21]. Initial approaches to pattern calibrations are focused on measuring the amplitudes and phases of individual elements in the entire array systems. The Japanese scholar Mano and his colleagues measured the complex electric field of a radiating element using the rotating element electric field vector (REV) method [22]. This method has extended the theoretical approach [23] and the way to increase measurement accuracy by transforming measured power variations to a Fourier series [24] as well as a correction method of distorted phase distributions by employing multiple observation points [25] and a calculation of the electric field by adjusting the phases of individual elements [26]. These are some obstacles in the wide use of these methods due to complicated mathematical approaches.
This study describes the fabrication and measurement procedures in developing a phased-array antenna that receives S-band telemetry signals from LEO satellites. First, the subarray was fabricated and measured. Second, 16 beamforming receiving RF modules (BF-RAMs) were designed and fabricated. The required performance of the BF-RFM measurements is presented below. The arrangement procedures for 16 BF-RFMs are used to explain how to enhance beam pointing accuracy. System gains were measured from 16 BF-RFMs and used to estimate the final antenna gains. Finally, a novel pattern calibration method for phased-array antennas, which deals with the back-projected algorithm in near-field scanning systems, was utilized and validated. With the novel calibration methods, improved antenna far-field patterns were achieved. In the field tests of the fabricated antenna, we employed the redesignated control bits of 16 BF-RFMs for good reception of satellite telemetry signals.

2. Structure of the Proposed Phased-Array Antenna

The proposed phased-array antenna system was developed to scan beam pointing angles with electrical controllers. Figure 1 shows a configuration of the antenna system, consisting of 16 subarrays, 16 beamforming receiving RF modules (BF-RFMs), a power/control board, and a 16-way feed network. One subarray with 16 dipole antennas was divided into two 8 × 1 subarrays connected to the corresponding BF-RFM. In developing the phased-array antenna, each subsystem of the antenna was individually designed, fabricated, and measured. The subarrays were connected to 16 corresponding BF-RFMs by employing low-loss and in-phase coaxial cables. In the same manner, 16 coaxial cables were also applied to connect the BF-RFM output ports with the 16-way feed network. The power/control board was designed to provide the power and control bits for the 16 BF-RFMs.

2.1. Antenna Subarrays

The subarray was composed of 16 printed dipoles and a parallel feed network. A subarray was divided into two 8 × 1 arrays due to its length. In designing the subarray, the effects of the ABS radome were also included, which had a thickness of 5 mm, a dielectric constant of 2.78, and a tangent loss of 0.02. The subarray was designed and optimized with the widely-used CST Microwave Studio ver. 2021.
Figure 2 shows the optimally designed dimensions of the single radiating element fed by a 100 Ω (2Z0) shadowed microstrip line. The element was finally designed in consideration of the mutual coupling effects of an 8 × 1 subarray.
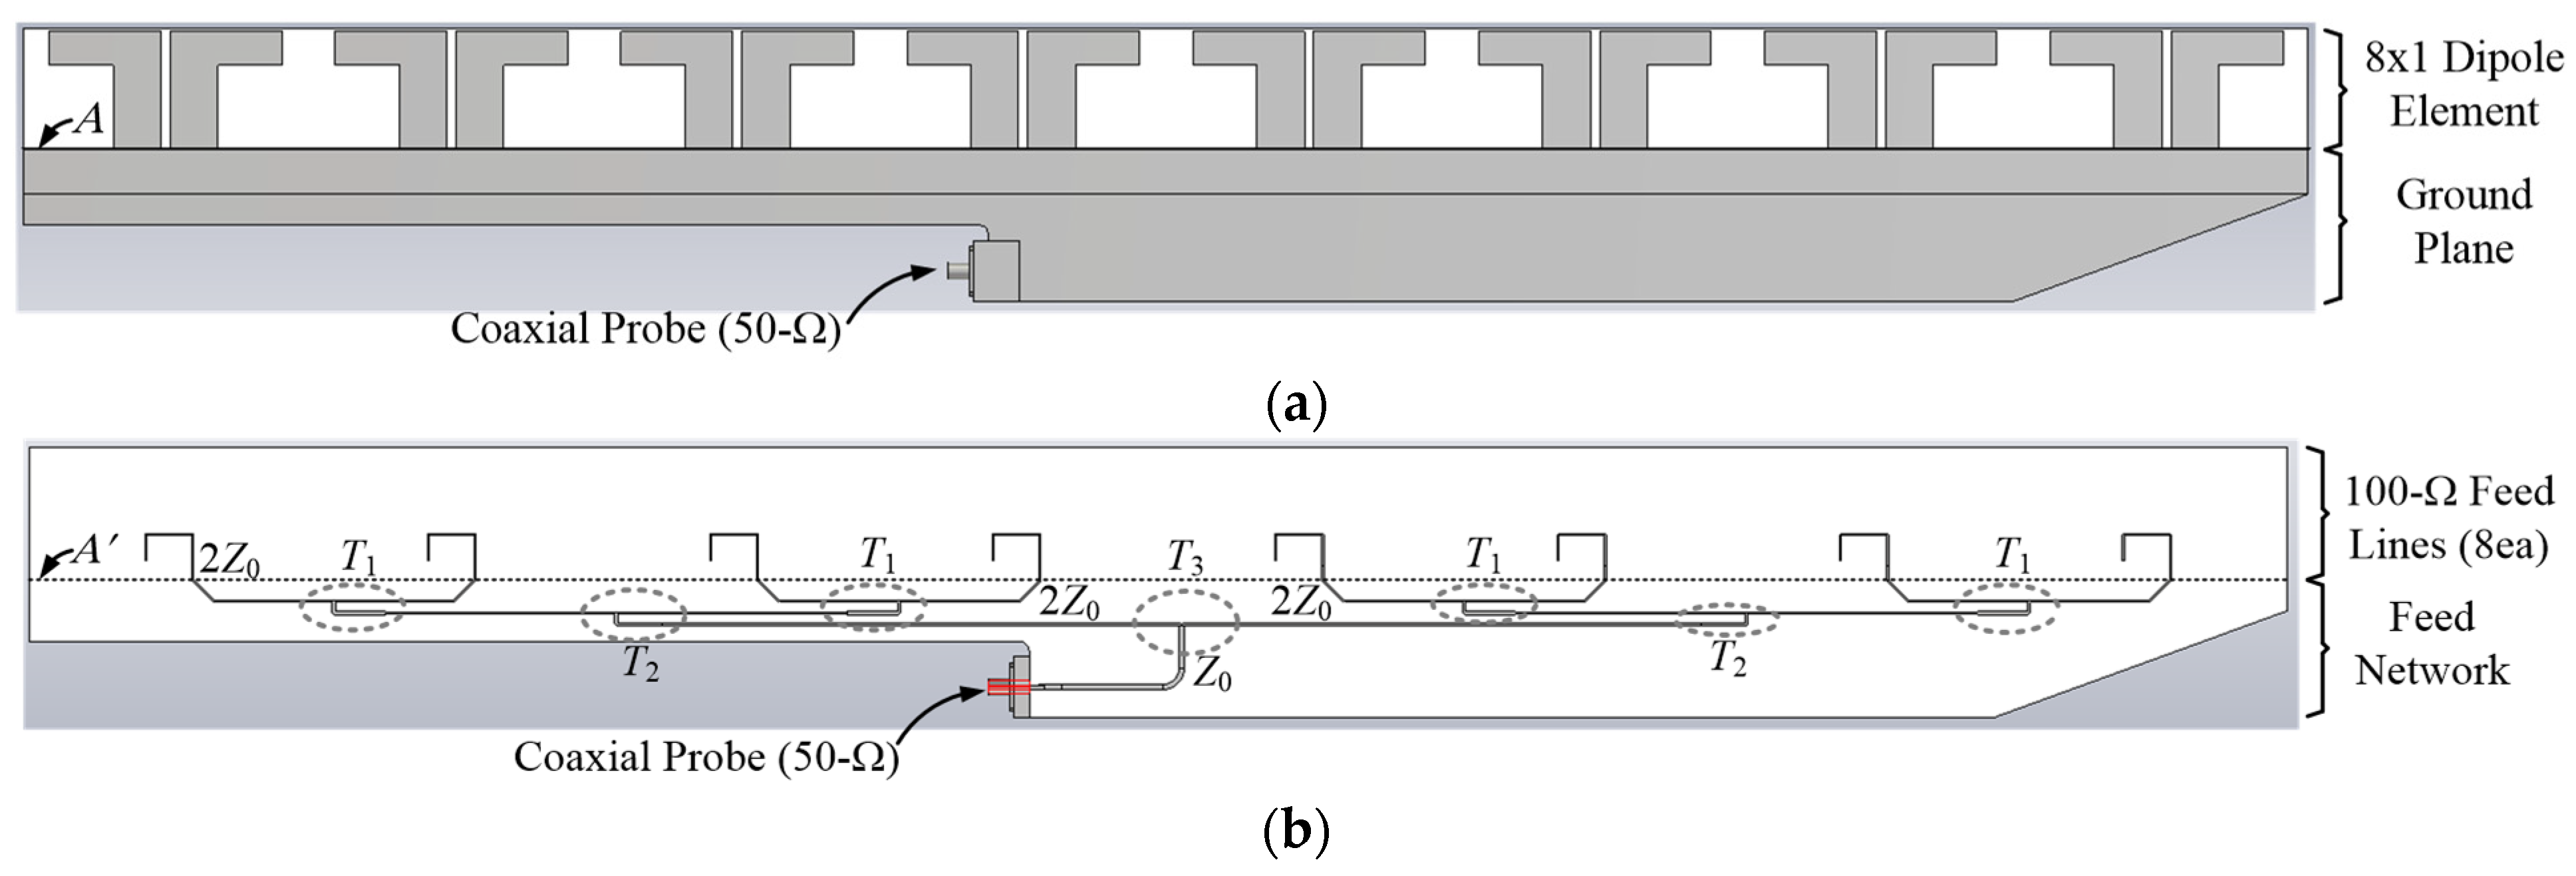
Figure 3 shows the geometry of the substrate with the printed 8 × 1 subarray. Eight radiating elements were printed on the top of the substrate, and the parallel feed network was realized on the bottom substrate. The line A and line A′ were positioned at the same height. The parallel feed network consisted of two quarter-wave transformers, T1 and T2, and a power combiner, T3. Each length of the two transformers was slightly different due to the mutual coupling effects. The final transmission line with the characteristic impedance of 50 ohms was directly connected to the coaxial probe.
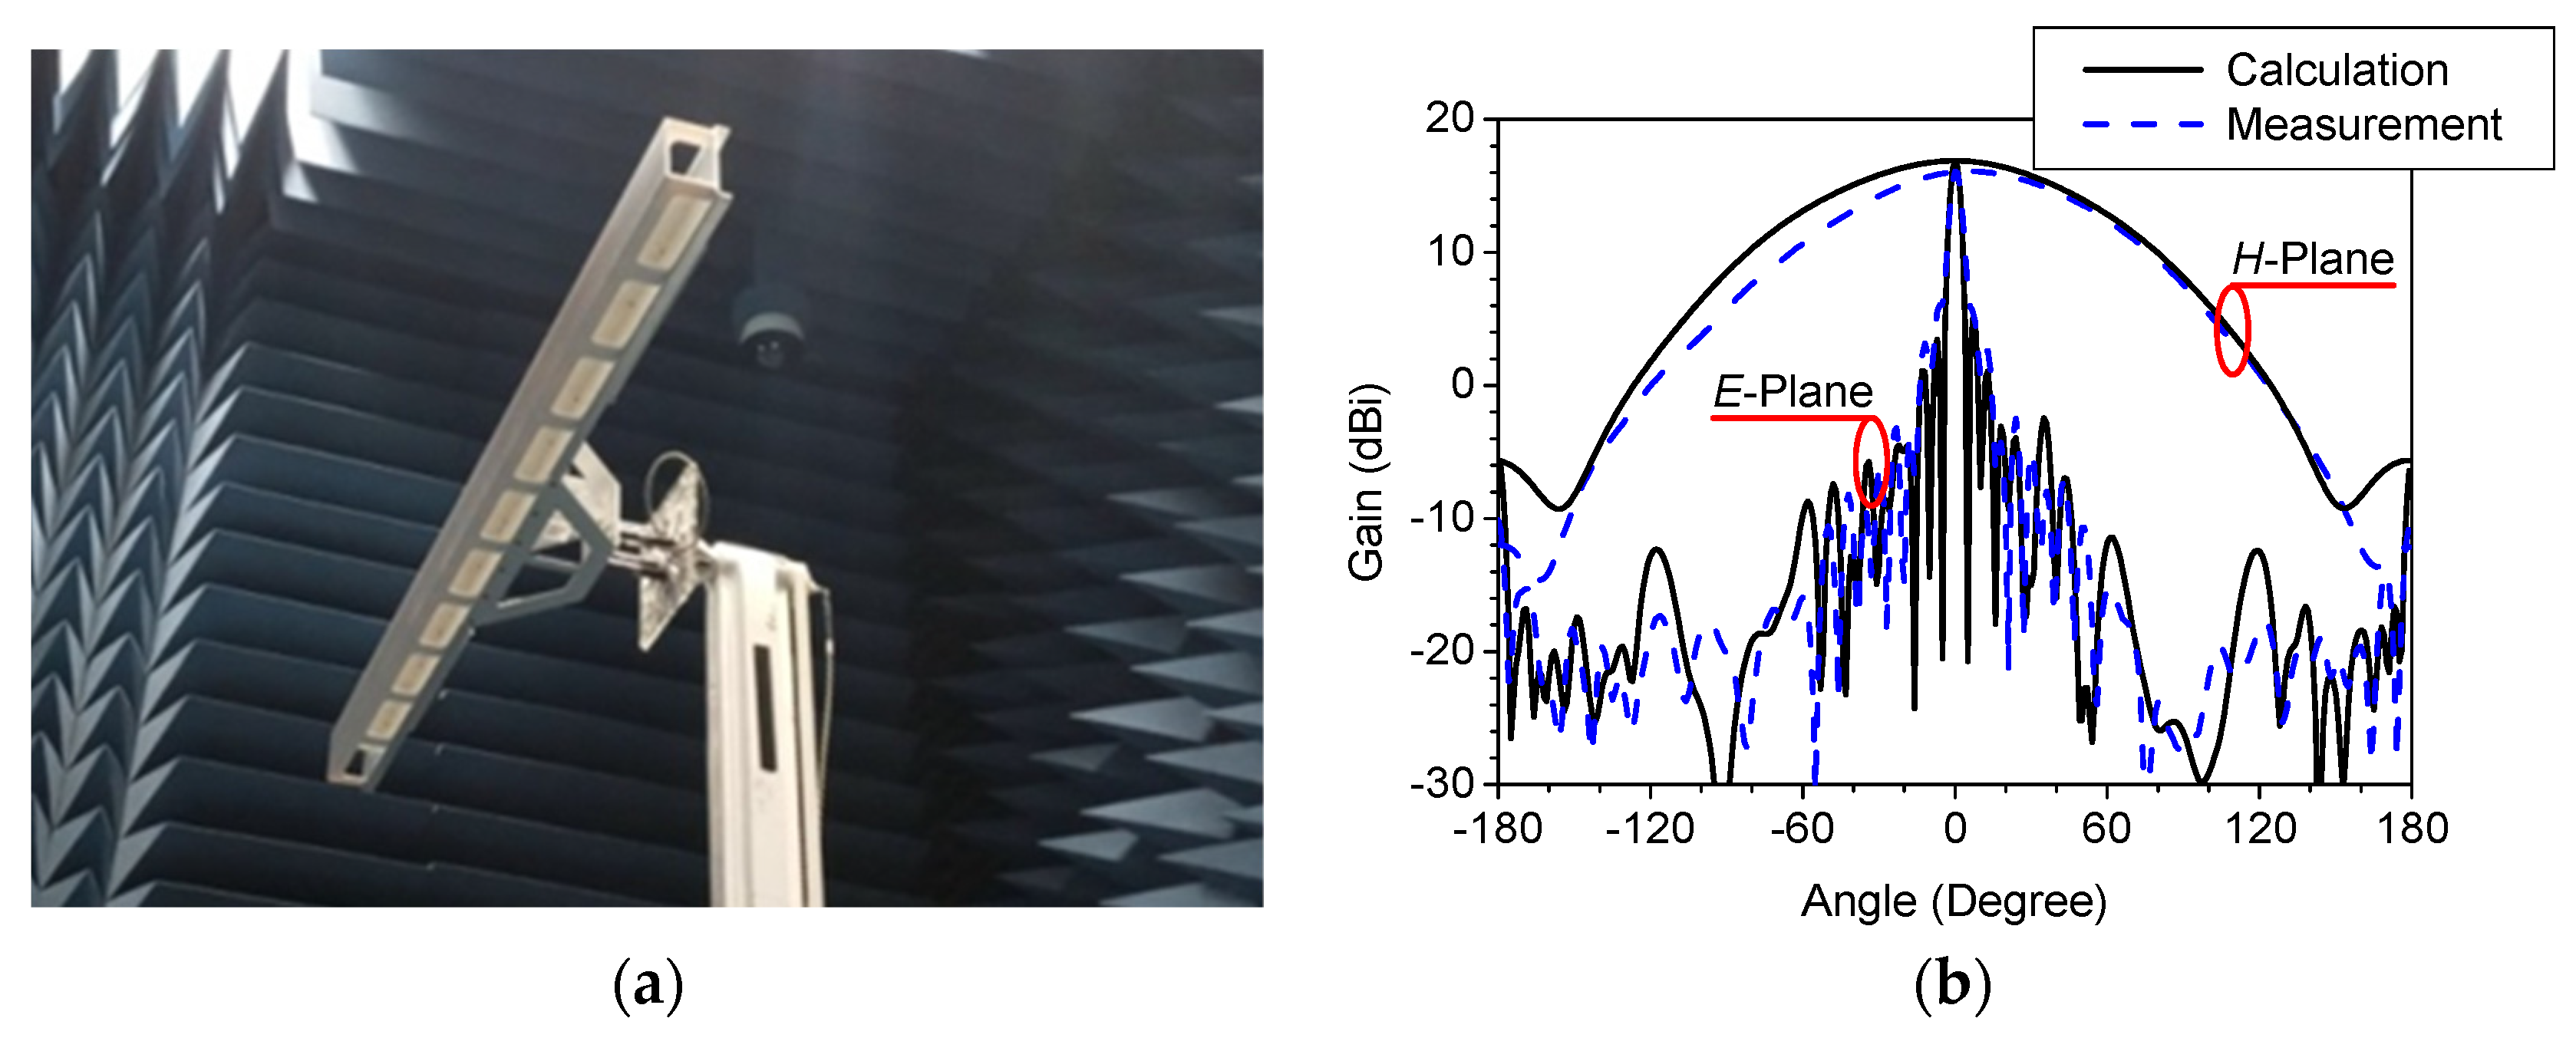
Figure 4 shows the fabricated subarray mounted on the mast in the far-field measurement system to obtain radiation patterns and measure the far-field radiation patterns of the fabricated antenna subarray. The ABS radome was covered in the front of the subarray. In measuring the subarray, two low-loss and in-phase coaxial cables and a commercial two-way power combiner of ZN2PD-63-S+®, which was made by Mini-CircuitTM, were employed to combine two 8 × 1 arrays. The distance between the source antenna and the AUT at the measuring site was 8.5 m, which did not satisfy the far-field conditions. The gain degradation was estimated to be 1.3 dB, with the satisfaction of the far-field condition occurring with the plane wave propagations. The measured gain patterns are shown in Figure 4b. The degraded gain of 1.3 dB was added to compensate for the far-field conditions. The measurement showed that a maximum gain of 16.1 dBi and good agreement with the calculated patterns.
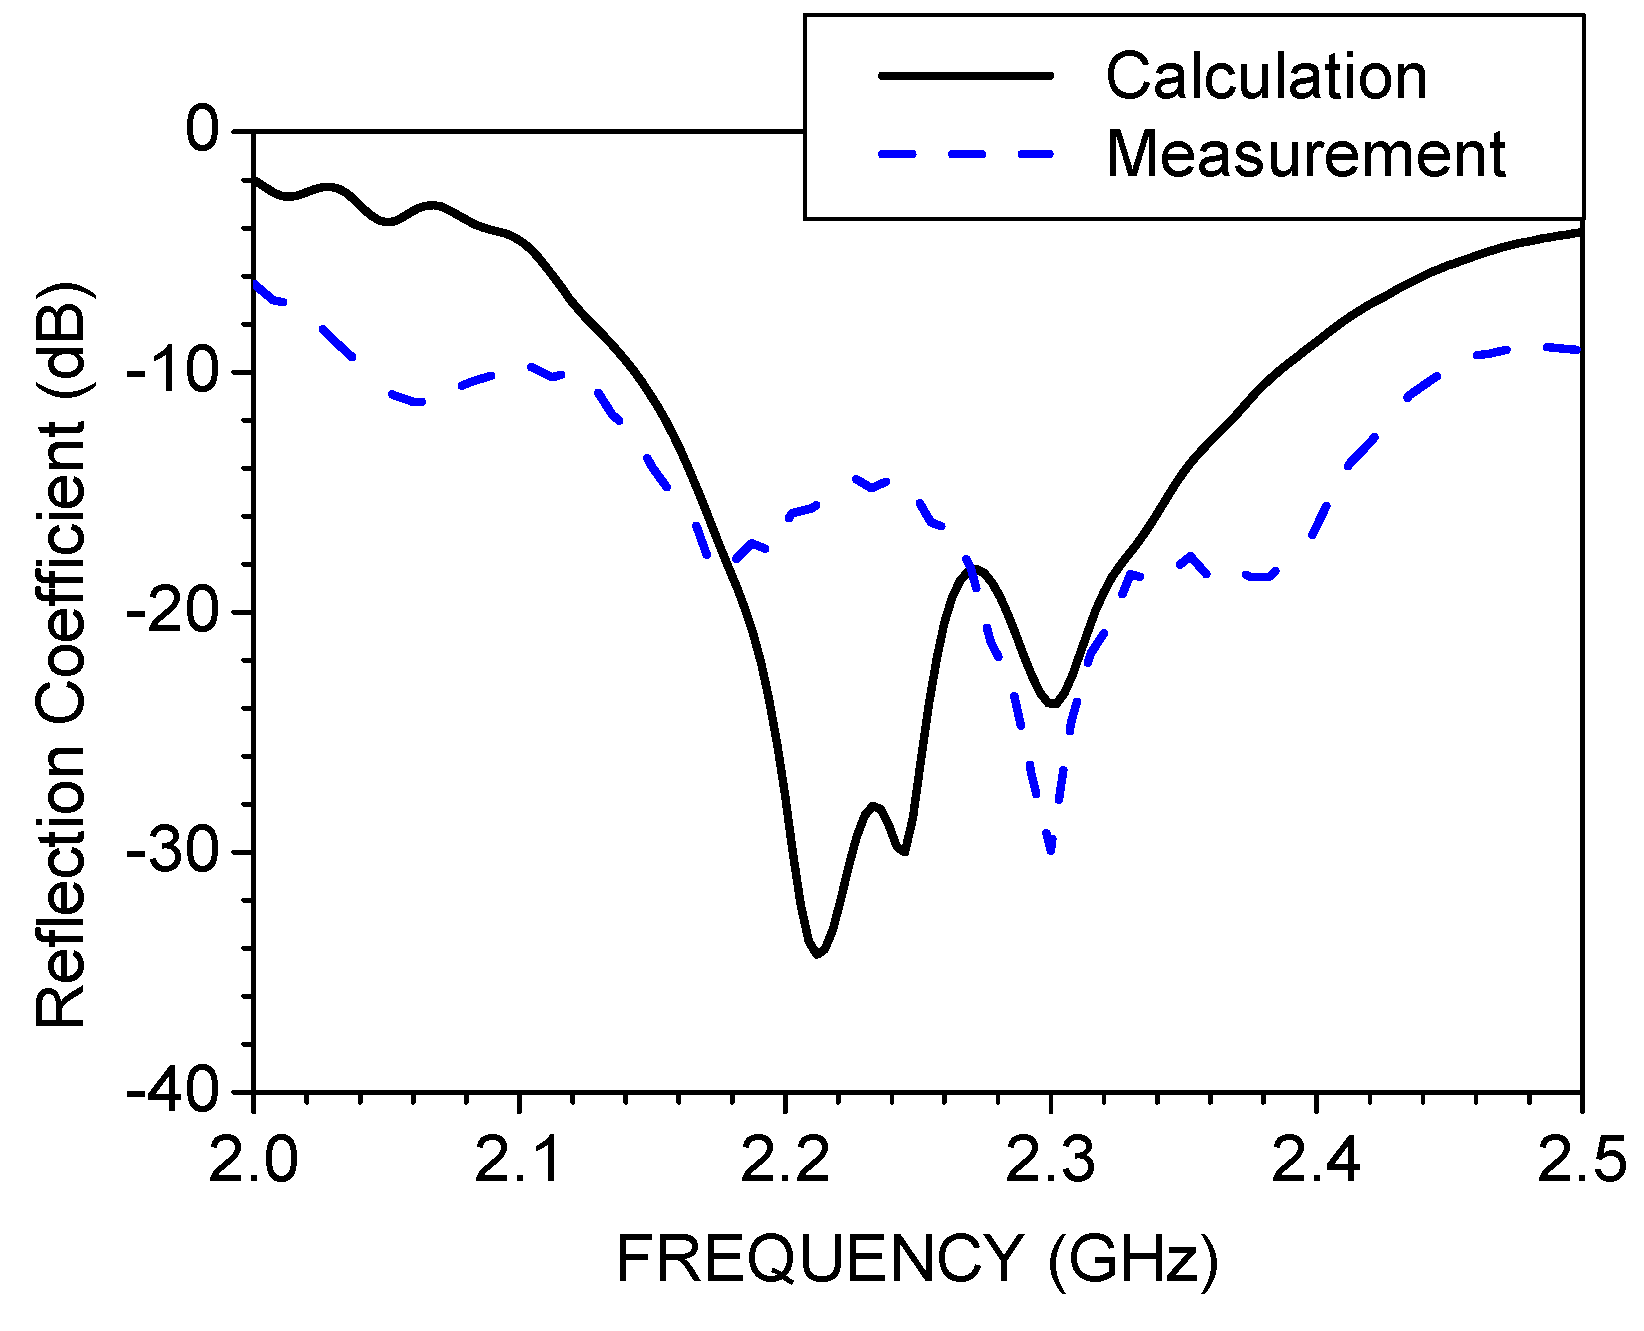
Figure 5 exhibits the reflection coefficients of the 16 × 1 antenna subarray. Two fabricated 8 × 1 subarrays were combined with the commercial power combiner to realize the 16 × 1 subarray.
The measurement showed that it had a reflection coefficient of less than −10 dB from 2.12 GHz to 2.45 GHz. The performances of the power combiner were contained in the measured result.

2.2. Beamforming Rx RF Modules (BF-RFMs)

To electrically control the maximum beam positions to the desired angle, θ, of 0 degrees, a beamform Rx RF module was designed and measured. As shown in Figure 6, the BF-RFM was composed of a two-way power combiner to join two 8 × 1 arrays, three LNAs for low-noise performances and sufficient system gain, a phase shifter, and a digital attenuator for adjusting the amplitude and phase at each radiating element. With the low-loss and in-phase coaxial cables, two input ports (Pin,1 and Pin,2) were combined with two 8 × 1 arrays, and the one output port (Pout) was connected to the 16-way feed network.
Two LNAs were arranged between each input port and a two-way power combiner to reduce the noise figures of the entire system. The other LNA was directly placed at the end of the two-way power combiner in order to increase system gains. For high-phase resolutions, an eight-bit phase shifter by Peregine Semiconductor (PE4482) was used. A digital attenuator with a step of 0.25 dB was utilized, which was produced by IDT’s Glitch-Free (F1598). The required power and control bits of each BF-RFM were provided by the power/control board with the SPI communications. The BF-RFM was realized on a 0.4 mm FR4 substrate and placed in an aluminum metal housing.
Figure 6b shows the fabricated module with the upper metal cover removed. Two input ports were connected by a two-way power combiner to naturally obtain the variation performances of the phase shifter. In measuring 16 BF-RFMs, a reference module with excellent performances in the amplitude and phase variations was adopted. The power/control board was designed by employing MCU and FPGA chipsets. The power of the board and the 16 BF-RFMs was supplied with an AC-DC converter through external 220-V AC voltages. The control bits of each phase shifter in the 16 BF-RFMs were provided with SPI communications. Additionally, the attenuator bits were supplied through GPIO ports in the FPGA chip. The external computer was connected with the phased-array antenna by employing ethernet communications.
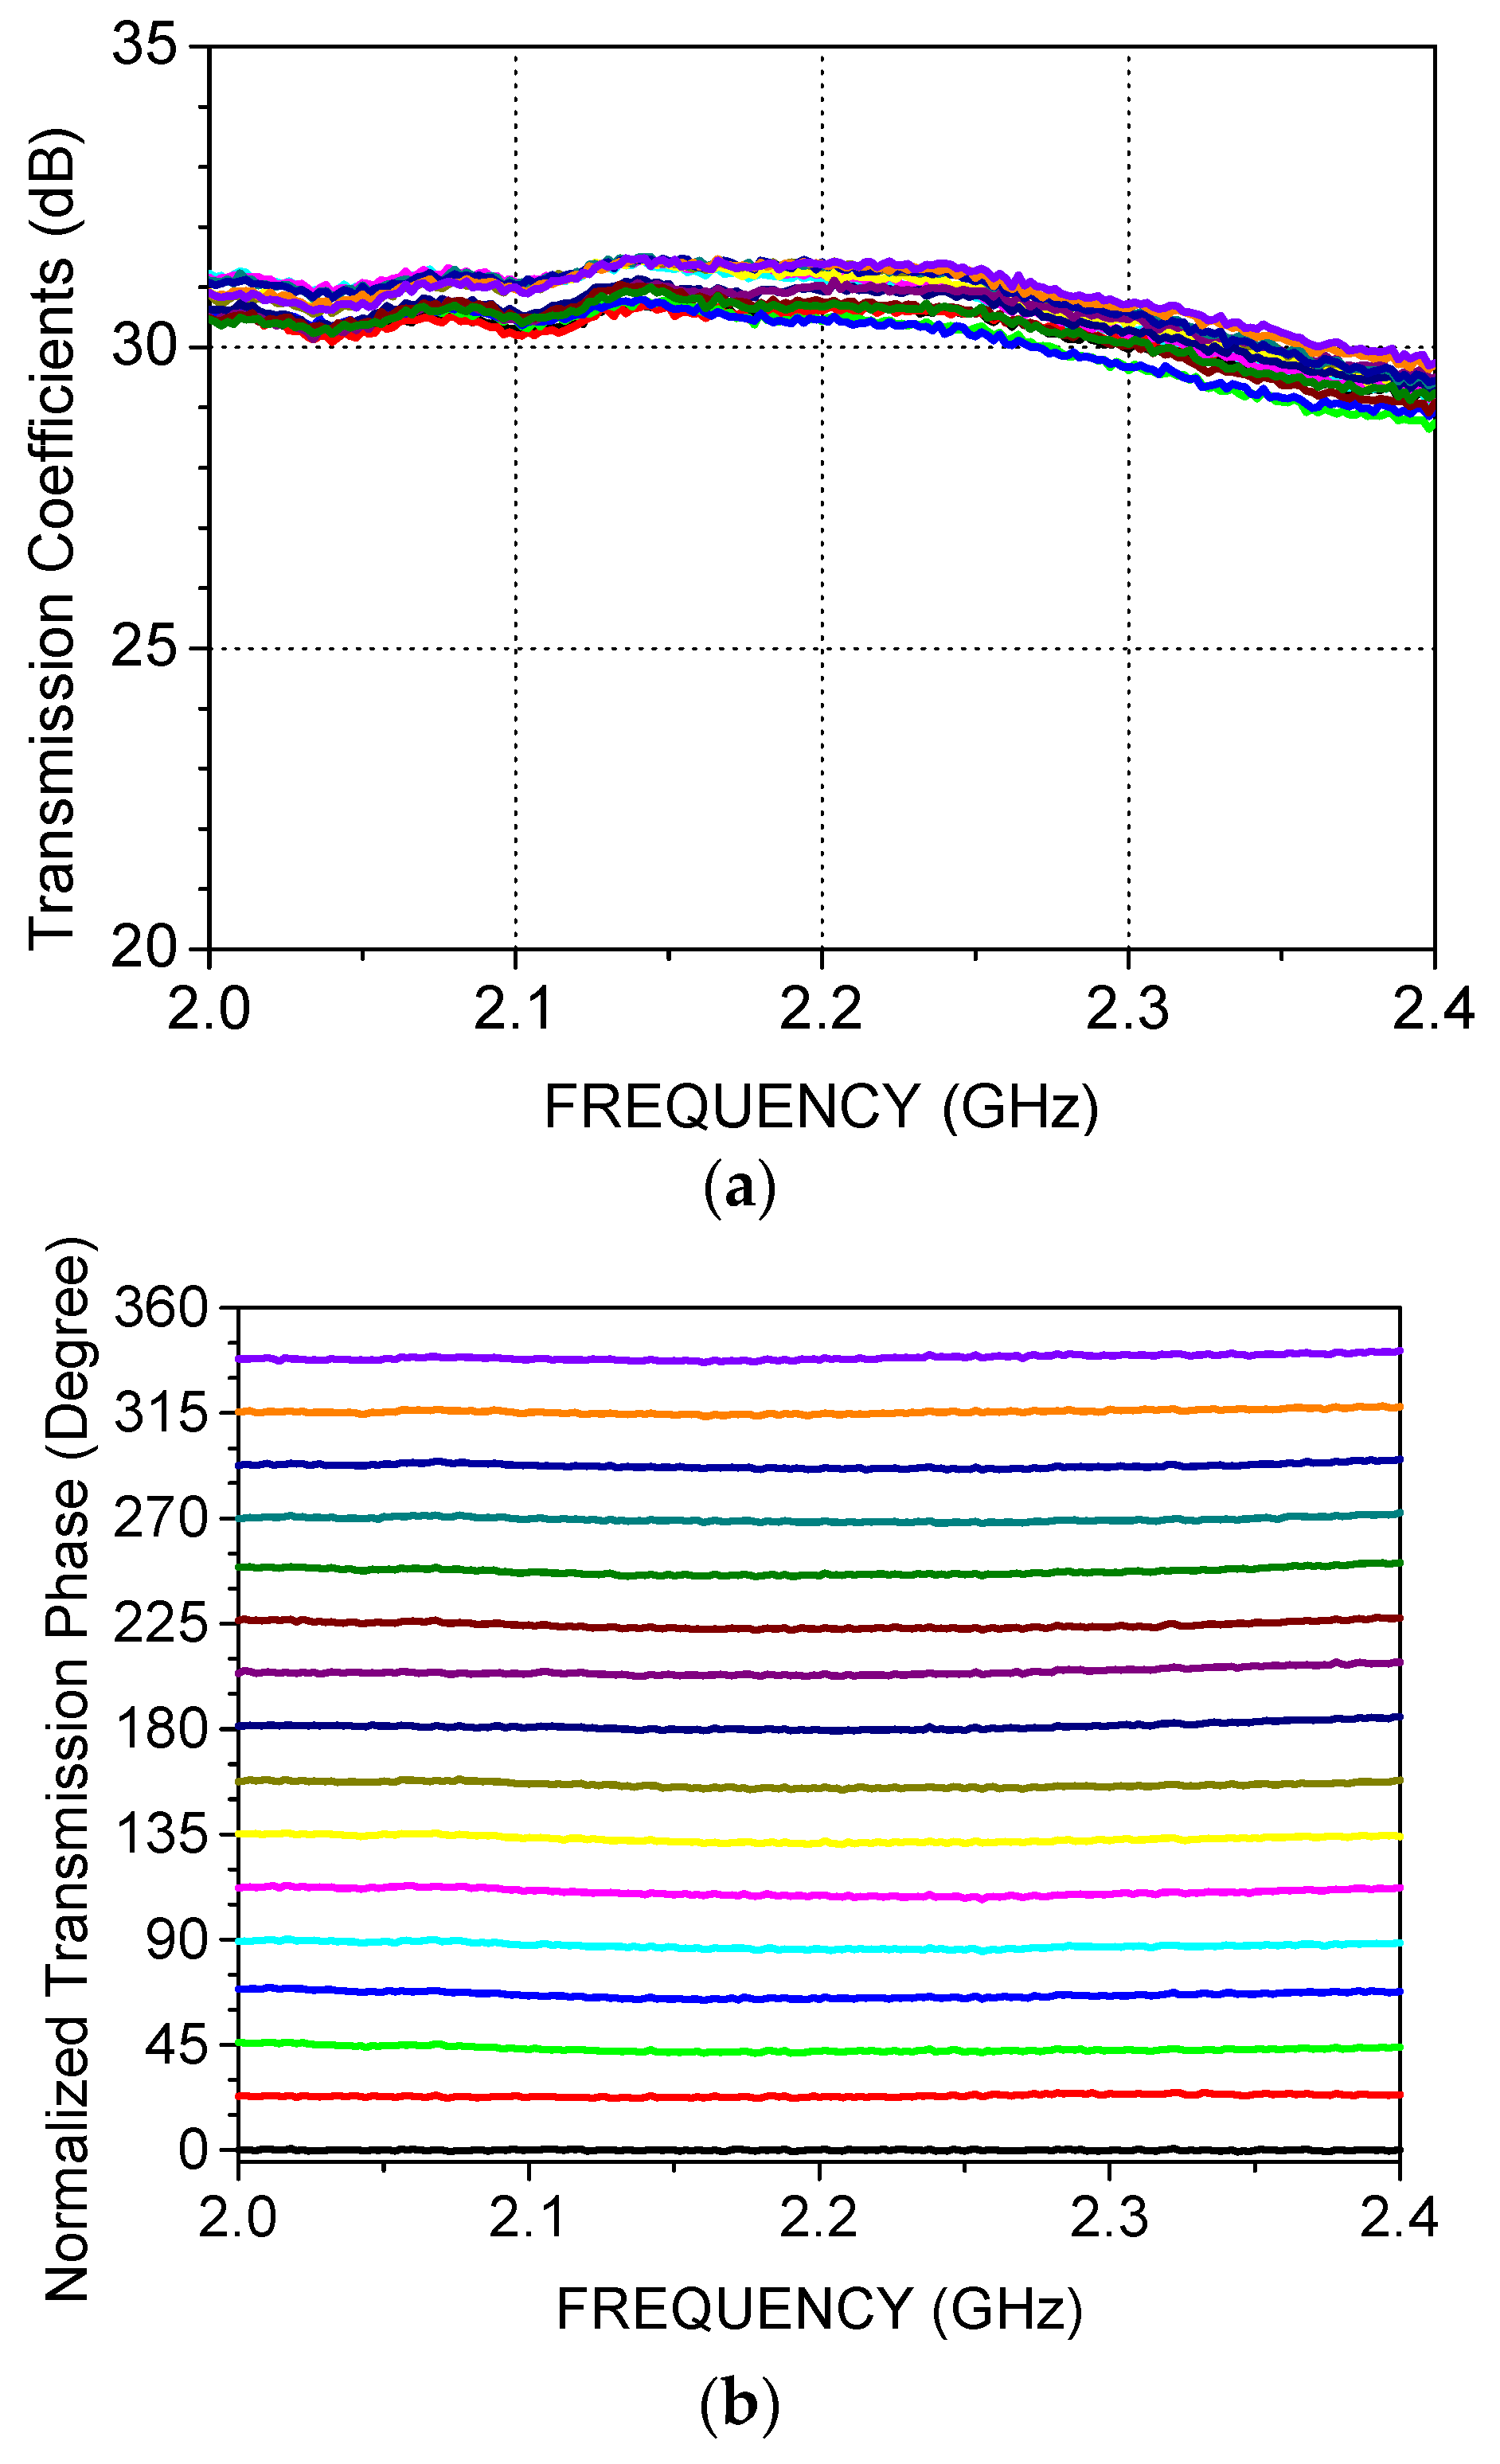
Figure 7 shows the measured transmission coefficient and the phases of the BF-RFM at 16 steps with the initial state of the digital attenuator and the phase intervals of 22.5°. The transmission coefficients varied in the range of 30.0~31.6 dB in accordance with each control bit of the phase shifter. The normalized transmission phases were uniformly distributed at each step.
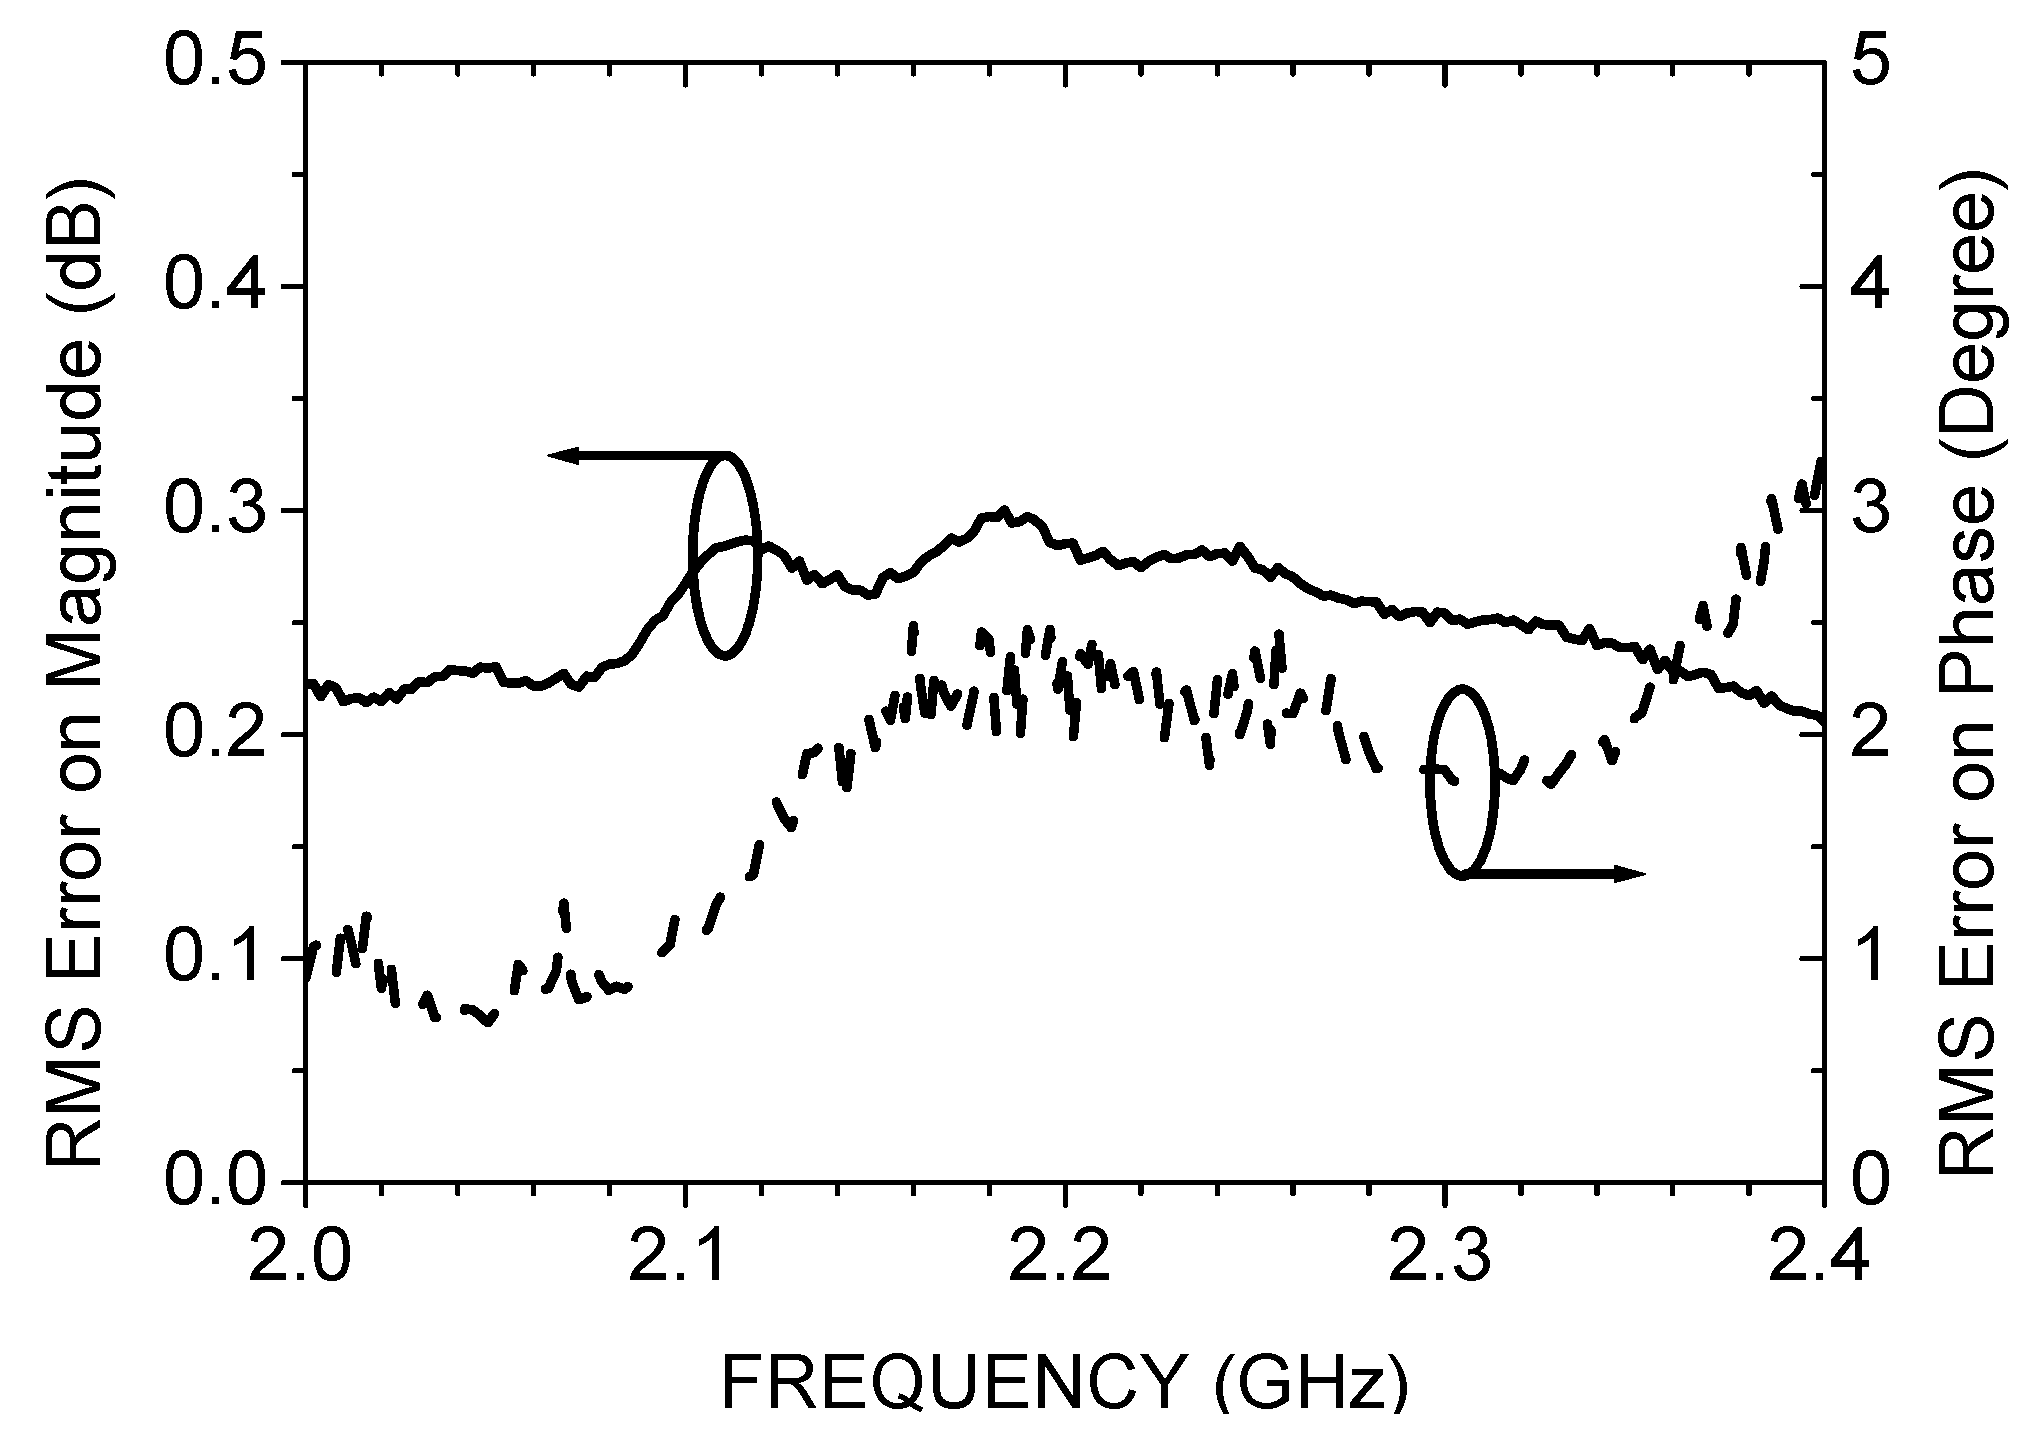
Figure 8 displays the measured RMS errors in the 256 control states of the phase shifter. The amplitude and phases RMS error of the measured transmission coefficients were 0.25–0.28 dB and 1.8–2.5° over the Rx frequency range of 2.2–2.3 GHz, respectively.

3. Full Phased-Array Antenna System

3.1. Arrangements of the BF-RFMs

The arrangement procedures of the BF-RFMs play an important role in enhancing the beam pointing accuracy for the operation of a phased-array antenna. The arrangement procedures were as follows. First, the control bits of the digital attenuators were adjusted to satisfy the condition of −20 dB sidelobe levels over the elevation plane with uniform phase distributions. To simplify adjusting the control bits, amplitude variations were set in advance to meet the condition. Second, 16 BF-RFMs were individually measured with the 256 control bits of the only phase shifter. Third, the initial bit states of each module were determined to obtain uniform phase distribution over the elevation plane with the reference module in the first bit state. In the fourth step, the required control bits of the 16 BF-RFMs were determined in order to tilt the main beam position in the desired directions. Finally, antenna system gains were measured with the phase control bits designated at each beam pointing angle, as shown in Figure 9.
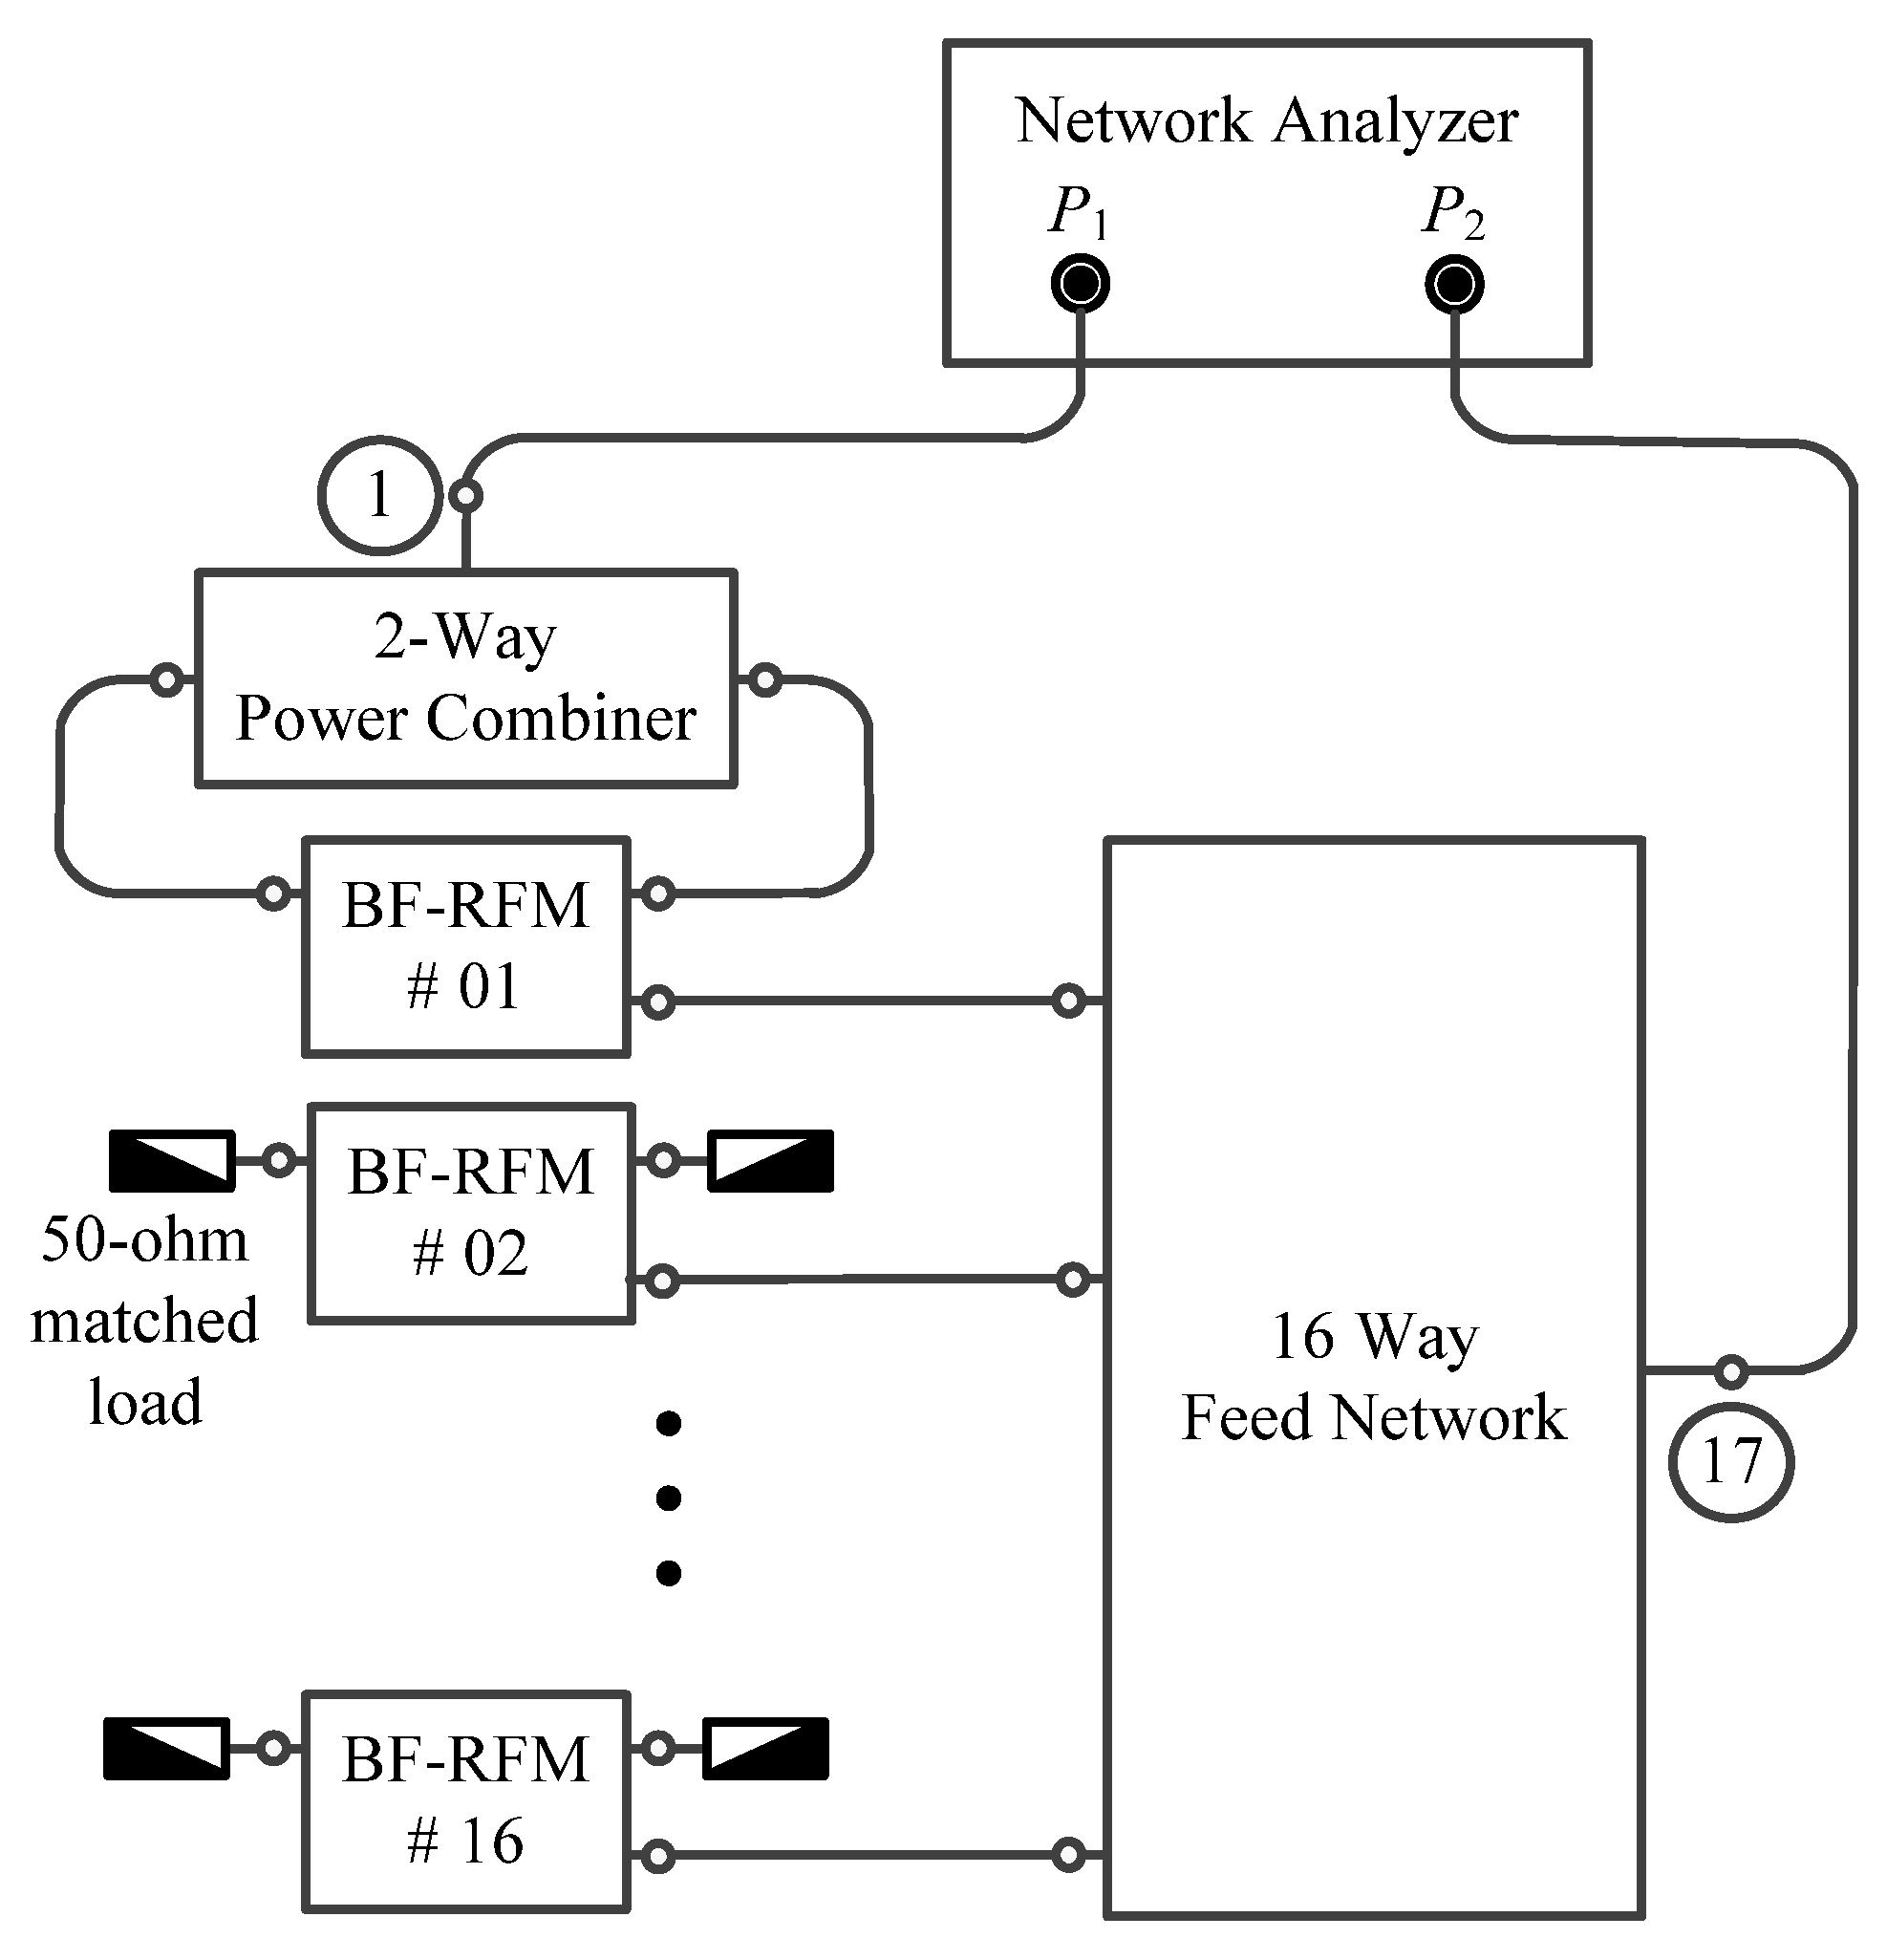
They were measured by including the 16 BF-RFMs, the 16-way feed network, and 16 coaxial cables connecting each module and the feed network. In Figure 9, the circled number indicates the assigned port numbers. Port 1 was assigned as the input port of the 2-way power combiner connected with BF-RFM #01 and port 17 as the output port of the 16-way feed network. To simplify the figure, notations from port 2 to port 16 are not displayed in Figure 9. Other inputs of the 15 BF-RFMs were connected with 50 Ω matched loads when the scattering coefficients were measured between the i-th RAM and port 17. Antenna system gains Gsys(θ0) were estimated at each maximum beam position by employing Equation (1) [27]:
G s y s ( θ 0 ) = i = 1 17 | S 17 , i | 2 ,

3.2. Assembly of the Phased-Array Antenna

Based on the explanations above, 16 subarrays, 16 BF-RFMs, and the power/control board were individually developed. The commercial off-the-shelf 16-way feed network by Fairview Microwaves (MP8211-16) was employed.
Figure 10 shows the front and back side views of the fabricated phased-array antenna. The 16 subarrays were assembled at regular intervals on the slots over a broad metal plate on the front of the proposed phased-array antenna. On the back side of the antenna, 16 BF-RFMs, a central metal supporter, a power/control board, two terminal blocks, an AC-DC converter, and coaxial cables were placed. The power of the antenna was supplied by an external AC 220-V and an AC-DC converter. Each subarray was connected to correspond to the BF-RFMs with 32 coaxial cables with low-loss and equal-phase performances. The 16 outputs of each BF-RFM were directed to the 16-way feed network with the low-loss and in-phase coaxial cables. The antenna radome was realized by the 5 mm thick ABS material. Waterproof structures were employed in fabricating the phased-array antenna.

4. Measurements and Calibration

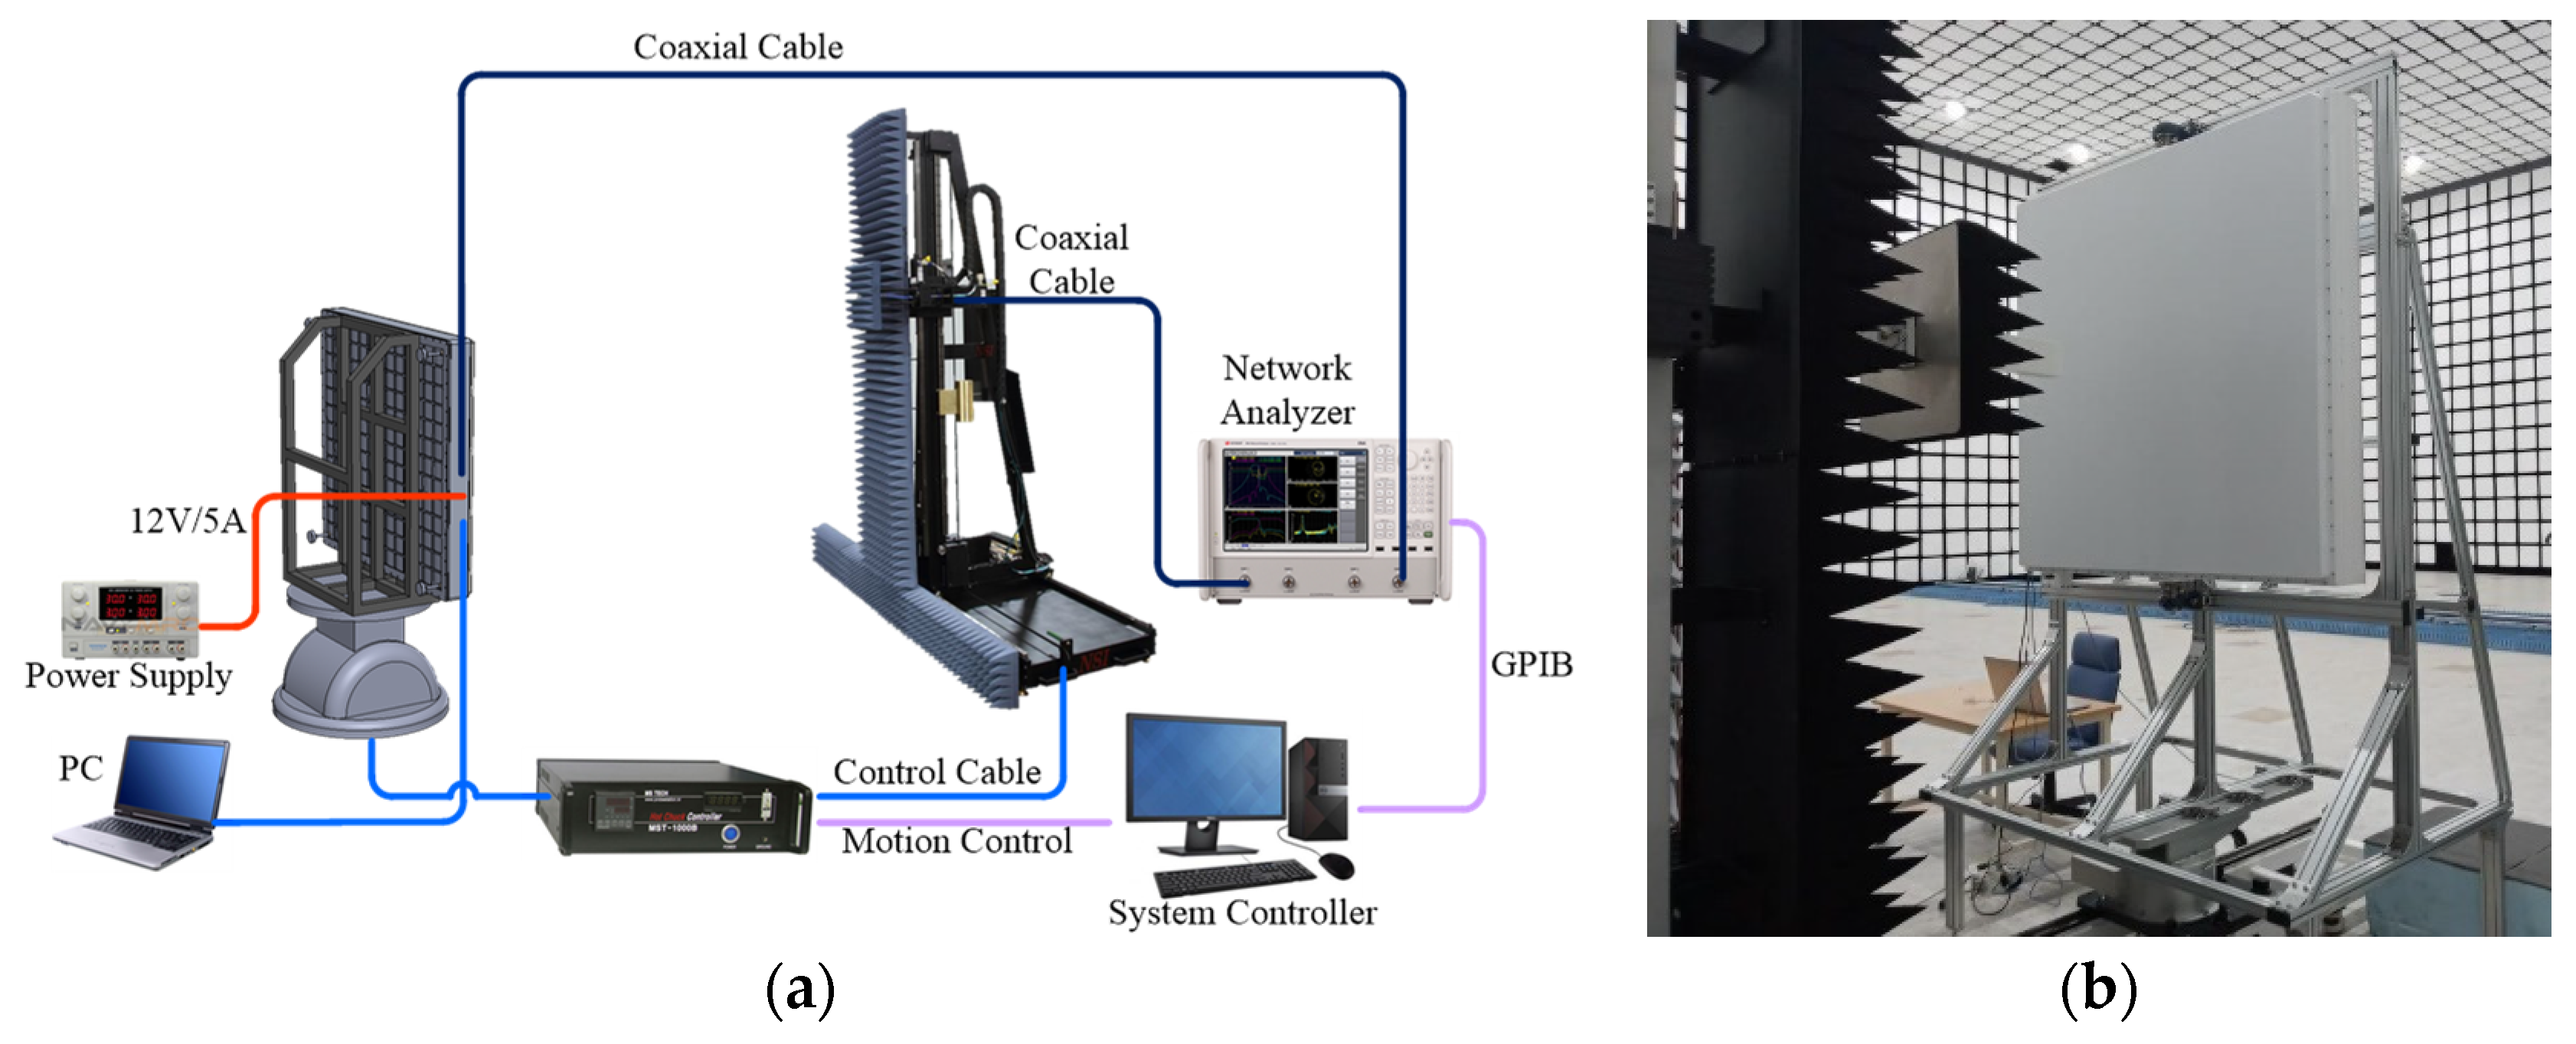
Figure 11a shows the antenna measurement setup with a near-field scanning system, and Figure 11b represents the measuring environments in the anechoic chamber.
The radiation patterns of the fabricated phased-array antenna were measured with the near-field scanning system. The antenna pattern measurements were successively carried out by partial and full scans. The partial scans were performed to verify the main beam positions in the elevation direction via sampling in the restricted range of the horizontal plane (−12 cm ≤ x ≤ 12 cm) and in the full range of the vertical plane (−120 cm ≤ y ≤ 120 cm). This method is very useful for calibrating radiation patterns in a short time so that the control bits are reliably determined at the desired angle, θ0. Finally, the full scans were applied to achieve the measurements of the final radiation pattern at the given beam pointing angle. The sampling ranges of the horizontal and vertical planes were equally extended from −120 cm to 120 cm in the full scans. The distance between the open-ended waveguide probe and the radome surface of the AUT was maintained at 40.0 cm. Its flatness was strictly restricted within 0.2 mm on the antenna radome surface. Before demonstrating the method of pattern calibration, the basic theory applied in this study is introduced. Equation (2) is an antenna pattern formula based on the array theory for discrete elements in an arbitrary direction (θ and ϕ) [28]:
F ( θ , ϕ ) = i = 1 N ( a i + n i )   e j ( δ i + ν i ) e j k r r ,
In Equation (2), the terms ai and δi are the magnitude and phase of the i-th element used to obtain the desired radiation patterns. In contrast, ni and νi are noise sources, which occur in the fabrication and operation of the phased-array antenna. The primary noise sources include mechanical errors in installing radiation elements, internal thermal noise, and cooling effects. In this study, pattern calibrations were carried out by employing the back-projected method to minimize noise sources when operating the phased-array antenna.
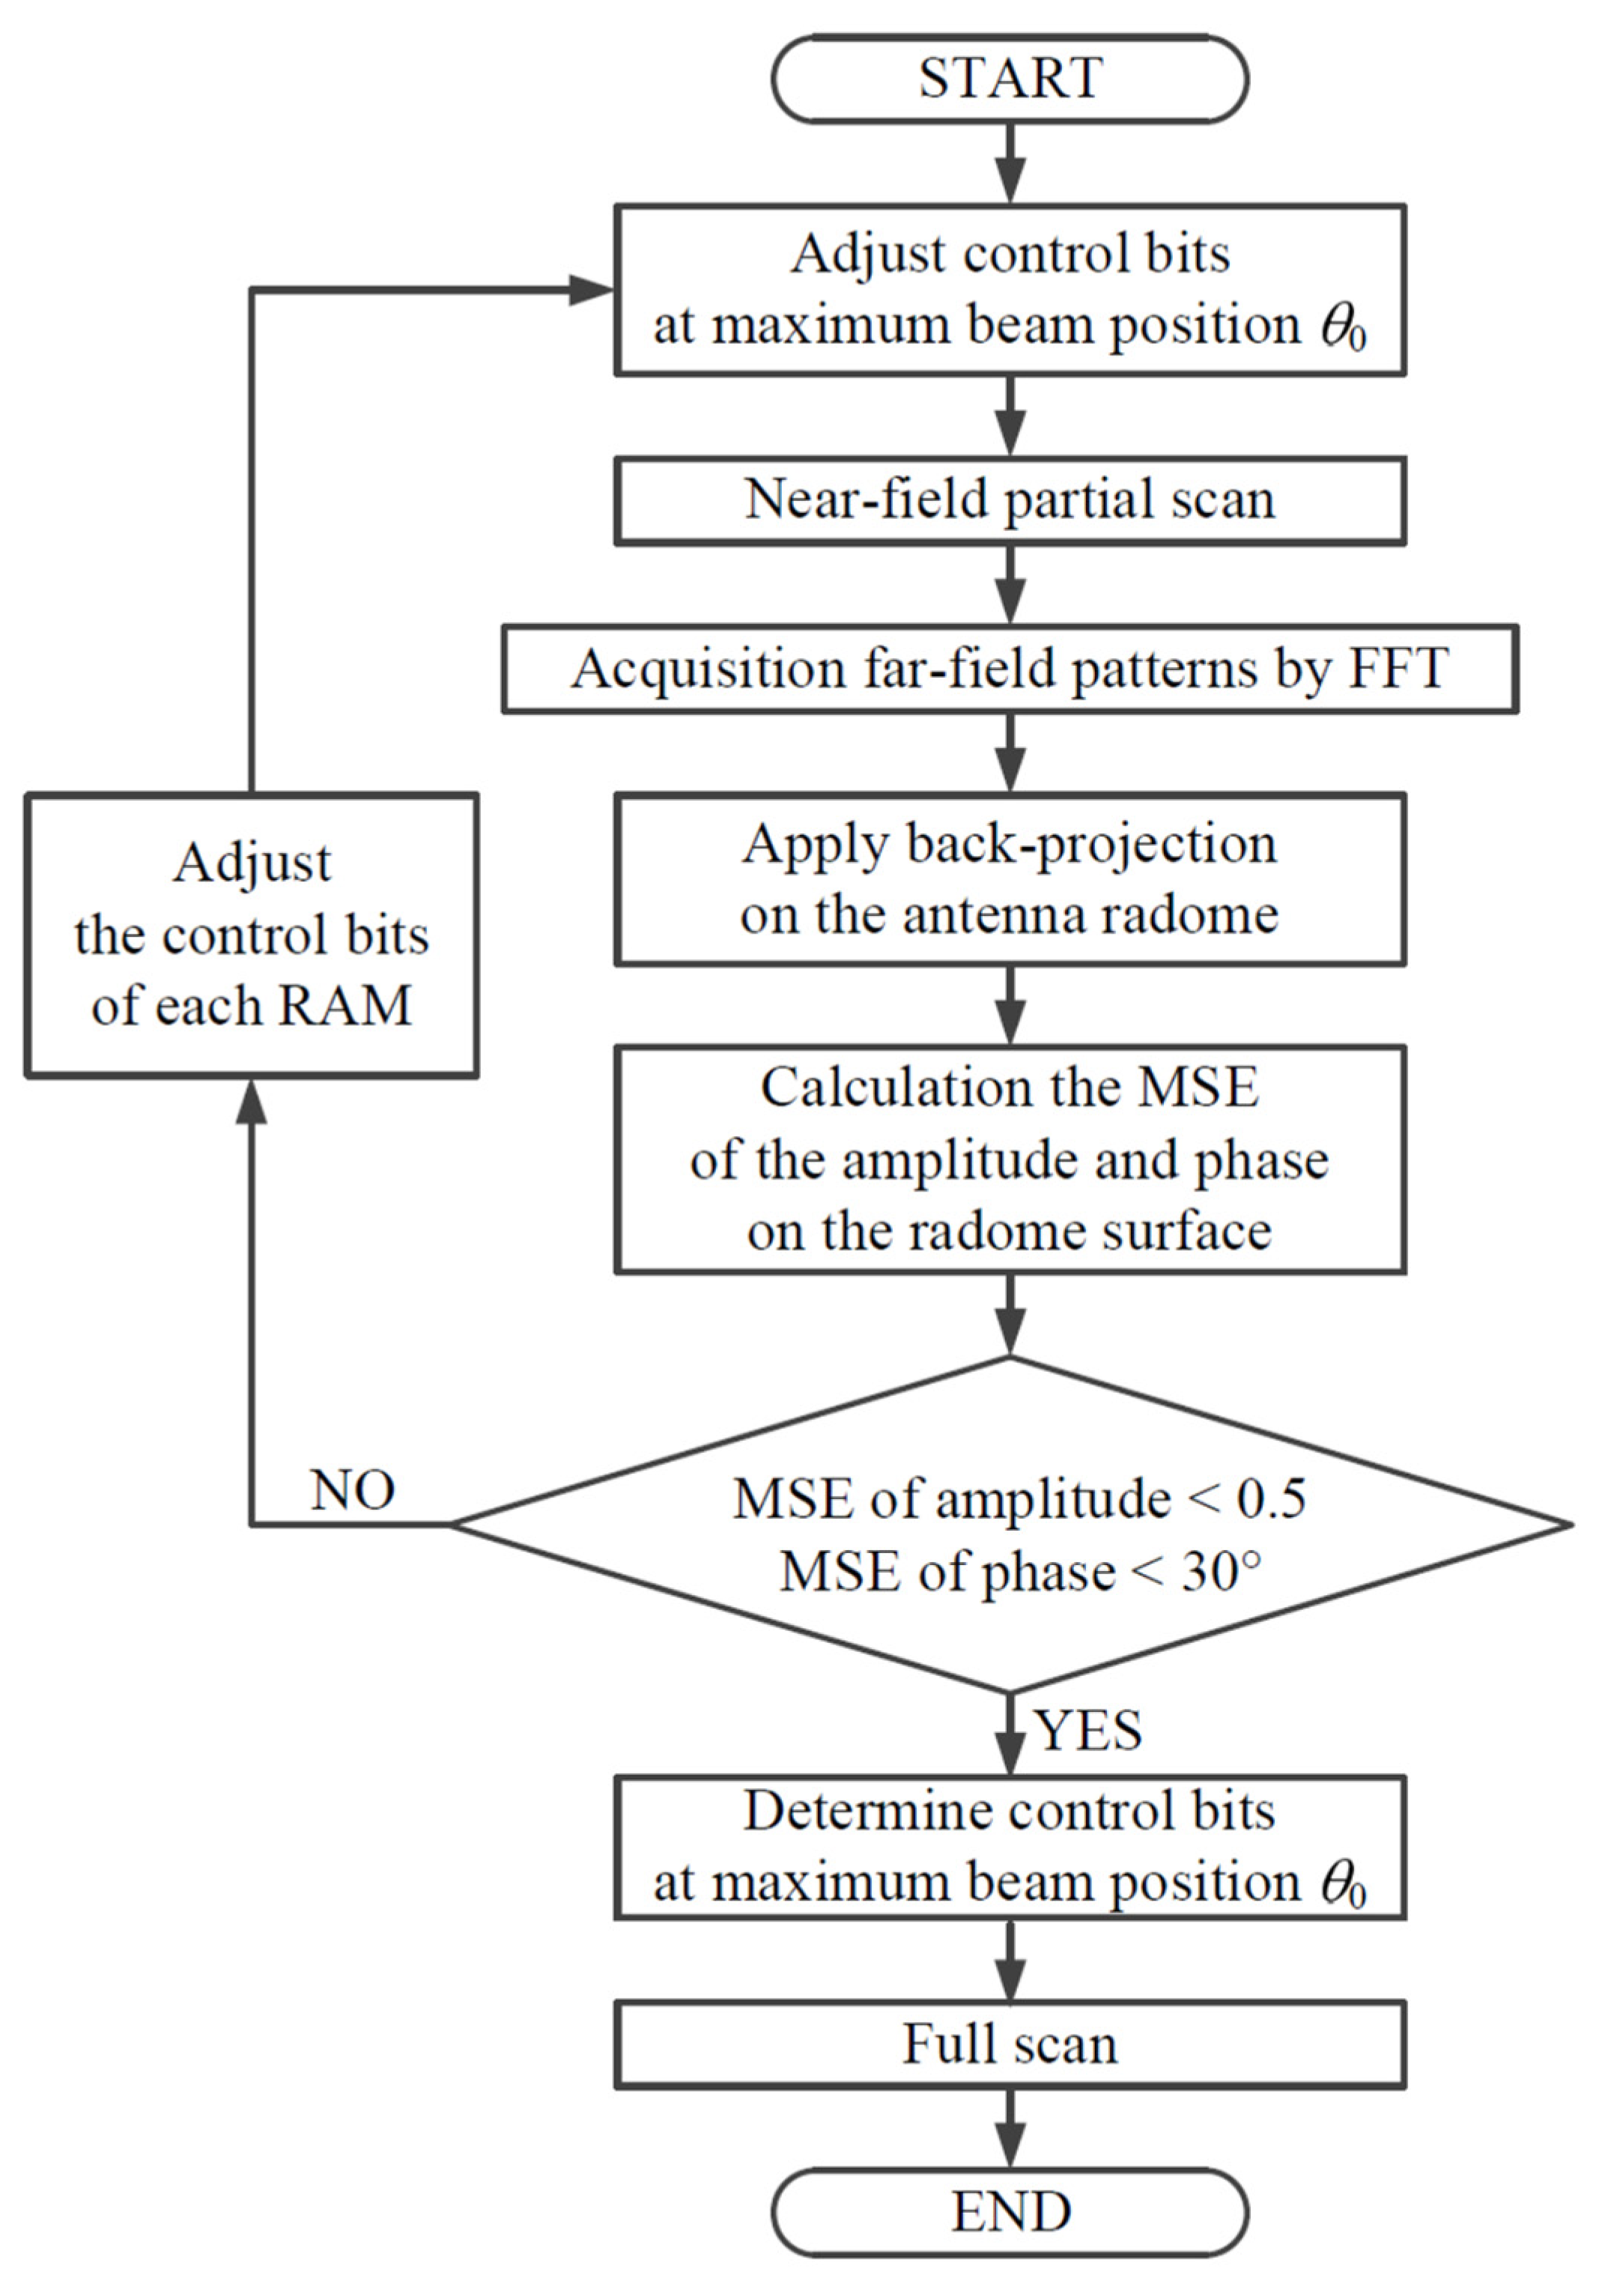
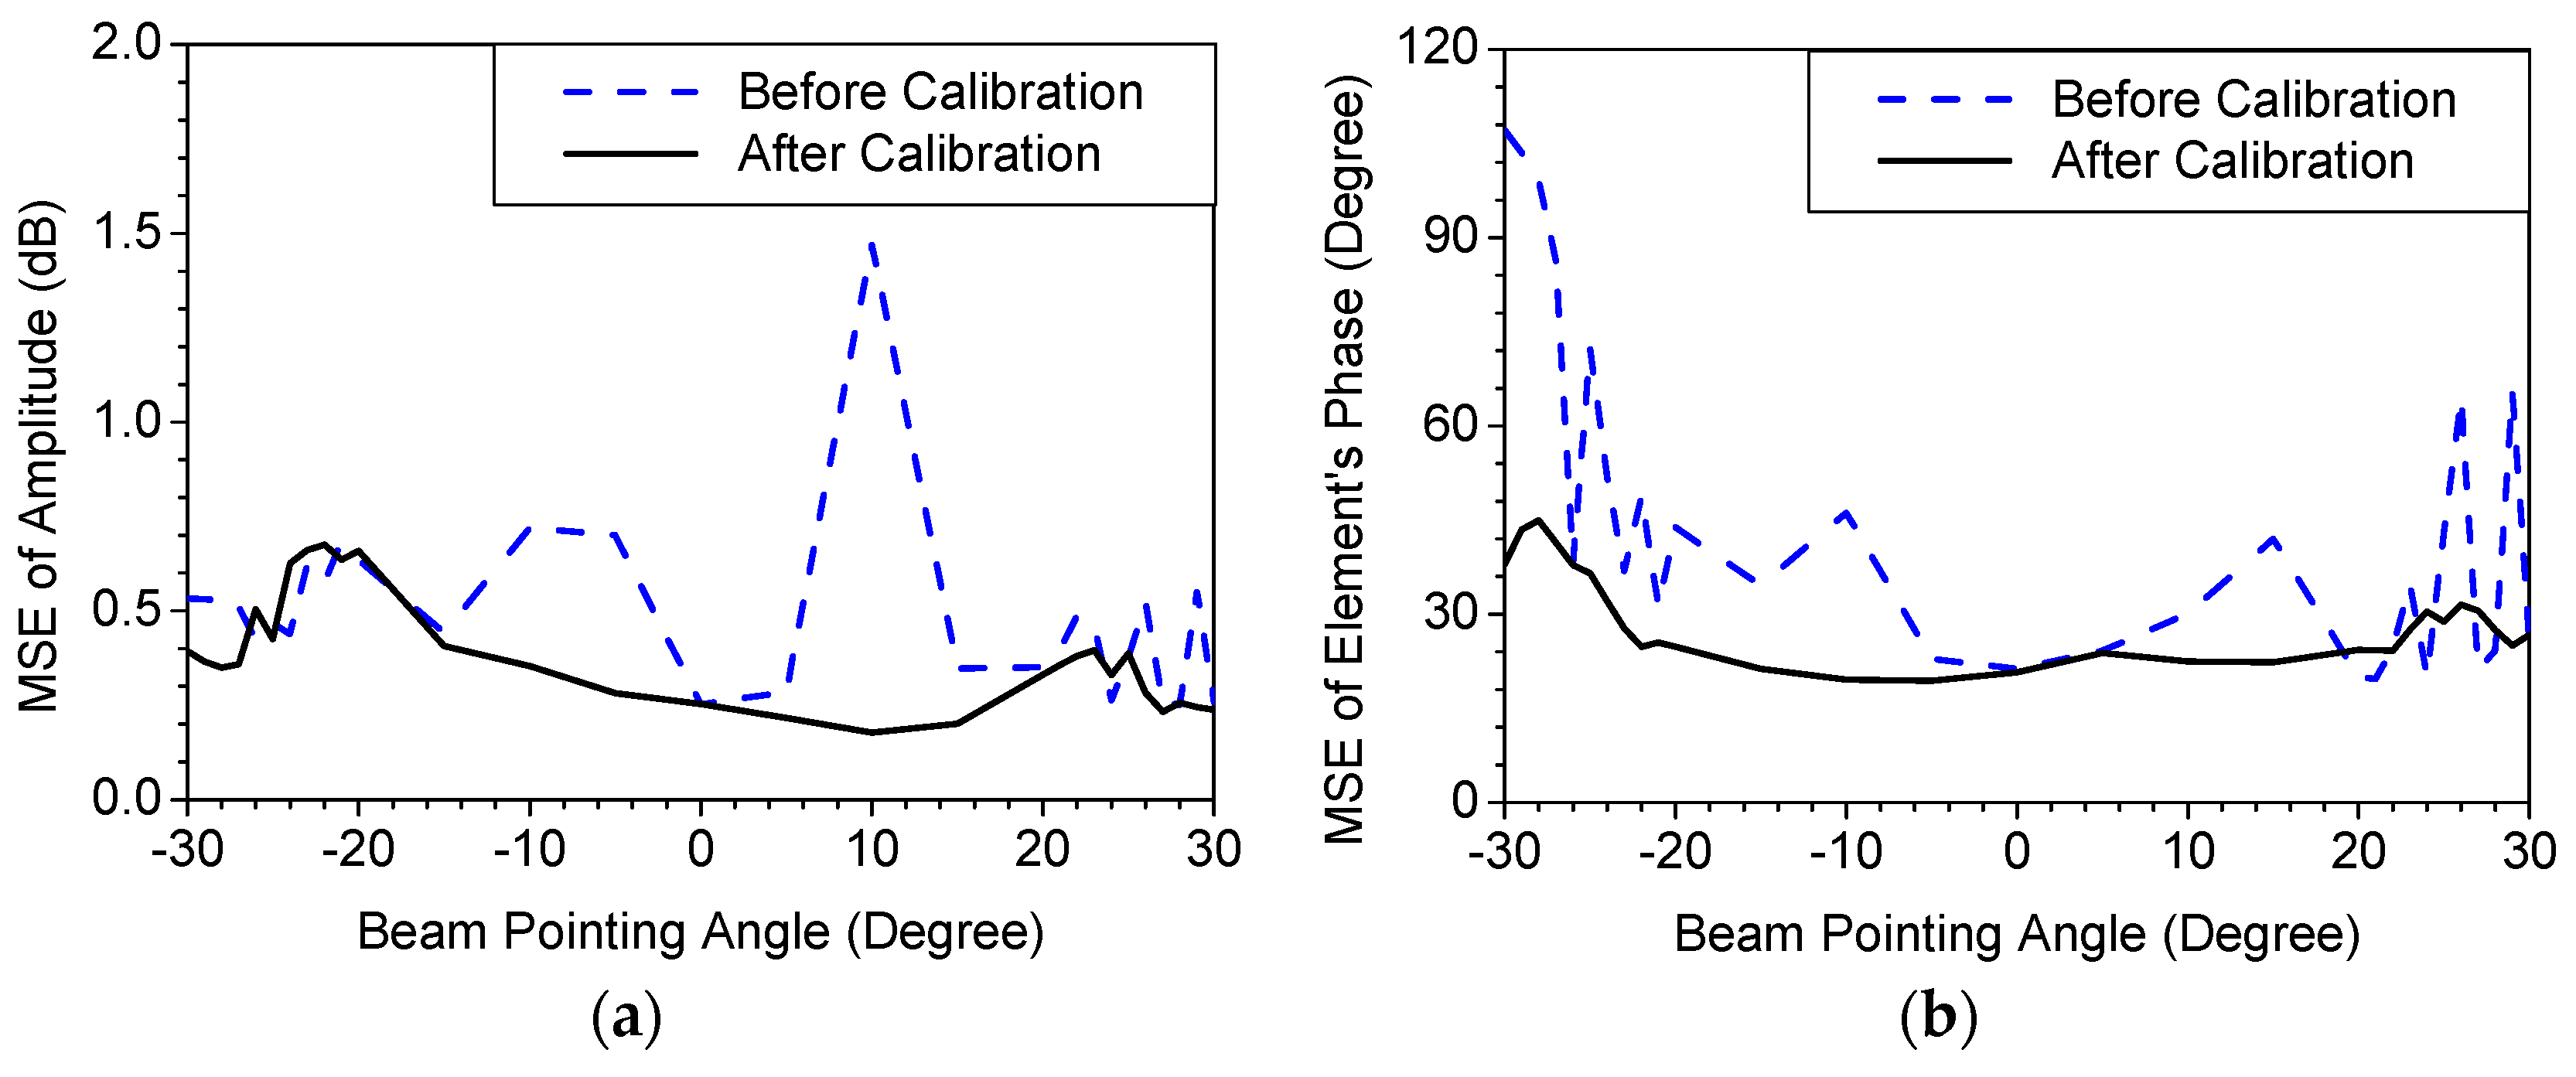
Figure 12 shows the calibration procedures proposed in this study. In the partial scan, the far-field patterns of the antenna were calculated by FFT. With the far-field patterns obtained in the partial scan, the field distribution on the antenna aperture was calculated by employing the back-projected algorithm. Next, aperture distributions on the radome surface could be obtained using the back-projected algorithm. The mean square errors of the amplitudes and phases were calculated with the differences of the desired and calculated back-projected fields in these measuring steps. Finally, the control bits at the maximum beam position, θ0, are slightly adjusted and determined to satisfy specific conditions that referred to the calculated MSE of the amplitude and phase being less than 0.5 and less than 30°, respectively.
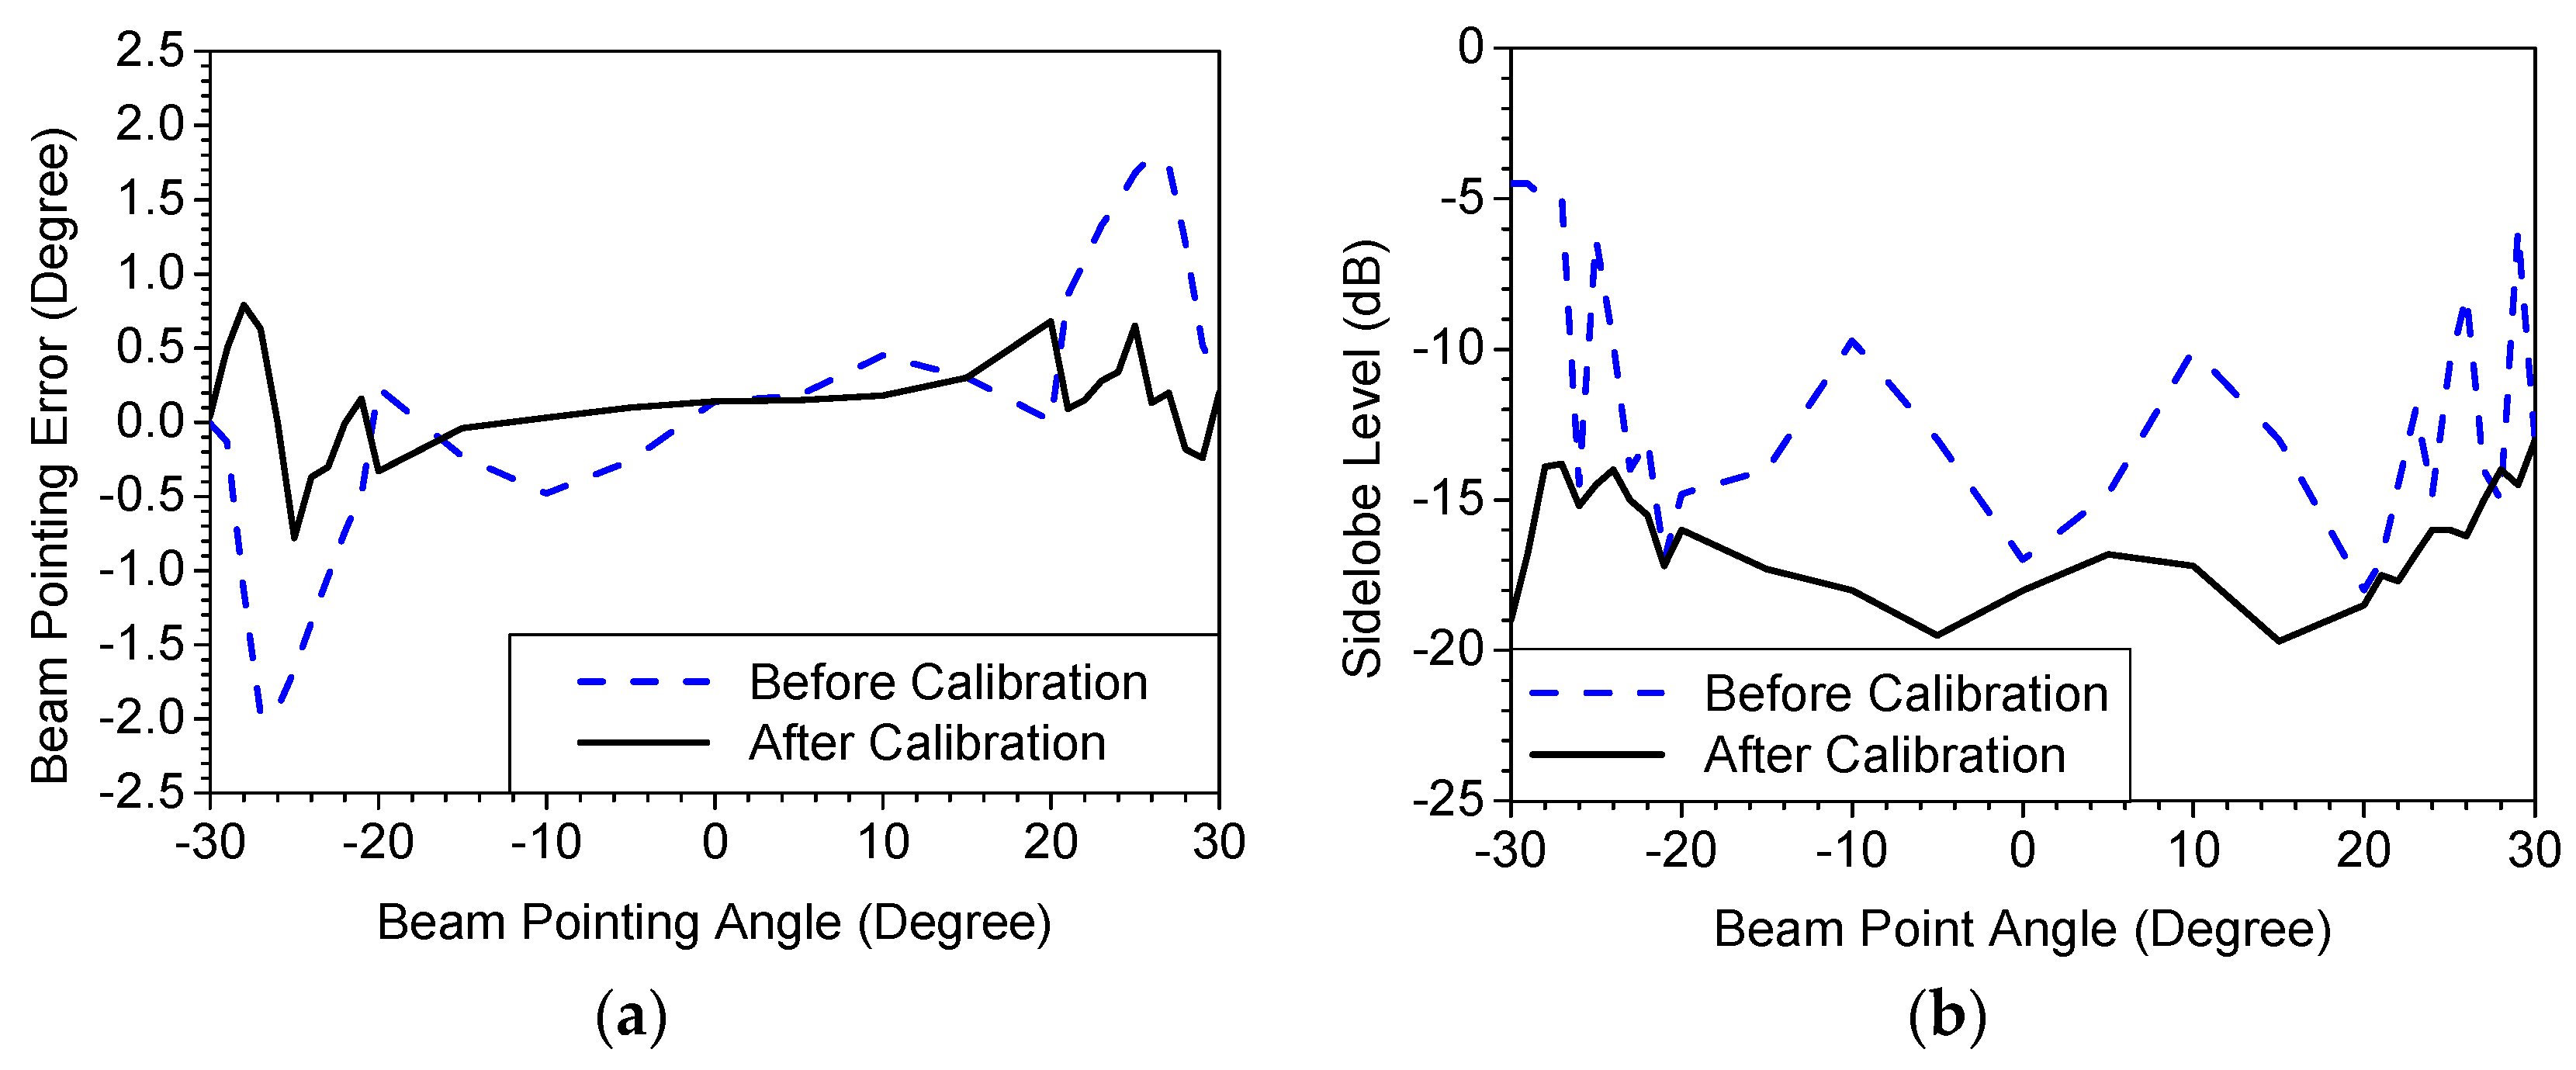
The conditions met the beam pointing errors of less than ±1.0° and the sidelobe level of less than −15 dB.
Figure 13 exhibits the calculated mean square errors from the back-projected fields compared with the values before and after pattern calibrations. Figure 11a shows that the maximum MSE of the amplitude was reduced from 1.47 to 0.63. The phase MSE was similarly dramatically decreased to 36.5° after the pattern calibrations, as shown in Figure 13b, over the beam pointing angle of −25° ≤ θ0 ≤ 25°.
Figure 14 compares the boresight errors and sidelobe levels, depending on whether there were calibrations. The beam pointing errors of −1.7~1.7° before calibration were reduced to −0.8° to 0.7° after that process. The maximum sidelobe levels were also decreased from −6.3 dB to −14 dB by applying pattern calibrations.
The calibration method proposed in this study is compared with other studies in Table 1. Early proposed methods needed a prohibitive amount time to successively adjust individual elements. Moreover, complicated mathematical approaches were required to analyze the measured results. However, our method is very simple and can be performed quickly by employing the back-projected algorithm provided in the near-field measurement system. Therefore, the method proposed in this work is a progressive approach in the pattern calibration of the phased-array antenna system.
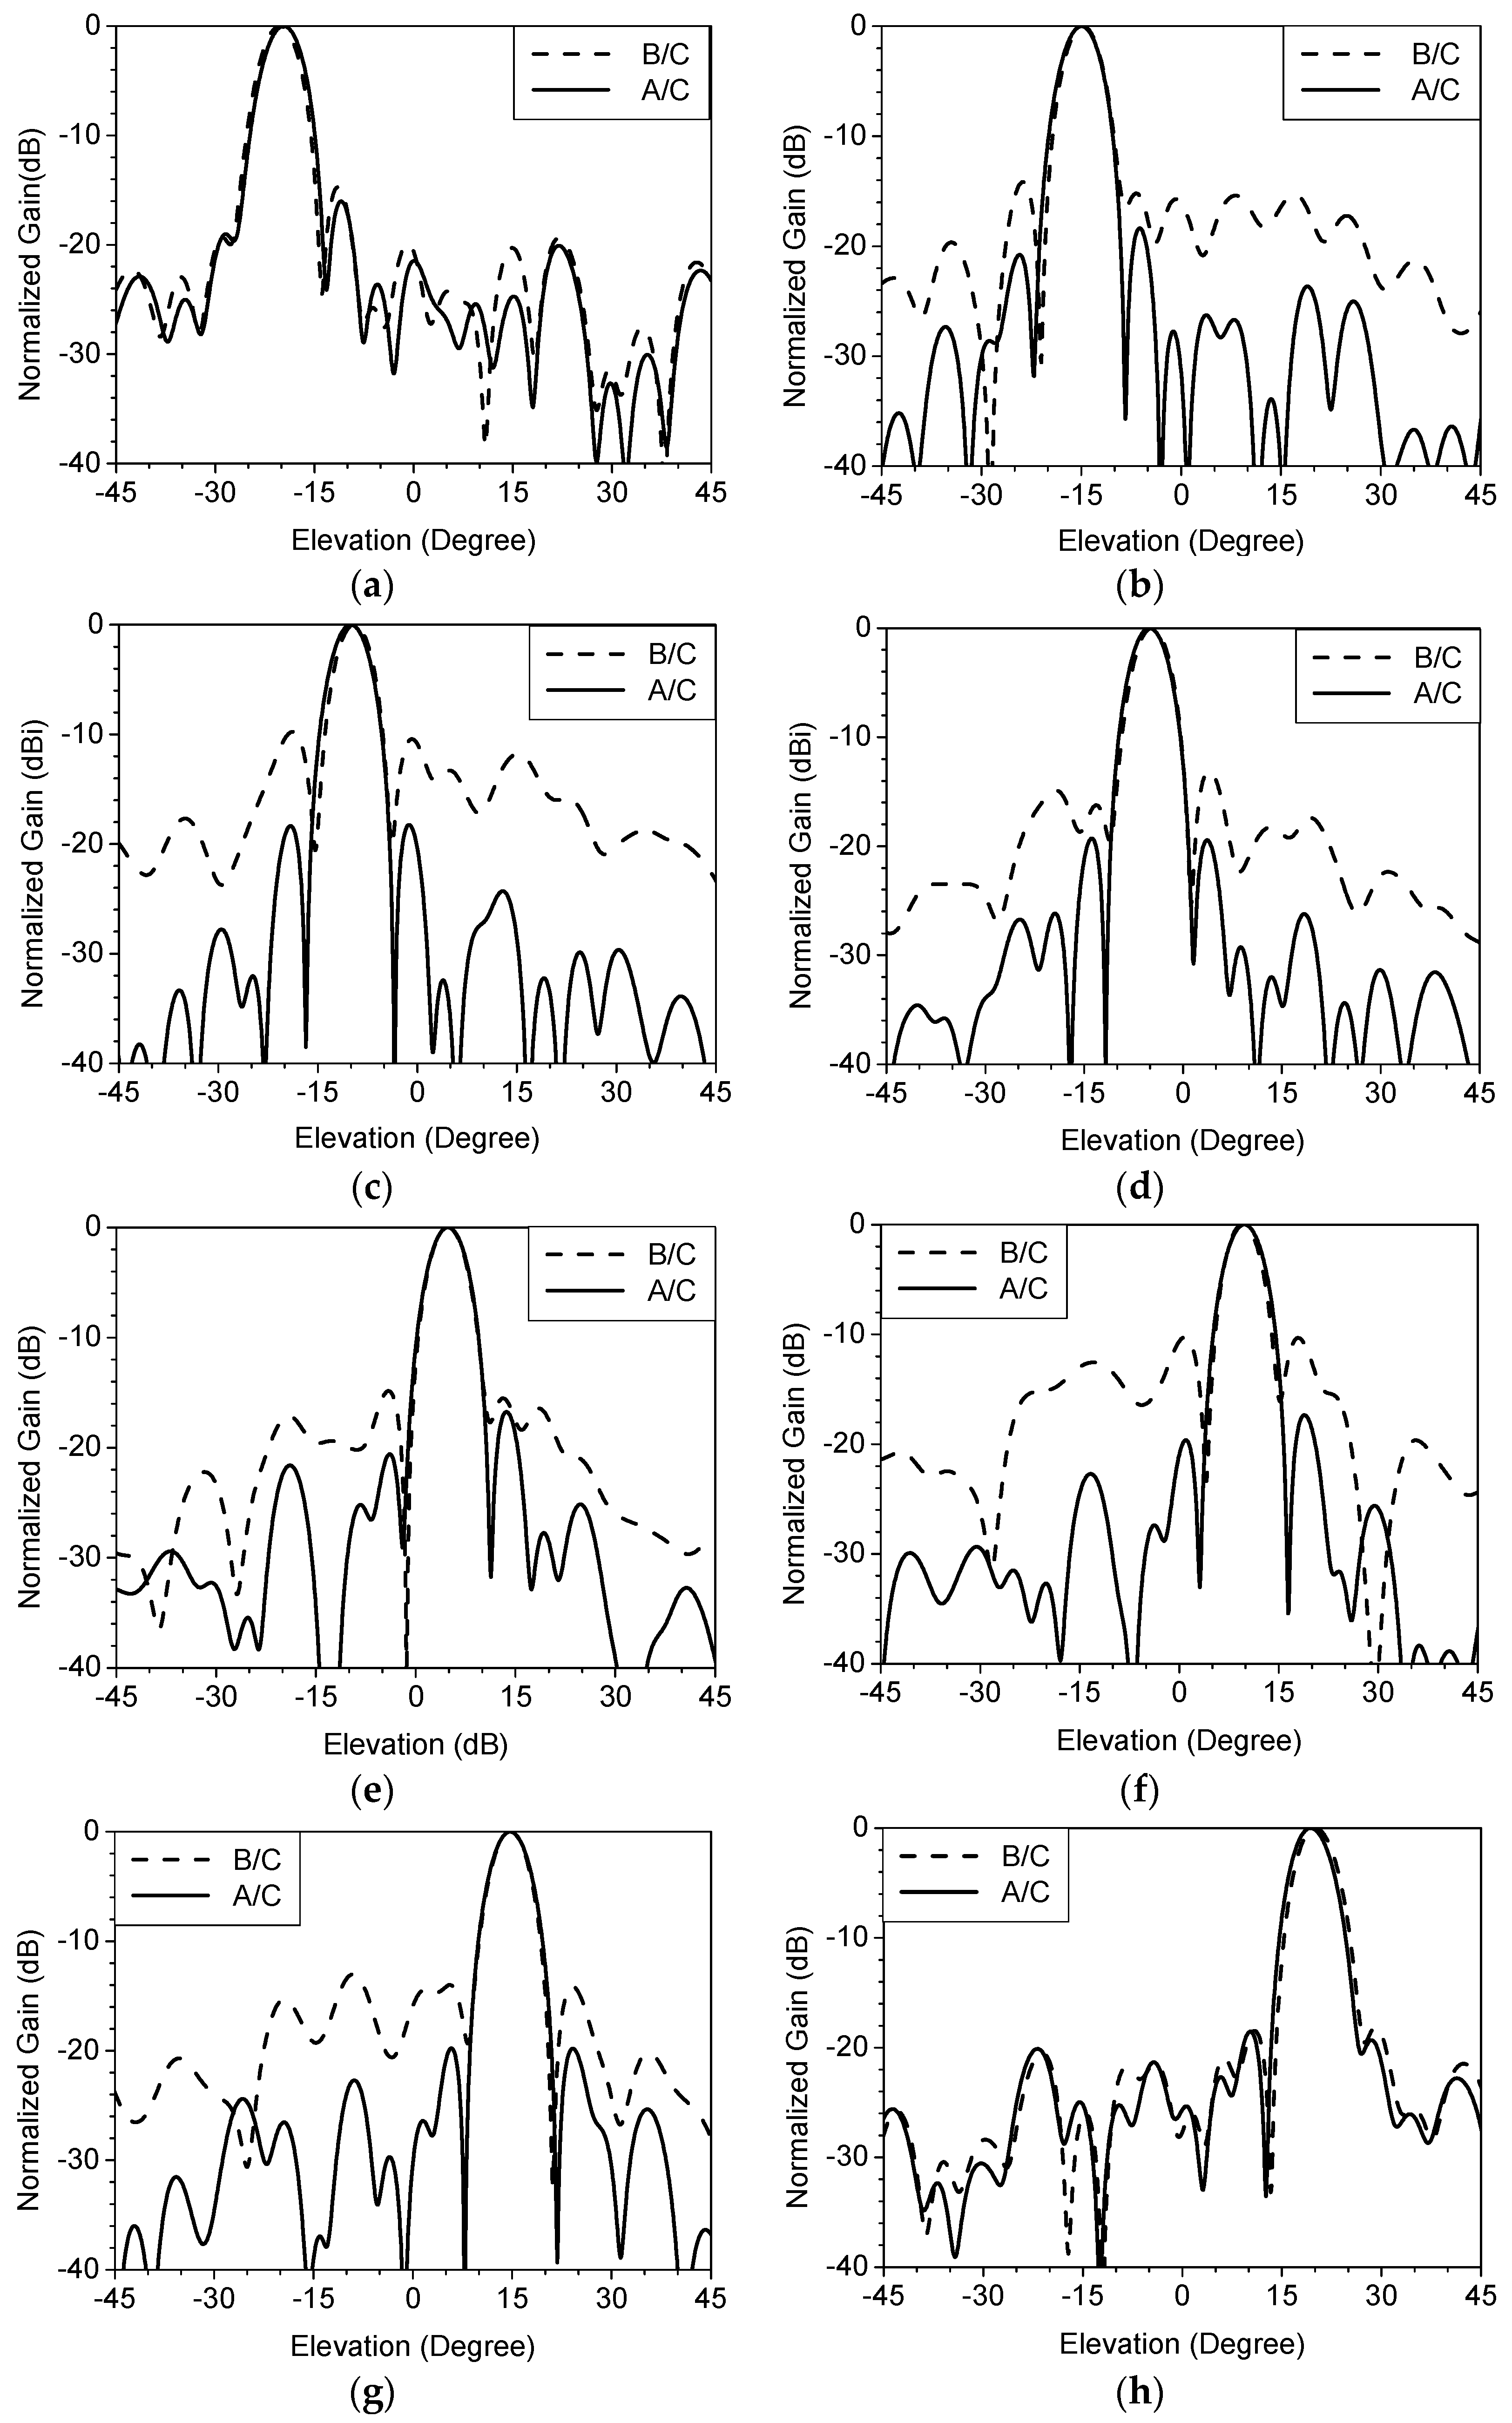
Figure 15 exhibits the measured elevation patterns at the desired beam pointing angles. The compensated patterns showed more precise beam pointing accuracy and lower sidelobe levels. After pattern calibrations, full scans were carried out with the beam point angles with an interval of 10° over the range of −20° ≤ θ0 ≤ 20°. The measured antenna gains were reflected by the premeasured system gains based on Equation (1).
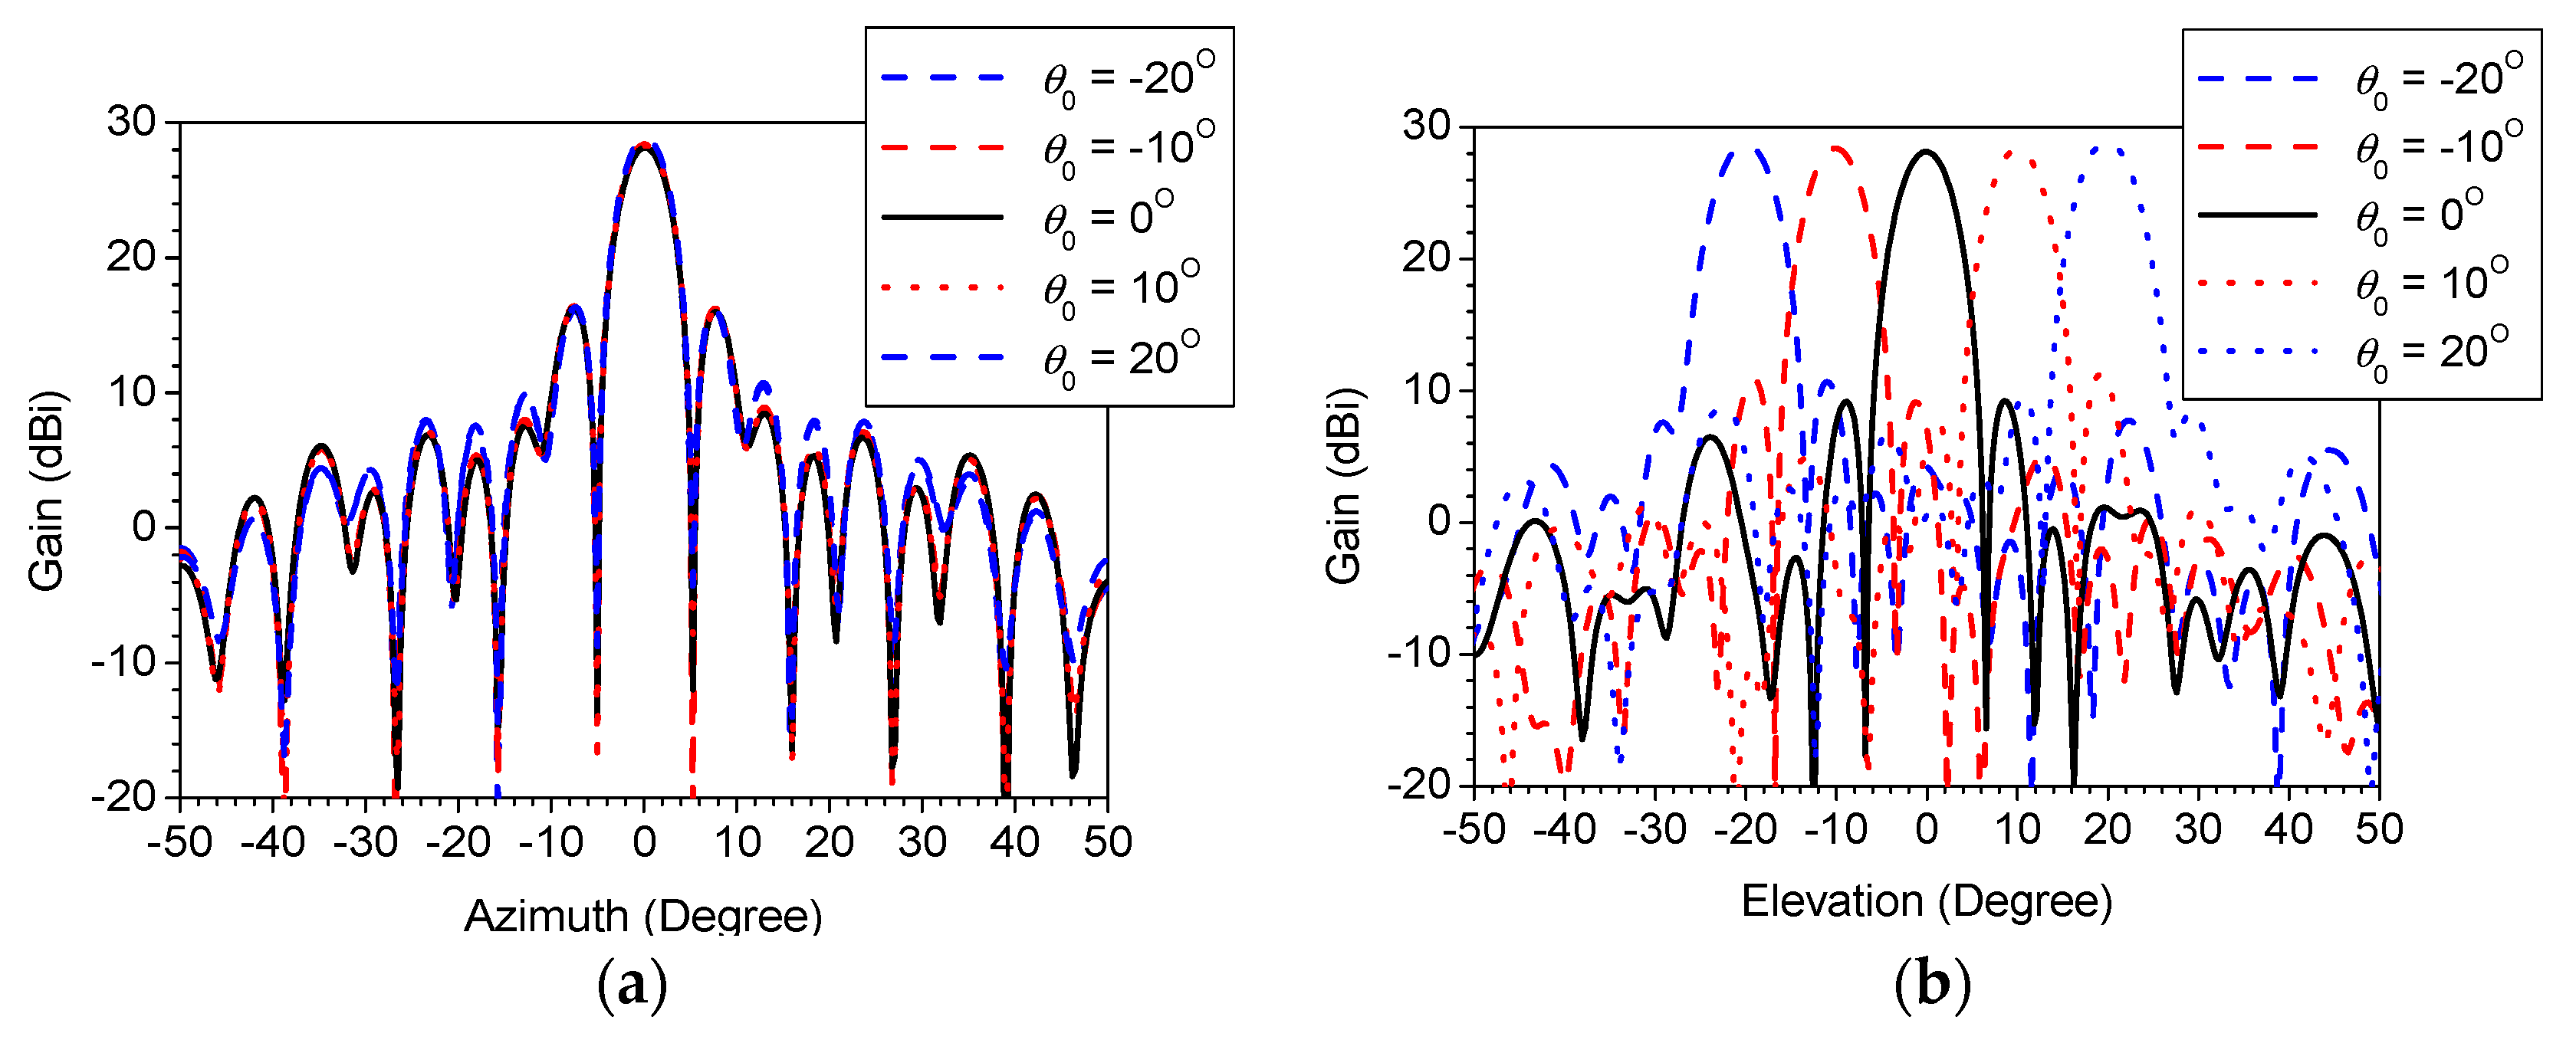
Figure 16 shows the measured final radiation patterns in the azimuth and elevation planes with the full scans. The measurements show that the fabricated phased-array antenna had gains of 28.14–28.89 dBi, sidelobe levels of less than −17.1 dB, and beam pointing errors of less than 0.07°.
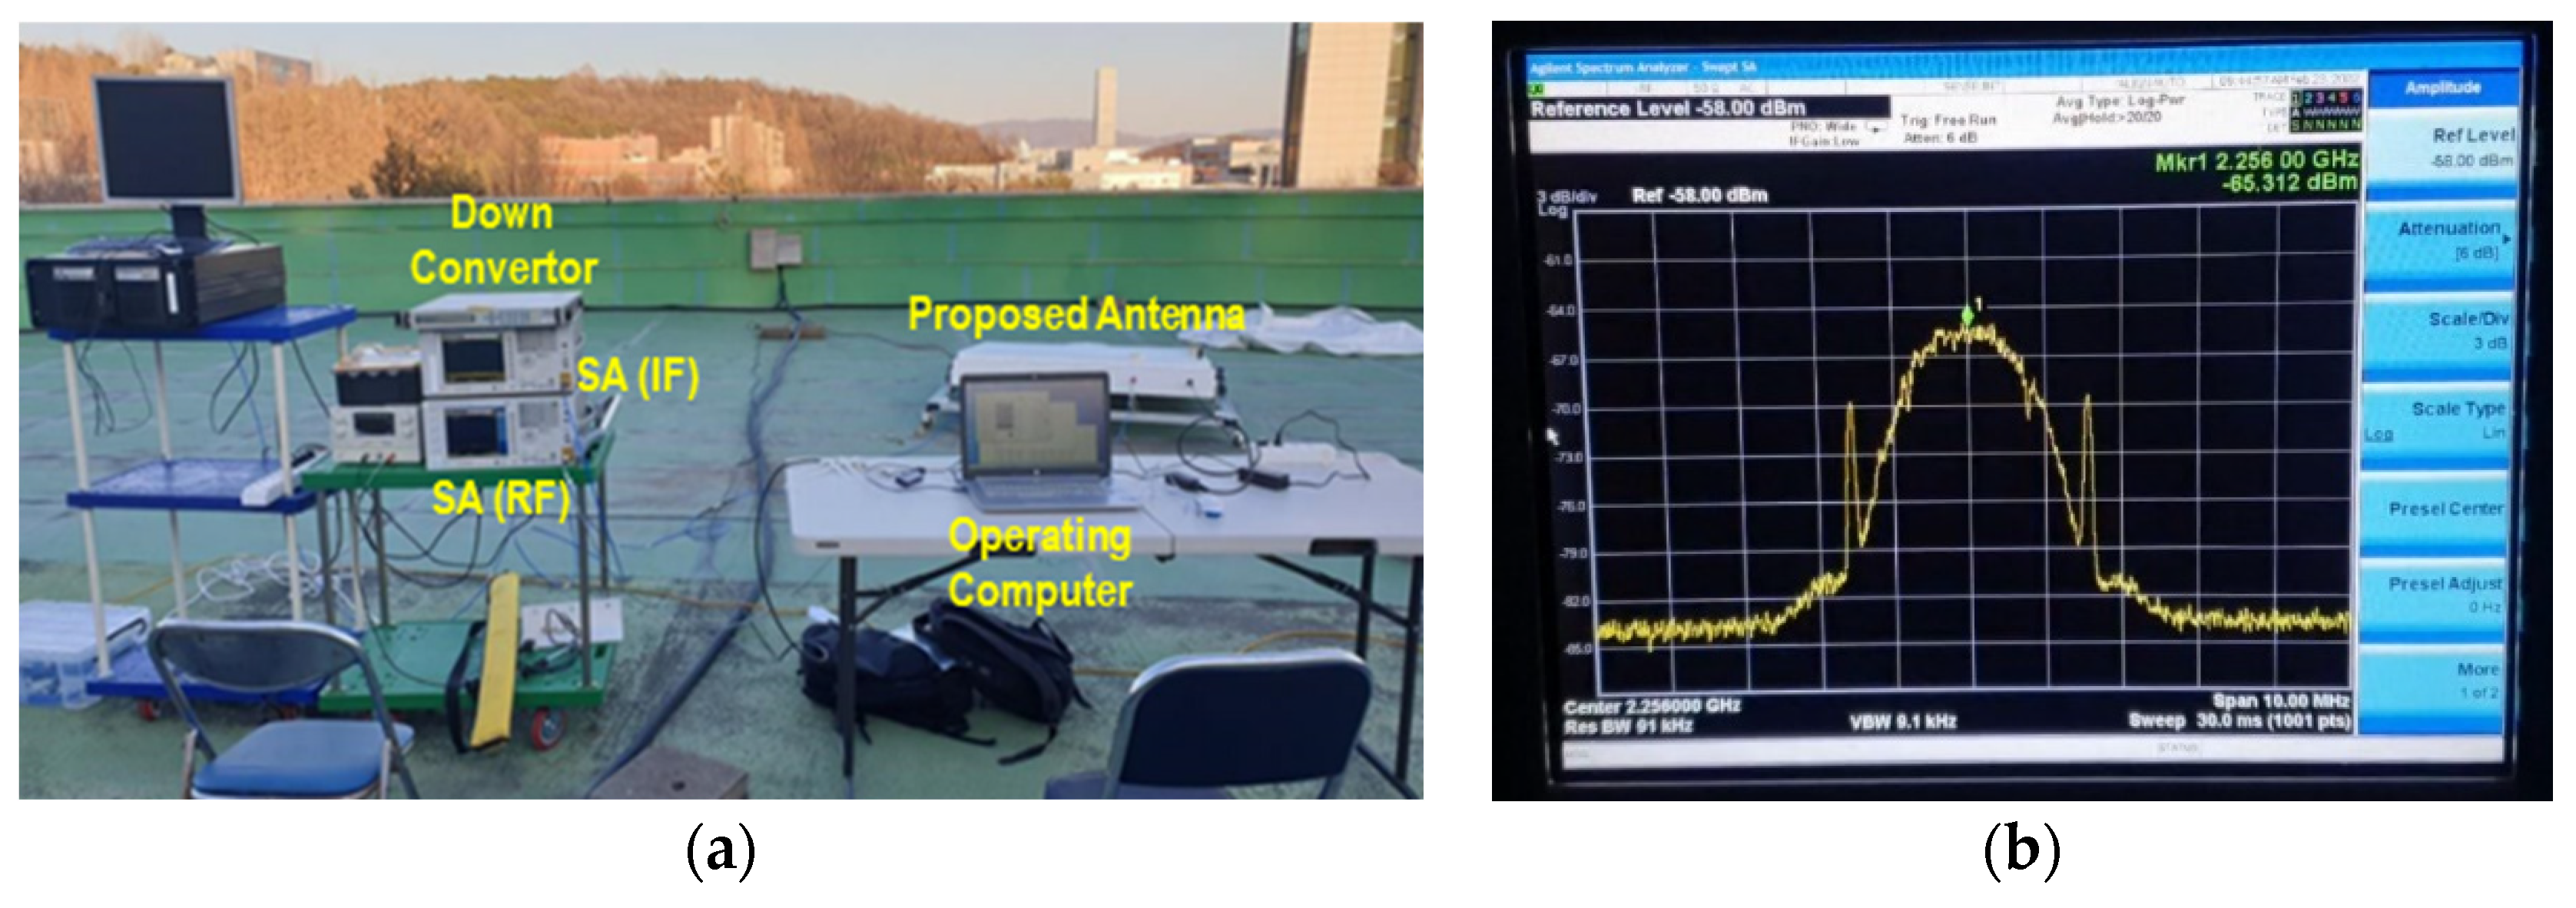
Finally, as shown in Figure 17, the fully integrated and implemented S-band-receiving phased-array antenna was installed at the Korea Aerospace Research Institute (KARI), Daejeon, Republic of Korea, to demonstrate the field test performances of KOMPSAT-5. KOMPSAT-5 is a multipurpose utility satellite currently operated by a low Earth orbit (LEO) satellite of the Rep. of Korea. The filed test was carried out on a clear evening. Based on the actual operation quest of KOMPSAT-5, the actual operation performance of the proposed antenna was evaluated, considering the revisit period of the Rep. of Korea. As shown in Figure 17b, in the fully implemented phased-array antenna system, the maximum received power of the satellite telemetry signal was measured to be −65 dBm, and the SNR was observed to be 19 dB. The received power level was 3.7 dB smaller and the SNR was 2.6 dB smaller than that of the theoretical maximum. This phenomenon was judged to be an error caused by an antenna alignment error, the unmeasured system noise temperature, and the weather condition of test environment, which were not considered.

5. Conclusions

In this study, an S-band-receiving phased-array antenna was theoretically and experimentally presented for each subsystem and the entire antenna system. In the measuring of the subarray, we proposed and adopted the compensation method for degraded gain due to it not satisfying far-field conditions. Finally, the calibration method was proposed, and its validity was verified by reducing sidelobe levels and minimizing beam pointing errors. The phased-array antenna was fully assembled with dimensions of 1.58 m × 1.58 m × 0.2 m. The fully implemented antenna system was measured in the near-field scanning system to verify radiation performances. With the partial scans, the antenna was calibrated with the back-projected algorithm by slightly adjusting the control bits of the BF-RFMs. In addition, based on the low Earth orbit satellite of KOMPSAT-5, operated by South Korea, the proposed phased-array antenna system was successfully demonstrated.

Author Contributions

Conceptualization, D.C. and S.P.; methodology, J.-H.B.; validation, D.-H.L. and J.-H.B.; formal analysis, D.-H.L. and J.-H.B.; investigation, M.-S.L.; data curation, J.-W.S. and B.S.; writing—original draft preparation, D.-H.L. and B.S.; writing—review and editing, J.-H.B.; supervision, D.L.; project administration, S.P.; funding acquisition, D.C. All authors have read and agreed to the published version of the manuscript.

Funding

This research was supported by the research fund of Hanbat National University in 2019.

Data Availability Statement

Not applicable.

Conflicts of Interest

The authors declare no conflict of interest.

References

  1. Haupt, R.L.; Rahmat-Samii, Y. Antenna array developments: A perspective on the past, present and future. IEEE Antennas Propag. Mag. 2015, 57, 86–96. [Google Scholar] [CrossRef]
  2. Hong, W.; Jiang, Z.H.; Yu, C.; Zhou, J.; Chen, P.; Yu, Z.; Zhang, H.; Yang, B.; Pang, X.; Jiang, M.; et al. Mutibeam antenna technologies for 5G wireless communications. IEEE Trans. Antennas Propag. 2017, 65, 6231–6249. [Google Scholar] [CrossRef]
  3. Chen, Z.N.; Qing, X.; Tang, X.; Liu, W.E.I.; Xu, R. Phased array metantennas for satellite communications. IEEE Commun. Mag. 2022, 60, 46–50. [Google Scholar] [CrossRef]
  4. Alolyania, M.Q.; Harb, K.M. Phased array antennas for satellite communications. In Proceedings of the 2021 IEEE 12th Control and System Graduate Research Colloquium (ICSGRC 2021), Shah Alam, Malaysia, 7 August 2021; pp. 150–153. [Google Scholar]
  5. Gopal, M.; Ray, K.P. Design of 16 × 16 phased array antenna for X-band radar. In Proceedings of the 3rd International Conference on Emerging Technology (INCET), Belgaum, India, 22–29 May 2022; pp. 1–6. [Google Scholar]
  6. Prasad, S.; Meenakshi, M.; Adhithiya, N.; Rao, P.H.; Ganti, R.K.; Bhaumik, S. mmWave multibeam phased array antenna for 5G applications. J. Electromagn. Waves Appl. 2021, 35, 1802–1814. [Google Scholar] [CrossRef]
  7. He, G.; Gao, X.; Sun, L.; Zhang, R. A review of multibeam phased array antennas as LEO satellite constellation ground station. IEEE Access 2021, 9, 147142–147154. [Google Scholar] [CrossRef]
  8. Chieh, J.-C.S.; Yeo, E.; Farkouh, R.; Castro, A.; Kerber, M.; Olsen, R.B.; Merulla, E.J.; Sharma, S.K. Development of flat panel active phased array antennas using 5G silicon RFICs at Ku- and Ka-bands. IEEE Access 2020, 8, 192669–192681. [Google Scholar] [CrossRef]
  9. Zaki, S.B.M.; Kaya, N.; Cho, M. Implementation of adaptive antenna array for ground station tracking system. Transcations Jpn. Soc. Aeronaut. Space Sci. Aerosp. Technol. Jpn. 2020, 18, 199–208. [Google Scholar]
  10. McHugh, B. Strengthen SATCOM with SDR-Enhanced Phased Array Antennas. Microwaves&RF, 23 September 2022. Available online: https://www.mwrf.com (accessed on 8 November 2022).
  11. Boulos, F.; Caizzone, S.; Winterstein, A. A subarray-based antenna design for satellite communications ground terminals in Ka-band. In Proceedings of the 26th Ka and Broadband Communications Conference, Arlington, VA, USA, 27–30 September 2021. [Google Scholar]
  12. Drioli, L.S.; Foged, L.J.; Saccardi, F.; Scialacqua, L. Verification of Complex Excitation Coefficients from Measured Space Array Antenna by Equivalent Current Techniques. 2014. Available online: www.mvg-world.com (accessed on 14 September 2022).
  13. Jung, D.; Kim, J. Method to determine the far-field beam pattern of a long array from subarray beam pattern. Sensors 2020, 20, 1236. [Google Scholar] [CrossRef] [PubMed] [Green Version]
  14. Javed, M.Y.; Tervo, N.; Leinonen, M.E.; Pärssinen, A. Sidelobe reduction by subarray stacking for uniformly exited mmW phased arrays. In Proceedings of the IEEE 30th Annual International Symposium on Personal, Indoor and Mobile Radio Communications (PIMRC), Istanbul, Turkey, 8–11 September 2019. [Google Scholar]
  15. Bräutigam, B.; Schwerdt, M.; Bachmann, M. An efficient method for performance monitoring of active phase array antenna. IEEE Trans. Geosci. Remote Sens. 2009, 47, 1236. [Google Scholar] [CrossRef] [Green Version]
  16. Nauyen, V.-V.; Nam, H.; Choe, Y.J.; Lee, B.-H.; Park, J.-D. An X-band bi-directional transmit/receive module for a phased array system in 65-nm CMOS. Sensors 2018, 18, 2569. [Google Scholar] [CrossRef] [PubMed] [Green Version]
  17. Kopecký, P.; Závidný, V. Measurement of far-field patterns of phased array antenna. In Proceedings of the 2015 Conference on Microwave Techniques, Pardubice, Czech Republic, 22–23 April 2015. [Google Scholar]
  18. Hassett, K. Phased array antenna calibration measurement techniques and methods. In Proceedings of the European Conference on Antennas Propagation (EuCAP), Davos, Switzerland, 10–15 April 2016. [Google Scholar]
  19. Haryu, K.; Chiba, I.; Mano, S.; Katagi, T. Near field measurement method of a phased array antenna measurement of element amplitude and phase for array. IEICE Trans. Commun. Jpn. Ed. 1196, 79, 97–105. [Google Scholar] [CrossRef]
  20. Burla, M.; Roeloffzen, C.G.H.; Zhung, L.; Marpaung, D.; Khan, M.R.; Maat, P.; Dijkstra, K.; Leinse, A.; Hoekman, M.; Heideman, R. System integration and radiation measurements of a phased array antenna employing an integrated photonic beamformer for radio astronomy applications. Appl. Opt. 2012, 51, 789–802. [Google Scholar] [CrossRef] [PubMed]
  21. Adithya, A.H.; Huang, Y.; Weber, R.J. Experimental evaluation of a beamforming array calibration system. In Proceedings of the 2014 IEEE Aerospace Conference, Big Sky, MT, USA, 1–8 March 2014. [Google Scholar]
  22. Mano, S.; Katagi, T. A method for measuring amplitude and phase of each radiating element of a phased array antenna. Trans. IECE 1982, 65, 58–64. [Google Scholar] [CrossRef]
  23. Takahashi, T.; Miyashita, H.; Konishi, Y.; Makino, S. Theoretical study on measurement accuracy of rotating element electric field vector (REV) method. Electron. Commun. Jpn. 2006, 90, 22–33. [Google Scholar] [CrossRef]
  24. Takahashi, T.; Konishi, Y.; Makinom, S.; Ohmine, H.; Nakaguro, H. Fast measurement technique for phased array calibration. IEEE Trans. Antennas Propag. 2008, 56, 1888–1899. [Google Scholar] [CrossRef]
  25. Yonezawa, R.; Konishi, Y.; Chiba, I.; Katagi, T. Beam-shape correction in deployable phased arrays. IEEE Trans. Antennas Propag. 1999, 47, 482–486. [Google Scholar] [CrossRef]
  26. Hu, C.N. A novel method for calibrating deployed active antenna arrays. IEEE Trans. Antennas and Propag. 2015, 63, 1650–1657. [Google Scholar] [CrossRef]
  27. Pozar, D.M. Microwave Engineering, 4th ed.; John Wiley & Sons: New York, NY, USA, 2012; Chapter 4. [Google Scholar]
  28. Stutzman, W.L.; Thiele, G.A. Antenna Theory and Design, 3rd ed.; John Wiley & Sons: New York, NY, USA, 2013; Chapter 8. [Google Scholar]
Figure 1. Configuration of the proposed S-band-receiving phased-array antenna.
Electronics 11 03847 g001
Figure 2. Dimensions of the optimally designed single element.
Electronics 11 03847 g002
Figure 3. Geometry of the substrate printed by the 8 × 1 subarray: (a) top view and (b) bottom view.
Electronics 11 03847 g003
Figure 4. Measurement of the fabricated 16 × 1 antenna subarray: (a) measurement environment and (b) far-field radiation pattern in both the E- and H-planes.
Electronics 11 03847 g004
Figure 5. Reflection coefficients of the 16 by 1 antenna subarray.
Electronics 11 03847 g005
Figure 6. (a) Block diagram of the beamforming Rx RF module (BF-RFMs) and (b) implementation.
Electronics 11 03847 g006
Figure 7. Performances of the beamforming Rx RF module with the 16 control states: (a) transmission coefficients; (b) transmission phases versus bit states with the 22.5° intervals.
Electronics 11 03847 g007
Figure 8. RMS measurement errors in the 256 control states of the phase shifter.
Electronics 11 03847 g008
Figure 9. Measurement setup with the assigned ports 1~17 for the antenna system gains.
Electronics 11 03847 g009
Figure 10. Photos of the implemented phased-array antenna system: (a) front view before covering the radome and (b) back side view.
Electronics 11 03847 g010
Figure 11. The near-field measurement system and the mounted antenna: (a) measurement setup and (b) its environments.
Electronics 11 03847 g011
Figure 12. Flow chart for the pattern calibrations.
Electronics 11 03847 g012
Figure 13. Mean square errors calculated from the back-projected fields on the antenna radome surface: (a) amplitude and (b) phase response.
Electronics 11 03847 g013
Figure 14. Antenna performances with and without pattern calibrations: (a) beam pointing error and (b) sidelobe level.
Electronics 11 03847 g014
Figure 15. Radiation patterns of the implemented phased-array antenna with/without calibration (B/C: before calibration, A/C: after calibration) at (a) θ0 = −20°, (b) θ0 = −15°, (c) θ0 = −10°, (d) θ0 = −5°, (e) θ0 = 5°, (f) θ0 = 10°, (g) θ0 = 15°, and (h) θ0 = 20°.
Electronics 11 03847 g015
Figure 16. Antenna radiation patterns by the full scan method: (a) azimuth plane and (b) elevation plane.
Electronics 11 03847 g016
Figure 17. (a) Field test environment of the implemented phased-array antenna and (b) spectrum analyzer results of the implemented phased-array antenna from KOMPSAT-5.
Electronics 11 03847 g017
Table 1. Comparisons of calibration methods.
ReferenceCalibration MethodMeasurement EquipmentMeasuring TimeArray Size in Measurement
Harya [19]REV methodNear-fieldLong29 Elements
Adithya [21]Adjusting weighting function at individual
beamformers
Far-fieldLong8 Elements
Yonezawa [25]REV method + adjusting the observation positionNear-fieldLong8 Elements
Hu [26]Self-calibration system with the phase-match methodFar-fieldMedium8 Elements
This workAnalysis of the back-projected field with the
partial scan
Near-fieldShort16 Elements
Publisher’s Note: MDPI stays neutral with regard to jurisdictional claims in published maps and institutional affiliations.