Article

Advanced Data Systems for Energy Consumption Optimization and Air Quality Control in Smart Public Buildings Using a Versatile Open Source Approach

by
Giuseppe Starace
1,*,
Amber Tiwari
1,
Gianpiero Colangelo
2 and
Alessandro Massaro
1,3
1
Department of Engineering for Innovation, Università LUM “Giuseppe Degennaro”, S.S. 100 km 18, Casamassima, 70010 Bari, Italy
2
Dipartimento di Ingegneria dell’Innovazione, Università del Salento, via per Monteroni, 73100 Lecce, Italy
3
LUM Enterprise S.r.l., S.S. 100 km 18, Casamassima, 70010 Bari, Italy
*
Author to whom correspondence should be addressed.
Electronics 2022, 11(23), 3904; https://doi.org/10.3390/electronics11233904
Submission received: 14 October 2022 / Revised: 10 November 2022 / Accepted: 23 November 2022 / Published: 25 November 2022

Abstract

:
This work discusses smart building applications involving the Internet of Things (IoT) which are focused on energy consumption monitoring and forecasting systems, as well as indoor air quality (IAQ) control. Low-cost hardware integrating sensors and open source platforms are implemented for cloud data transmission, data storage and data processing. Advanced data analytics is performed by the seasonal autoregressive integrated moving average (SARIMA) method and a long short-term memory (LSTM) neural network with an accurate calculation performance about energy predictions. The proposed results are developed within the framework of the R&D project Data System Platform for Smart Communities (D-SySCOM), which is oriented to a smart public building application. The main goal of the work was to define a guideline-matching energy efficiency with wellness in public indoor environments, by providing modular low-cost solutions which are easily implementable for advanced data processing. The implemented technologies are suitable to define an efficient organizational user protocol based on energy efficiency and worker wellness. The estimated performance of mean square error (MSE) of 0.01 of the adopted algorithms proves the efficiency of the implemented building monitoring system in terms of energy consumption forecasting. In addition, the possibility of designing and implementing a modular low-cost hardware–software system was demonstrated utilizing open source tools in a way that was oriented to smart buildings approaches.

1. Introduction

In energy systems, taking decisions on the basis of data collected by a powerful energy monitoring is the only way to minimize consumption and to try to avoid high simultaneous loads. The energy data processing is a key element for the estimation of Key Performance Indicator (KPI) in smart buildings [1]. Energy monitoring, and the related efficiency management can severely reduce costs (such as electrical utility costs), thus increasing the lifetime of energy storage systems [2]. The first step in managing electric load consumption is to know the electricity consumption profile versus time. Electrical power consumption generally varies due to both user behaviors [3] and ambient conditions [4], which leads to the demand of continuous control. According to data analytics, data mining techniques are used for energy data classification, clustering and prediction [5]. Cloud systems [6] are good candidates to process data detected by Internet of Things (IoT) sensors.
The energy consumption data can be collected and processed by the data center facilities through a wireless communication network using the message queuing telemetry transport (MQTT) protocol [7] (a lightweight protocol specifically designed for machine-to-machine—M2M—communication). In recent years, electrical load forecasting is getting more and more important due to electricity market deregulation and to the integration of renewable energy production, operated in large plants as well as small ones on buildings [8]. To overcome the incoming challenges and ensure accurate power prediction, predictive algorithms can be adopted such as seasonal ARIMA (SARIMA) [9], and long short-term memory (LSTM) [10]. Specifically, SARIMA model is very similar to the autoregressive integrated moving average (ARIMA) model [11], except for an additional set of autoregressive and moving average components; LSTM is a kind of recurrent neural network (RNN) [12]. Both are used in general as forecasting methods. The ever-increasing energy consumption and utility costs of building operations requires the exploration of new strategies to optimize usage performance, to reduce energy waste, and to minimize environmental impacts [13]. A successful approach to reach a high energy efficiency in building spaces is the adoption of advanced energy management systems (EMSs) [14], for instance those based on the combination of web interfaces monitoring energy consumption and switching electric power [15], indoor environmental quality (IEQ) for efficient indoor comfort (thermo-hygrometric, lighting, air quality and acoustics) [16], and user activity checks [17].
The overall state of the art suggests the importance of smart building applications to combine wellness functions with energy consumption aspects. The main goal of this work is to provide modular and easily applicable design criteria for energy control systems by focusing attention on the energy savings in public buildings generated by means of low-cost electronic components. Two interfaces were so designed and implemented for a basic prototype demonstrator: one collecting data to calculate energy consumption of the different loads of the building, and one dedicated to indoor air quality (IAQ) monitoring, capable of detecting light intensity, temperature and humidity. A low-cost Arduino-based interface was then developed for sensors data collection and web publication as well as to drive electronic components actuating energy-saving strategies. The use of a cloud-based web interface provides for the formulation of the organizational protocol based on the automated interventions when either anomalous energy consumption occurs, high values of energy consumption are predicted or bad air quality conditions are found (see scheme of Figure 1). The flowchart summarizes the organizational protocol adopted in this study for the public building energy control. The protocol is made of different levels:
  • the “field” level with the electronic interface for active data detection,
  • the data monitoring levels accounting for results prediction,
  • the adjusting final level, containing the procedures for energy efficiency enhancements.
What is depicted in Figure 1 was developed within the framework of the Italian project Data System Platform for Smart Communities (D-SySCOM) [18] (Lead company: SIT srl, Partners: Aliser srl, Eulogic srl, Geatecno srl, Interdisciplinary Laboratory of Design and Integrated Management of Industrial Plants—section of Applied Thermodynamics of the University of Salento, New Technologies Center for the Social Integration of the Disabled at the University of Salento).
In Figure 2 the image and the floor plan of the building adopted for experimental results are reported.
The building in Figure 2 was provided with a modular information system architecture which can simultaneously detect energy and IAQ data, thus ensuring at the same time working quality and energy efficiency. A solution was found that was easily interfaceable with advanced algorithms predicting indoor parameters. Both real-time and predicted parameters are able to allow the optimization of the working environment, according to the activities carried out inside. The chosen low-cost prototypes allow the extension of monitoring to all the rooms of the building and the provided solution can be easily transferred to other public buildings.

2. Materials and Methods

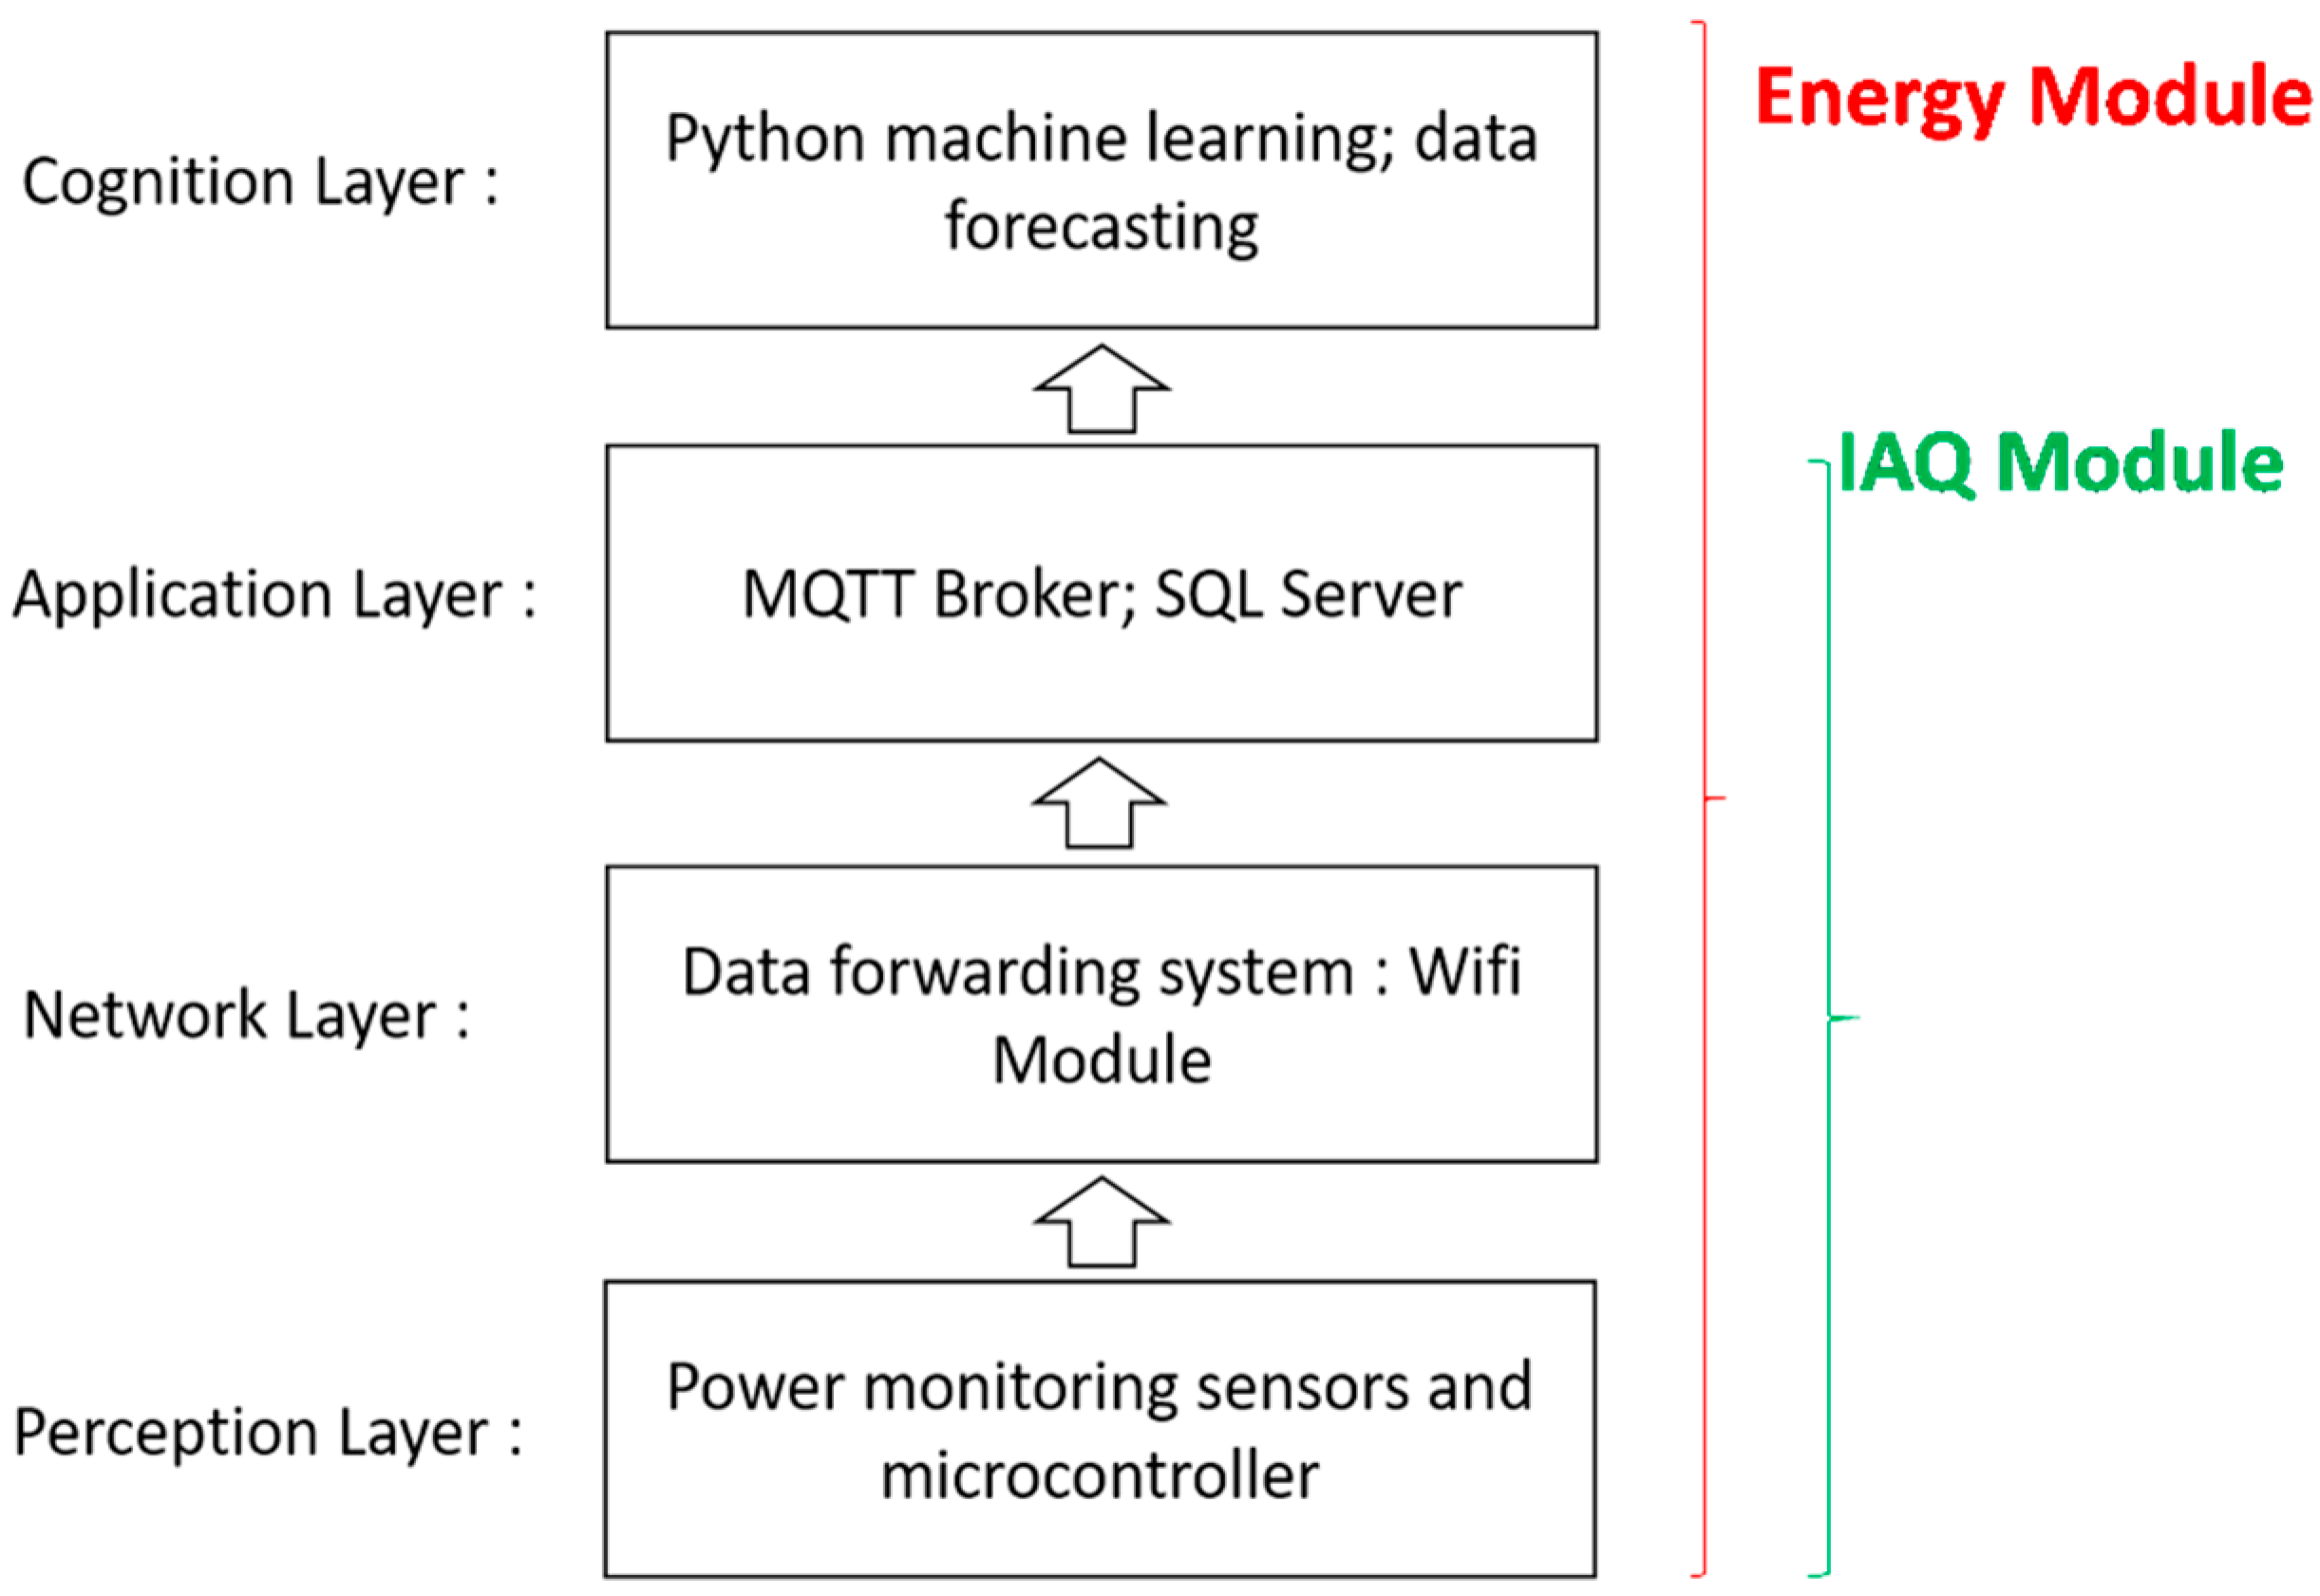
2.1. Energy Monitoring Modular Architecture (EP Interface)

The architecture of the developed IoT-based power consumption monitoring system has the following four-layers: perception, network, application and cognition layers.
At the perception layer, sensor devices are provided which measure and acquire power process variables. At the network layer, information is sent to a cloud-based server. At the application layer, the real-time information is stored and displayed. At the cognition layer, data are post-processed while using machine learning for data analysis and forecasting for assisting in the decision making. Figure 3 highlights the architecture of the system, integrating both energy and IAQ modules: the first three layers (perception layer, network layer, and application layer) are common for both modules; the cognition (the fourth layer) only applies to the energy module and is finalized to improve the energy control by means of machine learning algorithms.

2.1.1. Perception Layer (EP Interface)

The perception layer is directly linked to the central power supply node for power measurement. The system measures the root-mean-square (RMS) instantaneous power, by calculating the RMS current and RMS voltage from the electrical network (the Italian network provides 220 V as an AC voltage level). The voltage is measured on the electric lines passing through the step-down transformer and a voltage regulator adjusting the DC output into a range acceptable for the MicroController Unit (MCU). The adopted microcontroller is the Arduino Nano board, based on the ATmega328P. It is an Alf and Vegard’s RISC (AVR) based microcontroller with 5 V supply, 8 bit and 16 MHz clock frequency. The software code is the Arduino’s Wire programming language, executable on the Arduino Integrated Development Environment (IDE). The electronic components of the setup measuring electrical parameters is illustrated in Appendix A. The AC voltage measurement is adopted to calculate the real power, the apparent power and the power factor. This measurement is performed by using the ZMPT101B AC to AC voltage transformer which has high accuracy, good consistency for voltage and power measurement and can measure up to 250 V AC.
To achieve the requested accuracy (error < 5%), the system underwent a calibration procedure with an oscilloscope and a multimeter. The RMS current and voltage were sampled approximately 50 times in 20 milliseconds (2.5 kHz) sampling frequency, and the results were saved to a database. Then, the rolling average (a calculation to analyze data points by creating a series of averages of different subsets of the full data set) of ten measurements was used to calculate the power by means of the microcontroller. The data was after passed to the ESP8266 Wi-Fi module uploading data to the AdafruitIO cloud structured query language (SQL) server supporting MQTT protocol.

2.1.2. Network Layer (EP Interface)

This layer mainly transmits the detected data from the smart energy monitor to the cloud sever. Data pre-processing methods, such as filtering and outlier removal processes, are executed by the controller, reducing the quantity of transmitted data and the computational cost (are processed only useful data). After pre-processing, data are transferred to the Wi-Fi module interfaced with the microcontroller, or stored in the transmit queue, depending on the data effectiveness data length. The ESP8266 is a low-cost Wi-Fi chip operating with the TCP/IP protocol and supporting IEEE 802.11 b/g/n Wi-Fi standards.

2.1.3. Application Layer (EP Interface)

Data are published by the remote MQTT broker directly through the ESP8266 gateway (publish/subscribe system). MQTT requires low bandwidth and has a data packet size with low overhead minimum (>2 bytes) so that it has smaller supply power consumption. This protocol is a data-agnostic protocol that can transmit data in various forms such as binary data, text, XML, or JSON. As the web server is published, the dashboard-based web application is accessible anywhere and anytime, thus enabling remote energy management.

2.1.4. Cognition Layer (EP Interface)
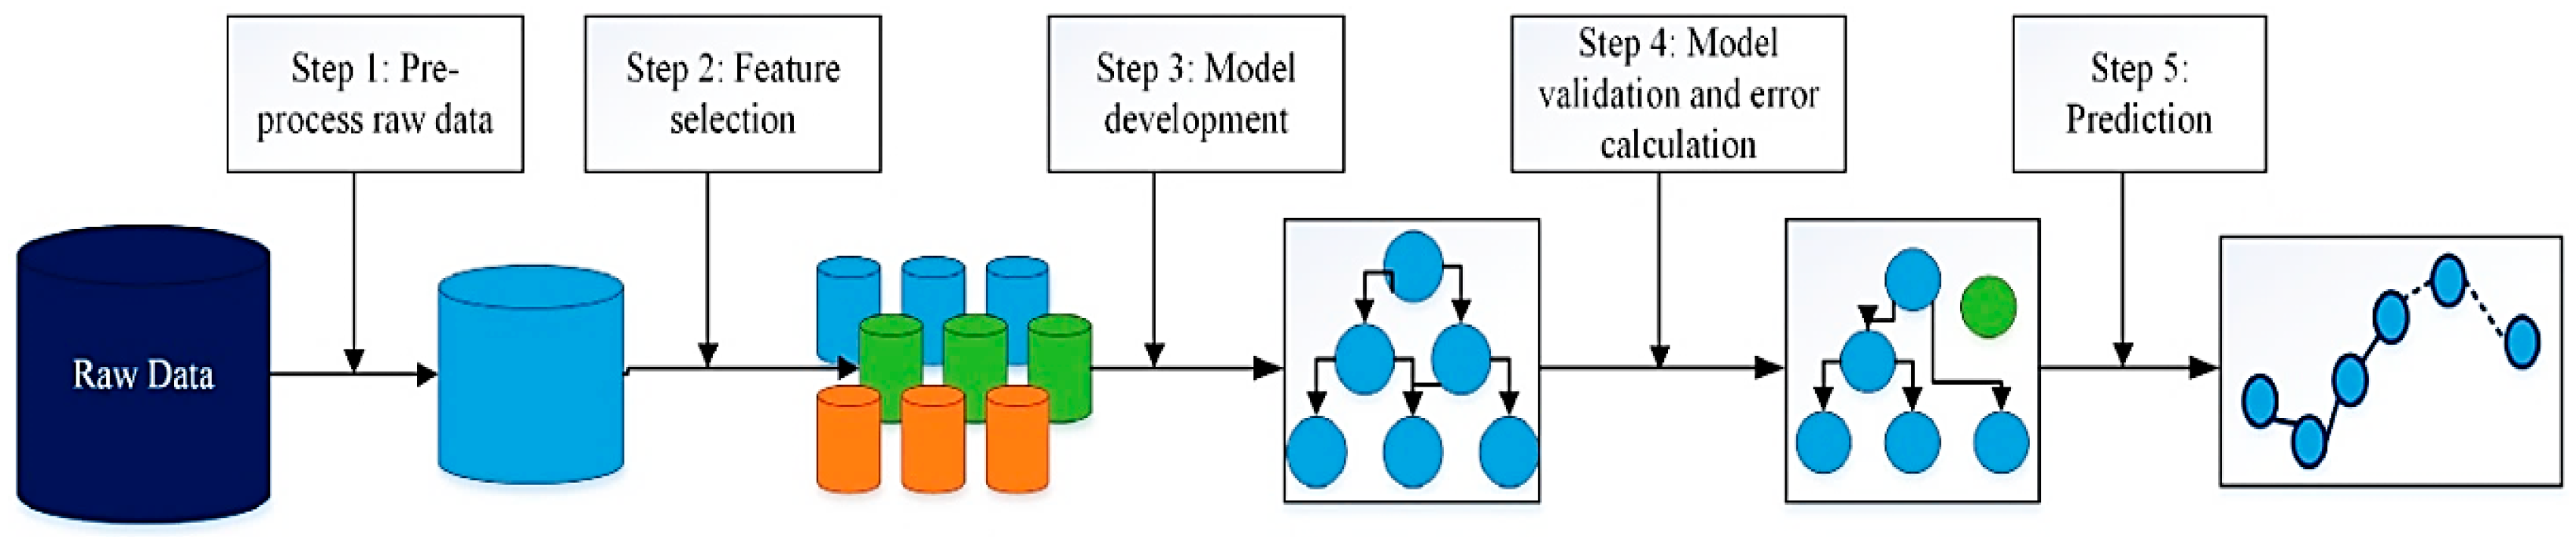
This layer defines the process following the cognitive computing algorithm. The main functions of the cognitive layer are
  • data pre-processing
  • the data mining processing.
This layer is able to execute SARIMA and LSTM algorithms. The whole data mining processing workflow is depicted in Figure 4: it is characterized by five phases (the first step is the pre-processing phase, and the other four steps are related the data processing). The dataset is split into training (75%) and test (25%) datasets to be processed by the machine learning algorithms (best choice concerning algorithm optimization).
The predicted values are compared to the actual values (measured) using different metrics such as mean absolute error (MAE), mean squared error (MSE), root-mean-square error (RMSE) [18].
The architecture in Figure 4 defines the steps of the cognition layer of Figure 3: data are pre-processed extracting features, developing the forecasting model (validating it) and predicting results. The main parameter used for the graphical forecasting view is the electric energy.

2.2. Air Monitoring System Modular Architecture (IAQ Interface)

The modular IAQ architecture is characterized by three layers (see Figure 2): perception, network and application layers. In the perception layer, sensors acquire environmental parameters. In the network layer, information is sent out to the cloud-based server. At the application layer, the real-time information is displayed and the detected digital data are archived.

2.2.1. Perception Layer (IAQ Interface)

The perception layer is the physical system composed by sensors and by the Arduino-based MCU to collect and forward the parameters to the Wi-Fi node. Specifically, about indoor air quality, the following parameters are measured (see Appendix B).

2.2.2. Network Layer (IAQ Interface)

This layer mainly transmits the data detected by the IAQ system to the cloud server by using an ESP266-based NodeMCU v3 ESP8266 Wi-Fi chip. This layer forwards, transfers, and sends data from the Arduino board to the cloud server.

2.2.3. Application Layer (IAQ Interface)

Data are published by the remote MQTT broker through the ESP8266 gateway. The adopted cloud server is ThingsBoard IO (open source IoT platform for device management, data collection, processing and visualization). The graphical dashboards were developed using Python.

2.3. Automatic Time-Series Decomposition and Dashboards

Decomposition is a useful abstraction for time series analysis and to inform forecasting models. Decomposition is performed on the experimental dataset estimation. It is helpful in breaking down the usage consumption in systematic and non-systematic components. The estimated series are classified in four main components: the observed values, the trend (the increasing or decreasing value in the series), the seasonality (the repeating short-term cycle in the series), and the residual noise (the random variation in the series). This series decomposition helps in understanding the complexity of the forecasting modeling to be applied. Decomposition is performed both on hourly (Figure 5a), and daily (Figure 5b) data. The statistical trends of Figure 5 show the possible dataset decomposition forms (on hourly and daily basis) of the forecasting model.

3. Results

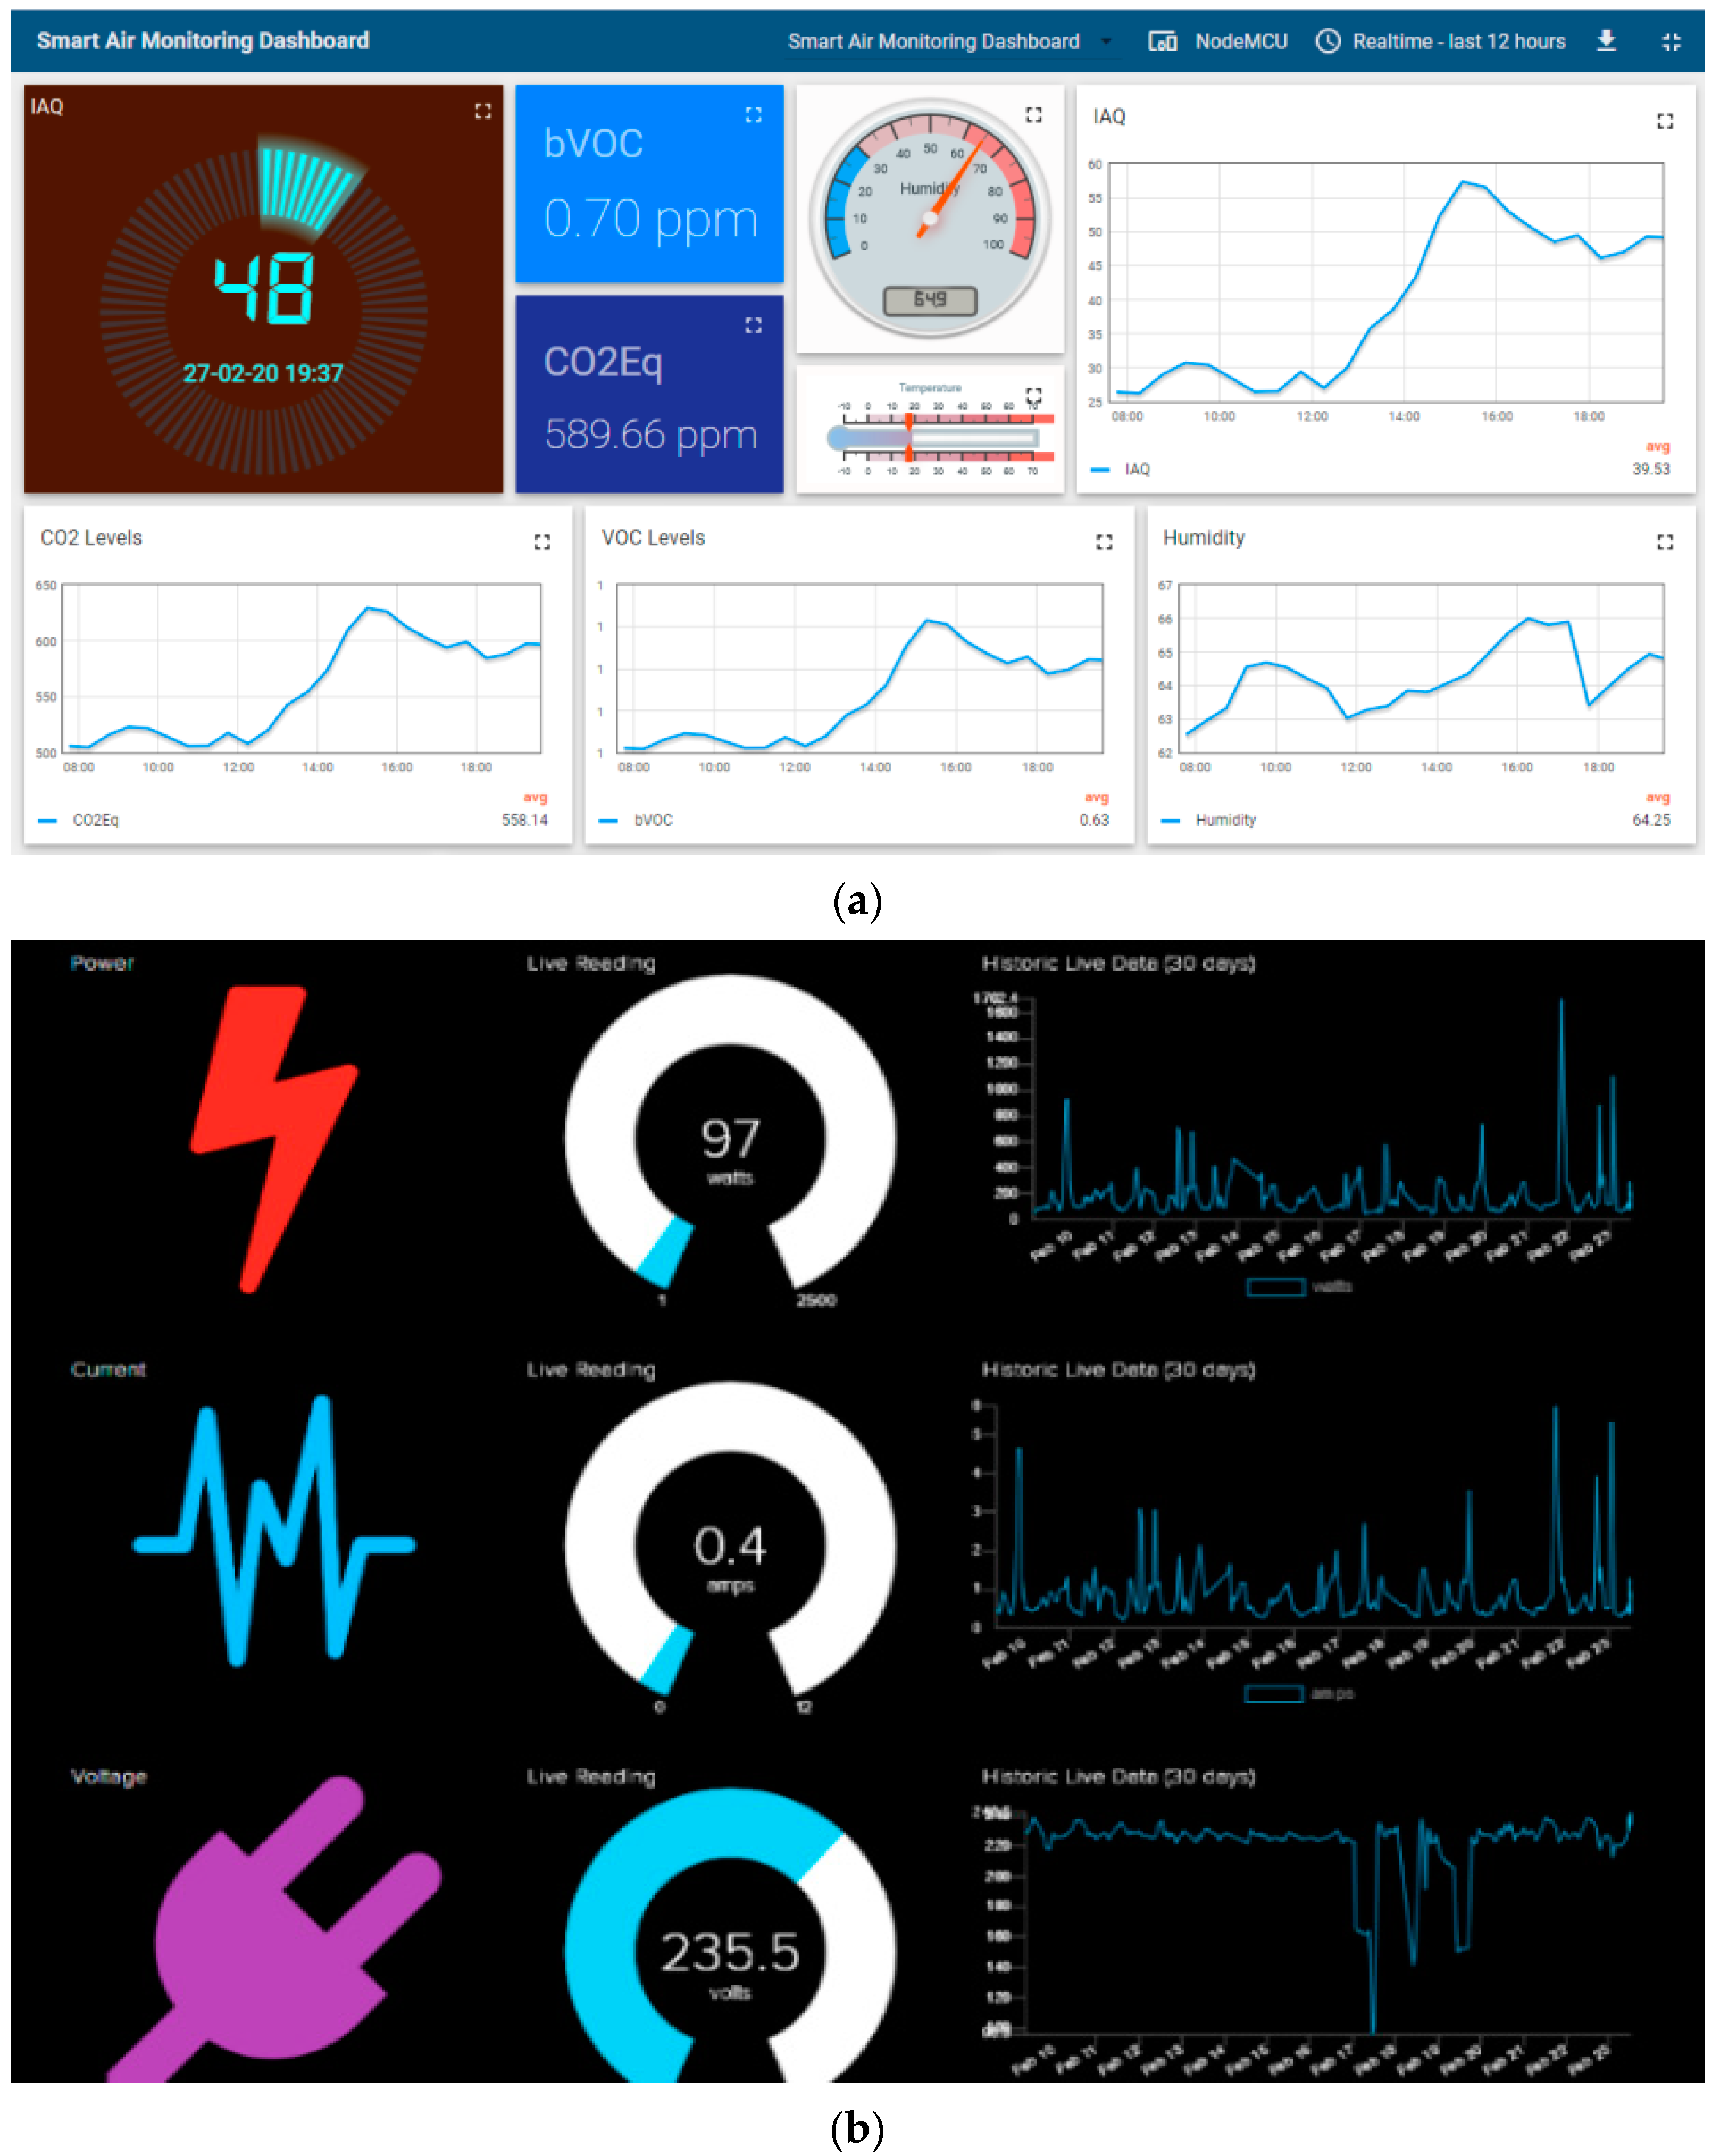
3.1. Energy Monitoring and IAQ Dashboards

First results concern the frontend dashboards of energy monitoring and IAQ system. In Figure 6a, the Adafruit IO dashboards enabling remote energy control is illustrated. The dashboards represent the real time signals and historical weekly energy consumption, (every 7/15/30 days) indicating current, voltage and power trends. Figure 6b shows the implemented web ThingsBoard, displaying both real time and historical IAQ data (temperature, humidity, CO2, VOC levels, dust density).

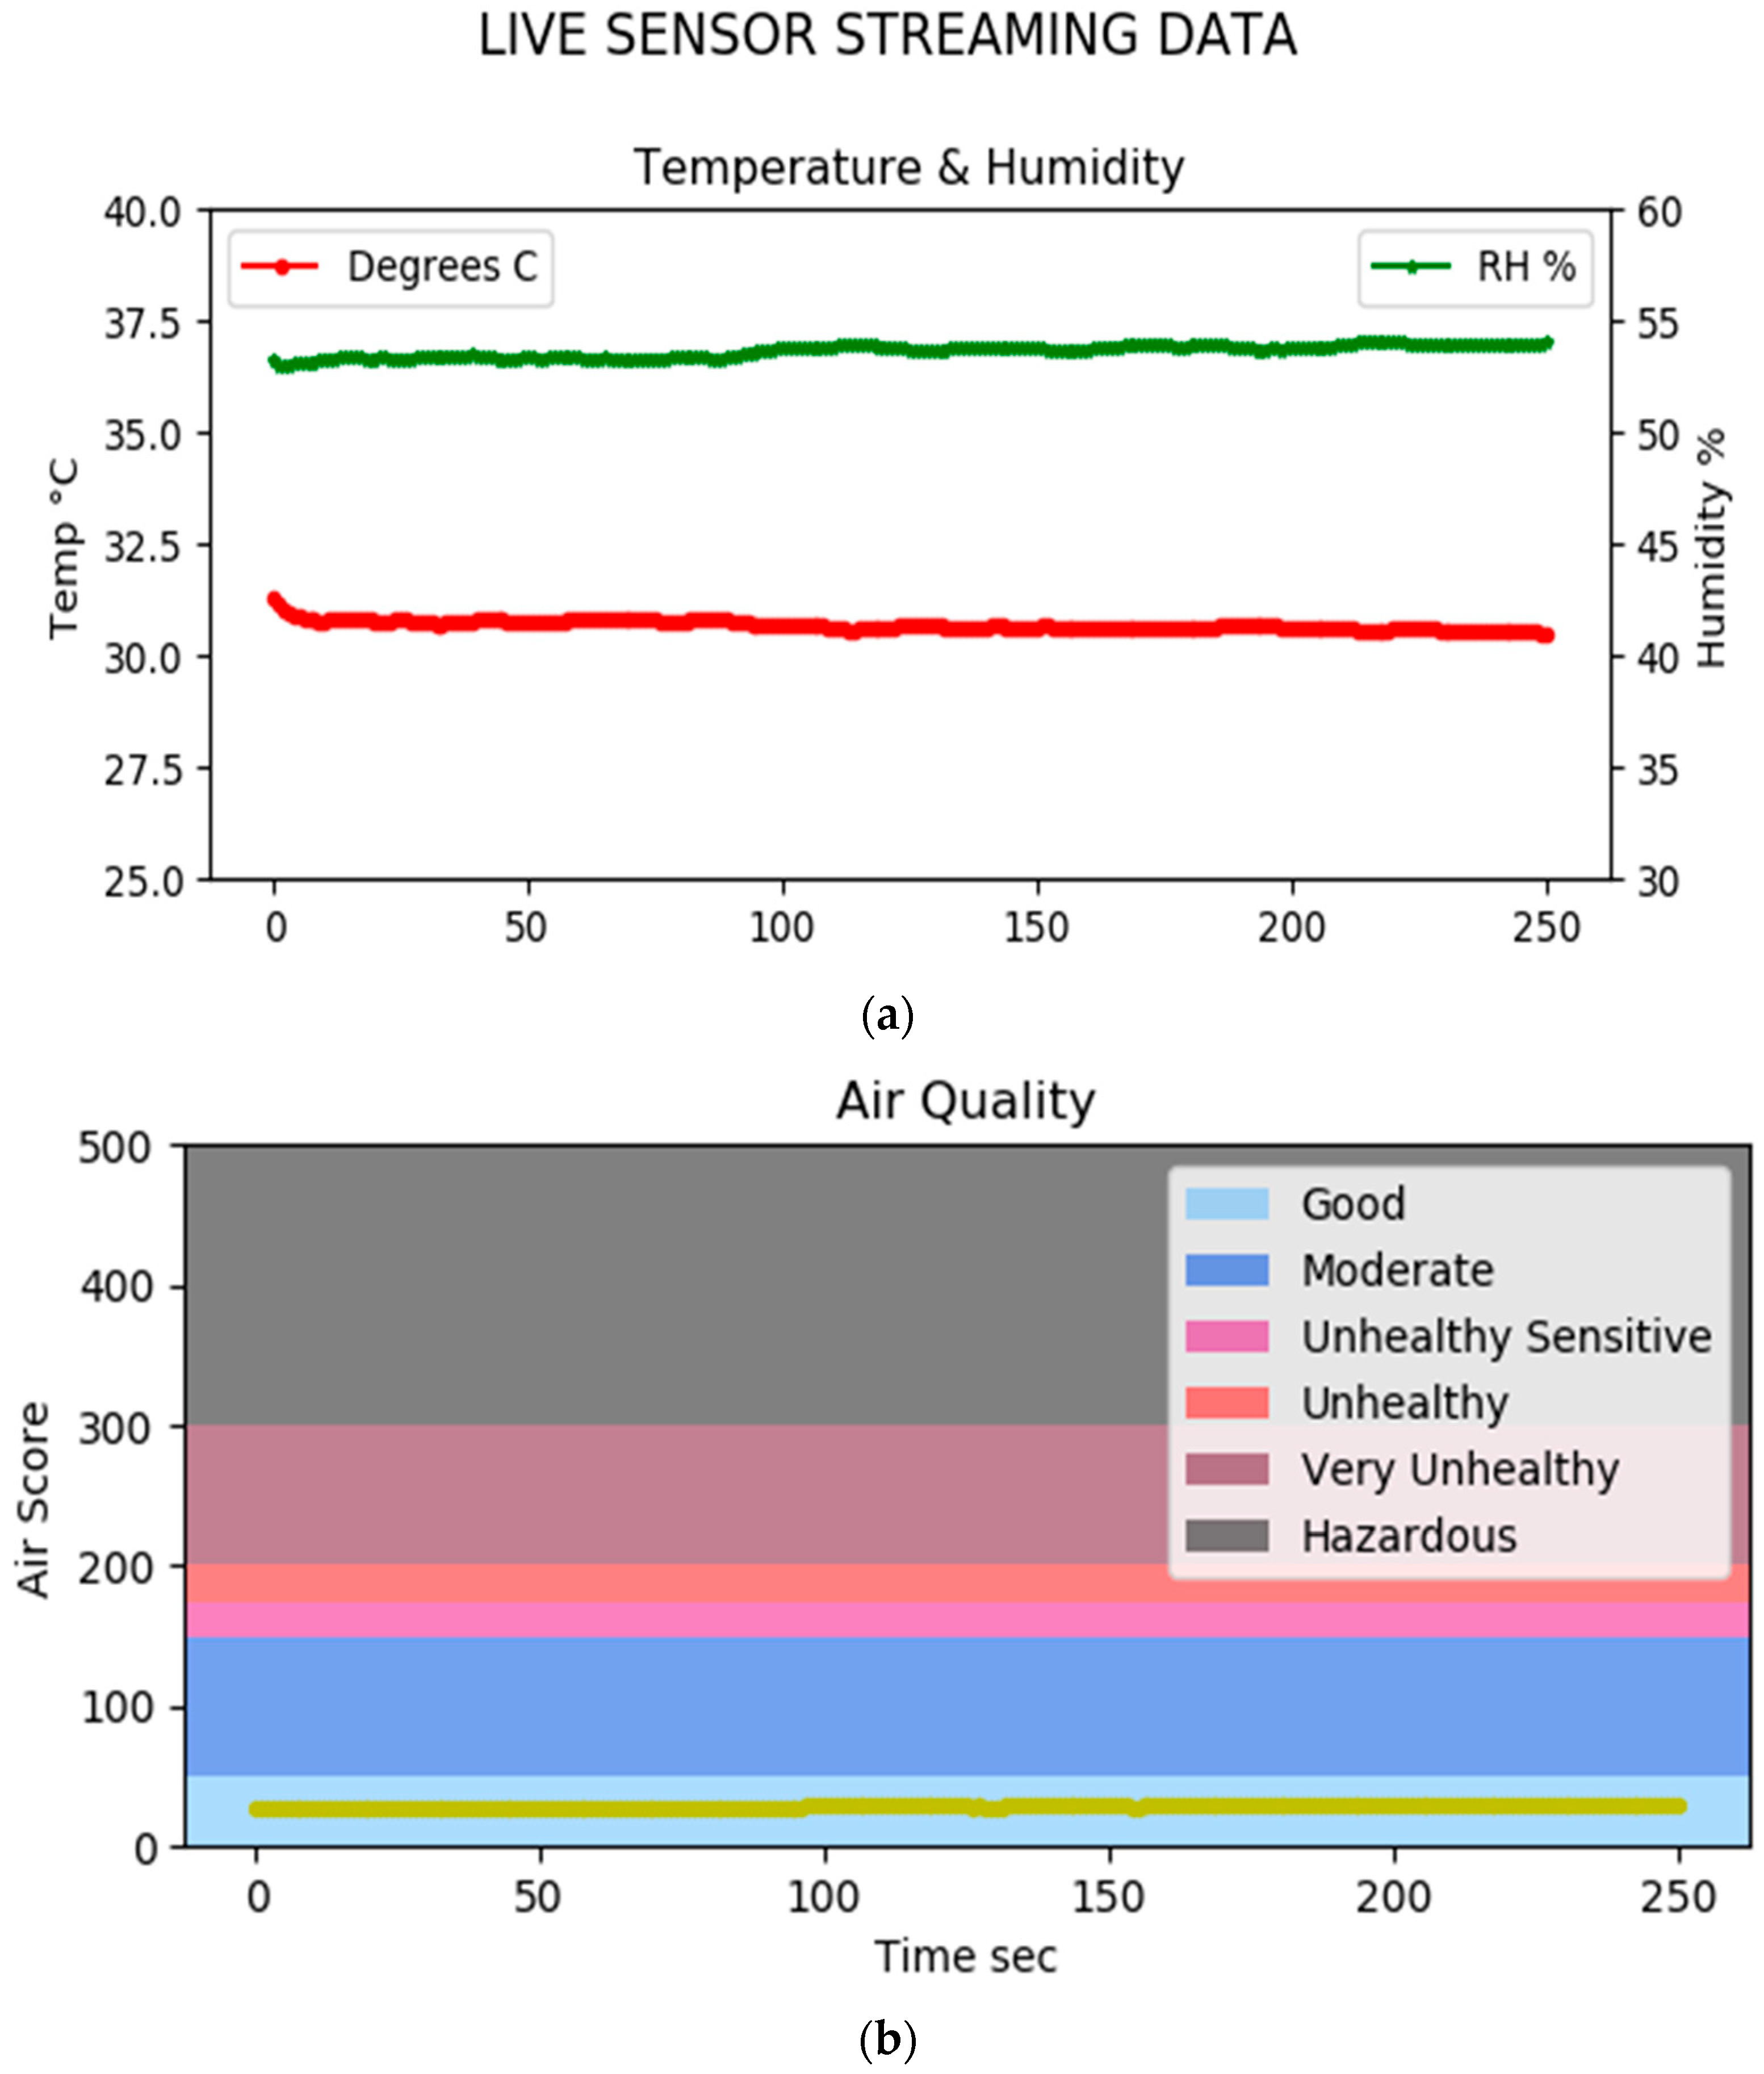
3.2. IAQ Parameter Monitoring

Figure 7 represents the real-time serial output of only BME sensor (see Appendix B) evaluating the indoor air quality (IAQ) parameters (VOC concentration): in Figure 7a, the real-time temperature is reported (expressed in °C) as well as relative humidity (see related description in Appendix B); in Figure 7b, the PM2.5 IAQ index versus the time (measurements of VOCs concentration) can be read. The adopted dust sensor (see Appendix B) counts the dust particles into a range between 0 to 3000 particles (PCS) per 0.01 contamination factor (CF) [19,20]. Specifically, the sensor measures the PM2.5 IAQ index versus the time. The “wellness” scale of PM2.5 level of house can be seen in ordinary ranges below 150 pc/0.01 cf. Figure 7b and Figure 8 report the IAQ “wellness” bands.

3.3. Data Mining to Understand Energy Consumption Behavior

The developed prototype platform for energy dashboards provides energy data grouped as energy consumption per minute (Figure 9a), total energy consumption per hour, (Figure 9b), average energy consumption based on the time of the day (Figure 10a), or types of day (weekdays/weekends) (Figure 10b), and average weekly energy distribution by days of week, both (Figure 11a) percentage-wise and (Figure 11b) consumption-wise.

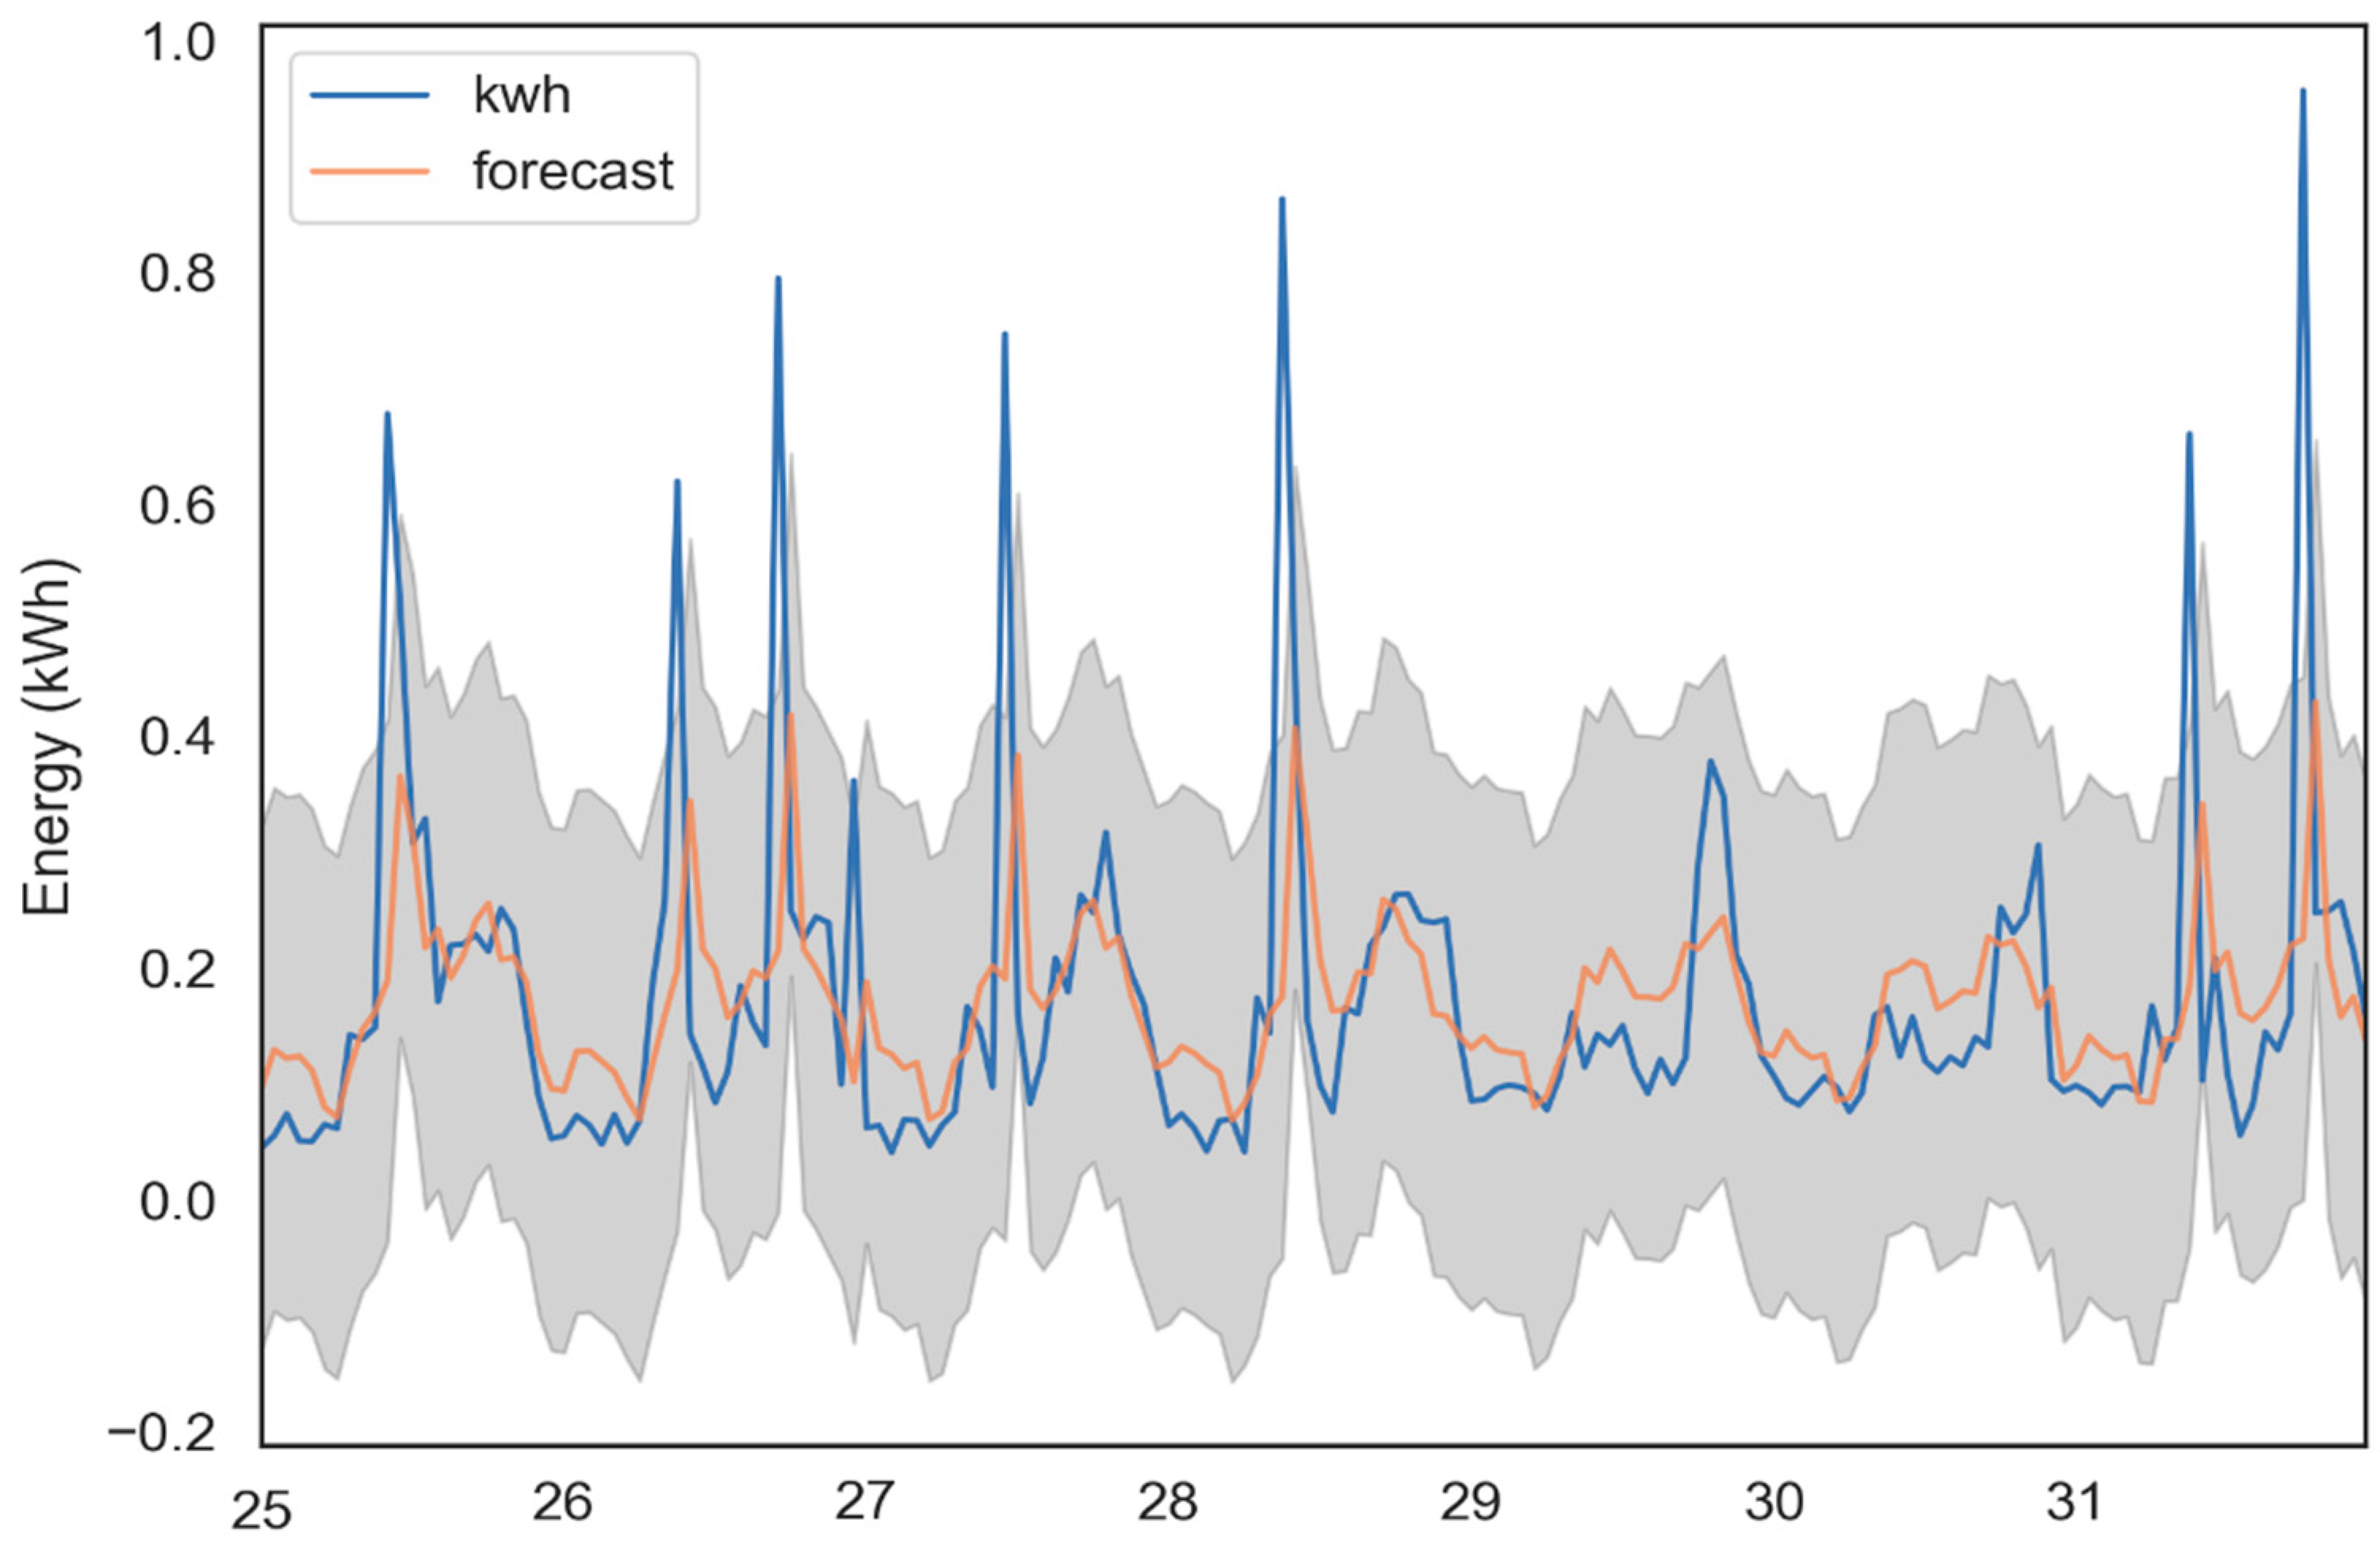
3.3.1. SARIMA Forecasting Results

Figure 12 compares the SARIMA forecasting plot (one-step ahead forecasts) obtained by the experimental results (blue lines show the real values, the orange is one step ahead forecast values, and the gray color indicates the calculus error margin). Some details about the SARIMA algorithm optimization are given in Appendix A.

3.3.2. RNN/LSTM Results

Alternatively, to the SARIMA approach, an RNN approach has been adopted for energy forecasting. To further improve the performance of the SimpleRNN mode, LSTM networks have been used. Hyperparameter tuning has been performed, and the parameters used were time lag = 24, layer depth = 64, epochs = 500. Figure 13 depicts the performance comparison of measured and forecasted values on 7 days test data, while utilizing SARIMA, RNN and LSTM approaches. Figure 14 is the dashboard, depicting one-week ahead load forecast utilizing LSTM as the preferred approach, based on the best reported performance measures. Some details about the LSTM testing environment are shown in Appendix A.

4. Discussion

In Table 1 LSTM can be observed to provide better error measurements if compared with RNN and SARIMA, thus confirming the suitability of the LSTM algorithm for the analyzed dataset.
A total 102,464 datapoints were processed for each of the two monitored room of the experimental building of Figure 2 (one room is energy efficient by means of lighting and temperature control and the other one is not efficient). A comparison between the rooms has been performed concerning the period from April–December 2020:
  • thermal energy savings were of 233 kWh (62.2%);
  • ventilation electrical energy savings were of 17.5 kWh (25.1%);
  • lighting electrical savings were of 282.2 kWh (88.6%).
The modular implementation can simultaneously show dashboards concerning, respectively, energy monitoring and IAQ controls, stored in the same cloud platform: the methodology based on the development of the different architecture layers (as illustrated in Figure 3), integrates other sensors providing other possible information [1] (ventilation, number of persons for room, lighting, energy renewable KPI, etc.), and other dashboards (for example for noise level data [21]). Monitored and predicted energy consumption data are of primary importance to the planning of work activities in an efficient way. An example is planning efficient electrical load switching operations [22,23] according to the workers activities inside the public building, as well as load priorities [23]. The use of both energy consumption and IAQ modules allows the formulation of intervention plans (bottom level of Figure 1) based on the following procedure:
1-
energy consumption interventions based on the use of electricity, avoiding energy waste and using energy either from renewables or from storage (thermal and electrical), and possibly choosing low-cost hours;
2-
reengineering working spaces based on intelligent deactivation of electrical loads in empty rooms;
3-
new definition of the rooms occupation based on either work activities or electric loads distribution;
4-
engineering of new layouts by taking into account the “wellness” level provided by the IAQ module;
5-
other interventions can be performed in real time by continuously analyzing building energy and IAQ dashboards.
The use of the very low cost electronic components described in the Appendix A and Appendix B, and the adoption of an open source platform, makes it possible to install the modules in each room of the building and to control all the parameters in the cloud. This aspect is important for big public buildings which have several floors and many rooms.
Concerning advantages and disadvantages of the proposed technologies, in Table 2 some features are reported compared with commercial solutions.
In Table 3, some research topics matching with the proposed technology by highlighting its potential advantages are listed. The main issues can be summarized as follows:
  • simultaneous energy and IAQ monitoring system are applied on the same building;
  • a good error performance of the adopted algorithms (LSTM and SARIMA) can be useful for energy forecasting;
  • low-cost and open source solutions are suitable for the hardware integration of different sensors and for the data processing software libraries;
  • a method to design platform architectures, implementing standard communication protocols (such as MQTT), is available.
Possible future developments of the present system will be addressed in future to energy routing and strategy actuation features based on alerts detected by the platform. Actually, on the same hardware, both energy management and building security would be provided based both on sensors detection or AI prediction algorithms.

5. Conclusions

The paper proposes some hardware and software low-cost solutions which are useful for smart building energy and IAQ monitoring. The low-cost modules allow for the installation of the components in each room of the public building. The goal of the paper was to propose a modular approach to electronic control modules. Acquired datasets have been adopted to define optimization strategies for electrical energy consumption reduction and worker wellness increase. The provided solutions are compatible and integrable with other “open” modules controlling other parameters, and which are devoted to further improve energy savings and wellness conditions. Interventions can be planned which are also based on predicted energy consumption.
Compared to existing commercial solutions, the technology proposed here uses a predictive LSTM algorithm, which is demonstrated to be more efficient than a SARIMA one, for the specific dataset typology.
The formulation of more complex key performance building indicators, taking into account priorities of electrical loads, is under investigation.
The adopted open source tools are fully integrated into an information system managing front-end interfaces with dashboards and back-end data systems collecting data. The paper provides a low-cost solution to build up an advanced platform, suitable to control whole buildings with a modular implementation of the hardware solutions and compatible with different sensor technologies and data transmission standard protocols.
The implementation of two main functions, such as energy and indoor air quality monitoring, proves that managing sensors data displaced in complex networks is possible. In addition, Python with the related open source libraries is compliant with the implementation of different machine learning algorithms, provided that there is a dataset to be processed and performance to be achieved.
The adoption of more algorithms and sensors is fundamental to estimate innovative KPIs as outputs of complex monitoring systems such as energy routing. In future works, implementing synchronized electronic boards will be the goal, both for control and actuation functions for cloud computing platforms or for edge computing systems interfacing microcontrollers with data processing units. This achievement is possible as the modularity of the solutions depicted here allows the design and to implementation of hybrid networks constituted by cloud and edge data processing systems.

Author Contributions

Conceptualization, G.S., A.M., G.C., A.T.; methodology, G.S., A.T., G.C.; hardware, A.T.; software, A.T.; validation, G.S., G.C., A.M.; formal analysis, A.M.; investigation, G.S., A.T.; resources, G.S., G.C.; data curation, G.S., A.M.; writing—original draft preparation, G.S., A.M., A.T.; writing—review and editing, G.S., A.M., G.C.; supervision, G.S.; project administration, G.S., G.C.; funding acquisition, G.S.: All authors have read and agreed to the published version of the manuscript.

Funding

Regione Puglia—Bando Innolabs—POR Puglia FESR FSE 2014–2020—Sub-Azione 1.4.B.—R&D Project D-SySCOM—Data System Platform for Smart Communities.

Data Availability Statement

Not applicable.

Acknowledgments

The work has been developed within a framework of the EnergyLAB of LUM University (University Laboratory for Energy Conversion, Measurement and Management).

Conflicts of Interest

The authors declare no conflict of interest.

Abbreviations

ACAlternating Current
ANNArtificial Neural Network
ARIMAAutoRegressive Integrated Moving Average
AVRAlf and Vegard’s RISC
BLEBluetooth Low Energy
BLE-M-LRBluetooth Low Energy Mesh Long Range
CFContamination Factor
DMData Monitoring
D-SySCOMData System Platform for Smart Communities
EEPROMElectrically Erasable Programmable Read-Only Memory
EPElectric Power
EMSEnergy Management System
GPSGlobal Positioning Systems
IAQIndoor Air Quality
IEQIndoor Environmental Quality
IoTInternet of Things
IDEIntegrated Development Environment
IPInternet Protocol
IREDInfrared Emitting Diode
KPIKey Performance Indicator
LoRALong RAnge
LoRaWANLong-Range Wide-Area Networks
LSTMLong Short-Term Memory
MAEMean Absolute Error
MCUMicroController Unit
MOSMetal Oxide Semiconductor
MQTTMessage Queuing Telemetry Transport
MSEMean Square Error
M2MMachine to Machine
PCBPrinted Circuit Board
RMSRoot Mean Square
RNNRecurrent Neural Network
SDKSoftware Development Kit
SQLStructured Query Language
TCPTransmission Control Protocol
VOCVolatile Organic Compounds
WMSWireless Sensors Network

Appendix A

Figure A1a shows the whole electronic setup used for energy monitoring measuring electrical current and voltage. The measurement system is non-invasive, i.e., the user does not need to disconnect any wires or modify any connections within the distribution board of the house (Figure A1b).
Figure A1. (a) Components of the energy monitor system. (b) CT coupled in a distribution board of a residential home.
Electronics 11 03904 g0a1
Data collected in cloud are processed by the SARIMA and LSTM algorithms. In Figure A2 is illustrated the testing framework used for the algorithm optimization.
Figure A2. Testing framework of LSTM prediction.
Electronics 11 03904 g0a2
Figure A3a–d illustrates some plots used for the check of the SARIMA performance algorithm, where are some plots related the optimization of algorithm checking testing data distributions.
Figure A3. Testing of the SARIMA algorithm checking the best algorithm performance: (a) standardized residual, (b) histogram of the estimated density distribution, (c) normal probability Q-Q plot, (d) correlagram.
Electronics 11 03904 g0a3

Appendix B

Arduino based MCU (Figure A4a) is able to collect and forward data of sensors (illustrated in Figure A4b) to the WiFi node.
Figure A4. (a) IAQ Monitoring sensor setup. (b) BME, MQ, SHARP Sensors.
Electronics 11 03904 g0a4
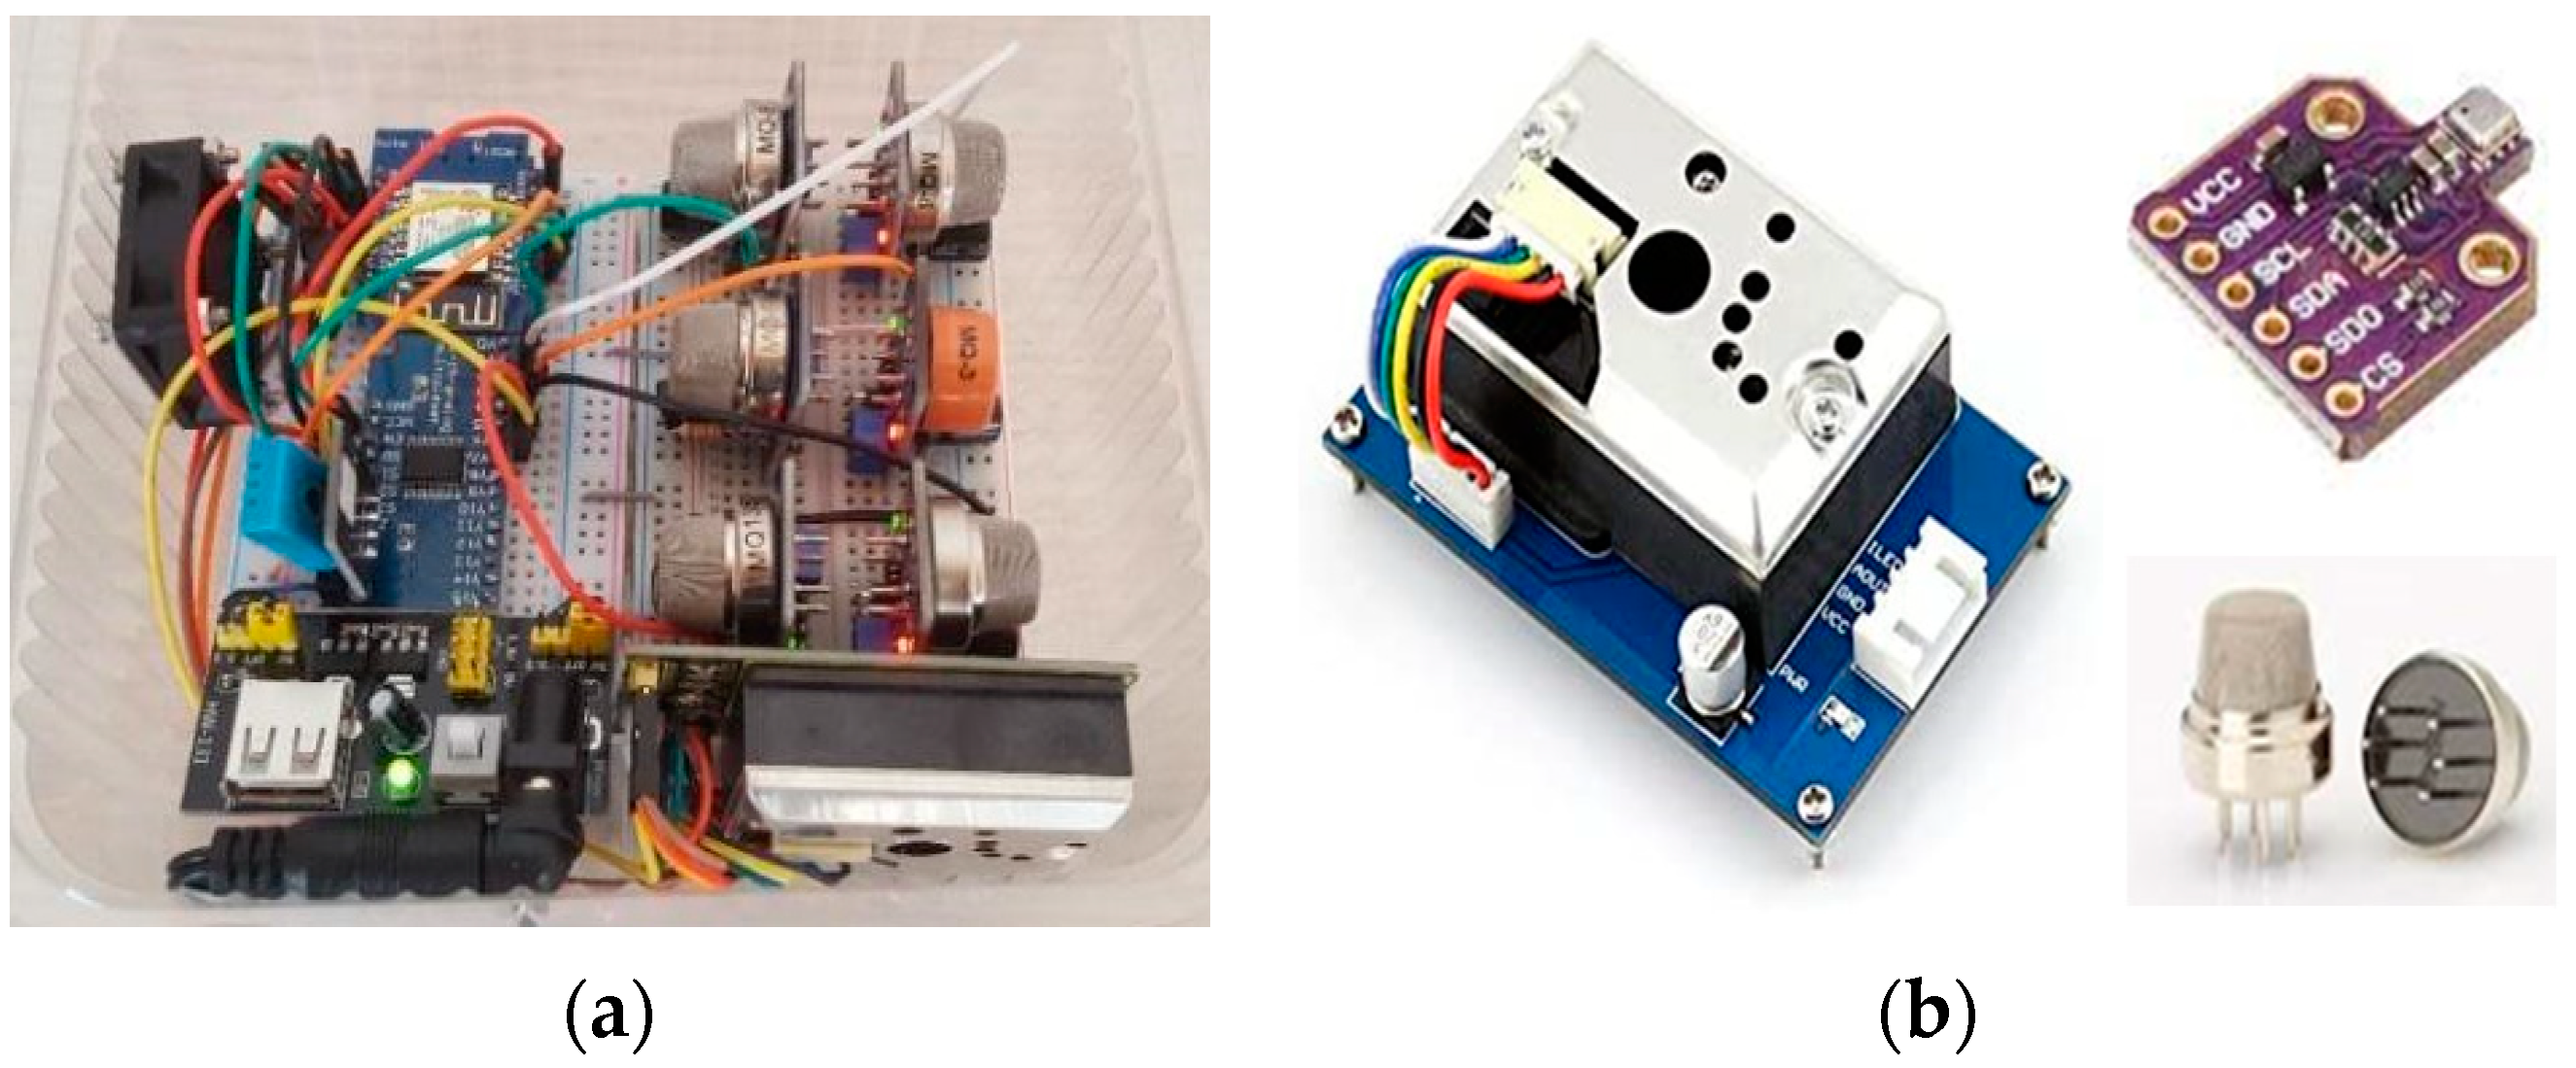
  • BME680 is a low power consumption sensor unit that includes an environmental VOC, temperature, humidity and barometric sensors. The operating current consumption ranges from 5 to 25 mA. The sensor precision for temperature is ±1.0 °C, the humidity is ±3% r.H and atmospheric pressure of ±0.6 hPa. The BME680 sensor calculates the sum of VOCs in the surrounding air to provide qualitative air quality data. This sensor also incorporates a background auto-calibration feature in order to provide reliable IAQ qualitative data. The data is stored in Electrically Erasable Programmable Read-Only Memory (EEPROM), which is then used for baseline correction for subsequent readings. This process regards the recent measurement records to guarantee that IAQ index ~25 matches to typical good air and IAQ index ~250 states for typical polluted air. The sensor output resistance value varies according to VOCs concentrations, as the higher the concentration of reducing VOCs, the lower the resistance and vice versa. The IAQ qualitative range is from 0 to 500.
  • Sharp GP2Y1010AU0F is a dust sensor with an optical sensing system. An infrared emitting diode (IRED) and a phototransistor are integrated into this device, detecting the reflected light of dust in air. In particular, the sensor can detect fine particles like those contained in cigarette smoke, with a capability for detecting them due to the pulse pattern of output voltage. The features of compact size and low current draw of 20 mA are particularly important for wireless embedded applications. The sensor outup is an analog voltage proportional to the measured dust density, with a sensitivity of 0.5 V per 0.1 mg/m3. The detecting range of the sensor is from 0 mg/m3 to 0.5 mg/m3.
  • MQ Sensors are metal oxide semiconductor (MOS)-type gas sensors, also known as chemiresistors. Their detection is based upon the change in resistance of the sensing material when the gas comes into contact with the material. They have high sensitivity for different gasses like ammonia, NOx, alcohols, aromatic compounds and smoke. The conductivity of the sensor increases with the concentration of pollutant gas. The sensitive material of MQ sensors is SnO2, which has lower conductivity in clean air. When the target combustible gas exists, conductivity of the sensor increases proportionally to gas concentration. The sensor module voltage is 5 V. The resistance variation in the sensor module is converted into proportional voltage variation by the use of external load resistance.
  • BH1750FVI is a photodiode-based analog ambient light intensity sensor integrated into a circuit with a two wires serial bus interface. BH1750FVI has high resolution when measuring light in a range between 1 and 65535 lx.

References

  1. Massaro, A.; Starace, G. Advanced and Complex Energy Systems Monitoring and Control: A Review on Available Technologies and Their Application Criteria. Sensors 2022, 22, 4929. [Google Scholar] [CrossRef]
  2. Savard, C.; Iakovleva, E.V. A Suggested Improvement for Small Autonomous Energy System Reliability by Reducing Heat and Excess Charges. Batteries 2019, 5, 29. [Google Scholar] [CrossRef] [Green Version]
  3. Tsai, C.-W.; Chiang, K.-C.; Hsieh, H.-Y.; Yang, C.-W.; Lin, J.; Chang, Y.-C. Feature Extraction of Anomaly Electricity Usage Behavior in Residence Using Autoencoder. Electronics 2022, 11, 1450. [Google Scholar] [CrossRef]
  4. Kusnandar; Permana, I.; Chiang, W.; Wang, F.; Liou, C. Energy Consumption Analysis for Coupling Air Conditioners and Cold Storage Showcase Equipment in a Convenience Store. Energies 2022, 15, 4857. [Google Scholar] [CrossRef]
  5. Ali, U.; Buccella, C.; Cecati, C. Households Electricity Consumption Analysis with Data Mining Techniques. In Proceedings of the IECON 2016–42nd Annual Conference of the IEEE Industrial Electronics Society, Florence, Italy, 23–26 October 2016; IEEE: New York, NY, USA, 2016; pp. 3966–3971. [Google Scholar]
  6. Lis, A.; Sudolska, A.; Pietryka, I.; Kozakiewicz, A. Cloud Computing and Energy Efficiency: Mapping the Thematic Structure of Research. Energies 2020, 13, 4117. [Google Scholar] [CrossRef]
  7. Massaro, A. Internet of Things Solutions in Industry. In Electronics in Advanced Research Industries; Wiley: Hoboken, NJ, USA, 2021; pp. 155–202. [Google Scholar] [CrossRef]
  8. Akrami, A.; Doostizadeh, M.; Aminifar, F. Power System Flexibility: An Overview of Emergence to Evolution. J. Mod. Power Syst. Clean Energy 2019, 7, 987–1007. [Google Scholar] [CrossRef] [Green Version]
  9. Basmadjian, R.; Shaafieyoun, A.; Julka, S. Day-Ahead Forecasting of the Percentage of Renewables Based on Time-Series Statistical Methods. Energies 2021, 14, 7443. [Google Scholar] [CrossRef]
  10. Mahjoub, S.; Chrifi-Alaoui, L.; Marhic, B.; Delahoche, L. Predicting Energy Consumption Using LSTM, Multi-Layer GRU and Drop-GRU Neural Networks. Sensors 2022, 22, 4062. [Google Scholar] [CrossRef] [PubMed]
  11. Alsharif, M.H.; Younes, M.K.; Kim, J. Time Series ARIMA Model for Prediction of Daily and Monthly Average Global Solar Radiation: The Case Study of Seoul, South Korea. Symmetry 2019, 11, 240. [Google Scholar] [CrossRef]
  12. Yuan, T.-L.; Jiang, D.-S.; Huang, S.-Y.; Hsu, Y.-Y.; Yeh, H.-C.; Huang, M.-N.L.; Lu, C.-N. Recurrent Neural Network Based Short-Term Load Forecast with Spline Bases and Real-Time Adaptation. Appl. Sci. 2021, 11, 5930. [Google Scholar] [CrossRef]
  13. Azari, R. Life Cycle Energy Consumption of Buildings. Embodied + Operational; In Sustainable Construction Technologies; Tam, V.W.Y., Le, K.N., Eds.; Elsevier: Oxford, UK, 2019; pp. 123–144. [Google Scholar]
  14. Khan, M.H.; Asar, A.U.; Ullah, N.; Albogamy, F.R.; Rafique, M.K. Modeling and Optimization of Smart Building Energy Management System Considering Both Electrical and Thermal Load. Energies 2022, 15, 574. [Google Scholar] [CrossRef]
  15. Laayati, O.; Bouzi, M.; Chebak, A. Smart Energy Management System: Design of a Monitoring and Peak Load Forecasting System for an Experimental Open-Pit Mine. Appl. Syst. Innov. 2022, 5, 18. [Google Scholar] [CrossRef]
  16. Devitofrancesco, A.; Belussi, L.; Meroni, I.; Scamoni, F. Development of an Indoor Environmental Quality Assessment Tool for the Rating of Offices in Real Working Conditions. Sustainability 2019, 11, 1645. [Google Scholar] [CrossRef] [Green Version]
  17. Nguyen, T.A.; Aiello, M. Energy Intelligent Buildings Based on User Activity: A Survey. Energy Build. 2013, 56, 244–257. [Google Scholar] [CrossRef] [Green Version]
  18. D-SySCOM. Available online: https://www.d-syscom.it/ (accessed on 27 September 2022).
  19. Karki, D.; Verma, A. Assessment of Heavy Metal Contamination within the Sediments in Some Fresh Water Lakes of Udaipur. Int. J. Environ. Qual. 2021, 46, 37–45. [Google Scholar] [CrossRef]
  20. Demková, L.; Árvay, J.; Bobuľská, L.; Hauptvogl, M.; Michalko, M.; Michalková, J.; Jančo, I. Evaluation of Soil and Ambient Air Pollution Around Un-Reclaimed Mining Bodies in Nižná Slaná (Slovakia) Post-Mining Area. Toxics 2020, 8, 96. [Google Scholar] [CrossRef] [PubMed]
  21. Cardiff.ac.uk. Available online: https://orca.cardiff.ac.uk/id/eprint/141914/1/ICBEN-2020-paper-Langer-jennifer-submitted.pdf (accessed on 27 July 2022).
  22. Massaro, A. Information Technology Infrastructures Supporting Industry 5.0 Facilities. In Electronics in Advanced Research Industries; Wiley: Hoboken, NJ, USA, 2021; pp. 51–101. [Google Scholar] [CrossRef]
  23. Massaro, A.; Meuli, G.; Galiano, A. Intelligent Electrical Multi Outlets Controlled and Activated by a Data Mining Engine Oriented to Building Electrical Management. Int. J. Soft Comput. Artif. Intell. Appl. 2018, 7, 01–20. [Google Scholar] [CrossRef]
  24. Katyara, S.; Shaikh, M.F.; Shaikh, S.; Khand, Z.H.; Staszewski, L.; Bhan, V.; Majeed, A.; Shah, M.A.; Zbigniew, L. Leveraging a Genetic Algorithm for the Optimal Placement of Distributed Generation and the Need for Energy Management Strategies Using a Fuzzy Inference System. Electronics 2021, 10, 172. [Google Scholar] [CrossRef]
  25. Nawaz, M.A.; Khan, B.; Ali, S.M.; Awais, M.; Qureshi, M.B.; Jawad, M.; Mehmood, C.A.; Ullah, Z.; Aslam, S. Intelligent Sensors and Environment Driven Biological Comfort Control Based Smart Energy Consumption System. Electronics 2022, 11, 2622. [Google Scholar] [CrossRef]
  26. Krishna, G.; Singh, R.; Gehlot, A.; Akram, S.V.; Priyadarshi, N.; Twala, B. Digital Technology Implementation in Battery-Management Systems for Sustainable Energy Storage: Review, Challenges, and Recommendations. Electronics 2022, 11, 2695. [Google Scholar] [CrossRef]
  27. Ruiz Florez, H.A.; López, G.P.; Jaramillo-Duque, Á.; López-Lezama, J.M.; Muñoz-Galeano, N. A Mathematical Modeling Approach for Power Flow and State Estimation Analysis in Electric Power Systems through AMPL. Electronics 2022, 11, 3566. [Google Scholar] [CrossRef]
  28. Li, S.; Yang, J.; Wu, F.; Li, R.; Rashed, G.I. Combined Prediction of Photovoltaic Power Based on Sparrow Search Algorithm Optimized Convolution Long and Short-Term Memory Hybrid Neural Network. Electronics 2022, 11, 1654. [Google Scholar] [CrossRef]
  29. Bui, V.; Le, N.T.; Nguyen, V.H.; Kim, J.; Jang, Y.M. Multi-Behavior with Bottleneck Features LSTM for Load Forecasting in Building Energy Management System. Electronics 2021, 10, 1026. [Google Scholar] [CrossRef]
  30. Alonso, A.M.; Nogales, F.J.; Ruiz, C. A Single Scalable LSTM Model for Short-Term Forecasting of Massive Electricity Time Series. Energies 2020, 13, 5328. [Google Scholar] [CrossRef]
  31. Błaszczok, D.; Trawiński, T.; Szczygieł, M.; Rybarz, M. Forecasting of Reactive Power Consumption with the Use of Artificial Neural Networks. Electronics 2022, 11, 2005. [Google Scholar] [CrossRef]
  32. Xu, C.; Li, C.; Zhou, X. Interpretable LSTM Based on Mixture Attention Mechanism for Multi-Step Residential Load Forecasting. Electronics 2022, 11, 2189. [Google Scholar] [CrossRef]
  33. Li, L.; Han, C. ASARIMA: An Adaptive Harvested Power Prediction Model for Solar Energy Harvesting Sensor Networks. Electronics 2022, 11, 2934. [Google Scholar] [CrossRef]
  34. Tang, J.; Yang, R.; Yuan, G.; Mao, Y. Time-Series Deep Learning Models for Reservoir Scheduling Problems Based on LSTM and Wavelet Transformation. Electronics 2022, 11, 3222. [Google Scholar] [CrossRef]
  35. Ren, B.; Huang, C.; Chen, L.; Mei, S.; An, J.; Liu, X.; Ma, H. CLSTM-AR-Based Multi-Dimensional Feature Fusion for Multi-Energy Load Forecasting. Electronics 2022, 11, 3481. [Google Scholar] [CrossRef]
  36. Stošović, M.A.; Radivojević, N.; Ivanova, M. Electricity Consumption Prediction in an Electronic System Using Artificial Neural Networks. Electronics 2022, 11, 3506. [Google Scholar] [CrossRef]
  37. Sánchez-Sutil, F.; Cano-Ortega, A.; Hernández, J.C. Design and Implementation of a Smart Energy Meter Using a LoRa Network in Real Time. Electronics 2021, 10, 3152. [Google Scholar] [CrossRef]
  38. Al-Gumaei, Y.A.; Aslam, N.; Aljaidi, M.; Al-Saman, A.; Alsarhan, A.; Ashyap, A.Y. A Novel Approach to Improve the Adaptive-Data-Rate Scheme for IoT LoRaWAN. Electronics 2022, 11, 3521. [Google Scholar] [CrossRef]
  39. Osamy, W.; Khedr, A.M.; Salim, A.; AlAli, A.I.; El-Sawy, A.A. Recent Studies Utilizing Artificial Intelligence Techniques for Solving Data Collection, Aggregation and Dissemination Challenges in Wireless Sensor Networks: A Review. Electronics 2022, 11, 313. [Google Scholar] [CrossRef]
  40. Szymczyk, M.; Augustyniak, P. Selected Energy Consumption Aspects of Sensor Data Transmission in Distributed Multi-Microcontroller Embedded Systems. Electronics 2022, 11, 848. [Google Scholar] [CrossRef]
  41. Bencak, P.; Hercog, D.; Lerher, T. Indoor Positioning System Based on Bluetooth Low Energy Technology and a Nature-Inspired Optimization Algorithm. Electronics 2022, 11, 308. [Google Scholar] [CrossRef]
  42. Lanuzza, M.; De Rose, R.; Strangio, S. Design of Ultra-Low Voltage/Power Circuits and Systems. Electronics 2022, 11, 607. [Google Scholar] [CrossRef]
  43. Springer, T.; Linstead, E.; Zhao, P.; Parlett-Pelleriti, C. Towards QoS-Based Embedded Machine Learning. Electronics 2022, 11, 3204. [Google Scholar] [CrossRef]
  44. Zhao, L.; Yang, Y.; Wu, Z. Review of Communication Technology in Indoor Air Quality Monitoring System and Challenges. Electronics 2022, 11, 2926. [Google Scholar] [CrossRef]
Figure 1. Organizational protocol used for the project web interfaces in a public smart building.
Electronics 11 03904 g001
Figure 2. (a) Photo and (b) floor plan (right) of the building adopted for the testing of the protocol indicated in Figure 1 (Municipal building of the municipality of Nardò in the South of Italy). Experimentations were performed in the rooms indicated with the red circle.
Electronics 11 03904 g002
Figure 3. System structure of the system: modularity implementation of the technologies monitoring energy parameters and indoor air quality.
Electronics 11 03904 g003
Figure 4. Advanced architecture adopted for data detection and processing.
Electronics 11 03904 g004
Figure 5. (a) Time series decomposition hourly basis. (b) Time series decomposition daily basis.
Electronics 11 03904 g005
Figure 6. Dashboards of the implemented platform, monitoring air quality (a) and energy (b) tested for a public building.
Electronics 11 03904 g006
Figure 7. IAQ BME Serial Output: (a) temperature in °C and humidity percentage versus seconds. (b) IAQ index (VOCs concentrations) and related “wellness” bands.
Electronics 11 03904 g007
Figure 8. IAQ “wellness” bands indicated in the estimation of IAQ value of Figure 7b.
Electronics 11 03904 g008
Figure 9. (a) Energy consumption per 10 s; (b) Average energy consumption per hour.
Electronics 11 03904 g009
Figure 10. (a) Hourly average energy consumption versus time. (b) Hourly average energy consumption per weekday type.
Electronics 11 03904 g010
Figure 11. Average weekly energy distribution by days of week. (a) Percentage-wise; (b) Consumption-wise.
Electronics 11 03904 g011
Figure 12. SARIMA dashboard forecasting: energy consumption hourly forecasting.
Electronics 11 03904 g012
Figure 13. Prediction comparison of 3 different forecasting algorithms—SARIMA, RNN and LSTM.
Electronics 11 03904 g013
Figure 14. One week ahead load forecast by LSTM Predicted (red line) vs. actual load (blue line).
Electronics 11 03904 g014
Table 1. Performance metric comparison among the three algorithms.
Performance MetricSARIMARNNLSTM
MAE0.0751660.0801480.067111
MSE0.0184640.0194420.018558
RMS0.1413960.1394340.136226
Table 2. Comparison with commercial solutions.
FeatureProposed Technologies Commercial Technologies
Mechanical stability of the electronic modulesThe mechanical stability can be achieved after an accurate design of the package containing electronic components and printed circuit board (PCB) connections.The mechanical stability is guaranteed by the industrialized package tasted during the industrialization process.
Communication
stability
Both accurate design and maintenance are necessary to ensure communication stability.Commercial solutions normally provide a sure communication stability.
Time forecasting
(setting parameters)
It is possible to set each parameter of the forecasting algorithm.Typically, commercial solutions do not implement forecasting algorithms.
Sensor settingThe proposed solution allows us to optimize important parameters (such as sampling time), and transmission protocol.The setting is a function of the availability of the third-party company providing the software.
IntegrabilityThe solutions are fully integrable with standard protocols, and the modules are designed to integrate in the same framework as other low-cost sensors detecting other indoor parameters. The use of a possible software development kit (SDK) and of the open source software, allow favoring the integration of the hardware and the software.The modules are typically integrable with other ones of the same company.
CostThe low cost is fundamental to implementing modules when many rooms have to be controlled. The cost of the components may limit the implementation (especially for big buildings).
Data availabilityThe availability of raw data allows to estimate different KPI also considering a large number of variables/parameters (as for complex KPI [1]).Data are typically available on third party databases, and cannot be easily used to calculate other KPI which can be referred to in the particular case study.
Table 3. Comparison with commercial solutions.
Research Topics and referencesApplicability of the Proposed Technology to the Research Topic Advantages of the Proposed Technology Matching with the Research Topic
Energy Management Systems (EMS) [24,25,26,27]EMS monitoring heavy loading, fault conditions, energy consumption (considering
environment parameters),battery charging, and estimating problems in electric power systems.
Easy implementation for each type of monitoring system, integrating versatile synoptic panels controlling parameters (open source platforms adaptable for the specific environment or system to control and able to estimate other non-standard parameters).
Energy Forecasting [28,29,30,31,32,33,34,35,36] Methods such as artificial neural network (ANN), SARIMA and LSTM for load, active and reactive power forecasting. Possibility to integrate for cloud or local forecasting calculus different algorithms by using the same software platform.
Smart metering network [37]Long
RAnge (LoRA) technology for residential electricity metering
networks.
Compatibility with LoRA protocol constructing a LoRA IoT network (by means of a specific access control layer).
Wireless Sensors Network (WSN) [38,39,40]WSN implementing long-range wide-area networks (LoRaWAN), bluetooth low-energy
mesh long-Range (BLE-M-LR), and data aggregation technologies.
Possibility to also structure the complex WSN, adopting a low-cost Arduino-based technology managing different wireless nodes (simply constituted by a microcontroller unit, a radio frequency transmitter, and a battery) structured in different architectures.
Electronic Integrated Chips [41,42,43] Integration in boards of Bluetooth Low Energy (BLE), and in general of low-cost
systems-on-chip solutions, allocating resources efficiently.
Presence in the market of sensor technologies compatible with different Arduino-based boards, ensuring a full integration for embedded BLE or Global Positioning System (GPS).
Indoor air quality [44]Indoor air quality (IAQ) monitoring technology.Possibility to integrate IAQ with EMS by considering the same backend system.
Publisher’s Note: MDPI stays neutral with regard to jurisdictional claims in published maps and institutional affiliations.

