Article

Extraction of the Complex Relative Permittivity from the Characteristic Impedance of Transmission Line by Resolving Discontinuities

by
Franck Moukanda Mbango
1,*,
Ghislain Fraidy Bouesse
2 and
Fabien Ndagijimana
3
1
Electrical and Electronics Engineering Laboratory, Faculty of Sciences and Techniques, Université Marien Ngouabi, Brazzaville BP 69, Congo
2
Electrical and Electronics Engineering Laboratory, National School of Polytechnic Studies, Université Marien Ngouabi, Brazzaville BP 69, Congo
3
Electrical Engineering Department, Grenoble Alpes University, CNRS, Grenoble INP, G2ELab, 151 Rue de la Papeterie, F-38400 Saint-Martin-d’Hères, France
*
Author to whom correspondence should be addressed.
Electronics 2022, 11(23), 4035; https://doi.org/10.3390/electronics11234035
Submission received: 22 October 2022 / Revised: 29 November 2022 / Accepted: 2 December 2022 / Published: 5 December 2022
(This article belongs to the Section Electronic Materials, Devices and Applications)

Abstract

:
This paper describes a material complex permittivity extraction technique based on four measurements of two identical coaxial (circular and rectangular) lines, distinguished by their lengths. The paper presents a combination of propagation parameters through mixing the eigenvalue principle and the lines’ characteristic impedance to improve the extraction techniques of intrinsic material parameters. However, the accuracy of some material parameters is insufficient, as the discontinuities at the feedline–ideal line interface are not adequately solved. In these cases, a new formulation of the complex effective permittivity is suggested, associating the propagation constant and the characteristic impedance for a homogeneous structure. Next, uncertain errors that can negatively impact the method are removed from the mathematical expression. Then, a characteristic impedance expression is developed in the second stage to improve the mathematical formulation. Finally, a correction coefficient in tune with reality and a polynomial function to amend the behavior of some of the curves are provided. The approach’s novelty lies in its ability to extract and correct the characteristic impedances despite discontinuity impedances at the ideal line–feedline interface. Several materials are tested with circular and/or rectangular coaxial fixtures to confirm the performance of the suggested method. The test cells are homogeneous, full, and long, at 80 mm and 100 mm (50 mm for the circular one). Determining the propagation constant from the eigenvalue of the wave cascading matrix (WCM) is a fundamental step in this method. Knowing the propagation constant helps to automatically compute a correction coefficient that depends on the fixture and the material being tested. Experimental validation is performed in the frequency range from some MHz to 10 GHz, 13.5 GHz, and 20 GHz, according to the tested material. Both test fixtures are filled with the sample material, with a vacuum considered as a reference parameter. The method’s accuracy is better than 5% on the relative permittivity parameter throughout the frequency range. All the tested samples are compared with the results using the filled two-transmission-line technique (FTTL), using only the eigenvalue determination principle. The trapper cells are coaxially circular and rectangular.

1. Introduction

Advanced design systems have emerged out of the need to meet users’ requirements in terms of comfort, safety, and protection, meeting these needs through the use of large amounts of information and strong communications. At the same time, the need for new technology keeps increasing. In this context, the integration of old and new materials, e.g., electric, magnetic, or magneto-electric materials, becomes an ever-increasing challenge. The efforts to meet this challenge through technological innovation are the reason of many applications, benefiting both consumers and industrialist. For example, dielectric or magnetic wafers allow the design of filters, power dividers, antennas, etc., in microwave environments. In addition, dielectrics can be used to paint buildings, decorate flats, transmit and receive signals into printed circuit boards (PCBs), protect people against electromagnetic radiation, etc. Different kinds of materials can have complex permittivity or permeability properties. As such, materials must be characterized in the electromagnetic domain through the foreseeable solutions of the fields’ interference. Moreover, materials are found in many shapes [1], states, and natures; they exist as wafers (soft or hard), monolayers or multilayers, powders, mud, liquids [2], granular materials, etc. Determining the parameters of materials is vital in microwave technology due to the large diversity of panel application ranges in microwave devices, material tests, and measurement domains. Some examples include multilayered fabrication (in microelectronics), biomedical applications (in the medical field), food engineering (in the food industry), non-destructive testing (the railway industry and building sector), etc. There are several techniques in this area categorized into two main groups: firstly, there are those defined according to the frequency range (broadband or narrowband), their electric parameters (lumped or distributed elements), and state (destructive or non-destructive) [3], resonant, or non-resonant [4] methods (cavity or stub), and secondly, there are algorithmic methods (direct or indirect method) [5,6]. Six main techniques constitute these two families. Among them are methods using two parallel plates (capacitor method) [7,8], inductors [9,10], free-space [11,12,13,14], probes [15,16,17,18], transmission lines [9,19,20,21], and resonant cavities [22,23,24]. In these examples, adapting the technique to the material and the scanned frequency seems correct, as each method has its advantages and disadvantages. The two-transmission line and resonator techniques have been the most popular for decades. Above all, there are standard methods for the three major materials families (magnetic, electric, and magneto-electric). Whatever the technique used, the Vectorial Network Analyzer (VNA) is often called upon during measurement validation [25,26,27]. Thus, the Anritsu MS4642B 20GHz radiofrequency (RF) equipment has been used in this paper for experimental measurement validation. The material characterization consists of the disturbance of the electromagnetic fields [22,28] that occupy a defined environment. To better understand electromagnetic phenomena, the four Maxwell equations are essential [29]. Here, we suggest and improve the methodology to extract a material’s complex relative permittivity by combining the propagation constant and the characteristic impedance using a new formulation to achieve this goal. The objective is to simplify this approach by resolving discontinuities, as many previous techniques have tried. Advanced electromagnetic simulations and appropriate software are used during the modeling stage before accurate analysis techniques [30]. With the addition of the conclusion section, this paper’s discussion of the developed approach is organized in the following sections: first, the mathematic model is discussed through the chosen methodology; second, the experimental measurement results are presented; and finally, the discussion is given. The method has been validated with six specimens: polenta, semolina, aquarium sand, Q-cell 5020, PLA 100%, and semi-flex 100%.

2. The Approach Topology and Methodology

The transmission-line method is one of the most popular techniques because of its ability to be broadband and the simplicity of its implementation. It also has several types of structures (coaxial, microstrip, coplanar, etc.) and configurations [31,32], which contributes to its capacity to be used by many materials (wafers, liquid, powder, mud, etc.). Hence, the sample being tested cannot suffer from its insertion into a fixture cell if the right choice of structure has been made. However, at the same time, some limits appear because of the use thereof, especially when extracting loss tangents less than 5 × 10 3 . Therefore, researchers continue to push through new and challenging barriers to improve the line technique’s applicability. We try to contribute to this initiative by improving fundamental knowledge through the approach we present in this paper. Therefore, our aim is to set up a procedure to extract electric and magnetic materials more accurately than what exists. This section deals with the topology and the methodology of extracting the intrinsic parameters of the material under test (MUT).

2.1. Topology of the Test Cell

Let us consider two identical waveguides (transmission lines) [33] that differ by their lengths, as shown in Figure 1 below.
At each ideal line ( l 1 and l 2 ), a feedline ( l x ) is placed to let the wave move from one side to another. To simplify the approach studied, both feedlines (connectors) are considered identical, while all conductors are the same [34]. Access ports 1 and 2 are used for the S-parameter data acquisitions during the measurement steps.

2.2. Mathematical Modeling: Methodology

The method is based on the combination of a transmission line’s propagation constant and characteristic impedance to extract the complex relative permittivity of a dielectric material. On one side, developing and correcting the characteristic impedance before being amended through the automatic coefficient reduces the impact of uncertainties. On the other hand, the propagation constant is determined from the two-line eigenvalues. This last parameter is also amended as for the previous one, with the same objective. Therefore, the final definition of the material dielectric constant and loss tangent will be proposed. The Maxwell Equation developments link the electric waveguide length θ to the relative part (for a homogeneous structure) of the propagation environment (area) or the MUT [32,35], as given in Equation (1):
θ = 2 π f c l ε r μ r
where ε r and μ r are the MUT’s relative permittivity and permeability, respectively; l is the line’s length; β is the phase constant, and f is the operating frequency. The electric length is given as follows when the ideal waveguide is filled with the vacuum:
θ v = 2 π f c l
By substituting the intrinsic parameters from the Equation (1) and combining them with the Equation (2), it is proven that:
θ m θ v = μ r ε r
At the same time, the characteristic structure impedances in vacuum ( Z v ) and MUT ( Z m ) configurations are linked as expressed in Equation (4):
Z m Z v = μ r ε r
With the substitution of μ r from Equation (3) and into Equation (4), it appears that the relative permittivity is determined as:
ε r = θ m θ v Z v Z m
Due to Equation (5), the relative permeability becomes the following Equation:
μ r = θ m θ v Z m Z v
These Equations (1)–(6) are available when the MUT is perfect (does not have losses) and the test cell has perfect conductors. Otherwise, the dielectric and magnetic loss tangents can be determined after making some corrections highlighting some uncertainty coefficients that depend on the scanned frequency, as given below:
Δ ε r = { θ m Z v Z m + α d ( Z m Z v Z m Z v ) Δ l θ v ( Z m ) 2 }
and
Δ μ r = { θ m Z v Z m + α d ( Z v Z m Z v Z m ) Δ l θ v ( Z v ) 2 }
In that case, the dielectric loss tangent ( tan δ d ) is obtained using the equation:
tan δ d = 1 β v ( α m ε r α v ) ( 1 + Z m Z v Z v Z m )
and the magnetic loss tangent ( tan δ m ) is given as follows:
tan δ m = 1 β v ( α m μ r α v ) ( 1 + Z m Z v Z v Z m )
where α m and α v are the attenuation coefficients measured when the MUT is trapped inside the test cell and vacuum, respectively. In addition, Z m and Z v are the imaginary part of the complex characteristic impedances of the waveguide when the MUT and vacuum are trapped inside.
Performing electromagnetic characterization is a priority in understanding any environment’s electromagnetic wave propagation characteristics. Such characterization consists of disturbing field lines in a very different medium. One problem in this domain is solving the discontinuities at the trapper–feedline interface. Among many techniques, the transmission line technique becomes more important than the broadband technique [36,37], which uses several line configurations to reach its goals. Therefore, several studies have focused on the two-line approach, using the difference in the lines’ lengths to solve the discontinuity effects [35,38]. According to electromagnetic theory, using the same material inside two identical waveguides through their variable lengths means the discontinuities are the same [39]. The wave cascading transfer matrix (WCM) [34] allowed us to extract the propagation constant by computing their eigenvalues [39,40,41]. The four T-matrices are given in the following [42,43] equations:
[ T 1 ] ( v , m ) 1 = 1 ( S 21 v , m ) 1 [ ( S 21 v , m ) 1 ( S 12 v , m ) 1 ( S 11 v , m ) 1 ( S 22 v , m ) 1 ( S 11 v , m ) 1 ( S 22 v , m ) 1 1 ]
and
[ T 2 ] ( v , m ) 2 = 1 ( S 21 v , m ) 2 [ ( S 21 v , m ) 2 ( S 12 v , m ) 2 ( S 11 v , m ) 2 ( S 22 v , m ) 2 ( S 11 v , m ) 2 ( S 22 v , m ) 2 1 ]
where [ T 1 ] ( v , m ) 1 and [ T 2 ] ( v , m ) 2 are the transfer T-matrices for vacuum ( v ) and MUT ( m ) , respectively, written after data acquisitions in both transmission lines, long l 1 and l 2 . Moreover, using the CWM leads to:
[ T 12 ] v = [ T 2 ] v ( 2 ) [ T 1 ] v ( 1 ) 1
[ T 12 ] m = [ T 2 ] m ( 2 ) [ T 1 ] m ( 1 ) 1
Let us consider that:
[ T 12 ] = [ T 11 ( 12 ) T 12 ( 12 ) T 21 ( 12 ) T 22 ( 12 ) ]
The ideal transmission line has a length:
Δ l = l 2 l 1
where l 2 > l 1 , and its transfer T-matrix is written as follows:
[ Δ T ] = [ 1 λ 0 0 λ ] = [ e γ Δ l 0 0 e γ Δ l ]
The resolution of Equations (13), (14) and (17) leads to:
γ 1 , 2 v , m Δ l = ln ( λ 1 v , m ) = ln ( λ 2 v , m )
λ 1 , 2 v , m = ( T 11 v , m ( 12 ) + T 22 v , m ( 12 ) ) ± ( T 11 v , m ( 12 ) T 22 v , m ( 12 ) ) 2 + 4 T 12 v , m ( 12 ) T 21 v , m ( 12 ) 2
Equation (18) is written in both configurations as:
{ γ v Δ l = α v Δ l + j θ v γ m Δ l = α m Δ l + j θ m
The correction of this previous equation leads to:
{ γ v c Δ l = j θ v γ d c Δ l = ( α m α v ) Δ l + j θ m
Figure 1 can be represented by the characteristic impedances Z v , m and the propagation constant, as seen in Figure 2.
The transfer T-matrix of Figure 2 can be written according to reference [44] as:
[ T 1 , 2 ] v = 1 2 Z v Z 0 [ 2 Z v Z 0 cosh ( γ 1 v l 1 , 2 ) B 1 , 2 v ( Z v 2 Z 0 2 ) sinh ( γ 1 v l 1 , 2 ) ( Z v 2 Z 0 2 ) sinh ( γ 1 v l 1 , 2 ) 2 Z v Z 0 cosh ( γ 1 v l 1 , 2 ) B 1 , 2 v ]
[ T 1 , 2 ] m = 1 2 Z m Z 0 [ 2 Z m Z 0 cosh ( γ 1 m l 1 , 2 ) B 1 , 2 m ( Z m 2 Z 0 2 ) sinh ( γ 1 m l 1 , 2 ) ( Z m 2 Z 0 2 ) sinh ( γ 1 m l 1 , 2 ) 2 Z m Z 0 cosh ( γ 1 m l 1 , 2 ) B 1 , 2 m ]
with
{ B 1 , 2 v = ( Z v 2 + Z 0 2 ) sinh ( γ 1 v l 1 , 2 ) B 1 , 2 m = ( Z m 2 + Z 0 2 ) sinh ( γ 1 m l 1 , 2 )
Developing and simplifying Equations (13) and (14) gives the following results:
Z v = Z 0 1 1 P v + { Y v + 2 2 2 P v 2 + ( 1 Y v ) P v + ( 1 + 4 P v ) }
and
Z m = Z 0 x 1 P m 1 + { Y m + 2 2 2 P m 2 + ( 1 Y m ) P m ( 1 + 4 P m ) }
where Z 0 = 50 Ω, and x is the correction coefficient:
x = θ m θ v a exp ( θ v θ m )
and
{ P v , m = ( Z 0 2 Z v , m 2 ) 8 Z v , m 2 Z 0 2 { 1 cosh ( 2 γ v , m c Δ l ) } Y v , m = cosh ( 2 γ v , m c Δ l )
As described earlier, the new proposed approach finds its origins and principle in Equations (13), (14), (25), and (26) before determining the relative permittivity through Equation (5) and the dielectric loss tangent given in Equation (9). Finally, the extracted results have been compared to those obtained with the eigenvalues of the filled two-lines principle (EFTLP). The eigenvalue’s determination principle uses two primary mathematic relations from Equation (3) if the sample under test is either electric (that means μ r 1 ) or magnetic (that means ε r 1 ). Both equations are written as follows:
μ r ε r = ( θ m θ v ) 2
Some equations, developed in [30,34], have shown how to take off the conductor dissipation factor or reduce its impact during data compilation and processing. Because of this, we can establish that the dielectric dissipation factor (DF) is inferred by:
tan δ d = 2 β v ( α m ε r α v )
and for the magnetic loss tangent, by:
tan δ m = 2 β v ( α m μ r α v )
The uncertainty impacts of the conductor DF are well-described in [45]. The characteristic impedance correction is made through the 3-degree polynomial function given as follows:
Z v , m ( c ) i = a 3 v , m k 3 + a 2 v , m k 2 + a 1 v , m k + a 0 v , m
where f is the frequency. This paper deals addresses chosen main points. These points are not necessarily the same for all tested materials. The coefficients a 3 v , m , a 2 v , m , a 1 v , m , and a 0 v , m are determined from four characteristic impedance measurement points from the material propagation parameters, as given in the following equation:
( a 3 v , m a 2 v , m a 1 v , m a 0 v , m ) = [ f 1 3 f 1 2 f 1 1 f 2 3 f 2 2 f 2 1 f 3 3 f 3 2 f 3 1 f 4 3 f 4 2 f 4 1 ] 1 ( Z v , m ( 1 ) Z v , m ( 2 ) Z v , m ( 3 ) Z v , m ( 4 ) )
Due to the new definition of Z v , m , all previous expressions including Z v , m are replaced by Z v , m ( c ) i .

3. Measurement Validations, Results, and Discussion

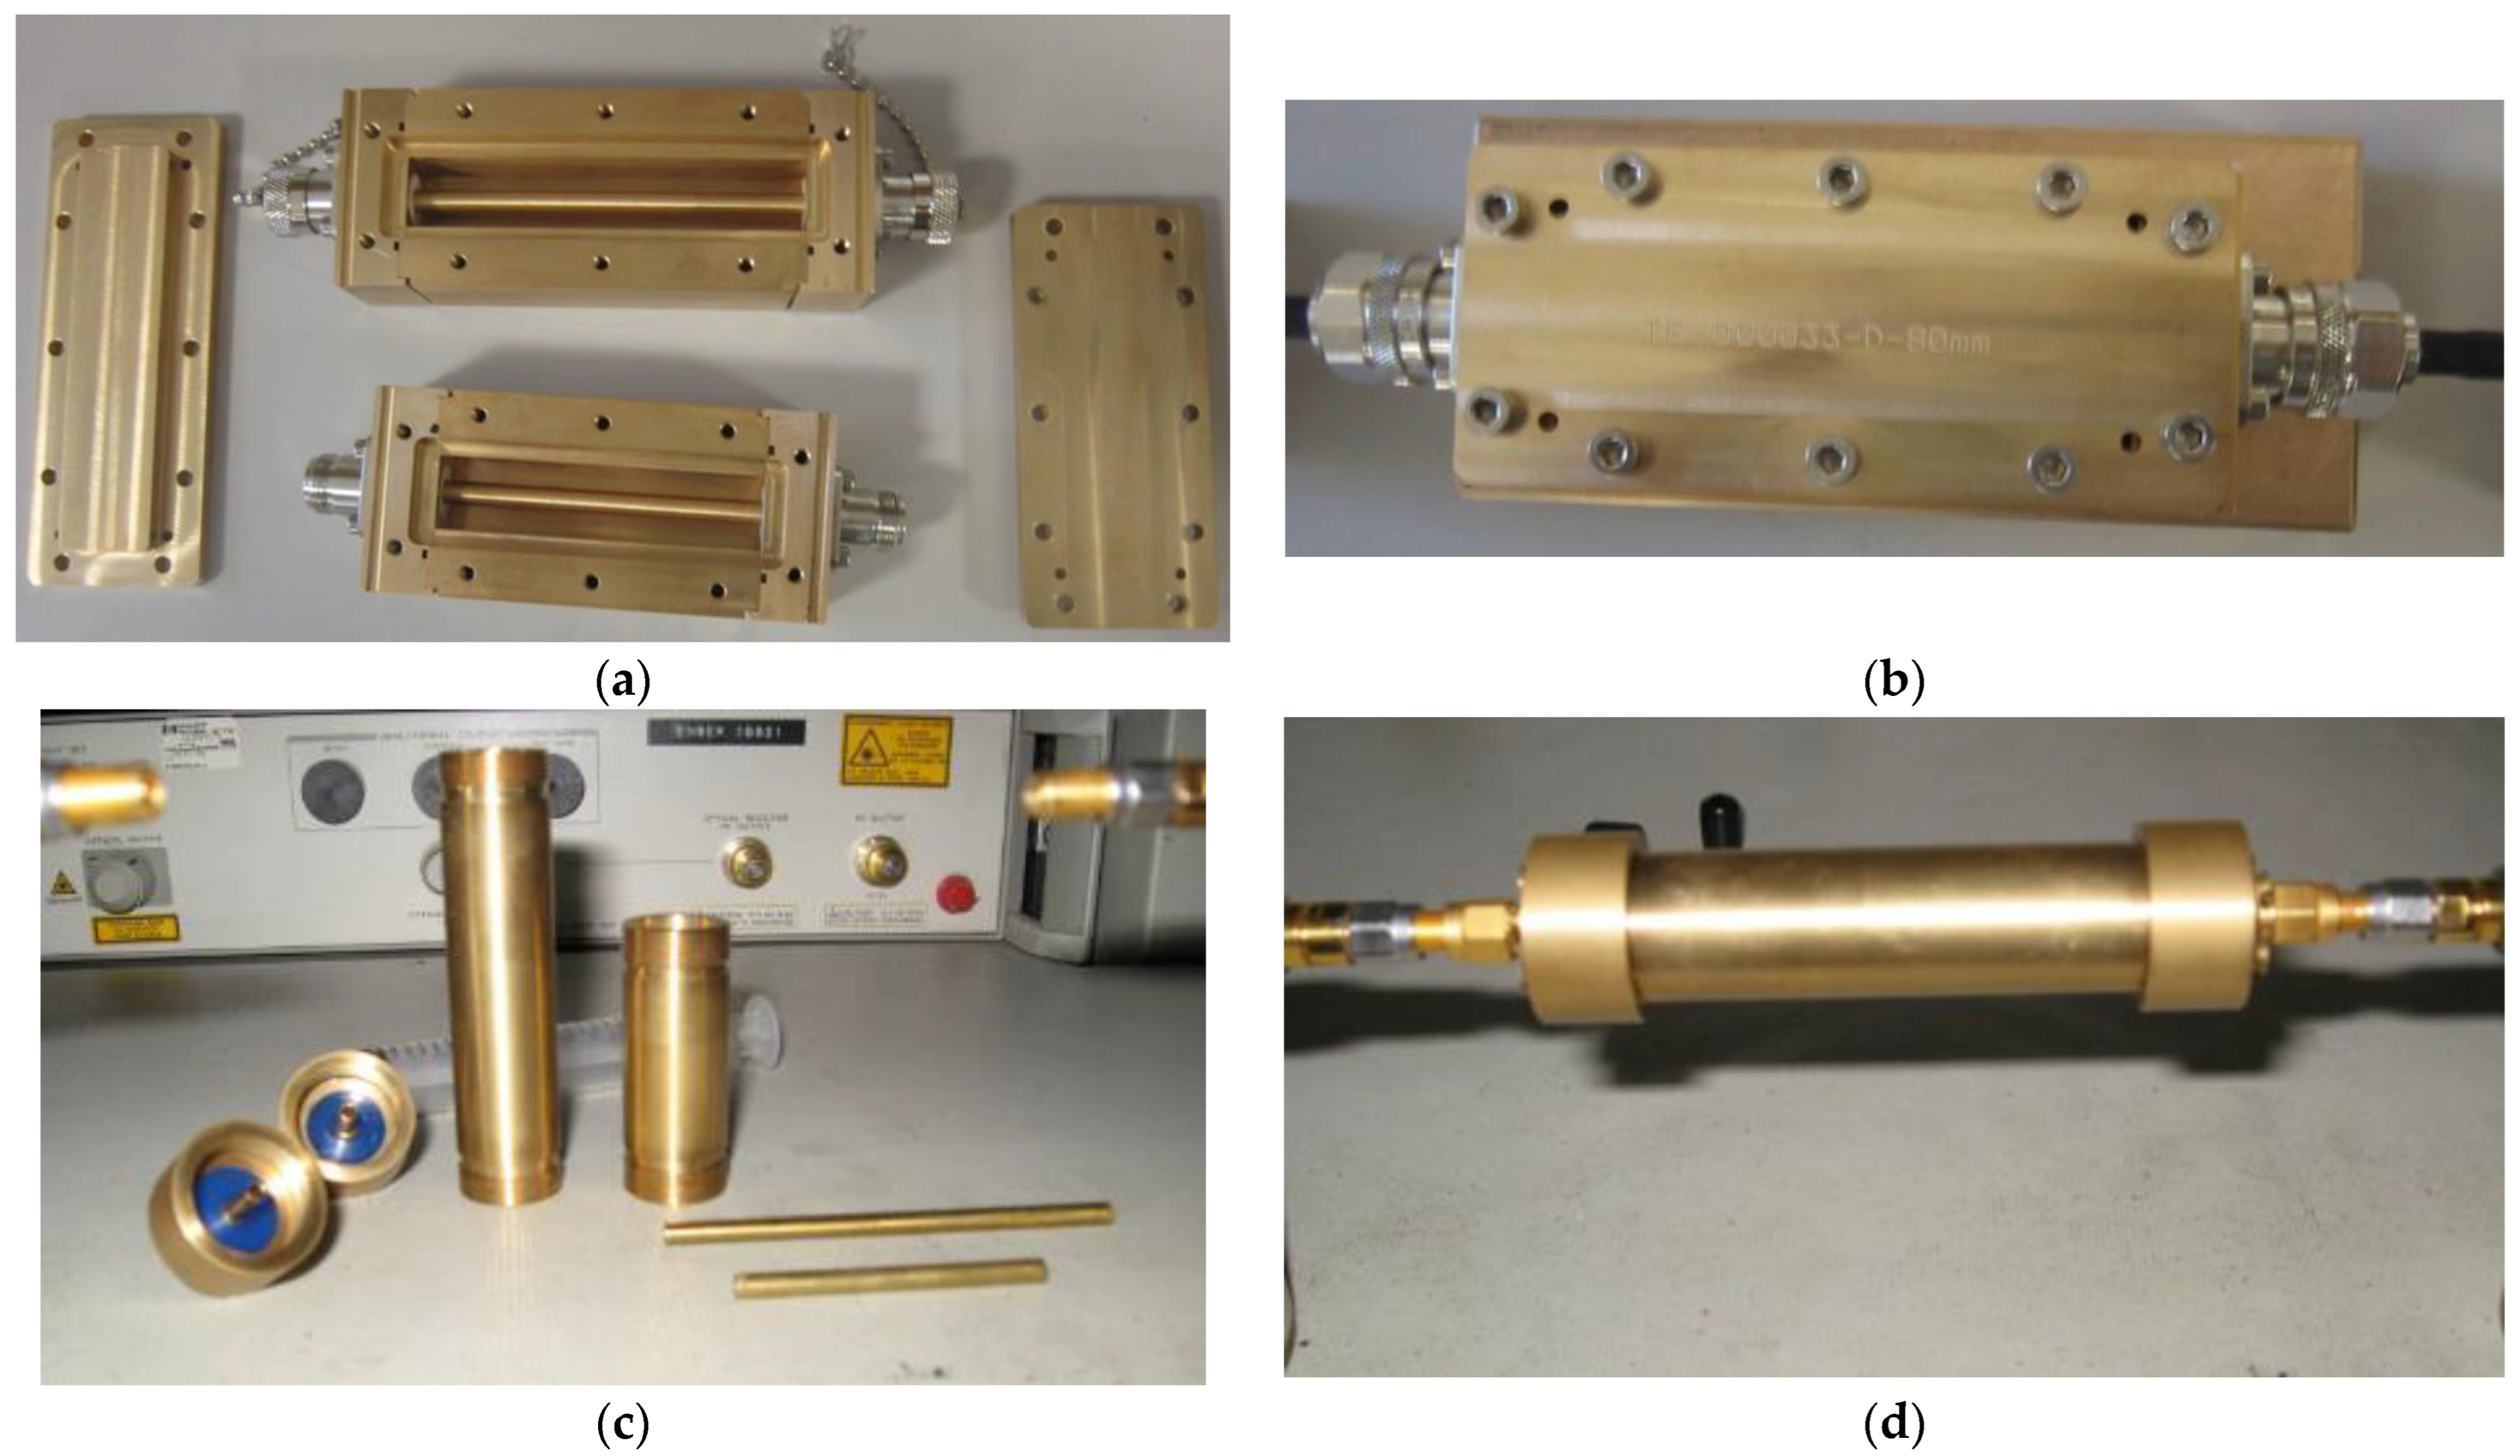
Two circular coaxial fixtures, manufacturer at Grenoble (France) were used for testing Q-Cell 5020 (ceramic powder), semolina and polenta (food), and aquarium sand (environment). In contrast, two other rectangle coaxial frames were used for PLA 100% and semi-flex 100% (3D-printing filament). As a result, the scanned frequency range was not the same for all of them. The validated experimental results were computed after measurements were taken with a vectorial network analyzer (VNA), Anritsu MS4642B. The Quasi-TEM (Q-TEM) mode was used to wave into the test cell. The phase constants and/or the electric lengths were linearized [46] to avoid the appearance of phase breaks, which were significant error sources. The five considered insulators were used through their specimens to extract the dielectric constant (DK) and DF material parameters. The rectangular and circular coaxial measurement fixtures are depicted in Figure 3.
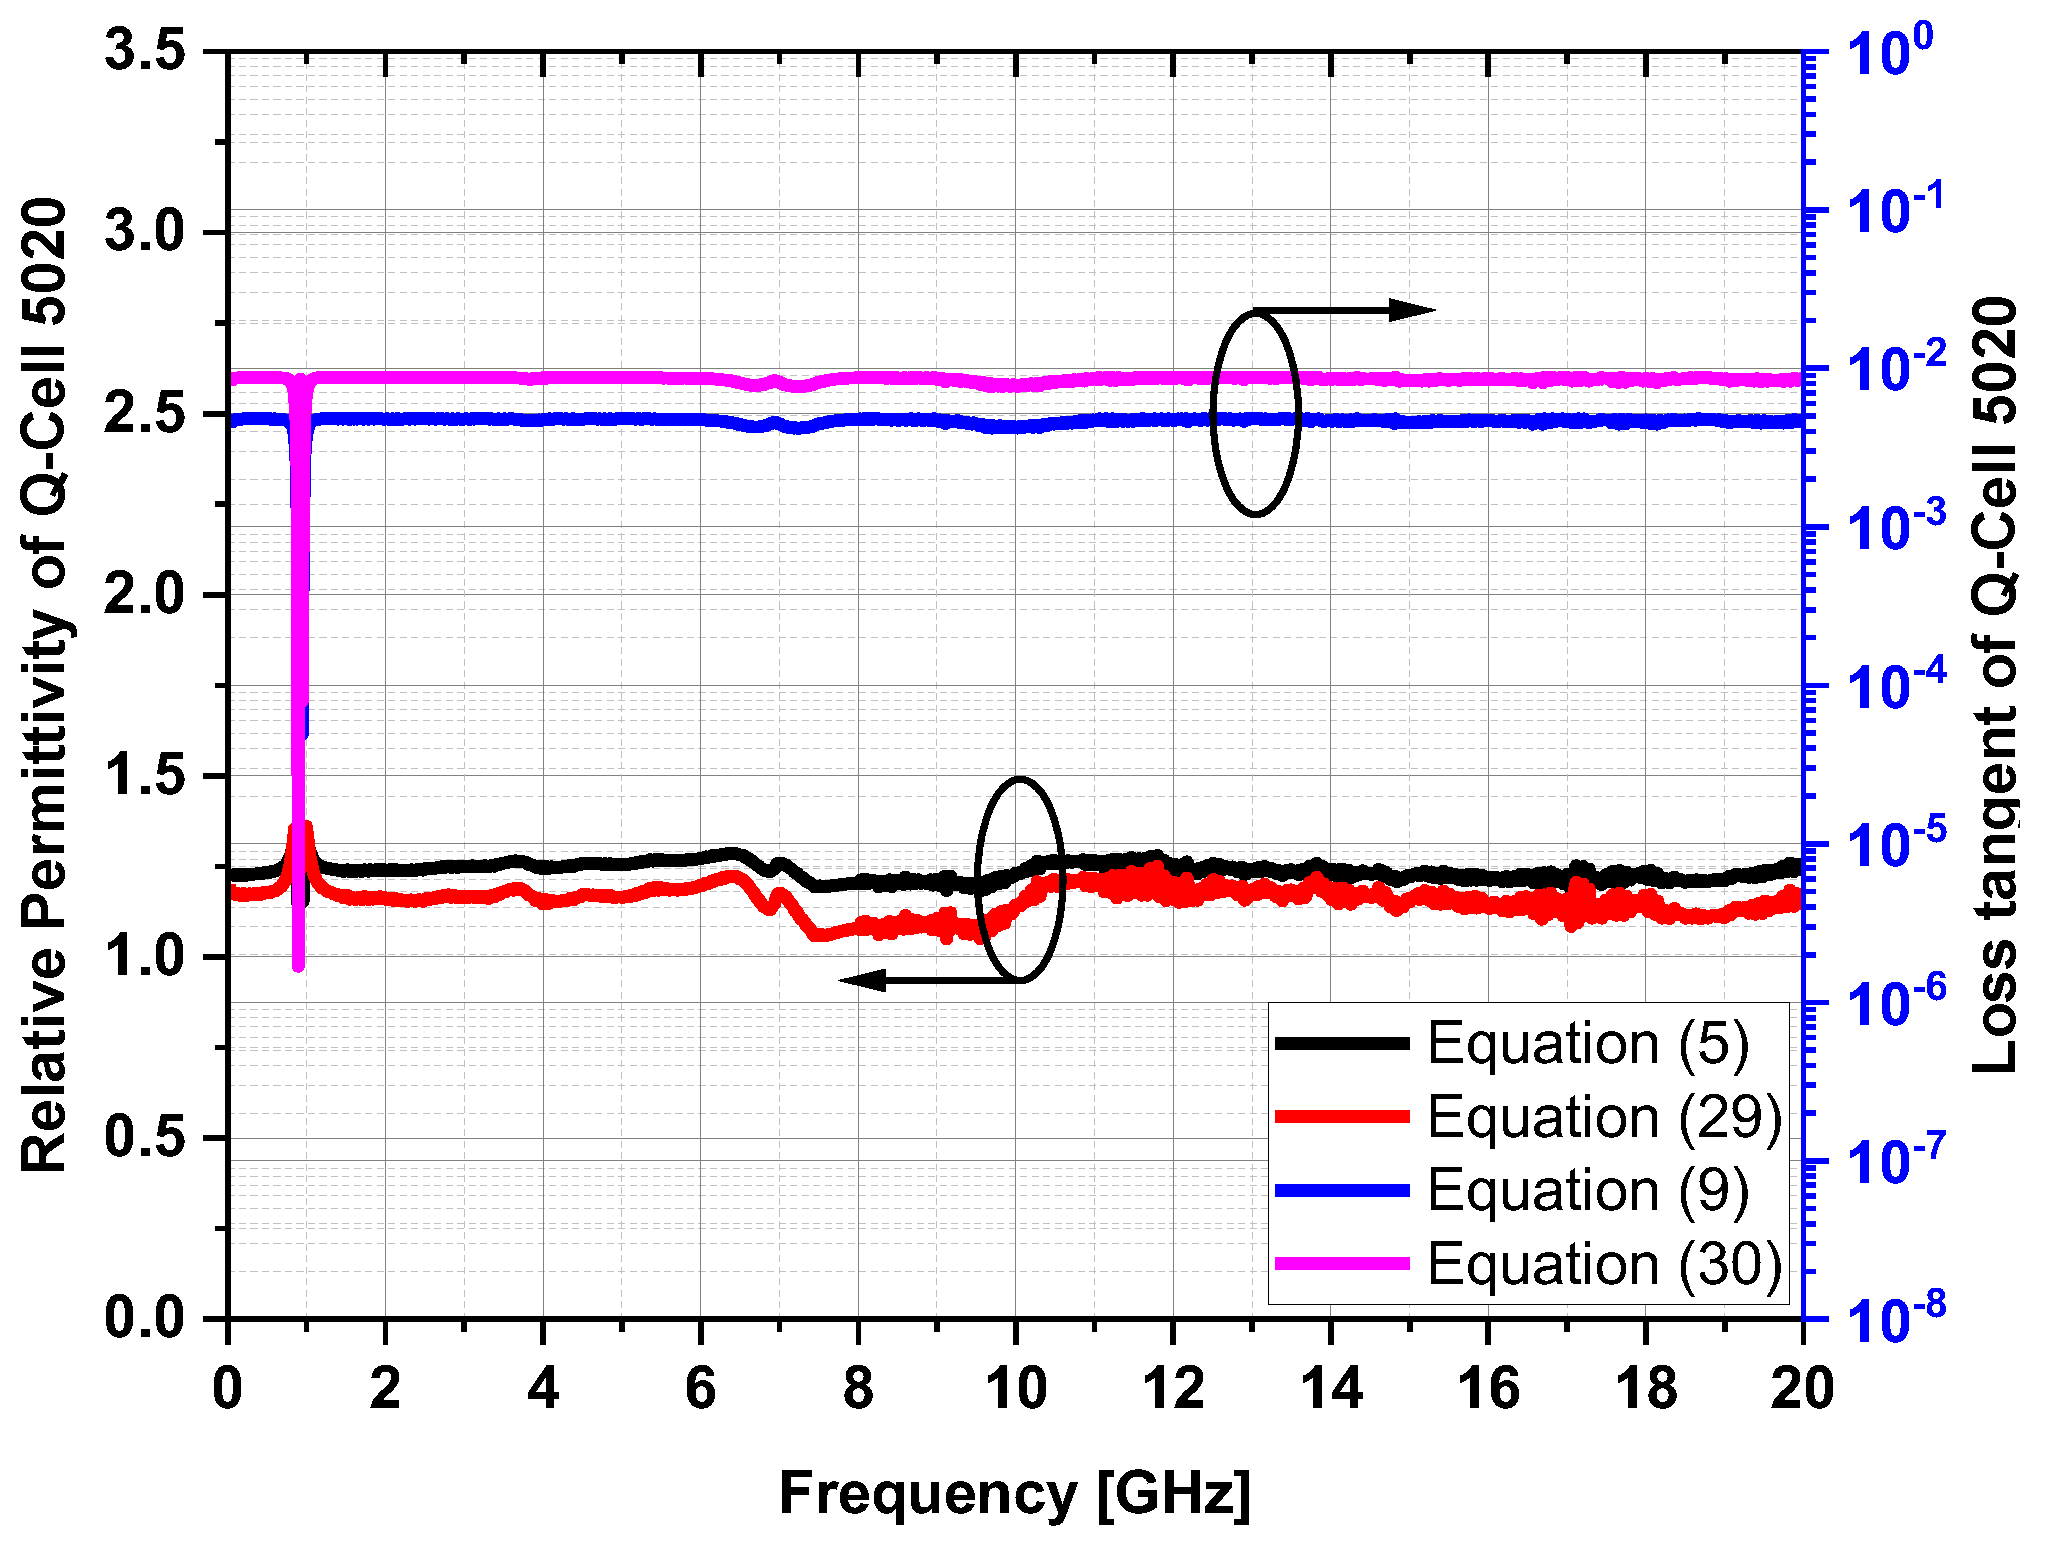
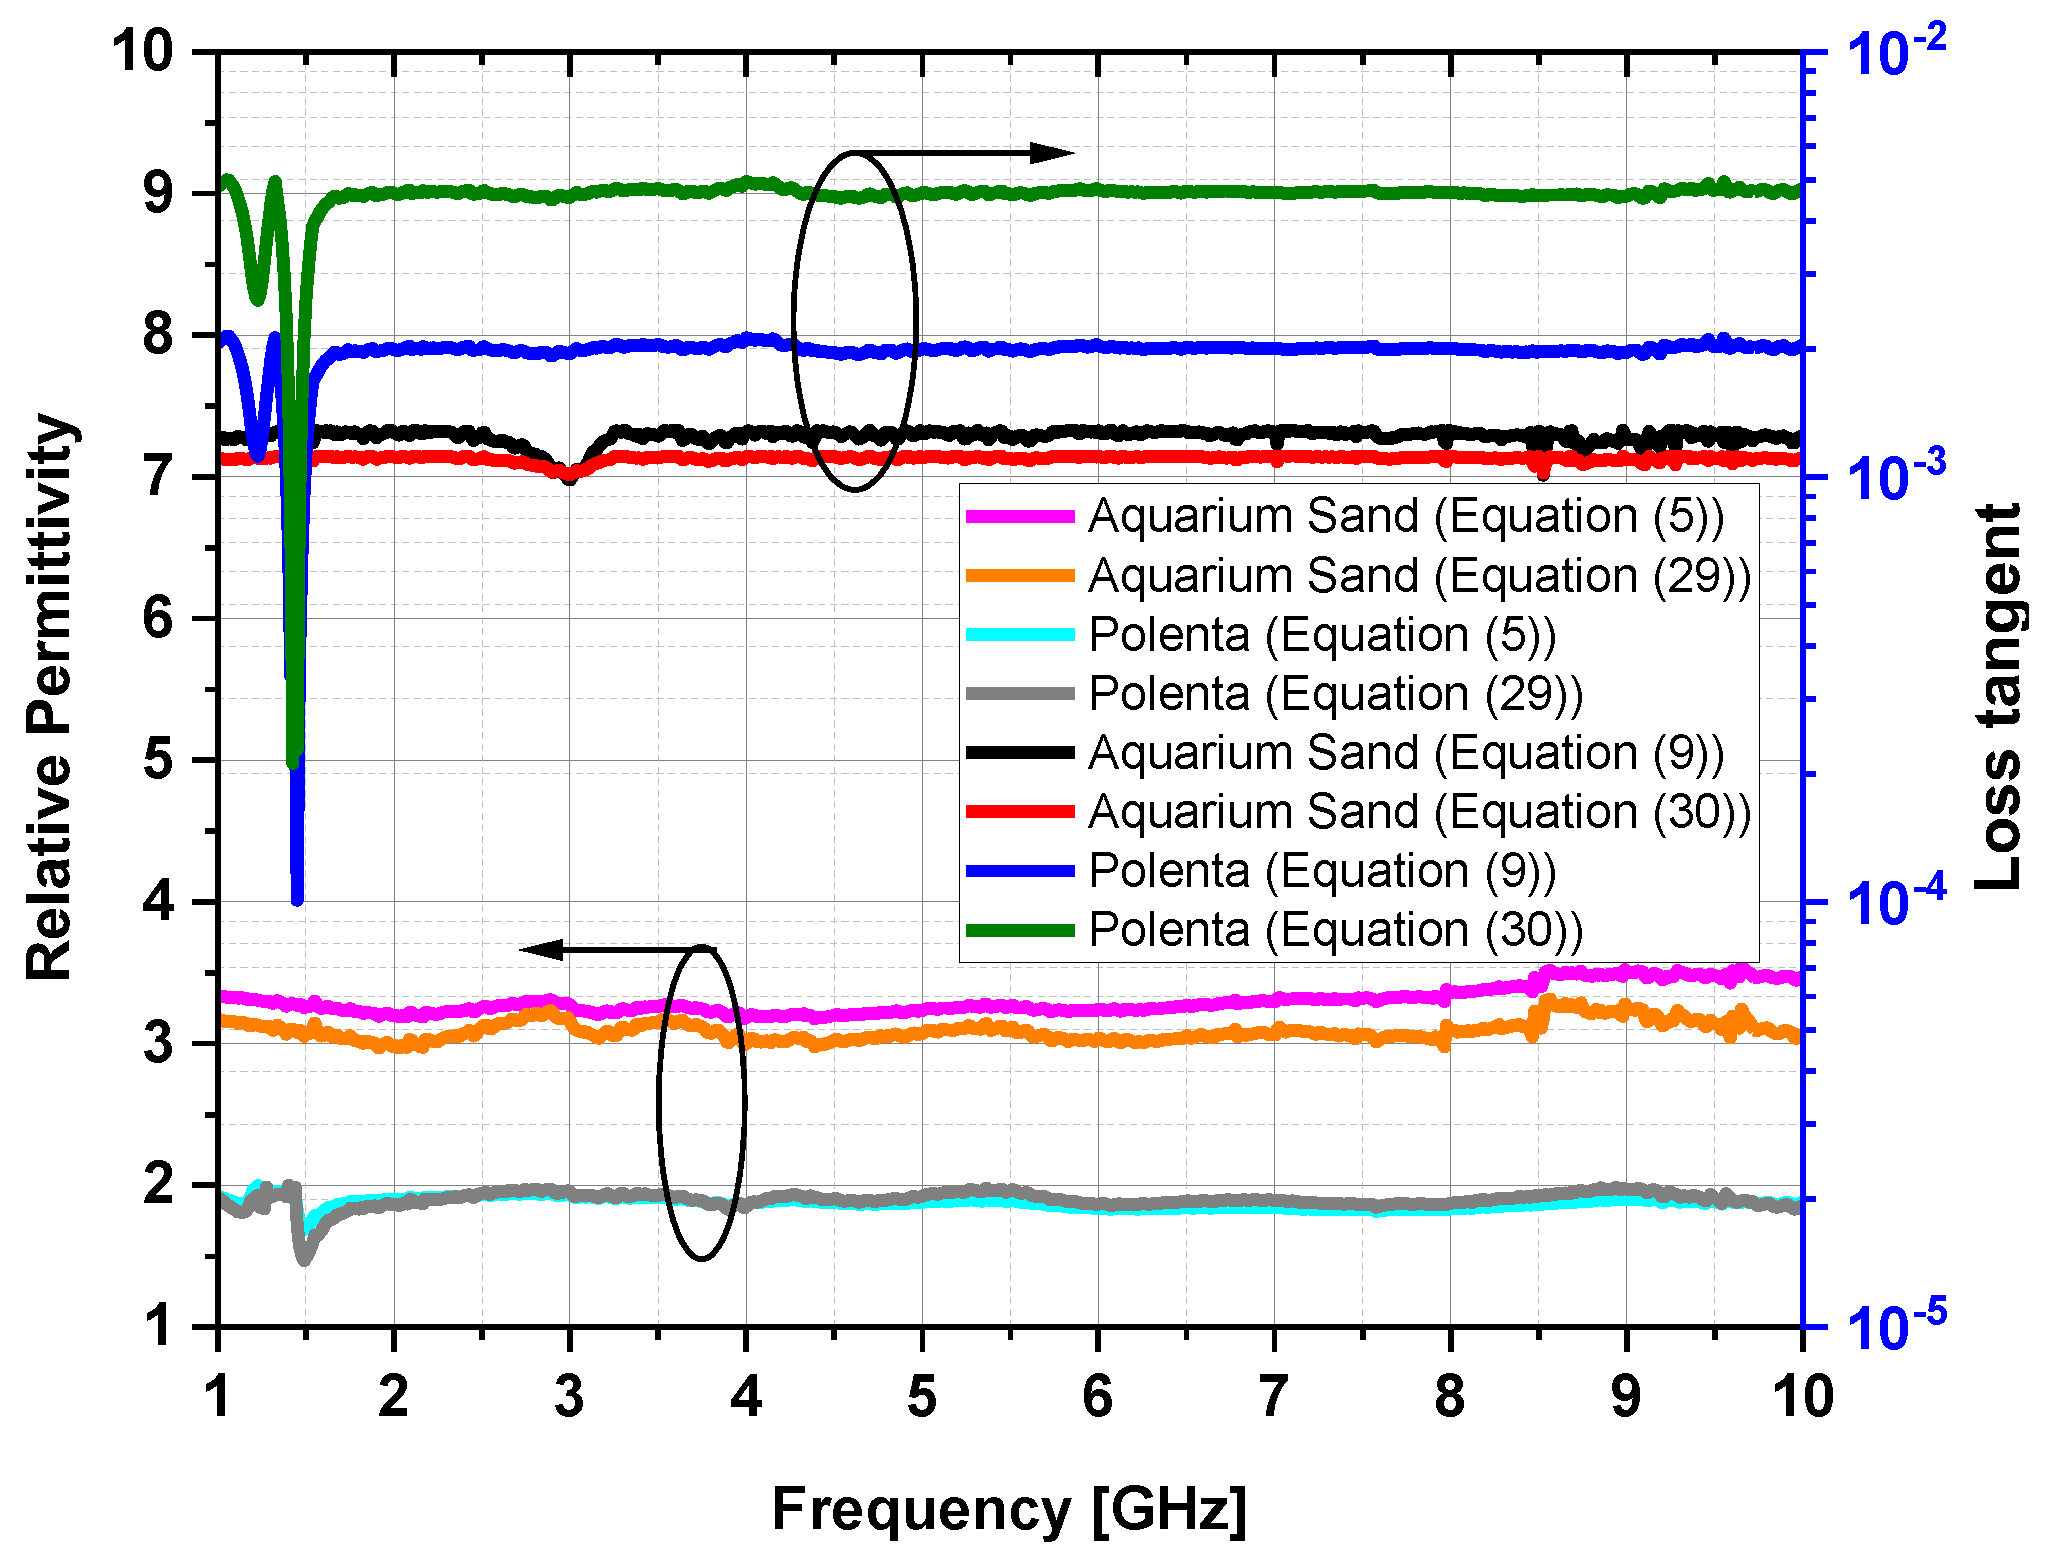
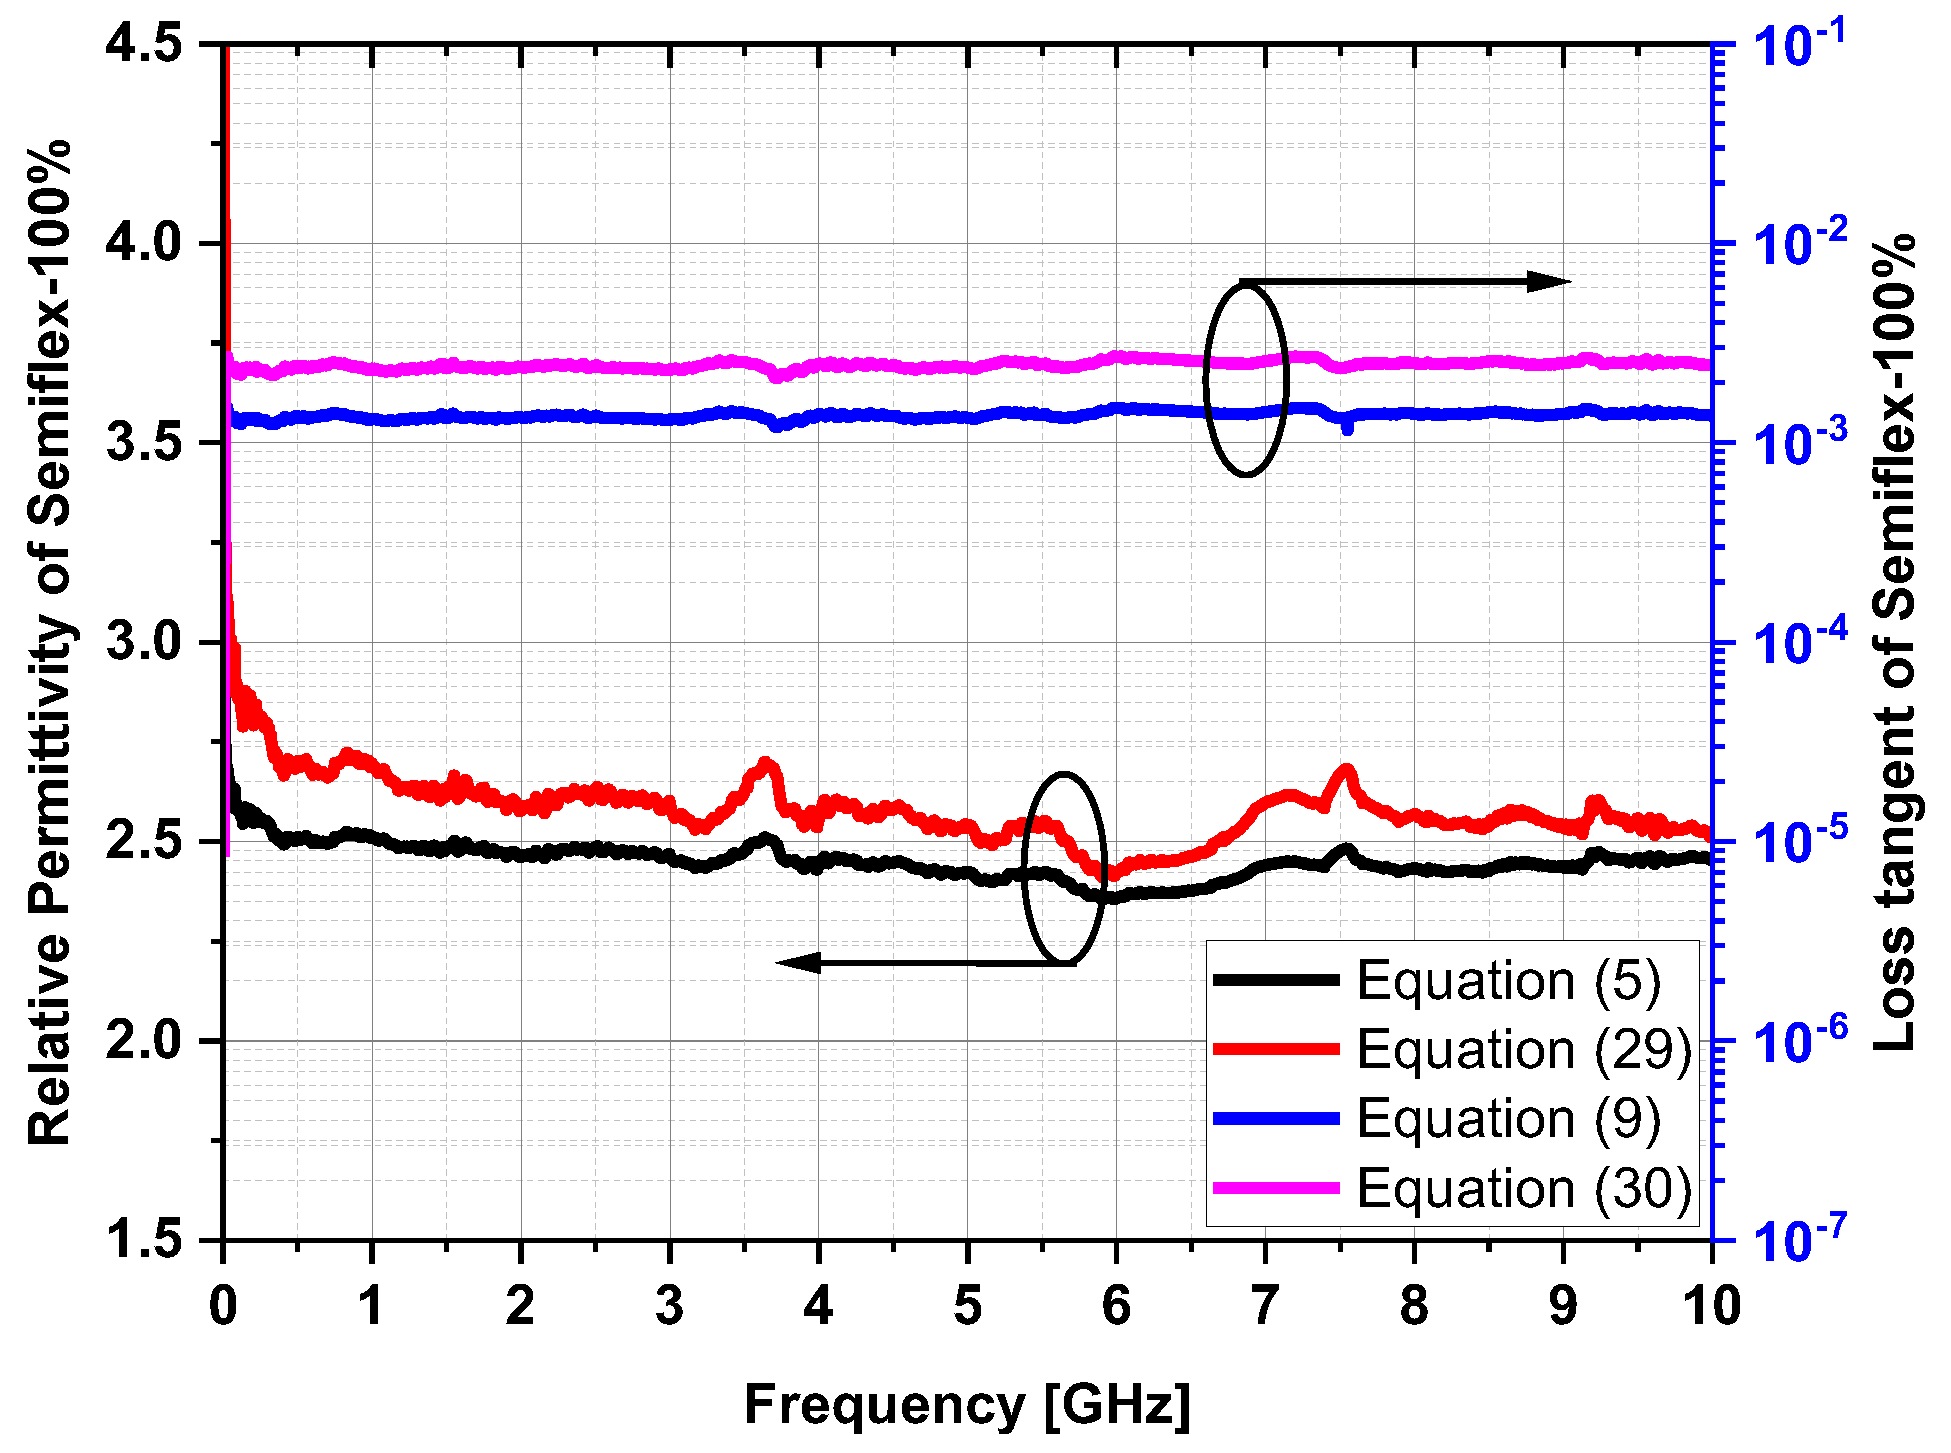
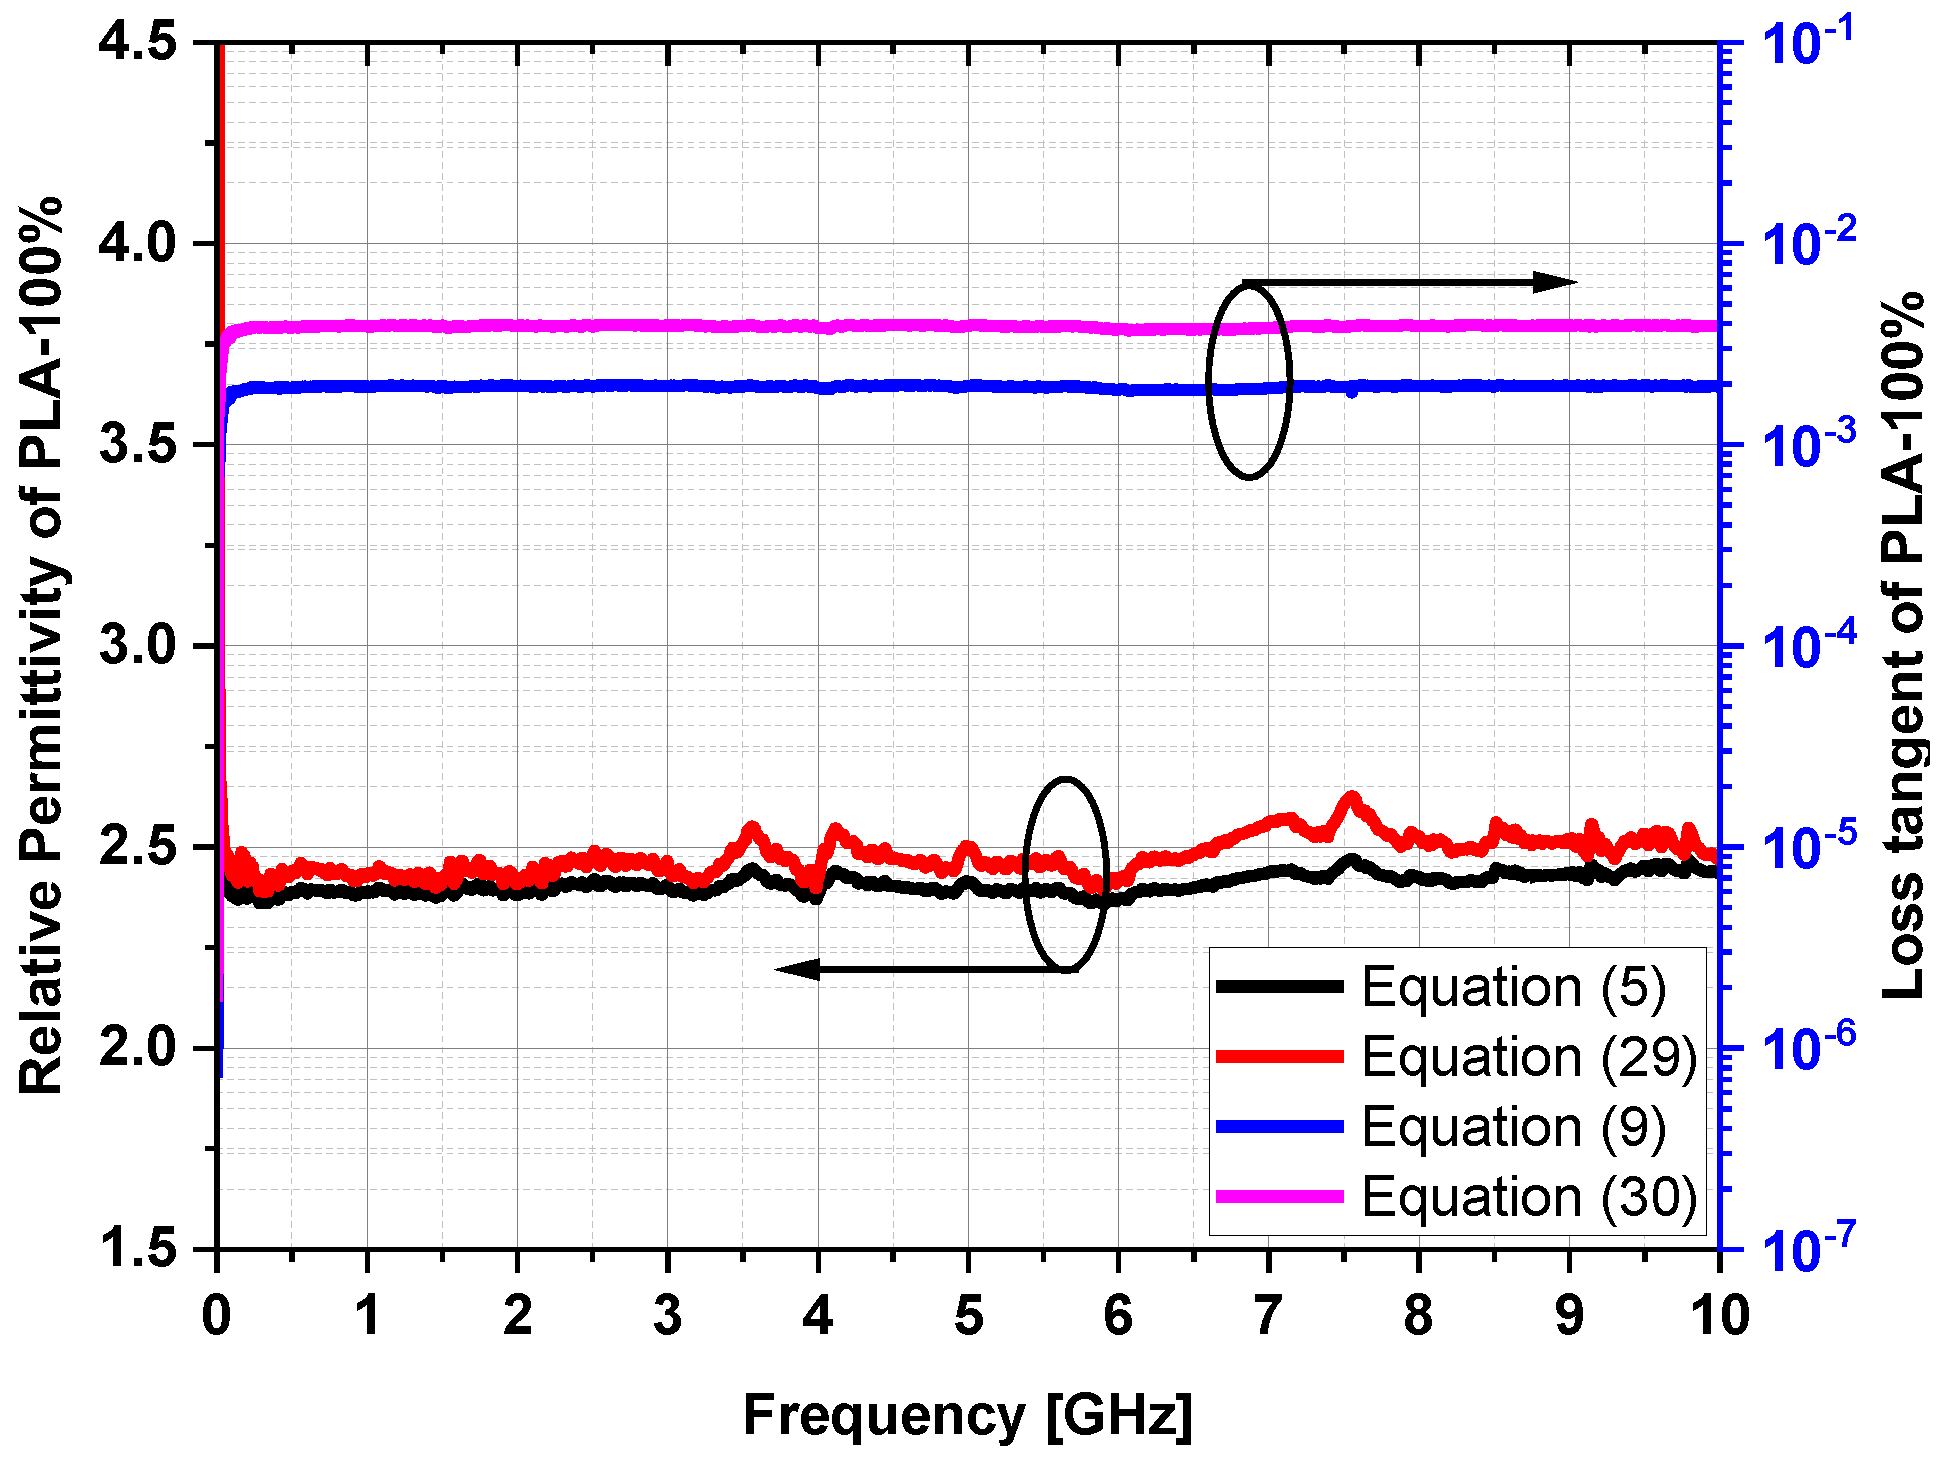
The experimental results are depicted in Figure 4, Figure 5, Figure 6, Figure 7, Figure 8, Figure 9 and Figure 10 for the six MUTs.
We sketched results from the proposed approach and compared them to those from the eigenvalues principle to highlight its advantages and drawbacks. It can be seen that all relative permittivity and loss tangent plots had a similar trend. Similarly, differences in the results were not significant. This indicates that both Equations (5) and (29) are almost equal, but Equation (29) shows improved behavior. The slight difference is the use of the characteristic impedance (which does not depend on the length), which conceptually keeps the same value in the entire frequency range. At the same time, the loss tangent expressions given in Equations (9) and (30) depend on a factor that is not necessarily equal to a fixed number, as shown in Equation (9). The loss tangent, computed from Equation (9), clearly depends on ( 1 + Z m Z v Z v Z m ) and moves according to the term of losses Z m Z v .
For the same test cell (circular coaxial), it can be seen that the relative permittivity and the correction coefficient X increased. However, at the same time, the a –coefficient decreased. As a consequence, it is observed in Table 1 that the correction coefficient X depends on the scanned frequency (in terms of the bandwidth and the considered number of points), the test cell, and its shape.
The relative permittivity uncertainty, using the eigenvalue principle, was presented in [45] by Equation (34) below:
Δ ε r = ( α m α v β v ) 2
In Table 2, all plotted values are the medium values of the full results in the considered frequency range. It is noticed that Δ ε r is lower when using the eigenvalue principle than the newly developed approach. This is because the correction causes the gap observed in the final results in the propagation constant, but not in the characteristic impedance. For instance, taking off Z v in Equation (7), and according to the Brews equation for Q-TEM mode, as mentioned in [47]:
Z m = Z m j Z v 2 ε r ( tan c tan d )
where tan δ c is the conductor loss tangent. Then, Equation (7) can be rewritten as follows:
Δ ε r ( c ) = α d 2 β v Z v Z m tan δ d
In the absence of the MUT, Equation (7) becomes the following:
Z v = Z v ( 1 j tan c 2 )
The vacuum is a reference material with no dissipation factor (DF) or loss tangent, as described by Equation (36). It can be observed from Equation (37) that the uncertainty Δ ε r ( c ) depends on a coefficient q = α d 2 β v Z v Z m and tan δ d . The corrected relative permittivity is at last given as:
ε r = ε r { 1 Δ ε r ( c ) ε r j tan δ d }
Table 3 compares the amended relative permittivity uncertainty from Equations (7) and (36).
Table 3 shows the excellent contribution of the new approach when Equation (36) is used. However, errors can be numerous when utilizing Equation (7). We finally note that the error levels in both techniques (use of the eigenvalue and the new approach) are identical. Moreover, the new approach has the advantage of using all materials (electric, magnetic, and magneto-electric). The measurements can be performed simultaneously with specific information from the characteristic impedance behavior.

4. Conclusions

We have modeled, developed, validated through experimental measures, and analyzed a new method that combines the secondary parameters of any waveguide. The propagation constant and the characteristic impedance constitute the transmission line’s secondary parameters. The approach from the propagation constant extraction has been thoroughly presented using the two-line technique’s eigenvalue principle and the characteristic impedance. Its enhancement through the correction of several parameters has been detailed to reach the primary goal. We have pointed out the importance of making corrections, especially to the relative permittivity definition and the uncertainty parameter. Mathematical modeling expression has been critical to the broadband extraction of the microwave domain’s dielectric constant (DK) and dielectric loss tangent (DF). The two test cell shapes (circular and rectangular coaxial) allowed for characterizing six sample materials: semolina, polenta, aquarium sand, semi-flex, PLA, and Q-Cell 5020. Some scanned a frequency range of 0.08–10 GHz, another reached 13.5 GHz, while the others covered an extensive frequency range up to 20 GHz. We observed differences in the scanned frequency, as the measurements were not taken simultaneously. Both fixtures were homogeneous, with lengths of 50 mm and 80 mm for the circular coaxial fixture and 80 mm and 100 mm for the rectangular coaxial fixture. The mathematical formulation helped to reduce the extraction parameter errors caused by the uncertainty term. This new proposed approach is a promising candidate for the use of any unknown material (electric, magnetic, or magneto-electric) with any two-conductor transmission line (stripline, coplanar, etc.).

Author Contributions

Conceptualization, F.M.M. and F.N.; methodology, F.M.M., G.F.B. and F.N.; software, F.M.M.; validation, F.M.M. and F.N.; formal analysis, F.M.M. and F.N.; investigation, F.M.M. and G.F.B.; resources, F.N.; data curation, F.M.M.; writing original draft preparation, F.M.M. and G.F.B.; writing—review and editing, F.M.M. and F.N.; visualization, F.M.M. and F.N.; supervision, F.N.; projection administration, F.M.M. All authors have read and agreed to the published version of the manuscript.

Funding

This research received no external funding.

Data Availability Statement

No new data were created or analyzed in this study. Data sharing is not applicable to this article.

Acknowledgments

The authors thank the anonymous reviewers for their significant contributions through the relevant criticisms to improve this work. In addition, we express our gratitude to those from the Electrical and Electronics Engineering Laboratory of Université Marien Ngouabi (UMNG), particularly MOUKALA MPELE for their multiform support during the elaboration of this work.

Conflicts of Interest

The authors declare no conflict of interest.

References

  1. Sergei, A.; Wang, X.; Tretyakov, S.A. Fast and Robust Characterization of Lossy Dielectric Slabs Using Rectangular Waveguides. IEEE Trans. Microw. Theory Technol. 2022, 70, 2341–2350. [Google Scholar] [CrossRef]
  2. Aydinalp, C.; Joof, S.; Dilman, I.; Akduman, I.; Yilmaz, T. Characterization of Open-Ended Coaxial Probe Sensing Depth with Respect to Aperture Size for Dielectric Property Measurement of Heterogeneous Tissues. Sensors 2022, 22, 760. [Google Scholar] [CrossRef] [PubMed]
  3. Wang, C.; Liu, X.; Gan, L.; Cai, Q. A Dual-Band Non-destructive Dielectric Measurement Sensor Based on Complementary Split-Ring Resonator. Front. Phys. 2021, 9, 669707. [Google Scholar] [CrossRef]
  4. Severo, S.L.S.; De Salles, Á.A.A.; Nervis, B.; Zanini, B.K. Non-Resonant Permittivity Measurement Methods. J. Microwaves Optoelectron. Electromagn. Appl. 2017, 16, 297–311. [Google Scholar] [CrossRef] [Green Version]
  5. Sawant, S.S.; Yao, Z.; Jambunathan, R.; Nonaka, A. Characterization of Transmission Lines in Microelectronics Circuits using the ARTEMIS Solver. J. Comput. Phys. 2022. [Google Scholar] [CrossRef]
  6. Kellermeier, M.; Lemery, F.; Floettmann, K.; Hillert, W.; Aßmann, R. Self-Calibration Technique for Characterization of Integrated THz Waveguides. Phys. Rev. Accel. Beams 2021, 24, 122001. [Google Scholar] [CrossRef]
  7. Riaz, M.; Kanwal, N. An Improved Parallel Plate Capacitor Apparatus for the Estimation of Dielectric Constants of Solid Materials. Eur. J. Phys. 2019, 40, 025502. [Google Scholar] [CrossRef]
  8. Phillips, J.; Roman, A. Understanding Dielectrics: Impact of External Salt Water Bath. Materials 2019, 12, 2033. [Google Scholar] [CrossRef] [Green Version]
  9. Maleki, M.; Mohseni Armaki, S.H.; Hamidi, E. Study of Ferrite Material Characterization using Transmission Line Model. Microw. Opt. Technol. Lett. 2018, 60, 2876–2880. [Google Scholar] [CrossRef]
  10. Szulim, P.; Gontarz, S. Extraction of Magnetic Field Features to Determine the Degree of Material Strain. Materials 2021, 14, 1576. [Google Scholar] [CrossRef]
  11. Cho, K.; Jo, S.; Noh, Y.-H.; Lee, N.; Kim, S.; Yook, J.-G. Complex Permittivity Measurements of Steel Fiber-Reinforced Cementitious Composites Using a Free-Space Reflection Method with a Focused Beam Lens Horn Antenna. Sensors 2021, 21, 7789. [Google Scholar] [CrossRef] [PubMed]
  12. Gonçalves, F.J.F.; Pinto, A.G.M.; Mesquita, R.C.; Silva, E.J.; Brancaccio, A. Free-Space Materials Characterization by Reflection and Transmission Measurements Using Frequency-by-Frequency and Multi-Frequency Algorithms. Electronics 2018, 7, 260. [Google Scholar] [CrossRef] [Green Version]
  13. Mazaheri, Z.; Koral, C.; Andreone, A. Accurate THz Ellipsometry using Calibration in Time Domain. Sci. Rep. 2022, 12, 7342. [Google Scholar] [CrossRef] [PubMed]
  14. Vohra, N.; El-shenawee, M. K- and W- Band Free-Space Characterizations of Highly Conductive Radar Absorbing Materials. IEEE Trans. Instrum. Meas. 2021, 70, 8001910. [Google Scholar] [CrossRef]
  15. Xing, L.; Zhu, J.; Xu, Q.; Zhao, Y.; Song, C.; Huang, Y. Generalised Probe Method to Measure the Liquid Complex Permittivity. IET Microw. Antennas Propag. 2020, 14, 707–711. [Google Scholar] [CrossRef]
  16. Bowler, N. Four-Point Potential Drop Measurements for Materials Characterization. Meas. Sci. Technol. 2010, 22, 012001. [Google Scholar] [CrossRef]
  17. Wu, M.; Yao, X.; Zhang, L. An Improved Coaxial Probe Technique for Measuring Microwave Permittivity of Thin Dielectric Materials. Meas. Sci. Technol. 2000, 11, 1617–1622. [Google Scholar] [CrossRef]
  18. Wang, X.; Guo, H.; Zhou, C.; Bai, J. High-resolution probe design for measuring the dielectric properties of human tissues. Biomed. Eng. Online 2021, 20, 86. [Google Scholar] [CrossRef]
  19. Williams, D.F.; Marks, R.B. Accurate Transmission Line Characterization. IEEE Microw. Guid. Wave Lett. 1993, 3, 247–249. [Google Scholar] [CrossRef]
  20. Pérez-Escribano, M.; Márquez-segura, E. Parameters Characterization of Dielectric Materials Samples in Microwave and Millimeter-Wave Bands. IEEE Trans. Microw. Theory Technol. 2021, 69, 1723–1732. [Google Scholar] [CrossRef]
  21. Huber, O.; Faseth, T.; Magerl, G.; Arthaber, H. Dielectric Characterization of RF-Printed Circuit Board Materials by Microstrip Transmission Lines and Conductor-Backed Coplanar Waveguides Up to 110 GHz. IEEE Trans. Microw. Theory Technol. 2018, 66, 237–244. [Google Scholar] [CrossRef]
  22. Steiner, C.; Walter, S.; Malashchuk, V.; Hagen, G.; Kogut, I.; Fritze, H.; Moos, R. Determination of the Dielectric Properties of Storage Materials for Exhaust Gas Aftertreatment Using the Microwave Cavity Perturbation Method. Sensors 2020, 20, 6024. [Google Scholar] [CrossRef] [PubMed]
  23. Kumar, A.; Sharma, S. Measurement of Dielectric and Loss Factor of the Dielectric Material at Microwave Frequencies. Prog. Electromagn. Res. 2007, 69, 47–54. [Google Scholar] [CrossRef] [Green Version]
  24. Kombolias, M.; Obrzut, J.; Postek, M.T.; Poster, D.L.; Obeng, Y.S. Method Development for Contactless Resonant Cavity Dielectric Spectroscopic Studies of Cellulosic Paper. Anal. Lett. 2020, 53, 424–435. [Google Scholar] [CrossRef]
  25. Saf, O.; Erol, H.; Erkin, A. A Method for Material Characterization of Sealing System Elastomers using Sound Transmission Loss Measurements. Polym. Test. 2022, 111, 107618. [Google Scholar] [CrossRef]
  26. Bartley, P.G.; Begley, S.B. A New Free-Space Calibration Technique for Materials Measurement. In Proceedings of the 2012 IEEE International Instrumentation and Measurement Technology Conference Proceedings, Graz, Austria, 13–16 May 2012; pp. 1–5. [Google Scholar] [CrossRef]
  27. Yong, S.; Khilkevich, V.; Liu, Y.; Gao, H.; Hinaga, S.; De, S.; Padilla, D.; Yanagawa, D.; Drewniak, J. Dielectric Loss Tangent Extraction Using Modal Measurements and 2-D Cross-Sectional Analysis for Multilayer PCBs. IEEE Trans. Electromagn. Compat. 2020, 62, 1278–1292. [Google Scholar] [CrossRef]
  28. Noel, H.; Lovera, M.; Luis, J.; Cervantes, O.J.-L.; Perez-Ramos, A.-E.; Corona-Chavez, A.; Saavedra, C.E. Microstrip Sensor and Methodology for the Determination of Complex Anisotropic Permittivity using Perturbation Techniques. Sci. Rep. 2022, 12, 2205. [Google Scholar] [CrossRef]
  29. Pozar, D.M. Microwave Engineering, 4th ed.; Wiley: Hoboken, NJ, USA, 2012; ISBN 978-0-470-63155-3. [Google Scholar]
  30. M’Pemba, J.E.D.; Bouesse, G.F.; Moukanda Mbango, F.; M’Passi-Mabiala, B. Probes in Transmission with Material Variable Thicknesses to Extract the Material Complex Relative Permittivity in 1.7–3 GHz. Meas. Sens. 2022, 20–21, 100369. [Google Scholar] [CrossRef]
  31. Lountala, M.G.; Moukanda Mbango, F.; Ndagijimana, F.; Lilonga-Boyenga, D. Movable short-circuit technique to extract the relative permittivity of materials from a coaxial cell. J. Meas. Eng. 2019, 7, 183–194. [Google Scholar] [CrossRef]
  32. Moukanda Mbango, F.; M’Pemba, J.E.D.; Ndagijimana, F.; M’Passi-Mabiala, B. Use of Two Open-Terminated Coaxial Transmission-Lines Technique to Extract the Material Relative Intrinsic Parameters. IEEE Access 2020, 8, 138682–138689. [Google Scholar] [CrossRef]
  33. Orend, K.; Baer, C.; Musch, T. A Compact Measurement Setup for Material Characterization in W-Band Based on Dielectric Waveguides. Sensors 2022, 22, 5972. [Google Scholar] [CrossRef] [PubMed]
  34. Al Takach, A.; Moukanda Mbango, F.; Ndagijimana, F.; Al-Husseini, M.; Jomaah, J. Two-Line Technique for Dielectric Material Characterization With Application in 3D-Printing Filament Electrical Parameters Extraction. Prog. Electromagn. Res. M 2019, 85, 195–207. [Google Scholar] [CrossRef] [Green Version]
  35. Reynoso-Hernández, J.A. Unified Method for Determining the Complex Propagation Constant of Reflecting and Nonreflecting Transmission Lines. IEEE Microw. Wirel. Components Lett. 2003, 13, 351–353. [Google Scholar] [CrossRef]
  36. Ghione, G.; Pirola, M. Microwave Electronics: Measurement and Materials Characterization; John Wiley & Sons: Hoboken, NJ, USA, 2017; ISBN 9781316756171. [Google Scholar]
  37. Costa, F.; Borgese, M.; Degiorgi, M.; Monorchio, A. Electromagnetic Characterisation of Materials by Using Transmission/Reflection (T/R) Devices. Electronics 2017, 6, 95. [Google Scholar] [CrossRef] [Green Version]
  38. Farcich, N.J.; Salonen, J.; Asbeck, P.M. Single-Length Method Used to Determine the Dielectric Constant of Polydimethylsiloxane. IEEE Trans. Microw. Theory Technol. 2008, 56, 2963–2971. [Google Scholar] [CrossRef]
  39. Lu, Z.; Lanagan, M.; Manias, E.; MacDonald, D.D. Two-Port Transmission line Technique for Dielectric Property Characterization of Polymer Electrolyte Membranes. J. Phys. Chem. B 2009, 113, 13551–13559. [Google Scholar] [CrossRef] [PubMed]
  40. Sun, J.; Lucyszyn, S. Extracting Complex Dielectric Properties from Reflection-Transmission Mode Spectroscopy. IEEE Access 2018, 6, 8302–8321. [Google Scholar] [CrossRef]
  41. Wadell, B.C. Transmission Line Design Handbook; Artech House: Norwood, MA, USA, 1991; ISBN 0-96006-436-9. [Google Scholar]
  42. Hasar, U.C.; Kaya, Y.; Ozturk, G.; Ertugrul, M. Propagation Constant Measurements of Reflection-Asymmetric and Nonreciprocal Microwave Networks From S-Parameters Without Using a Reflective Standard. Measurement 2020, 165, 108126. [Google Scholar] [CrossRef]
  43. Papio Toda, A.; De Flaviis, F. 60-GHz Substrate Materials Characterization Using the Covered Transmission-Line Method. IEEE Trans. Microw. Theory Technol. 2015, 63, 1063–1075. [Google Scholar] [CrossRef]
  44. Caspers, F. RF engineering basic concepts: S-parameters. arXiv 2012, arXiv:1201.2346. [Google Scholar]
  45. Moukanda Mbango, F.; Al Takach, A.; Ndagijimana, F. Complex Relative Permittivity Extraction Technique of Biotechnology Materials in Microwaves Domain. Int. J. Electron. Commun. Instrum. Eng. Res. Dev. 2019, 9, 33–42. [Google Scholar] [CrossRef]
  46. Moukanda Mbango, F.; Lountala, M.G.; MPemba, E.J.D.; Ndagijimana, F.; Lilonga-Boyenga, D.; MPassi-Mabiala, B. Comparison of Materials Characterization Methods Using One-Port and Two-Port Transmission Line Principles. Int. J. Eng. Appl. 2021, 9, 370–381. [Google Scholar] [CrossRef]
  47. Moukanda Mbango, F. Contribution à la Caractérisation Electrique des Matériaux Utilisés en Microélectronique RadioFréquence. Ph.D. Thesis, Université Joseph-Fourier, Saint-Martin-d’Hères, France, 2008. [Google Scholar]
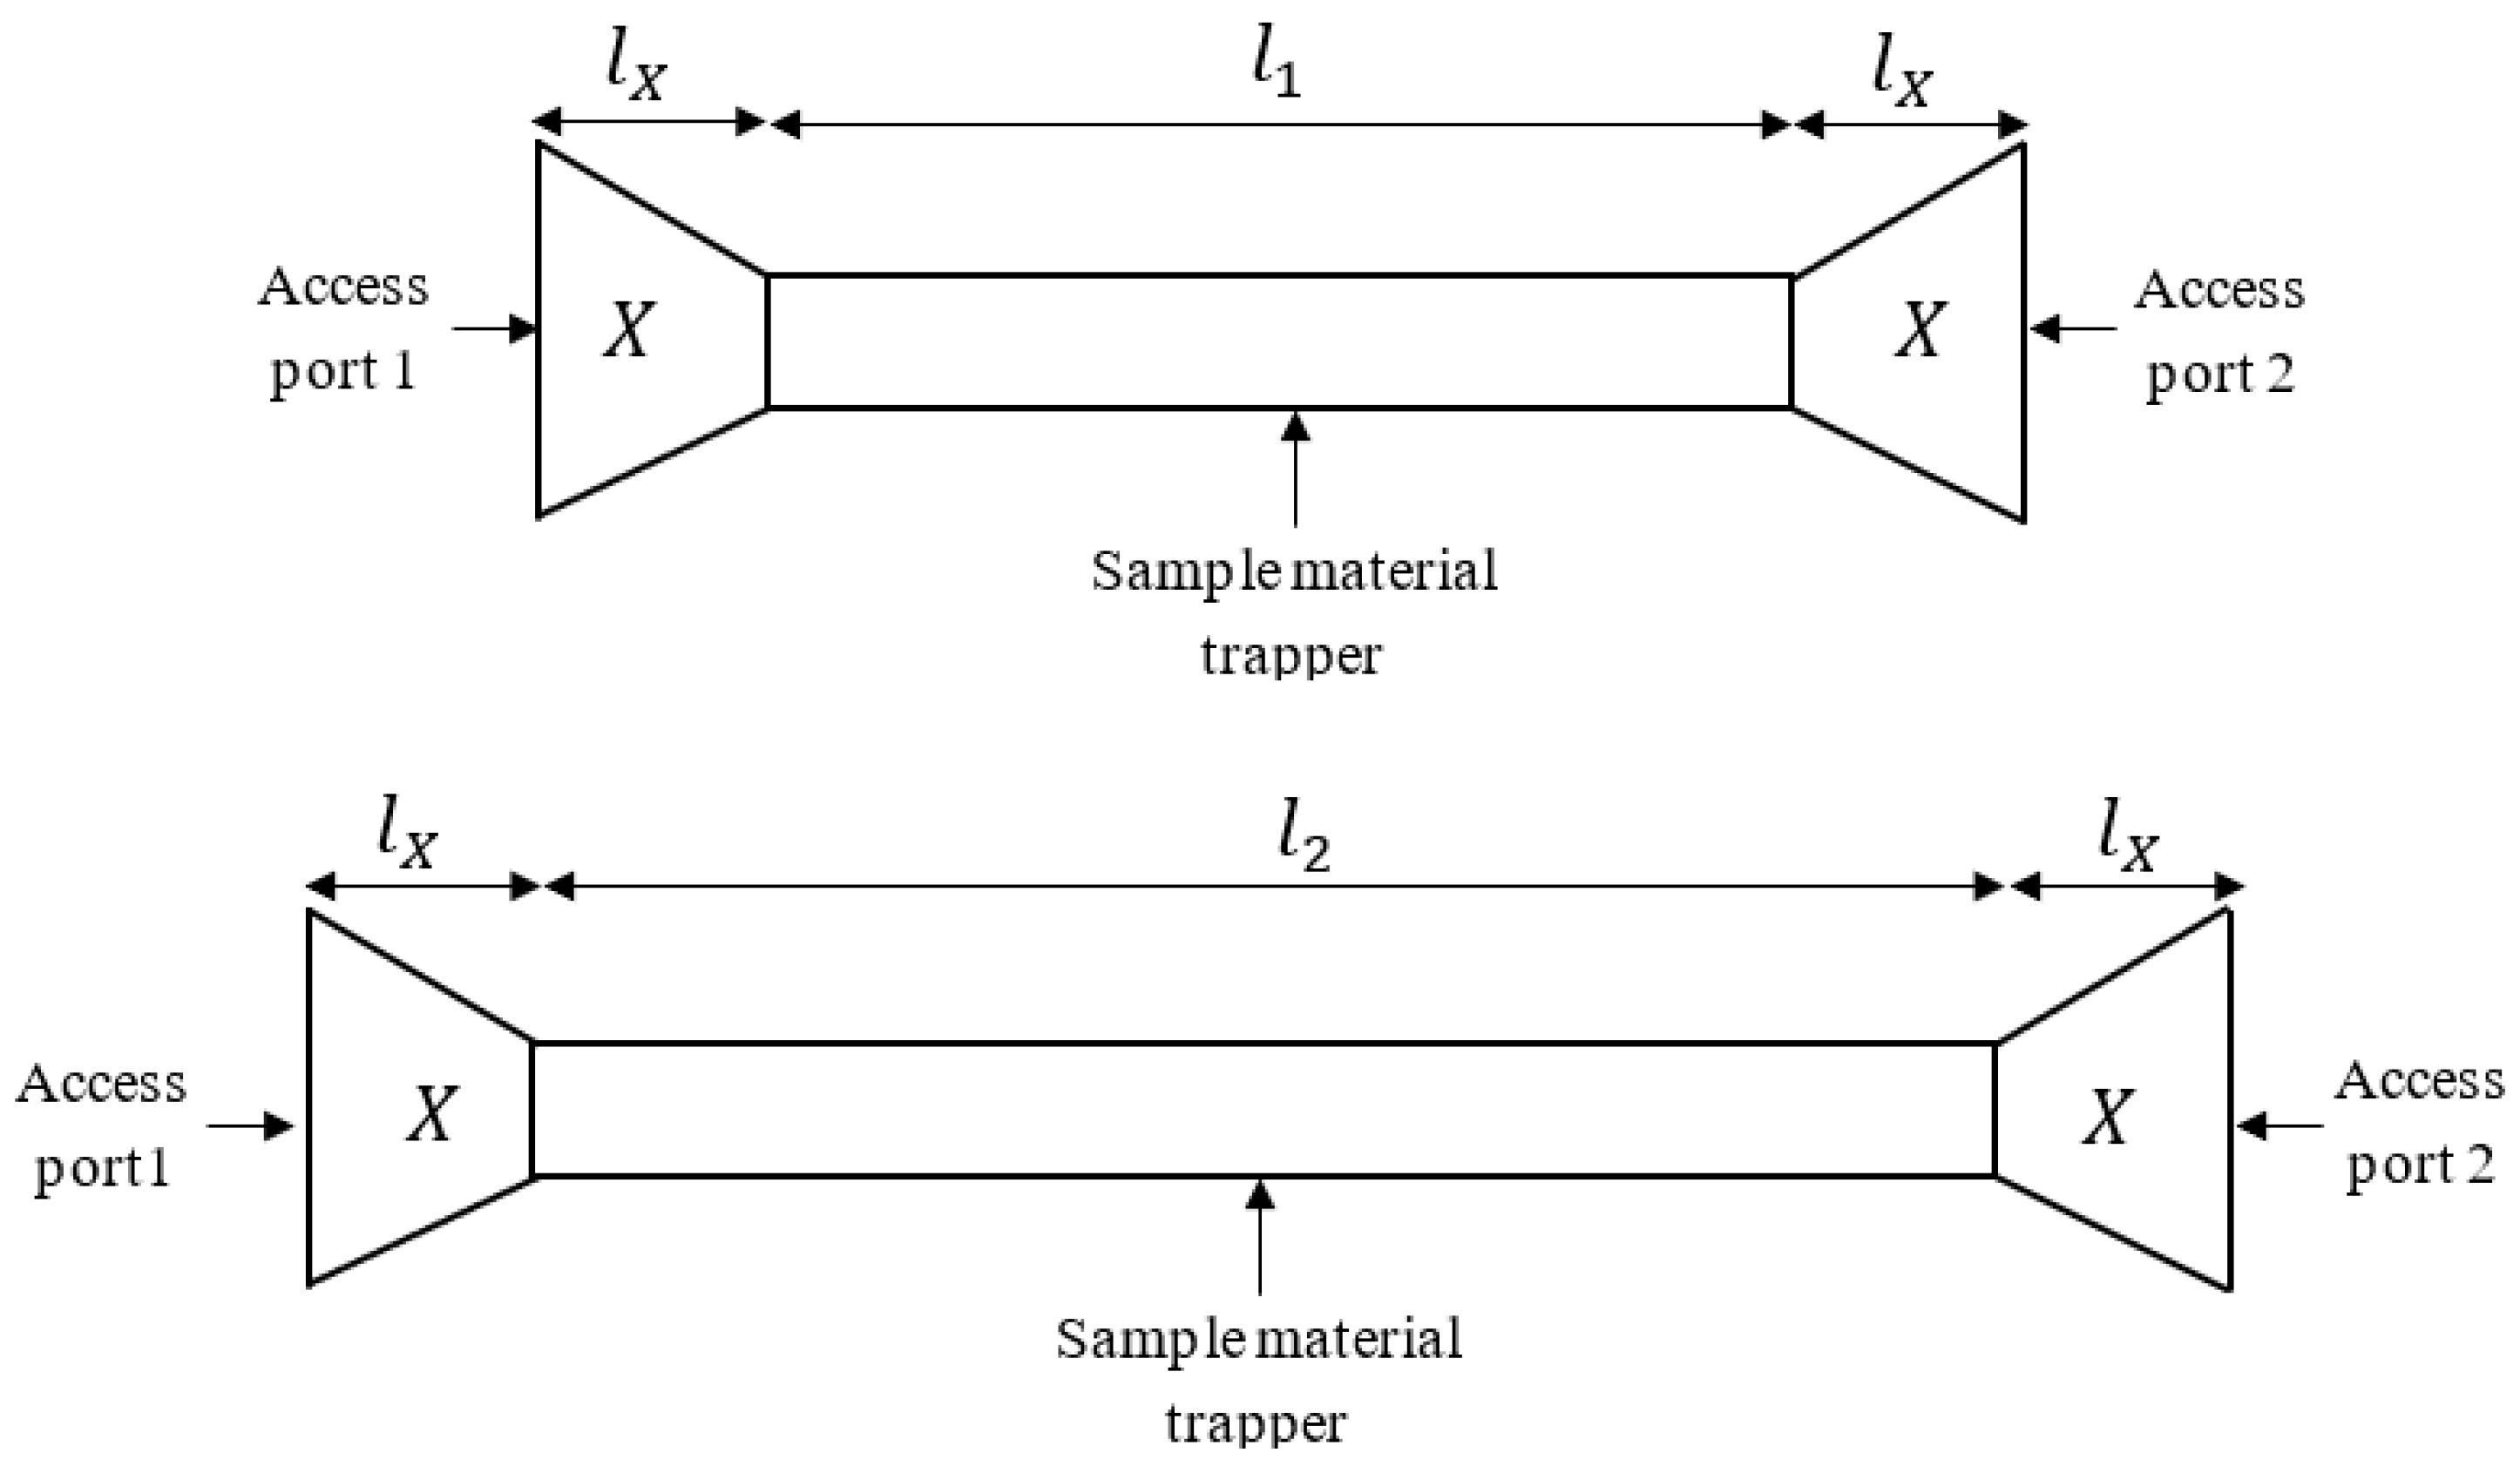
Figure 1. Two identical transmission-line configurations differentiated by length.
Electronics 11 04035 g001
Figure 2. A waveguide of length l , represented by its secondary parameters and the source port’s excited characteristic impedance, Z 0 .
Electronics 11 04035 g002
Figure 3. (a) Top view of the rectangular coaxial test cell; (b) the rectangular coaxial fixture linked to the VNA access port; (c) side view of the circular coaxial fixture elements; (d) the circular coaxial fixture linked to the VNA access port.
Electronics 11 04035 g003
Figure 4. (a) Characteristic impedance of the circular coaxial fixture without the material under test (MUT); (b) characteristic impedance of the rectangular coaxial fixture without the material under test (MUT).
Electronics 11 04035 g004
Figure 5. (a) The characteristic impedance of aquarium sand and polenta, using the circular coaxial fixture up to 10 GHz; (b) the characteristic impedance of PLA and semi-flex, using the rectangular coaxial apparatus up to 10 GHz; (c) the characteristic impedance of semolina, using the circular coaxial test cell up to 13.5 GHz.
Electronics 11 04035 g005
Figure 6. Relative permittivity and loss tangent of the Q-Cell 5020 measured with the circular coaxial test cell.
Electronics 11 04035 g006
Figure 7. Relative permittivity and loss tangent of the semolina measured with the circular coaxial test cell.
Electronics 11 04035 g007
Figure 8. Relative permittivity and loss tangent of aquarium and polenta, extracted with the circular coaxial test cell.
Electronics 11 04035 g008
Figure 9. Relative permittivity and loss tangent of the semi-flex measured with the circular coaxial fixture.
Electronics 11 04035 g009
Figure 10. Relative permittivity and loss tangent of the PLA measured with the circular coaxial fixture.
Electronics 11 04035 g010
Table 1. Comparison values of ε r , X , and a according to the coaxial test cell shape.
Aquarium SandSemi-Flex 100%PLA 100%SemolinaPolentaQ-Cell 5020
Fixture shapeCircularRectangularRectangularCircularCircularCircular
Medium ε r 3.0932.4492.4852.3881.8921.238
X –Coefficient1.1720.91.1281.0190.8480.502
a –Coefficient1.071.1170.850.7931.0361.45
Scanned bandwidth frequency (GHz)10101013.51020
Table 2. Comparison of the medium’s relative permittivity ε r and its uncertainty Δ ε r from the filled two-lines technique.
Eigenvalue PrincipleNew Suggested Approach
ε r Δ ε r ε r Δ ε r
Aquarium Sand3.0821.067 × 10−43.0930.01
Semi-Flex 100%2.5849.689 × 10−42.4490.022
PLA 100%2.4695.49 × 10−32.4850.022
Semolina2.3763.347 × 10−32.3886.187 × 10−3
Polenta1.9284.298 × 10−31.8922.861 × 10−3
Q-Cell 50201.1647.979 × 10−41.2380.018
Table 3. Comparison of the uncertainty Δ ε r from the new approach definition when using the Equations (7) and (36).
Equation (7)Equation (36)
Aquarium Sand0.011.067 × 10−4
Semi-Flex 100%0.0229.689 × 10−4
PLA 100%0.0225.49 × 10−3
Semolina6.187 × 10−33.347 × 10⁻³
Polenta2.861 × 10−34.298 × 10⁻³
Q-Cell 50200.0184.14 × 10−4
Publisher’s Note: MDPI stays neutral with regard to jurisdictional claims in published maps and institutional affiliations.