1. Introduction
There is a growing body of research showing the cognitive benefits that physical activity (PA) has on cognition and academic-related outcomes [
1,
2]. The inclusion of PA during lessons might be of special interest for the learning outcomes of students. Among the different ways of introducing PA in the classroom, active breaks (AB) are seen as a novel approach of special interest for researchers and teachers [
3], since they can be carried out in any school space or context without the need of a specific equipment nor personnel [
4]. Concretely, AB are short bouts of moderate-to-vigorous PA (i.e., between 5 and 15 min) led by the teachers at any educational level embedded into the lessons or between them [
4].
At university level, students usually suffer from changes in their lifestyle by decreasing PA—a fact that has motivated different proposals for increasing the PA levels during this period [
5]. In this sense, sedentary and passive behaviours during lectures compromise attention and memorisation in undergraduate students and AB can be an useful way of maintaining higher levels of attention during the lessons [
2]. Attention “acts as a ‘gate’ into working memory, regulating the flow of sensory information into conscious awareness” [
6]. It can be defined as the ability to resist distraction [
6] and is one of the core executive functions [
1,
7]. Together with the other cognitive and metacognitive functions [
1], attention [
8] plays an essential role for learning and, therefore, negative effects on attention might turn into decreases in students’ learning [
9]. The inclusion of AB into academic lessons has been demonstrated to improve attention levels, especially selective attention, in a wide range of educational levels including university students [
8]. However, there is a lack of research at this educational level regarding the effects of AB on sustained attention or vigilance (i.e., the ability to accurately and quickly respond to relevant stimuli presented in a random frequency [
10]).
Adult-based evidence has shown that acute PA positively affects vigilance performance in terms of response time [
11]. Nevertheless, the advances in electroencephalography (EEG) allow to address this issue from the point of view of brain functioning through the study of brain oscillations. Previous studies have shown that attentional performance after a single bout of PA was correlated with increased activation in some attentional control-related areas such as middle and superior frontal gyrus and superior parietal lobe [
12]. Acute PA has also been followed by changes in activation in alpha, theta, beta and delta frequency bands in brain oscillations [
13]. Nevertheless, the EEG approach is especially scarce within the current research regarding vigilance [
14]. In addition, no prior EEG-based study exists that focuses on the effects of AB on vigilance. The present study tries to fill this gap in the current literature by conducting an experimental pilot study that is innovative for this area of research due to the counterbalanced within-subject design under laboratory conditions, which simulates an actual academic lesson.
In this regard, the use of a multiparametric model is introduced in this paper in order to differentiate whether there are differences between the performance of AB in the attention context using different machine learning techniques over EEG signals. Such algorithms have shown to be effective in emotionally oriented tasks [
15,
16,
17,
18], cognitive stress detection [
19,
20] and others by using EEG signals alone [
21,
22] or in conjunction with other physiological signals such as electrodermal activity (EDA) [
23,
24], blood volume pressure (BVP) [
25], electrocardiogram (ECG) and electromyography (EMG), among others [
26,
27,
28]. Therefore, the aim of this pilot study has been twofold. On the one hand, one objective was to determine the effects of AB in comparison with passive breaks on vigilance (i.e., sustained attention) performance in university students. On the other hand, another aim was to validate an analysis model based on MLA in conjunction with a multiparametric model based on EEG signal features.
The remainder of this article is structured as follows.
Section 2 introduces the experiment design, the dataset and the methods used for analysis.
Section 3 reports the results obtained in detail. Next, in
Section 4, the results are discussed and put in context. Finally, in
Section 5, the most relevant conclusions obtained in this pilot study are offered.
2. Materials and Methods
2.1. Participants
A total of six Spanish, Caucasian, right-handed participants was recruited for this pilot study. Six students, four men and two women, aged between 22 and 32 (mean age = 25.67, STD = 3.61). All were recruited among the students of the Faculty of Education of the Universidad de Castilla-La Mancha, Albacete, Spain. All students belonged to the university community, being of Caucasian ethnicity and Spanish native speakers. The inclusion criteria for the participants were (i) reporting normal vision, no partial/chronic injury and no history of neuropsychological impairment that could affect the results of the experiment, (ii) not presenting any injuries during the last two months, (iii) giving consent, and (iv) participating in all sessions during the study period (see
Table 1). The participants obtained information about the main aims of the investigation and they had to sign an informed consent form. All participants completed the Physical Activity Questionnaire (IPAQ) [
29] to verify their lifestyle. In this questionnaire, they were asked about current sports habits, addictions and diseases that could prevent them from the practice of physical exercise. All subjects completed the same number of AB sessions.
2.2. Experimental Design
This study followed a counterbalanced within-subject experimental design under laboratory conditions; that is, each of the six participants took part into two conditions, namely control (i.e., passive break;
Control Condition) and experimental (i.e., physical activity break;
AB Condition) in random order, leaving a minimum 24 h washing period. The participants were previously asked not to engage into intense PA during the 24 h before the data gathering. Each experimental session carried out individually in a laboratory lasted around 90 min (see
Figure 1). First, they were asked to wear a heart rate registration band and a smartwatch. and they had to answer control questions about their subjective arousal, sleep quality and previous intake of caffeinated drinks. Then, in the same room, the research team placed the EEG and started the pretest. This consisted of completing the 15 min Psycho-Motor Vigilance Task (PVT) on an iPad. Then, the EEG device was removed, and the participant was moved to another room where they started a typical theoretical lecture. After 20 min of lecture, one of the experimental conditions previously assigned at random was applied during 15 min. Just after that time, the participant was moved again to the first room; the EEG was placed and the post-test (i.e., the same 15-min PVT task) was carried out. Finally, the participant was asked about their subjective arousal and the data-gathering process finished. Each participant repeated this procedure after 24 h but with a change in the experimental condition.
For the pretest and the post-test, it was ensured that the headset was placed in the same position for each participant. For this purpose, a series of considerations were applied. Firstly, the participant’s head was measured to select the correct cap size. Once placed on the participant’s head, the relative distances between the eyes, ears and forehead to the cap were measured to leave it in the same position for both uses.
In this context, the two conditions that have been assessed are:
2.3. EEG Configuration
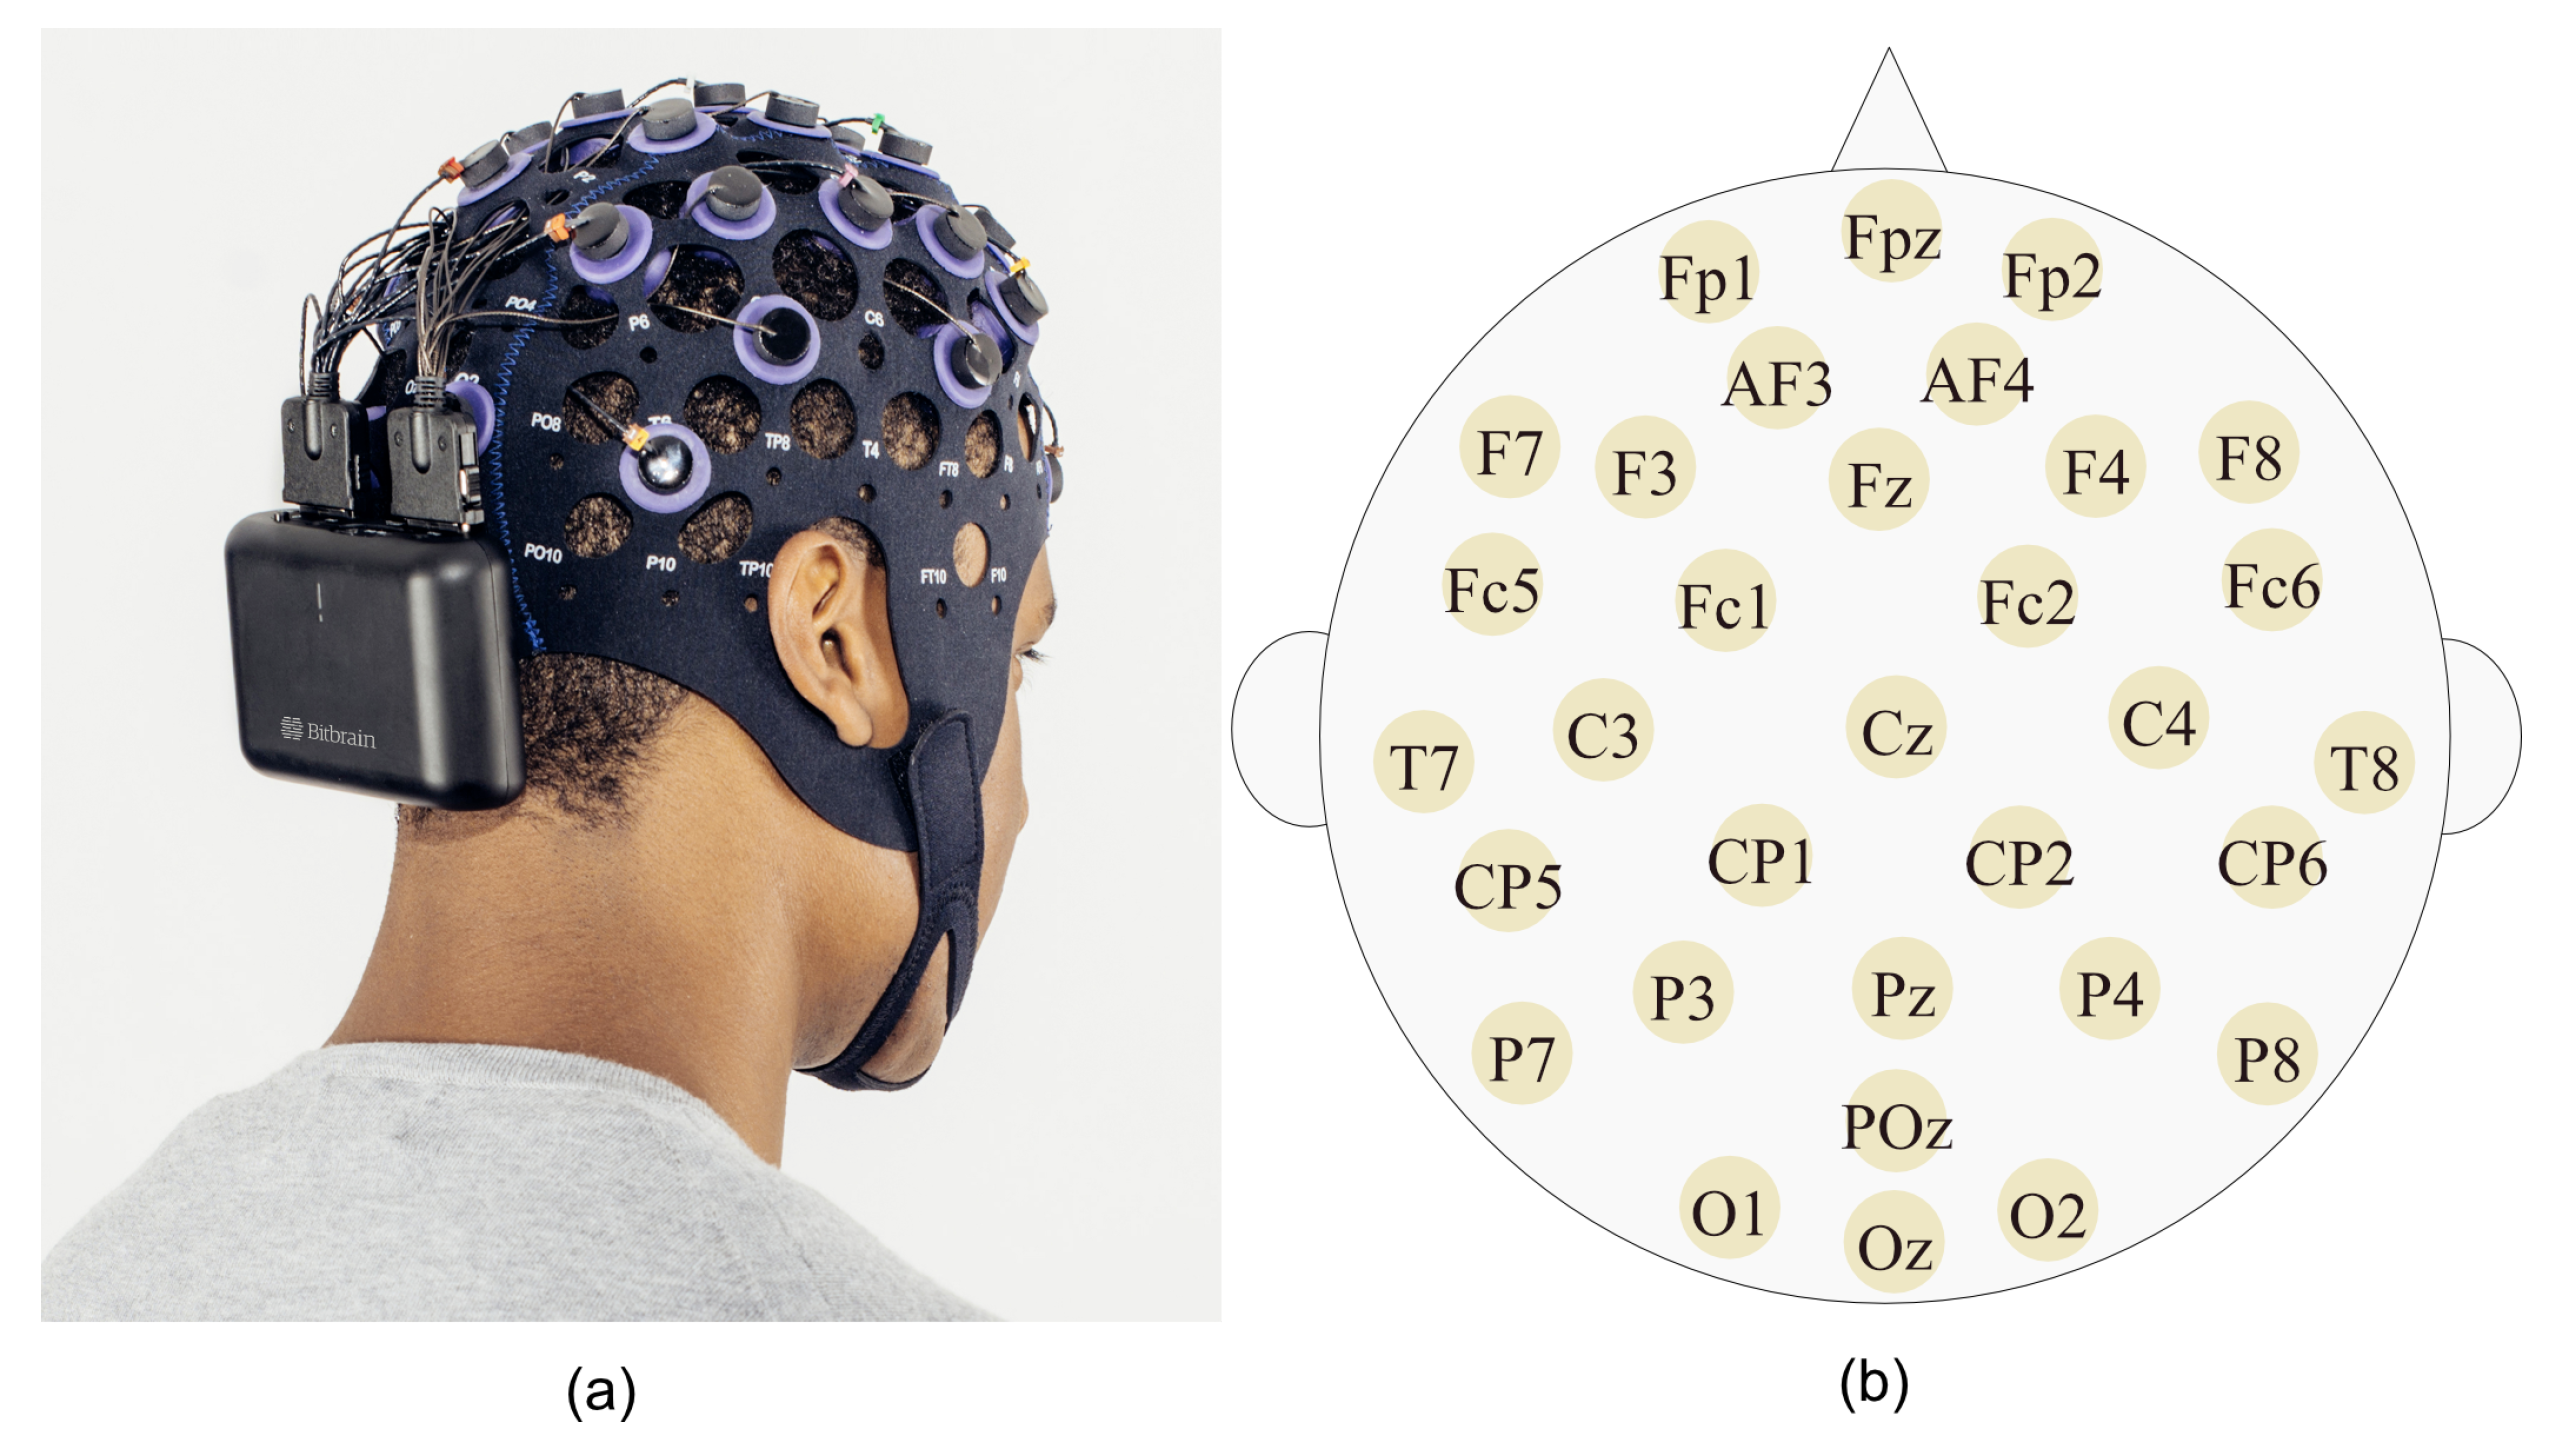
Versatile EEG 32 channels from Bitbrain [
30] was used to acquire the EEG signals while carrying out the PVT in the pilot study. This EEG cap is being used in many neuro-physiological experiments due to its simplicity and ease of wear. It does not require conductive gel on its electrodes as it uses a saline solution. Versatile EEG 32 is a wireless device using a Bluetooth connection. It has 32 acquisition channels for EEG signals with a 286 Hz sampling rate.
Figure 2 shows the placement and the available electrodes of the device: (a) shows the placement of the EEG device on the participant; (b) shows the 32 electrodes available on the device and their position according to the 10-10 electrode placement system [
31].
2.4. Cognitive Measurement on the Psycho-Motor Vigilance Task
An iPad (iOS 12.4.5) was used to present the stimuli of the PVT and collect relevant data during a 15-min session (see
Figure 1, for more information). The iPad was previously blocked for any type of external notification. The iPad screen was placed around 50 cm approx from the participants’ head at eyes level. Verbal and written instructions were given to the participant prior to the start of the PVT in every session, stressing that they had to fixate on the centre of the grey-background screen, try not to move their eyes, and respond as quickly as possible (while avoiding anticipation errors) as soon as a chronometer at the speed of a real stopwatch would start at the centre of the screen.
The stimuli (in form of chronometer) were presented on the screen after a random time interval that ranged between 2000 and 10,000 ms. The reaction of the participants were collected through pressing the screen of the device. The participants had to press the centre of the device as quickly as possible. The exact number of trials for each participant depended on the individual’s response reaction time. The participants completed and trials in Control Condition and AB Condition, respectively.
2.5. Signal Processing
The MATLAB framework called FASTER (Fully Automated Statistical Thresholding for EEG artefact Rejection) was used to process the acquired EEG signals. Signal processing was carried out in different stages. The first stage consisted in the elimination of the baseline of each of the EEG channels by employing a forward or backward filter. More concretely, a linear-phase finite-impulse response filter was applied. The second stage consisted in the application of a band-pass filter with cut-off frequencies between 3 Hz and 45 Hz to select only that frequency spectrum. A notch filter has also been applied to remove the 50 Hz band to eliminate noise from the electrical grid. After that, the EEG signals were re-referenced to the mean value of channels.
It should be highlighted that after this preprocessing stage, the EEG signals were not yet ready for use, partly due to interfering artefacts. Those artefacts were mainly due to eye and facial muscle movements. Fortunately, eye movements are clearly detectable because of their high power at low frequencies and a diminishing trend in the EEG spectrum as the frequency rises. Thus, the next step was the elimination of the artefacts by using independent component analysis [
32,
33]. This method helped us to determine which part of the captured signal came from the brain and which was due to external artefacts [
34,
35]. After that, the remaining the analysis was performed with EEGLAB, another MATLAB framework specifically created for EEG signal processing [
36].
2.6. Data Augmentation
As the study only included a small number of participants, and even so the EEG signals obtained had a long duration (±15 min each), it was necessary to use data-augmentation techniques to extend the information provided. These techniques are generally based on successive segmentation techniques. For this study, in has been chosen to use the sliding-window segmentation technique with overlapping [
37]. Several overlap windows were tested on 10 s temporal length segments. It was empirically observed that a 0.5 s sliding window provided the necessary quantity of information to feed the different classifiers.
2.7. Feature Extraction
A multiparametric model was applied to differentiate between the two conditions established in the experimental set-up. Two sets of parameters were selected based on the spectral power and entropy metrics [
38], as well as the response time, as shown in
Table 2.
The frequency bands in the EEG signal spectrum to calculate the different features’ spectral power were theta (4–8 Hz), alpha (8–12 Hz), beta (13–30 Hz) and gamma (30–45 Hz) [
39]. The Welch’s power spectral density (PSD) was calculated to estimate the power of a signal in the several frequency bands. This method uses estimations of the periodogram spectrum, which is the result of transforming a signal from time-domain to frequency-domain. First, a time series was divided into overlapping subsequences by creating a window for each subsequence and then averaging the periodogram of each subsequence. The length of the window controlled the trade-off between the bias and the variance of the resulting power spectral density. In this regard, two computations were performed for each of the frequency bands. One, the relative PSD measure,
, is defined as the relation between the PSD of the frequency band to test and the total frequency spectrum. The force of the relative PSD is the reduction in between-subjects variation associated with the absolute power, which arises from differences in the conductivity of the skull and scalp [
40,
41,
42]. The second, the absolute PSD measure,
, reflects the classical computation of the PSD by Welch’s method in the frequency bands. In this regard, both metrics are necessary to set up a proper information of brain [
43].
The second group was based on entropy metrics. The classical Shannon entropy (
) gives an mean measurement of the average information yielded by a set of events and shows its uncertainty. This measurement emerges as a natural candidate for the quantification of the signals’ complexity [
44,
45]. In addition, these results were expressed in logarithmic form (
) [
45,
46]. Finally, the last group referred to the time taken to complete the task. Response time (
) was an external parameter obtained directly from the task that can be useful to determine a change in the participant’s performance.
2.8. Statistical Analysis
A one-way analysis of variance (ANOVA) was chosen as the statistical analysis to test possible differences between RTs on PVT and between the electrodes at the different experimental conditions and times. Regarding PVT, the null hypothesis was that there are no significant differences between the different RTs for each of the experimental conditions. In addition, for EEG signals, the null hypothesis was that there are no statistically significant differences for each of the electrodes for both conditions [
47]. To accept or reject our null hypothesis, a significance level
p-value
was set using the Bonferroni correction [
48]. Statistical analysis software IBM SPSS Statistics 25 was used [
49,
50].
2.9. Classification
In addition to statistical analysis, MLA were used to differentiate between the two proposed conditions. For this purpose, different classifiers based on supervised learning were implemented [
51]. All MLA were run on a computer cluster with a 20-core Intel Xeon Xtreme 10Th Gen processor, 64 GB of RAM and an Nvidia Quadro P5000 with 11 GB of VRAM. Python 3.8 and Tensorflow and Keras frameworks were employed for data processing and model training [
52,
53].
A combination of repeated random subsampling validation and a holdout cross-validation methodology was applied. Thus, a random partitioning of the dataset was performed, into training (75%), test (15%) and validation (10%) datasets. The training process was performed with 200 epochs, but the majority of the configurations converged between 20 and 70 epochs. To provide a consistent results, between 20 and 100 iterations (depending on the complexity of the algorithm) were carried out for each machine learning model. Early stopping was added so as no more resources than necessary were used.
A multiparametric design approach was chosen using the features obtained from EEG signal processing and RT. The range of classifiers selected were divided into seven main groups: support vector machines (SVM), decision trees (DT), ensemble trees (ET), linear discriminant analysis (LDA), logistic regression (LR), k-nearest neighbours (KNN) and artificial neural networks (ANN). These major groups address the problem of classification from different perspectives. A grid-search process was conducted in most algorithms to achieve optimal configurations that prevented overfitting and underfitting from the dataset generated from data augmentation techniques. This technique is widely used to find hyperparameters and network topologies in an automated manner for each MLA. The selection was made based on conditions of maximum F1-score and area under the curve (AUC) and minimum mean square error (MSE) [
54,
55,
56].
In this regard, the search criteria were set to find the following parameters: kernel, C and gamma parameters for SVM; division’s number for DT; type of kernel, neighbours and number of estimators for ET; minimum distances and number of neighbouring clusters for KNN; and, for ANN, different topologies were searched, choosing neurons per layer, number of layers, dropout coefficients and learning rate (LR) with Adam optimiser.
Table 3 displays the different hyperparameters established with the grid-search method.
2.10. Performance Metrics
A number of metrics were selected to properly assess the performance of the different models. The following four fundamental parameters were calculated: true positives (
), false positives (
), true negatives (
) and false negatives (
) [
23,
24]. In addition, the metrics used to assess the models were the following:
The precision (
P) indicates the probability to make a correct positive classification:
The recall (
R) is defined as the percentage of positive cases caught, explaining how sensitive the model is towards identifying the positive class:
The F1-score, also called F-measure, is a statistical measure to rate performance. It is defined as the harmonic mean between accuracy and recall:
3. Results
3.1. PVT Statistical Results
First, the ANOVA test shows that both conditions’ RT are not statistically different at pretest (
,
,
; mean RT at pretest in control condition:
ms; mean RT at pretest in AB condition:
ms). Second, no significant main effects are found in control condition between pretest and post-test (
,
,
; mean RT at pretest:
ms, mean RT at post-test:
ms), while a significant main effect of AB condition (
,
,
; mean RT at pretest:
ms, mean RT at post-test:
ms) was revealed. Participants’ RT are lower at post-test in comparison with the pretest only in AB condition. The main effect of RT and the interaction between condition and RT are not significant (
) [
47].
3.2. EEG Statistical Results
As aforementioned, statistically significant differences on the EEG signals were evaluated through a one-way ANOVA analysis with Bonferroni correction. The data were found to follow a normal, homoscedastic distribution using the Levene and Shapiro–Wilks tests.
Figure 3 shows the results for both experimental conditions (
Control Condition and
AB Condition) in terms of the variation of the PSD. Within a chromatic continuum, red-colored zones indicates an increased PSD (i.e., higher activation), while blue-colored zones indicates a decreased PSD (i.e., lower activation). Yellow-colored zones do not show any significant change in PSD”.
For the Control Condition, it can be observed in the theta band that there are zones in the prefrontal and prefrontal–parietal areas (FC1, FZ, Fc2, FC8, Fp2 and F8) with high activity. The same occurs with the alpha band, but in this case there is a transition towards the right lateral and frontal zones while a new area appears in C4 (parietal area). In the beta band, an increase in spectral power is observed that oscillates from the frontal (FC1, FZ, Fc2, FC8) and frontal–parietal zone with a very high and very localised PSD in pre-C1 (before the regular rest period) to a more diffuse frontal zone (FC1, AF4, FPz, FP2, FZ, Fc2, FC8), with less activity (less PSD) in the post-C1 section (after the regular rest period). Finally, regarding the gamma band, there is lower activation in the two conditions evaluated in comparison with the other frequency bands. This activity is centred in the central zone (parietal zone) which tends to attenuate, centred only the Fc1 electrode.
On the other hand, for the AB Condition, two regions with high PSD value can be seen in the theta band. The first one is located in the left prefrontal–parietal zone and the second one in the right prefrontal region. For the alpha frequency band, large areas of activity can be observed. These correspond to the parietal (AF3, Fc1, Fc2, C3, FC6, Cz, CP5, CP6, Pz) part for the pre-C2 scenario and the midline area of the brain (AF3, Fc1, Cz, Cp2, Pz) for the post-C2 scenario. In addition, changes can also be observed in the right prefrontal area (FC6). A similar scenario can be observed for beta frequency band, except that in this case the PSD value is reduced, especially in the area close to the CP5 channel. Finally, for gamma band, t is observed that the area located in the cerebral midline increased its activity. This is reinforced by the activation of two extra areas located in the FC6 and CP6 right-sided electrodes, and CP5 left-sided electrode. This illustrates the “lateralisation” of the areas with an increased PSD.
Accordingly,
Table 4 shows the electrodes whose activation significantly changed from pretest to post-test. These results confirmed the maps depicted in
Figure 3.
3.3. Classification Results
3.3.1. Training Times
An important aspect to consider in machine learning is the time needed for training the different models. the different ML models have been trained with and without the RT feature.
Table 5 shows that the best time of all classifiers is obtained by ET (boosted) with a total of around 34 and 48 min for the
Control Condition. In contrast, for
AB Condition, the best performer is SVM (Linear) with an estimated time of 47 min 43 s and 48 min 56 s for the two proposed scenarios.
On the other hand, for the AB Condition, it can be observed that the algorithm that requires the least time is SVM with linear kernel, with slightly more than 47 and 48 min each. We found that for SVM, the best training time ranges between 46 and 48 min for both experimental conditions. For DT, it may be noted that in both conditions, the medium configuration is the best performer with 59 min, 1 h 3 s, 57 min and 1 h 3 s, respectively. In the KNN group, for Control Condition, it should be noted that the Euclidean distance with 28 neighbours setup has a time of 51 and 56 min, respectively. In comparison, for the AB Condition, the Manhattan metric setting performs as the best one with 1 h 45 min and 1 h 42 min, respectively. Finally, for the ANN group, configuration 1 shows the best performance with a range of times from 51 min to 1 h 17 min for both conditions in the different scenarios.
3.3.2. F1-Score Results
F1-score results have been obtained for each of the algorithms used.
Table 6 shows the different results obtained in the several iterations. In this case, the results have been grouped according to the use of the reaction time for both conditions in each of the classifiers.
In first place, the case where RT is added as a parameter to the classifier is analysed. For the SVM group, it is found that an F1-score of 78.62% is obtained in the Control Condition. In contrast, for the AB Condition, a score of 84.02% is gotten for the same radial basis function (RBF) kernel setup. In the group of DT, it can be observed that 59.10% has been obtained for the medium and 60.03% for the coarse setup in the two scenarios. The LDA group obtains poor results, reaching in both scenarios 50.12% and 51.24%, respectively. In the cluster of ET methods, it can be seen that for Control Condition we have 68.01% and for AB Condition 67.32%. For the KNN algorithms, the best performance is achieved with the Manhattan metric with results of 71.01% and 68.90% in each scenario. Finally, for ANN, it is observed that the best result is 81.42% and 87.27% when configuration 2 is used.
When the response time (RT) is added as an extra parameter to each of the classifiers, it can be seen that for the SVM group an F1-score of 84.62% and 85.21% are obtained for Control Condition and AB Condition for the RBF kernel configuration. In the category of DT, again, the best result is obtained in the coarse category with 57.03% and 53.07% for each of the two conditions. For LDA, the results are very similar to those obtained in the DT, with a result of 52.27% and 52.65%, respectively. Within the classifiers based on ET methods, the F1-score of 69.12% and 69.48% can be observed for the boosted and bagged methods, respectively, in the two conditions tested. For the KNN methods, it can be seen that the values are very similar, having 69.92% and 69.40% for the Manhattan metric in the respective conditions and another one in the second condition of 69.39% for the Euclidean 4-neighbour metric. In the group of ANN, it can be noticed that there are high values in terms of F1-score. The F1-score is 87.81% and 88.84%, respectively.
4. Discussion
This pilot study investigated the effects of AB on university students’ vigilance performance (i.e., sustained attention) and EEG signals in comparison with passive breaks. It also aimed to validate an analysis model based on MLA in conjunction with a multiparametric model based on EEG signal features. Despite the fact that the obtained results are of great interest and support scientific literature about cognition and acute exercise, this study can be considered a pilot study in terms of analysing the physiological and neuro-physiological effects of active rest on a set of participants. Since one final aim of this area of research is to extrapolate the benefits of AB to actual educational environments, this study was carefully designed to allow us to determine whether neural-physiological alterations occur in the same direction of attentional performance after AB condition.
4.1. Psycho-Motor Vigilance Task (PVT)
A differential analysis of variance of repeated measures (ANOVA) was performed with the average of the participants’ RTs with the condition and time-on-task (15 min). In this context, our findings showed faster RTs after AB (Post-C2) with respect to pre-C2. It would appear then that AB translate into better cognitive performance. Note, though, that this finding further supports the PVT as a reliable tool to measure vigilance [
8]. In addition, as it can be seen in
Figure 4 our results seem to support the idea that acute produces selective benefits in cognitive performance [
57]. In any case, our PVT results show the capacity to keep the attentional focus in the main stimuli and respond quickly and accurately, which supports the idea that an adequate vigilance level could be related to mechanisms such as cognitive control and interrelated with better performance in school abilities [
58,
59,
60].
4.2. EEG Statistical Analysis
Other studies have revealed the importance of the beta band in the attentional process and its deficits [
61,
62]. It has been shown that beta-band activity may serve as a carrier of attentional activation in multiple thalamic and cortical centres [
63,
64]. In this context, the analysis of the different electrodes in the different frequency bands has shown that there is a noticeable difference between the
Control Condition and
AB Condition, corresponding to the AB condition. An increment in the number of electrodes with statistically significant differences (
p-value < 0.05) can be observed in
Table 4, especially in the frontal, parietal occipito–temporal region. Conducting this experiment has proven the feasibility of monitoring attention-related changes in brain activity by using the EEG approach in an ordinary day-to-day setting.
Another phenomenon occurring in this study is brain lateralisation, which plays an important role in complex cognitive functions [
65]. The results show that there are significant differences between the two hemispheres, with one hemisphere dominating the other. This is seen in the theta bands and to a lesser extent in beta, alpha and gamma [
66]. In accordance, this results in an increase of PSD in the left hemisphere versus the right hemisphere (asymmetry) may be due to the fact that most participants are right-handed. If the cognitive complexity of the experimental load is taken into account, it is possible to assume that the presence of laterally and cortical asymmetry is in line with the processes of studying and coping with the purposed task.
4.3. Multi-Parametric Classifiers Model
Other aspects to be taken into account when evaluating the proposed parametric model and its use for monitoring attention in the educational environment is its reliability and accuracy [
67,
68]. In this sense, studies have been found that use parameters such as spectral power (PSD) for each of the frequency bands [
69,
70,
71]. The proposed model not only uses PSD parameters and their derivatives (relative and absolute), but also makes use of nonlinear metrics such as entropy derivatives, such as Shannon’s entropy and Logarithmic entropy. In this respect, it has been found that the use of these nonlinear metrics provides differential values when assessing different EEG patterns [
72,
73].
Another approach that has been used to determine whether the classifiers can distinguish between the different states for each of the proposed conditions is the use of the mean response time (RT) to feed each of the classifiers. It can be observed that an increase in the performance of the classifiers exists, especially those that are able to work with a large number of parameters such as ANNs and SVMs. In fact, after conducting the experiment, we could restrict the algorithms to these two and analyse other topologies in greater depth, seeking to optimise time, classifier topologies, number of input parameters and features.
4.4. Time Consumption in Multiparametric Classifiers Model Training
The use of model training time has also been taken into account. This factor can be of interest not only when evaluating a model, but also when establishing a series of selection guidelines for different classifiers. In this regard, although it can be observed that the classifier that consumes the least time is ET (boosted) for the Control Condition and LDA for the AB Condition, considering their F1-Score results, ANN and SVM should be the classifiers of choice. Although the training time is longer, this is compensated for by the increase in accuracy. Therefore, a compromise solution must be used that will allow us to take as little time as possible, with the highest accuracy possible.
4.5. Limitations and Future Works
This study suffers from a notable limitation owing to the small sample size with six participants. Despite this limitation, this study provides an important and innovative strategic approach to improve cognition on vigilance performance in university students. In fact, this is one of the few studies dedicated to the effects of AB in university students. However, more research is needed in this regard and future studies should replicate the procedures designed in the present work with larger sample sizes.
Moreover, future EEG analyses should consider the inclusion of RT and focus on SVM and ANN more broadly, making them to be more optimal in terms of results, training times and number of parameters.
5. Conclusions
The present work has provided evidence on the acute effects of AB on vigilance performance in undergraduates. On the one hand, we found differences between conditions and significant effects on PVT reflected in faster RT in post-C2. Complementary activation in frontal, parietal, and occipito–temporal regions has also been detected, which may suggest that AB produces better cognitive performance [
74]. Indeed, this perspective is further reinforced by the findings on beta bands and cerebral lateralisation.
Moreover, SVMs and ANNs have been identified as the best performers, especially when an extra RT component is used as a parameter in our multiparametric model. The evidence collected in this pilot study has revealed that EEG analyses form a promising approach for the investigation of physical activity and cognition in educational contexts.
We are convinced that this approach will help teachers to integrate AB in real educational settings in a more appropriate and targeted way, so that students can improve their attention levels and thus their effective learning.


 ,
, 


