Article

Design of an Electromagnetism-Based Transmission Line Galloping Test System

1
School of Electrical Engineering and Automation, Wuhan University, Wuhan 430072, China
2
State Grid Electric Power Research Institute Wuhan Nanrui Limited Company, Wuhan 430074, China
3
Hubei Key Laboratory of Power Grid Lightning Risk Prevention, Wuhan 430074, China
*
Author to whom correspondence should be addressed.
Electronics 2022, 11(5), 771; https://doi.org/10.3390/electronics11050771
Submission received: 28 December 2021 / Revised: 19 February 2022 / Accepted: 24 February 2022 / Published: 2 March 2022
(This article belongs to the Section Systems & Control Engineering)

Abstract

:
Existing transmission line full-scale tests rely on natural winds and have low test efficiency. In this paper, taking a reduced-scale test line with a 35.4 m span as an example, an electromagnetism-based transmission line galloping test system is designed. The plunger electromagnet periodically provides mechanical energy which vibrates the wire system in place of complex pneumatic loads. The finite element model of the electromagnet device is established and the influence of related parameters is analyzed. The power supply and control circuit of the excitation device are designed. The vibration of the transmission line is monitored by accelerometers and the displacement calculation method based on discrete wavelet transform (DWT) is proposed. Considering the geometric nonlinearity of the wire system, an adaptive excitation method based on wavelet decomposition and reconstruction of the acceleration signal is proposed. The vibration response of the wire under different coil currents and excitation modes is monitored and analyzed. The results show that the actual line galloping can be simulated by the designed electromagnetic system, the vibration frequency is close to the second natural frequency and the vibration amplitude can be controlled by changing the coil current.

1. Introduction

Transmission lines are the key facilities of a power grid system and play an important role in the safe and stable operation of the power grid. During the operation of overhead transmission lines, many disasters and accidents may occur due to natural conditions, among which transmission line galloping is the most serious one [1,2,3]. In 2018, galloping accidents occurred on a total of 77 high-voltage transmission lines of the Hubei power grid, resulting in tripping of 19 transmission lines, and over eight towers, nine wires and five interphase spacers were damaged. The phenomenon of transmission line galloping poses a great threat to the normal and safe operation of power grid systems and even causes great economic losses and has serious social influence [4]. Therefore, it is of very important practical application value to simulate the occurrence of actual line galloping; explore the influence of galloping on conductors, towers, fittings and components; and enrich the understanding of transmission line galloping.
Many scholars and scientific research institutions have conducted extensive research on transmission line galloping mechanisms, experiments and prevention technology [5]. Generally accepted galloping mechanisms include Den Hartog’s vertical mechanism [6] and Nigol’s torsional mechanism [7]. However, due to the complex aerodynamic behavior of iced bundled conductors, existing mechanisms cannot explain all transmission line galloping phenomena and it is difficult to establish accurate analytical models for three-degree-of-freedom (3DOF) overhead power line galloping [8]. Thus, some experiments have been carried out to study the transmission line galloping phenomenon and prevention. Traditional galloping tests include the wind tunnel tests and the full-scale tests. In [9,10,11], wind tunnel tests were carried out to obtain the pneumatic coefficients of conductors covered with various shaped ice. In [12], the dynamic responses, frequencies, amplitudes and vibration modes under different span lengths, wind velocities, angles and damping ratios were studied through wind tunnel tests. Reference [13] established a full aeroelastic model to study the galloping control of iced conductors by using an interphase spacer. Due to the size limitation, the aeroelastic models in wind tunnel tests have difficulty in restoring the complex nonlinear aerodynamic characteristics of ice-covered conductors and motion characteristics of actual transmission line galloping. Therefore, they are difficult to apply to the study of the damage brought by line galloping [14,15]. For full-scale tests, in [16], the field data of transmission line galloping were obtained in the Tsuruga Test line, which verified a method of identifying galloping. In [17], the vibration behaviors of transmission lines with D-section ice coatings were studied by a prototype transmission tower–line system test platform in Henan province, China. However, most of the existing prototype test platforms rely on natural wind, so it is difficult to obtain a stable and long-time galloping state due to the randomness of the environmental factors, and the test efficiency is usually low [15]. Therefore, it is necessary to establish a controllable and continuous galloping test system for full-scale test lines.
In this paper, an electromagnetism-based transmission line galloping test system is designed. Instead of relying on natural wind, the test system uses a controllable plunger electromagnet that periodically provides mechanical energy which vibrates the wire system in place of complex pneumatic loads. The vibration state of the wire is controlled by the coil current and acting time. Taking a reduced-scale test line with a 35.4 m span as an example, related parameters of the electromagnetic excitation device are analyzed. The power supply and control circuit are designed. The vibration of the transmission line is monitored by accelerometers and the displacement calculation method based on discrete wavelet transform is proposed. Considering the geometric nonlinearity of the wire system, an adaptive excitation method based on wavelet decomposition and reconstruction of the acceleration signal is proposed. By using the designed electromagnetism-based system, the galloping test is no longer dependent on the random external environment and the test efficiency is higher than that of the traditional full-scale tests. The test system can help to simulate the main characteristics of actual transmission line galloping and make the vibration amplitude and the vibration time controllable. It can be used in studies of the influence caused by line galloping, such as fatigue tests of towers, connecting parts and antigalloping devices.

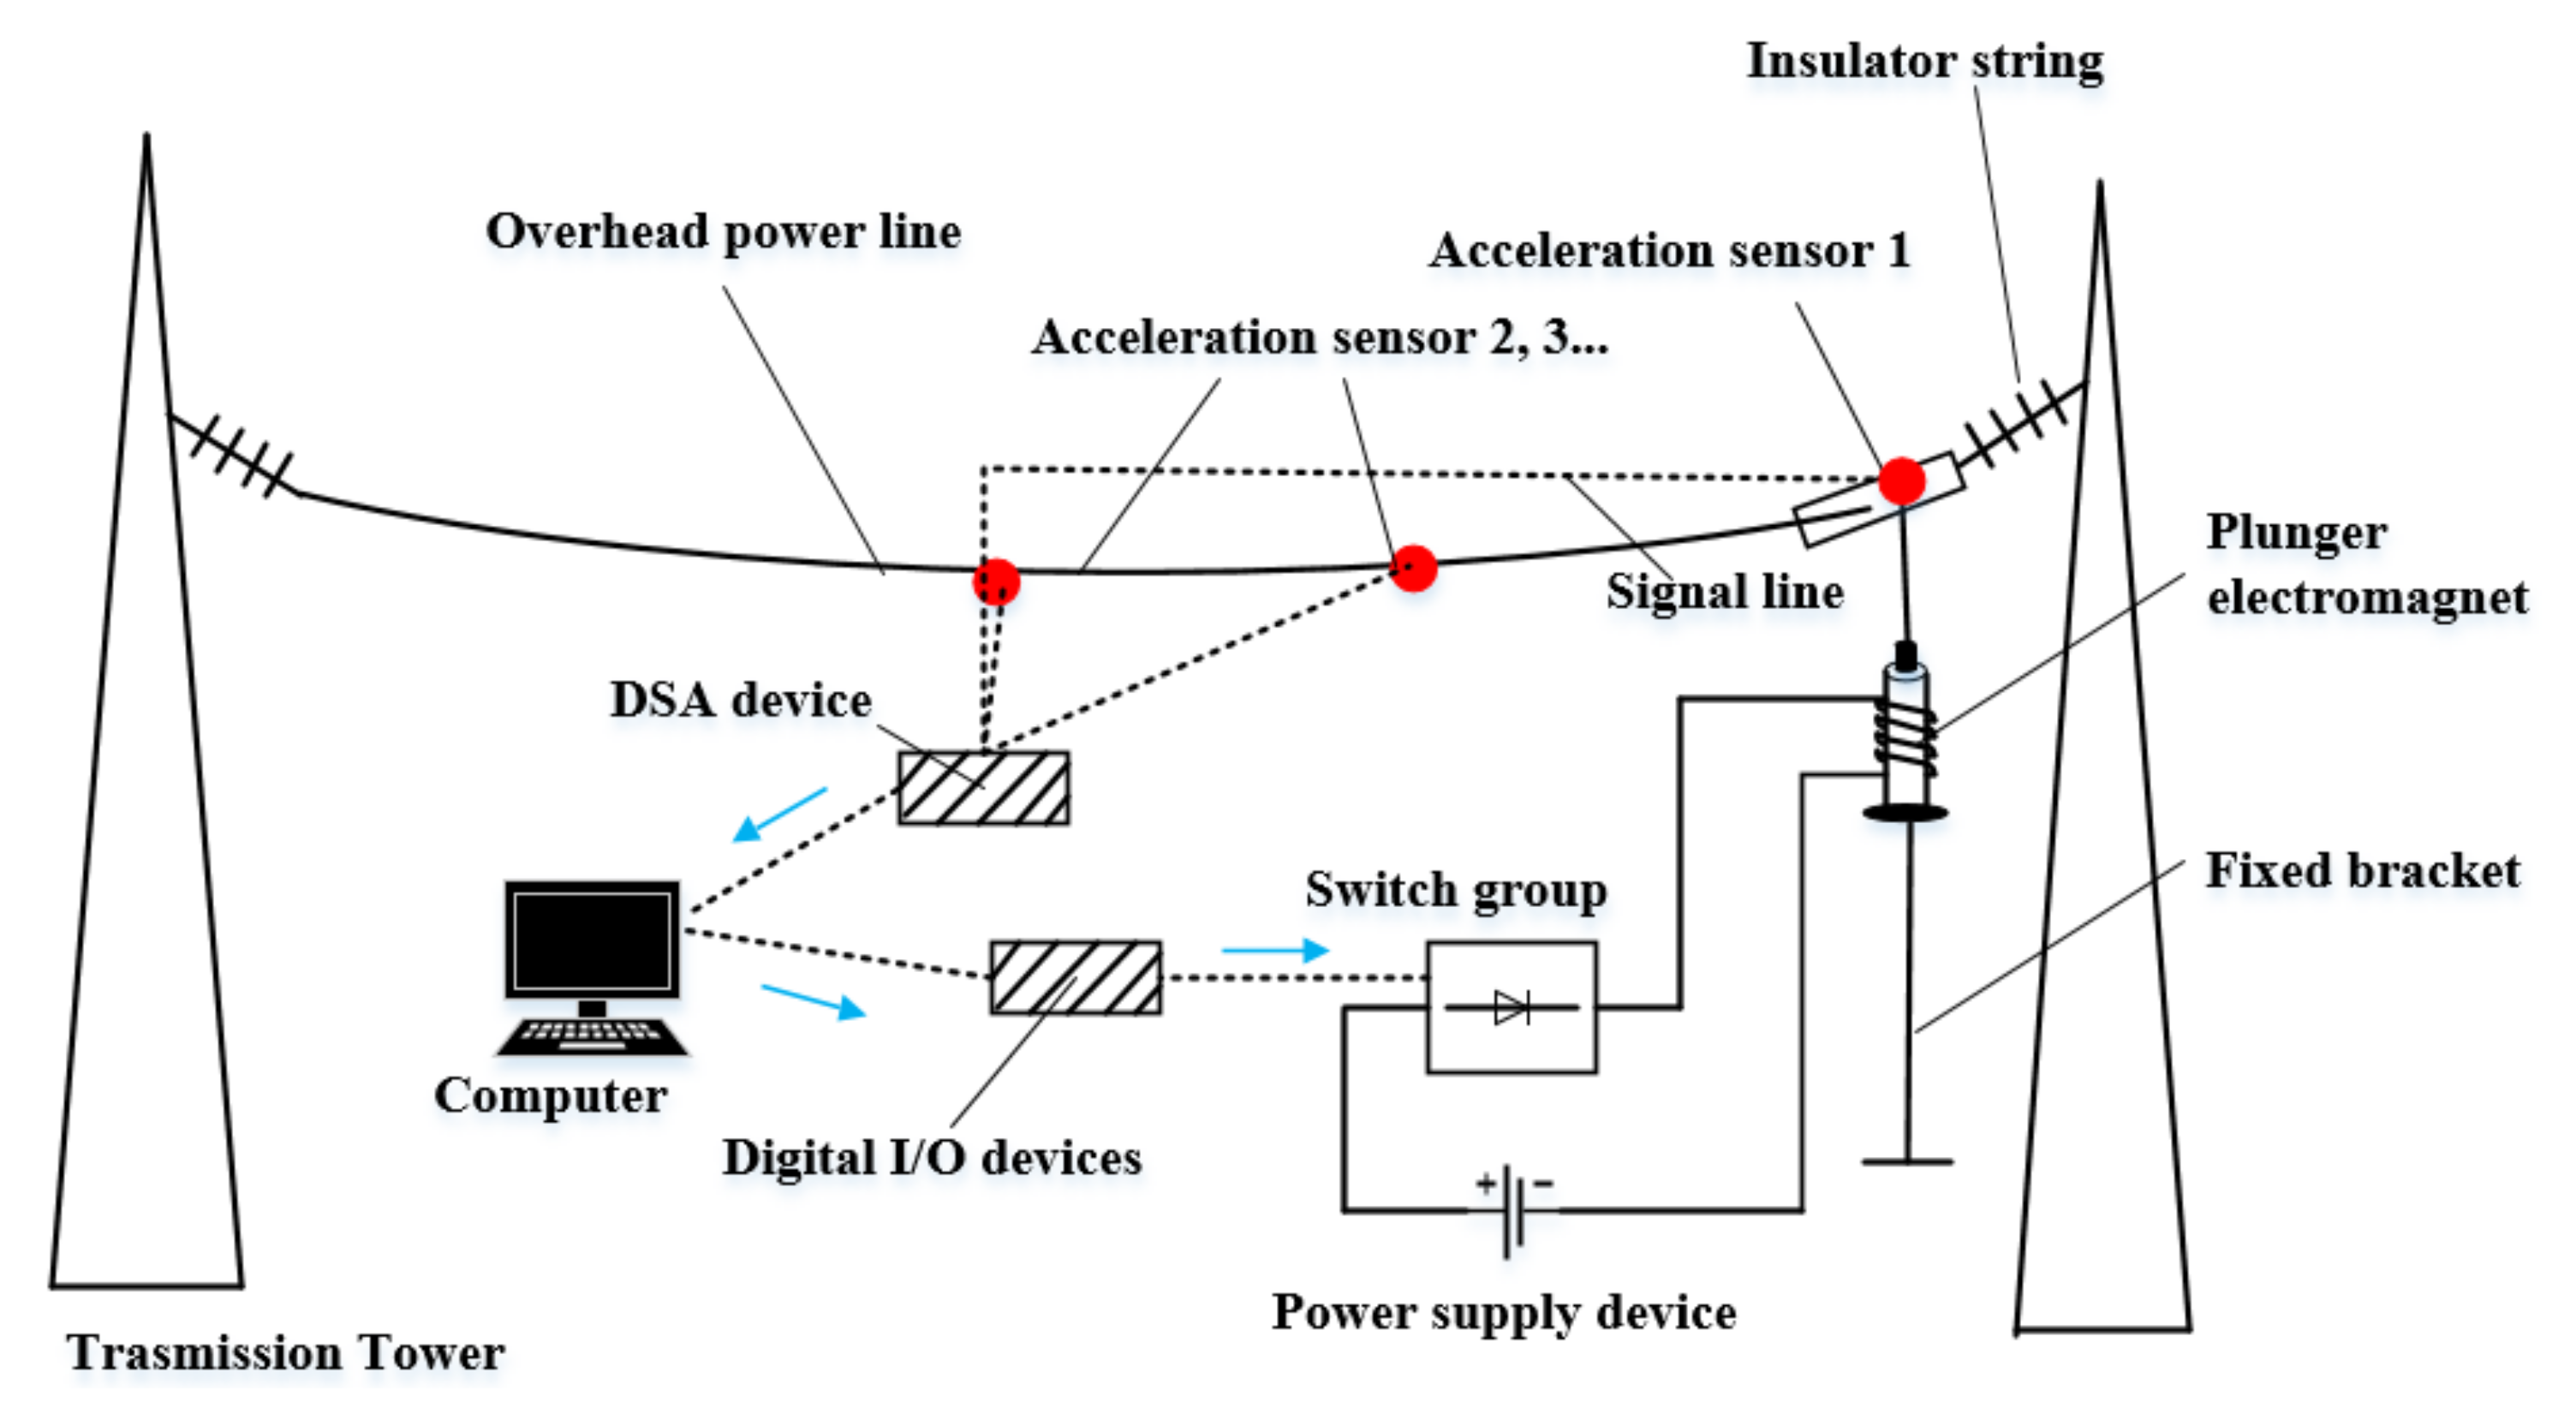
2. Composition of the Electromagnetism-Based Test System

Generally speaking, transmission line galloping is characterized by low frequency and large amplitude, with a few loops of standing waves. The smaller the number of loops, the larger the vibration amplitude and the greater the harm caused by galloping. The vibration trajectory of the wire is generally elliptical, with large amplitude in the vertical direction and small vibration amplitude in the horizontal direction [18]. The design principle of the system is based on Den Hartog’s vertical mechanism. By applying pulse force to the wire, the mechanical energy is periodically provided to the system to simulate the instability of the wire in the vertical plane and the energy accumulation process. As long as the excitation force injects positive energy into the system every cycle, the amplitude of wire vibration will increase continuously and finally form a stable vibration form under the action of damping. However, the period of the excited wave traveling along the wire varies with the shape and amplitude of the wire due to the geometric nonlinearity of the transmission line system. Thus, the starting time of each excitation must be judged according to the acceleration signal collected during the wire vibration. Since the magnitude and acting time of the electromagnet force can be controlled, the amplitude and galloping time of the wire can also be controlled. The excitation force is pulsed and will not affect the vibration of the system itself, and the vibration frequency is consistent with the natural frequency. It can restore the vibration characteristics of the actual line galloping and make the vibration state controllable.
The electromagnetism-based transmission line galloping test system designed in this paper includes a wire vibration data acquisition and processing module, an electromagnet module and a power supply control apparatus. As shown in Figure 1, the vibration of the transmission line is monitored by accelerometers, the dynamic signal acquisition (DSA) device NI-USB 4431 was chosen to collect data and input it to the computer. The acceleration signal is processed by the program in the LabVIEW software on the computer so that the speed and displacement of wire vibration can be obtained. When judging that the coil needs power supply, the computer controls the switch group through the digital I/O device NI-USB 6501. Then, the coil passes a pulsed current and the plunger electromagnet works. Under the action of the electromagnet, the armature drives the wire to move so as to input positive mechanical energy to the system. The coil current can be adjusted through the power supply device to control the vibration amplitude of the wire.
Compared with traditional full-scale tests, the amplitude and time of wire vibration are controllable since the generation and magnitude of coil current and electromagnetic force are both controllable in this system. Compared with the wind tunnel test, the test lines are not affected by the scale effect, which can help to simulate the main characteristics of actual line galloping. Comparison results of the existing transmission line galloping test and the proposed system are shown in Table 1.

3. System Design Specification

3.1. Reduced-Scale Test Line

The electromagnetism-based transmission line galloping test platform was built at Wuhan University. A reduced-scale test line with a geometry length scale of about 1:8.4 was made. The prototype was 500 kV four-bundled overhead conductors of type LGJ-630/55 and span length 298 m. The cross-sectional area of a single split wire is 696.22 mm2. The insulator used is the XWP-400 suspension porcelain insulator. Given the material limitations, it is difficult to find a flexible cable to simulate a wire which can satisfy the similarity of geometry, force and frequency [13]. In general, the amplitude and frequency of vibration are the main characteristics of line galloping. In this paper, steel wire rope is used to simulate overhead conductors and metal wire clip is used to simulate insulator string. According to dimensional analysis, the parameters related to the reduced-scale test line and the similarity coefficient with the prototype are shown in Table 2.
The finite element model including the wire and insulator string was established in ABAQUS 2019 software [19], and the comparison between in-plane modal analysis results and measured results is shown in Table 3. The results show that the natural frequency measurement results are almost consistent with the finite element analysis results.

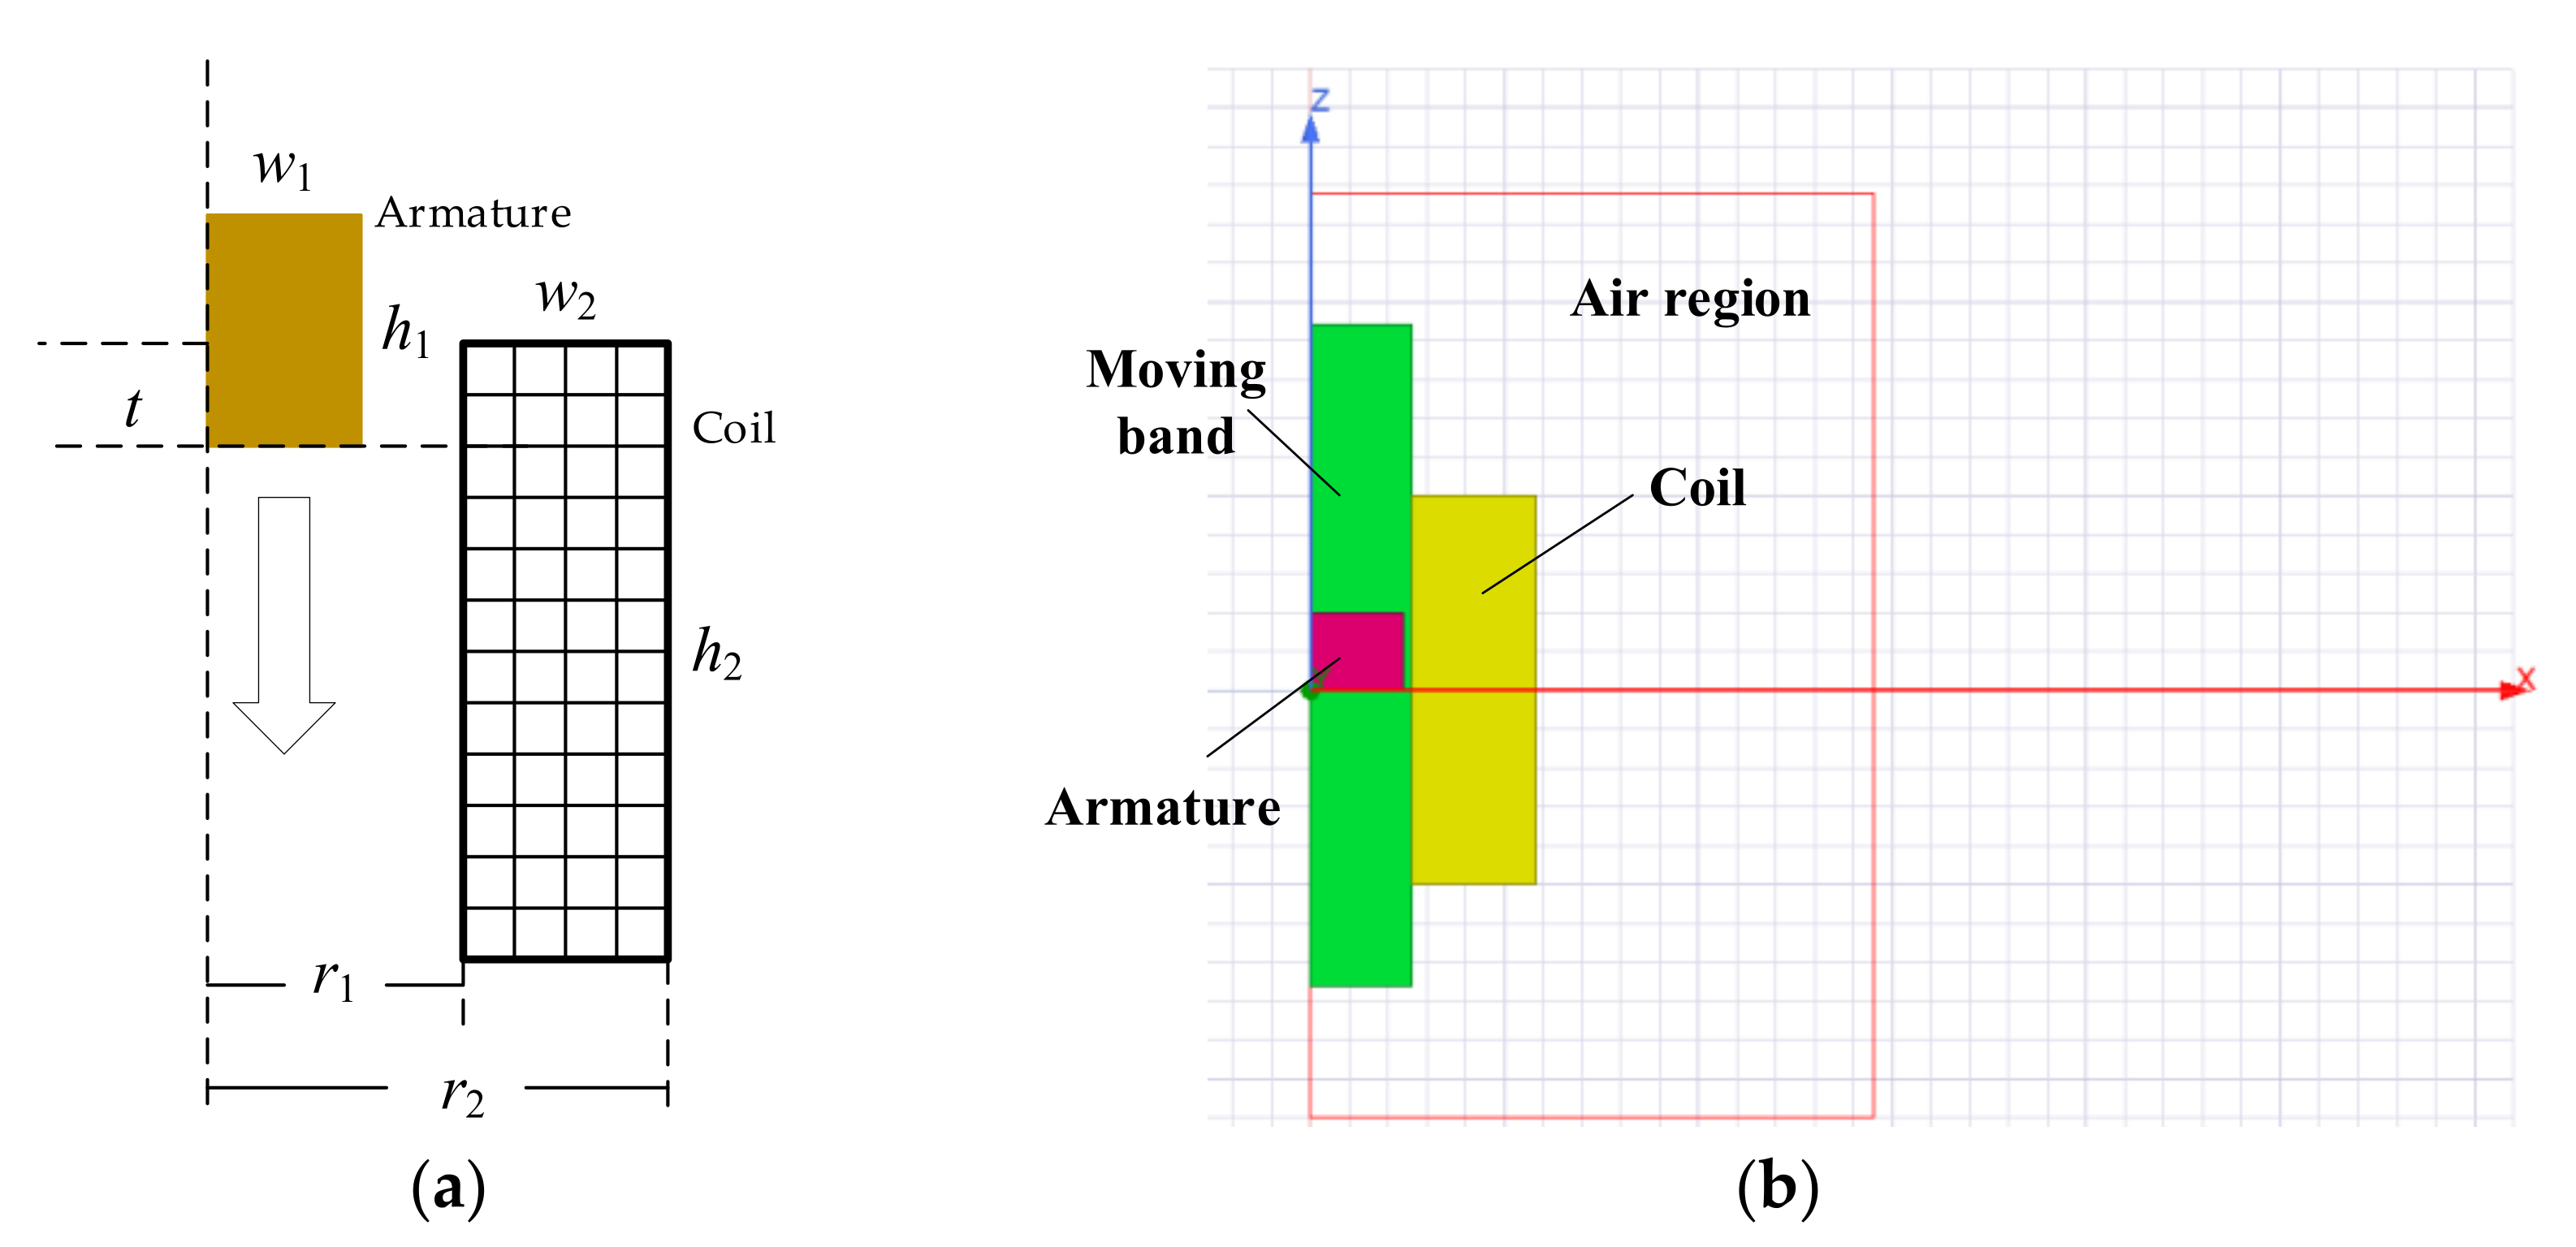
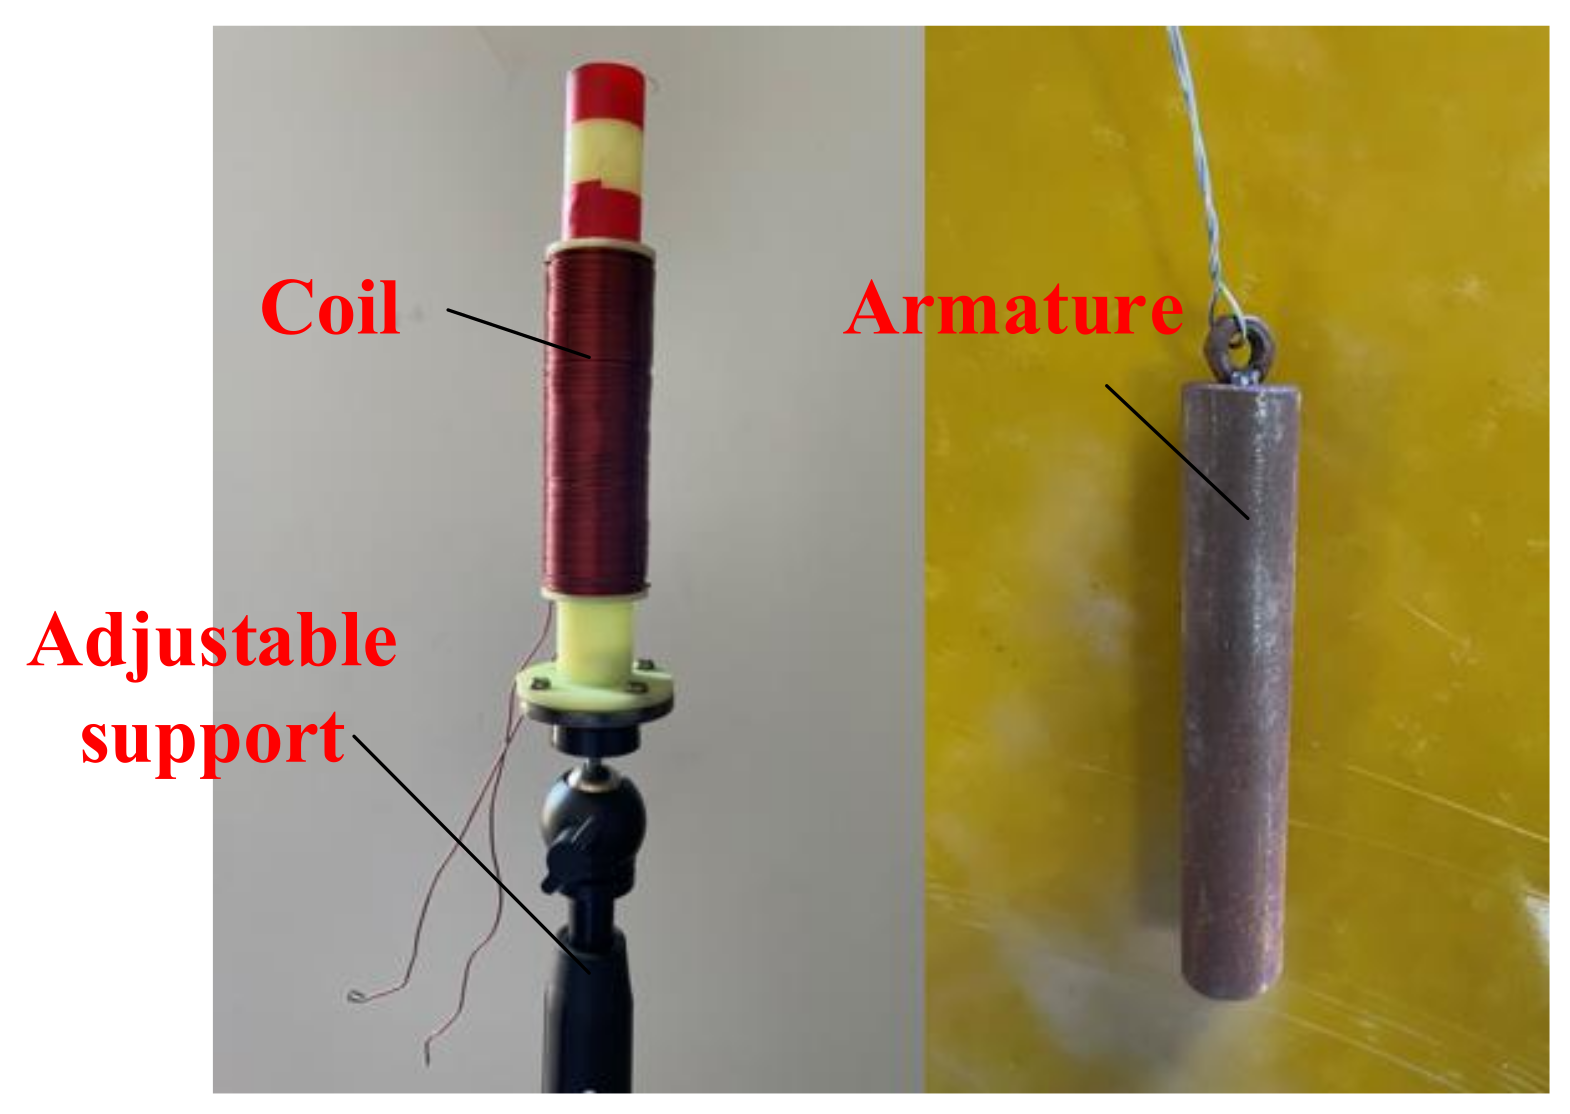
3.2. Plunger Electromagnet

Value and effective range of electromagnetic force are the main factors to be considered in the parameter optimization of an electromagnet. First, it is necessary to determine the approximate optimization objective according to the parameters of the test line. Through the loading and simulation analysis of the finite element model of the above wire system, the electromagnetic force required by the system designed in this paper is about 20~100 N, and the effective action range should be about 10 cm when considering the margin. Thus, with the parameters in Table 4 as the reference parameters, the finite element model of plunger electromagnet was established in Maxwell 2019 software, as shown in Figure 2.
The axial thickness h2 and radial thickness w2 of the coil and the axial thickness h1 and radial thickness w1 of the armature were changed to explore the design parameters that meet the requirements for the minimum coil ampere-turns so as to effectively reduce the voltage and power of the power supply device. The outer diameter of the armature is set to 2 mm less than the inner diameter of the coil for insulation requirements. When the lower end of the armature is flush with the upper surface of the coil, the displacement is set as 0. The total ampere-turns of the fixed coil are 20 kA. The influence of different parameters on the output of electromagnet is shown in Figure 3.
When other parameters remain unchanged, the change of the radial thickness of the coil has little influence on the electromagnetic force. The smaller the axial thickness of the coil is, the larger the electromagnetic force peak value is. However, the effective range of the electromagnetic force decreases. When the armature radial thickness increases, the electromagnetic force also increases. When the armature axial thickness increases, the electromagnetic force increases with a larger effective range. Obviously, when the armature center moves below the center line of the coil, the electromagnetic force reverses. Therefore, the maximum acting distance of the electromagnetic force is as follows:
l max = 1 2 ( h 1 + h 2 )
Therefore, the armature with a large section should be selected under the condition of ensuring the effective range of electromagnetic force. On the other hand, too much weight of armature will affect the original vibration characteristics of the wire system and reduce the power utilization. The drop of the wire caused by the armature at rest condition should not exceed 5% of the target vibration amplitude when galloping. Thus, the mass of the armature should not exceed 0.18 kg through static structure finite element analysis if the target amplitude is 10 cm. The expression of armature mass calculation is as follows:
m = ρ · π w 1 2 h 1
where m is the mass of the armature and ρ is the density. The final parameters of the coil and armature designed in this paper are shown in Table 5 after comprehensive consideration of the electromagnetic force value, scope of action and mass of the armature. The coil is made of enamel-coated wire with an outer diameter of 0.84 mm. The coil frame is made of insulating epoxy resin, which is fixed on a round base and secured by bolts.
The photo of the plunger electromagnet, including the coil made by enamel-coated copper wire, armature made by electrical pure iron and the adjustable support, is shown in Figure 4. The measured coil resistance is 1.674 Ω, and the coil self-induction is 2.15 mH.

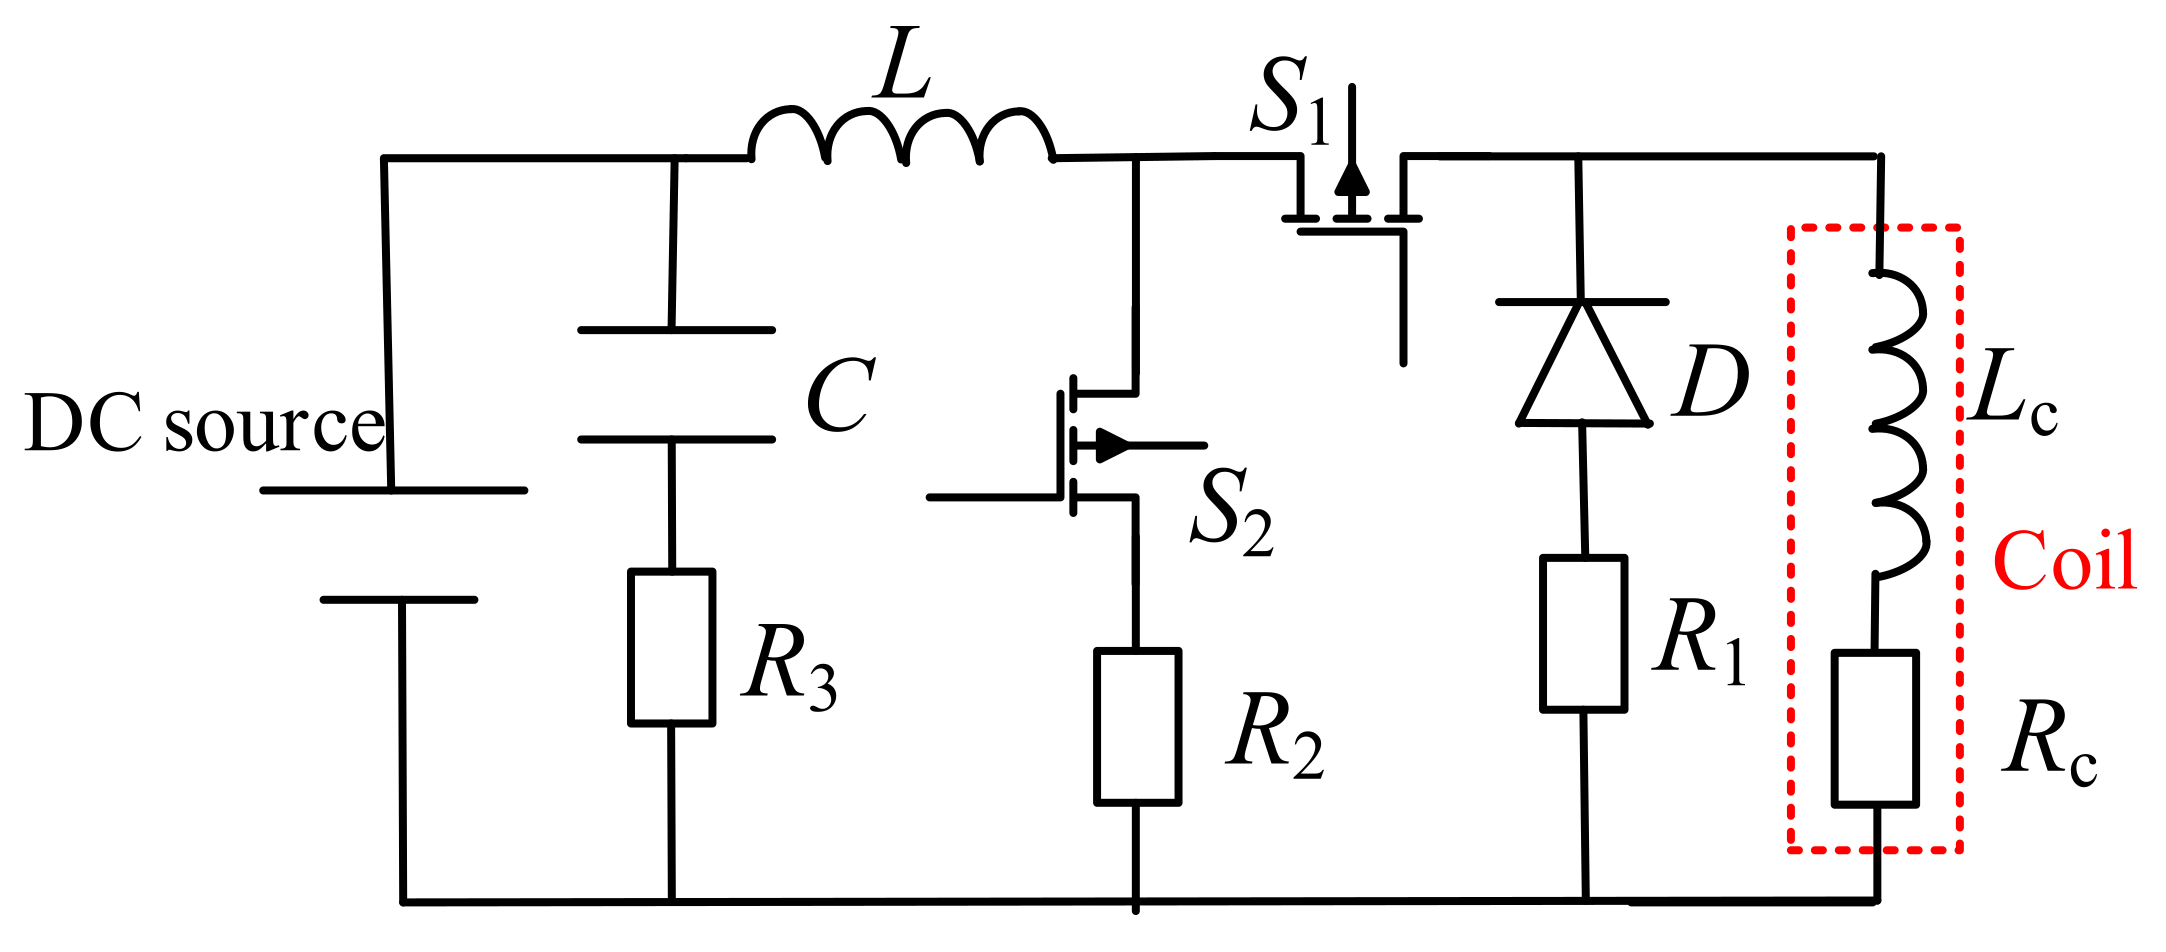
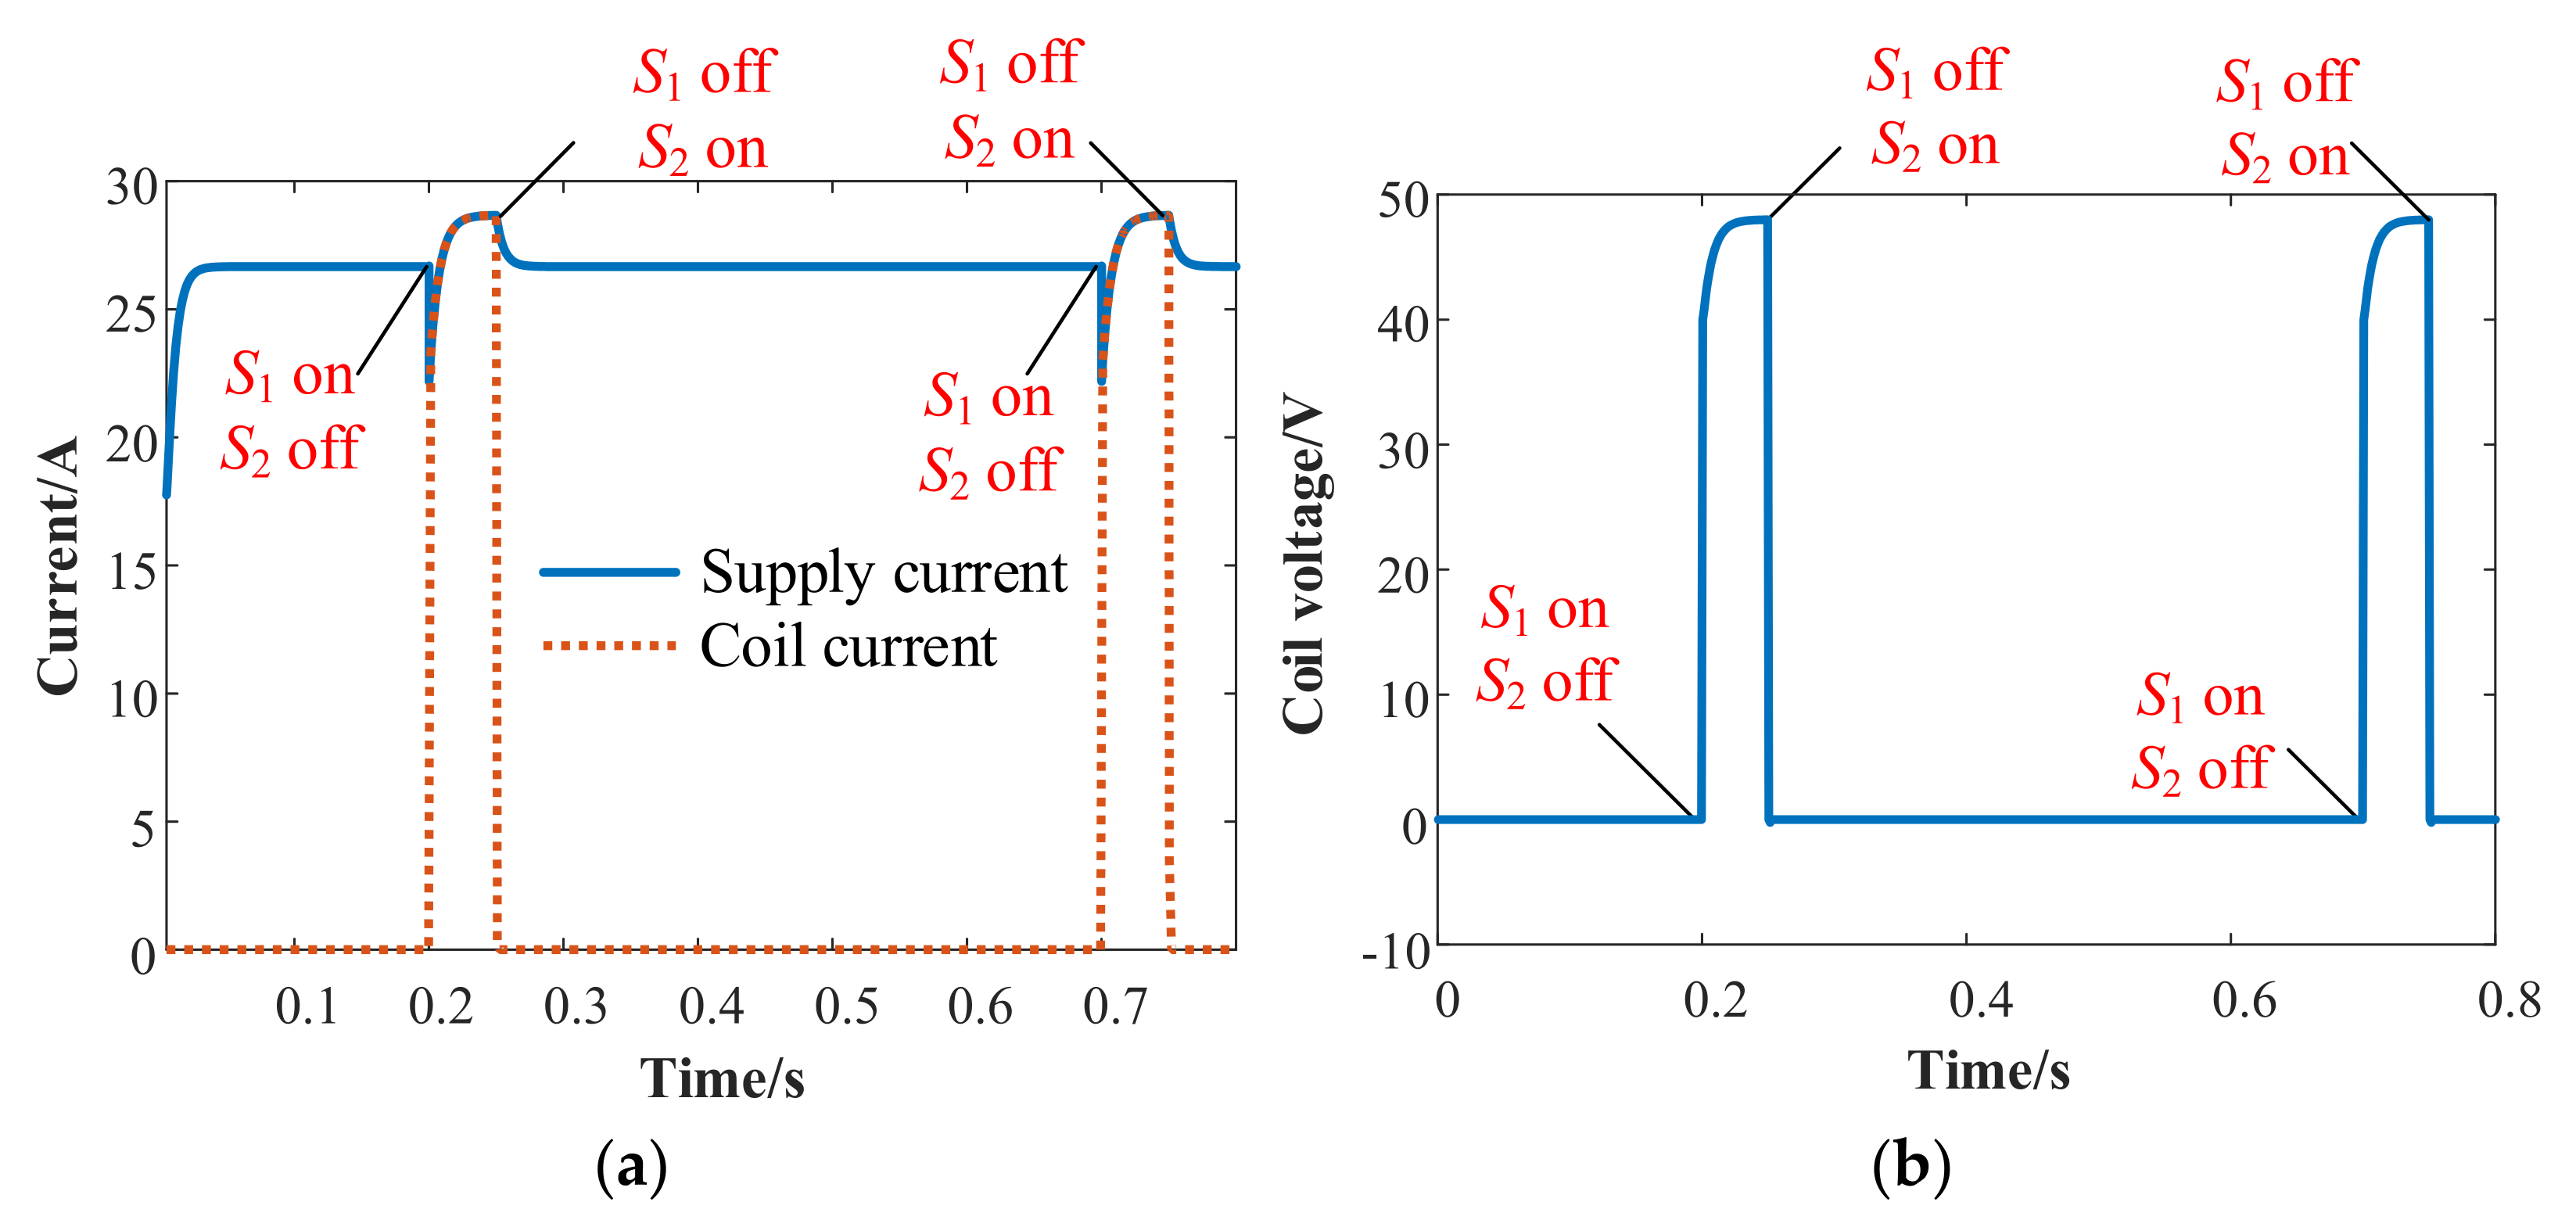
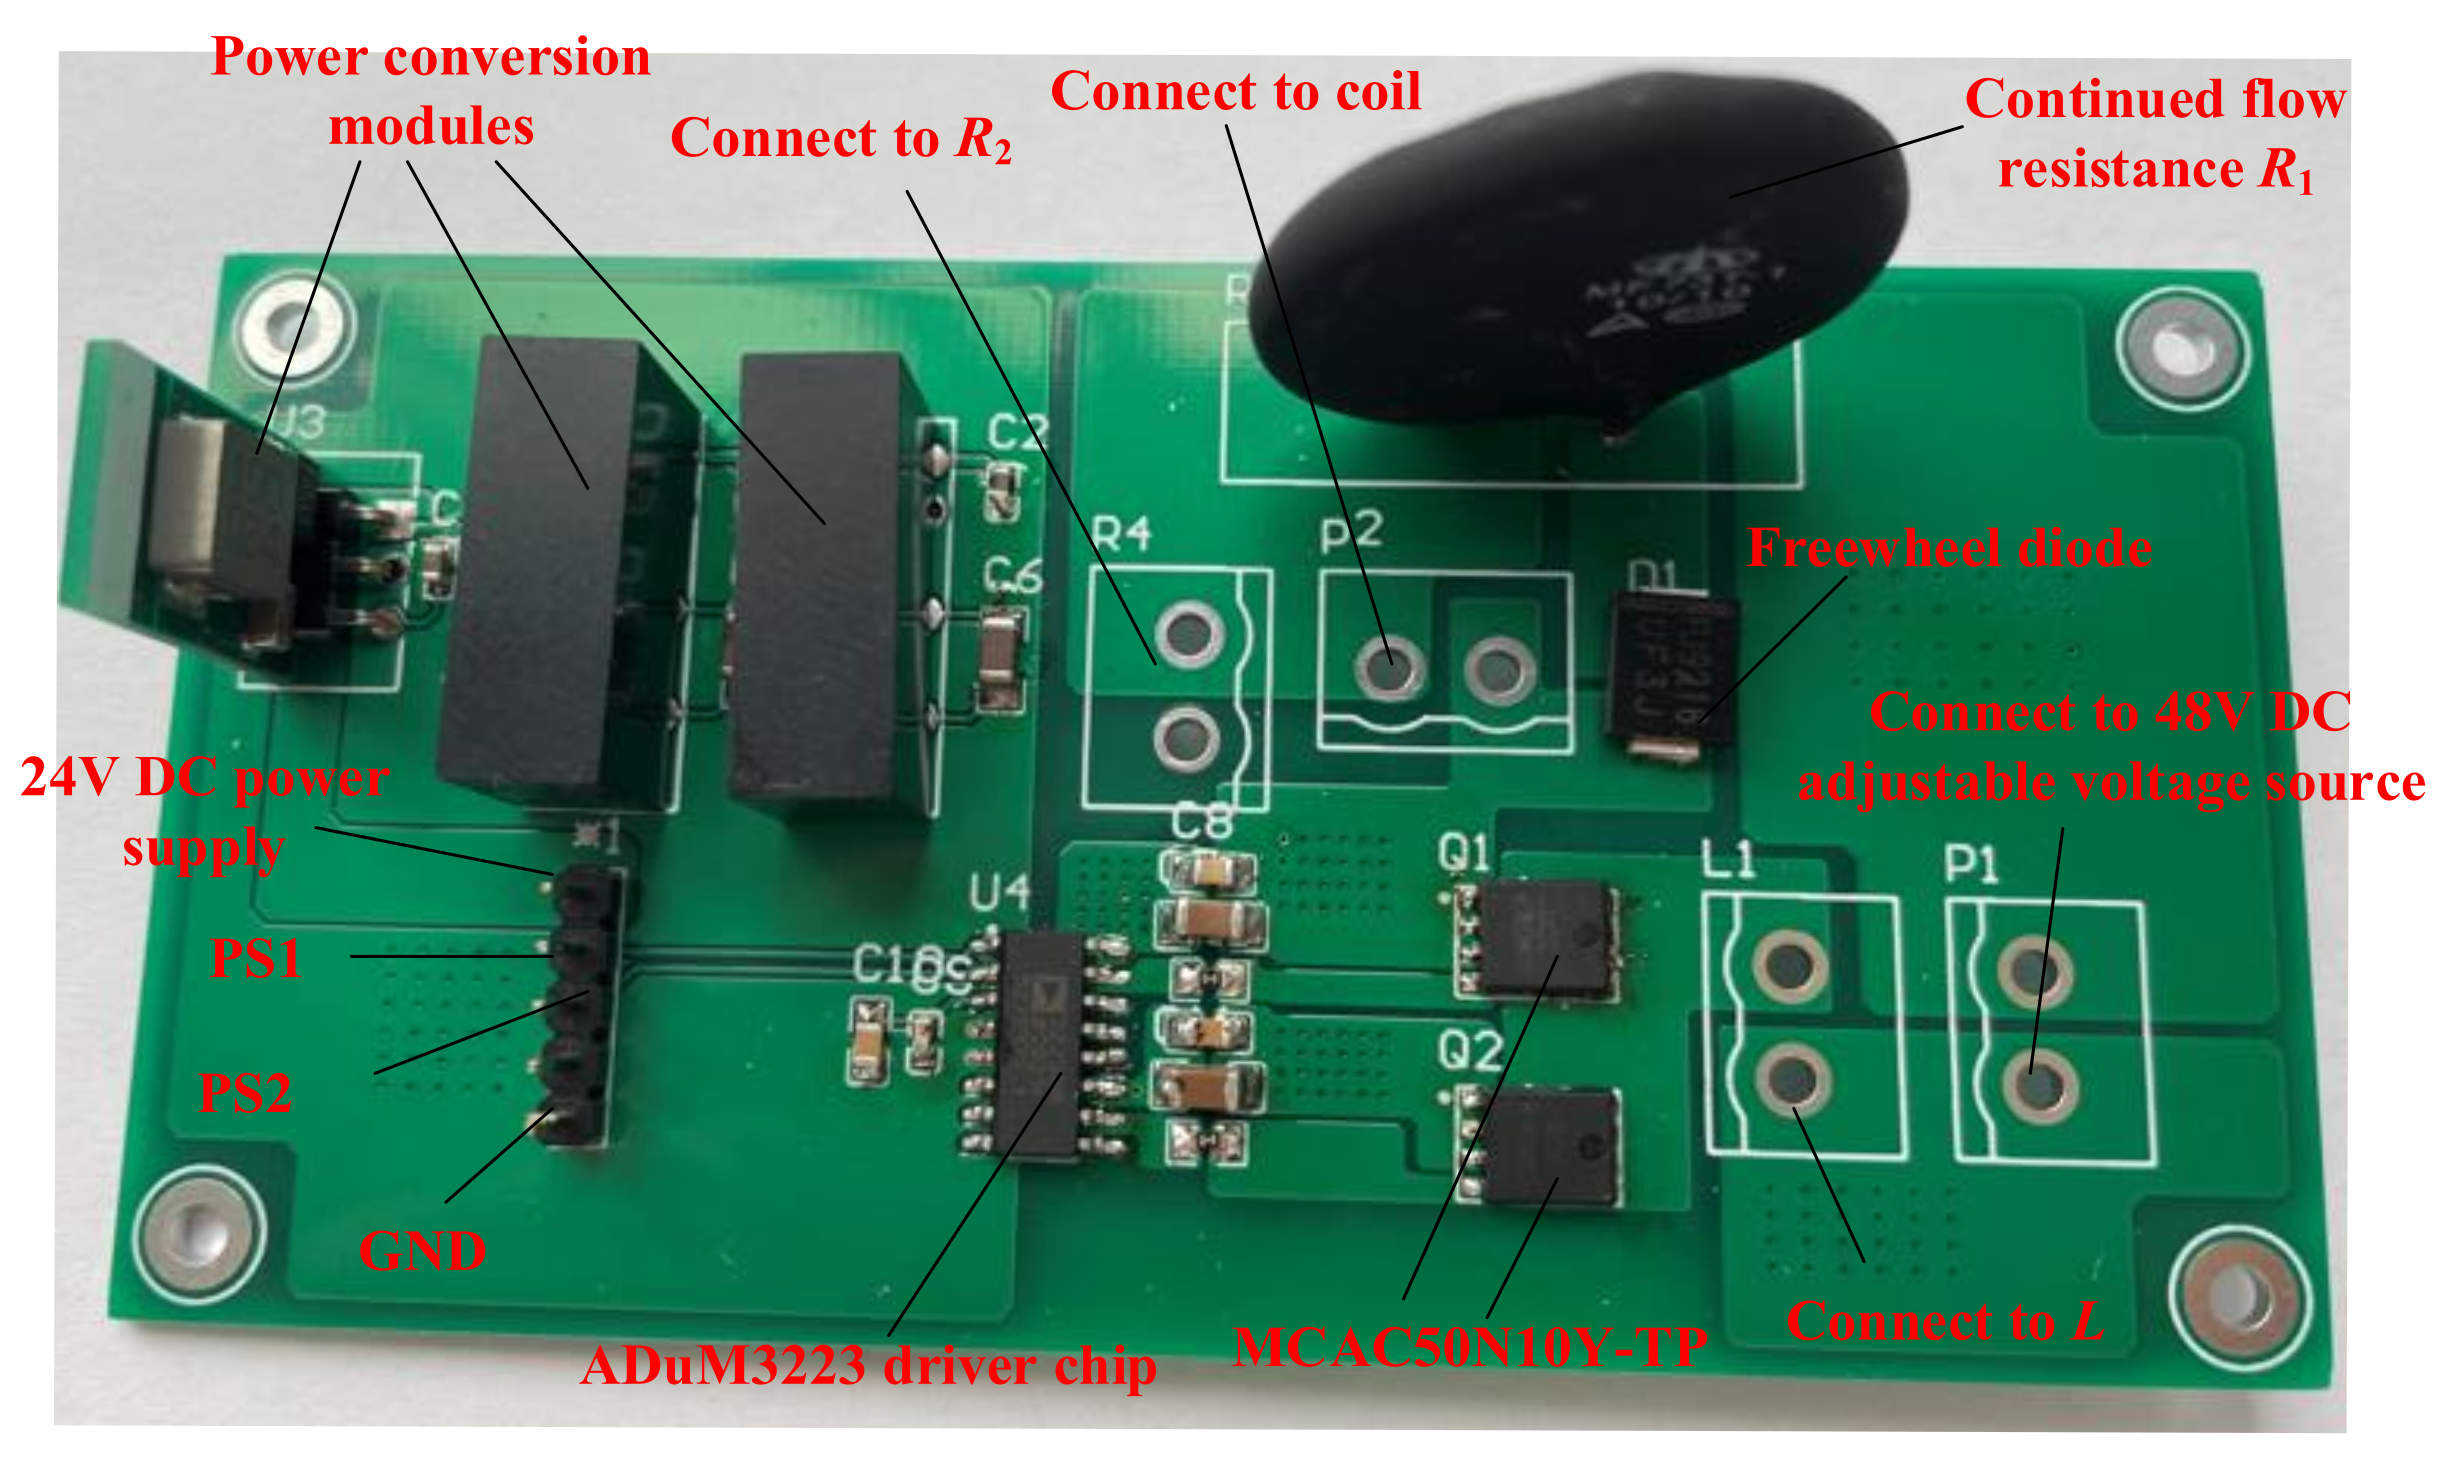
3.3. The Power Supply Circuit

According to the principle of the galloping test system, the power supply circuit shown in Figure 5 was designed to provide periodic pulse DC for the coil.
The coil is powered by an adjustable DC voltage source with a maximum output voltage of 48 V; capacitance C acts as a voltage regulator. Since the coil current in each cycle is pulsed, when the electromagnet works for a long time, the DC power supply needs to undergo current mutation many times, which may cause damage to the power supply. Therefore, the power supply current is always kept stable by parallel switch S2 and resistance R2 with a value equal to Rc. A large inductor L is connected in series on the power supply; it can not only keep the power supply current stable but also make the coil current rise rapidly when S1 is closed, thus improving the acting efficiency of electromagnetic force. Since the coil is an energy storage component, switch S1 will produce large overvoltage and damage the switch device when the coil current is suddenly cut off. Therefore, the freewheel diode D and large resistor R1 are connected in parallel with the coil. When S1 is off, electricity flows through the diode D and releases energy at R1, which can quickly reduce the coil current to zero and avoid the damage of switch S1 under large overvoltage. Considering the measured resistance and inductance of the coil, the inductance of L used in this paper is 10 mH. R1 uses a ripple resistance of about 10 Ω, and R2 uses a ripple resistance of about 1.8 Ω. The voltage regulator C and R3 are already integrated into the 48 V adjustable DC voltage source; therefore, no additional design is required.
At the beginning of the test, S1 is disconnected and S2 is closed. The current of the main circuit rises rapidly and then remains stable. When the monitoring module judges that the coil needs to be energized, it should close S1 and disconnect S2. When the coil needs to be powered off, the monitoring module should close switch S2 and disconnect S1. Considering that there may be a certain difference in the turn-off time of the two switches (microsecond level), and to avoid the “dead zone” in which both switches are disconnected, a time interval of 0.5 ms is set for the action of the two switches in each cycle so that a branch can be guaranteed to be in working state at every moment.
The loop model of the designed power supply was established in MATLAB according to the actual parameters. The simulation includes two cycles and four switching processes. The coil current and power current change with time as shown in Figure 6a, and coil voltage changes with time as shown in Figure 6b.
As shown in Figure 6, when S1 is on and S2 is off, the electromagnet starts to work and the coil current and voltage rise rapidly to peak value. Since the switching interval is set to prevent the “dead zone”, the power supply current decreases slightly and then quickly rises to the peak. When S1 is off and S2 is on, the electromagnet stops working and the coil current and voltage curve rapidly drops to 0. During the whole process, the power supply current is stable between 22 and 28 A, which is consistent with the design goal. The simulation results prove the reliability of the power supply circuit.

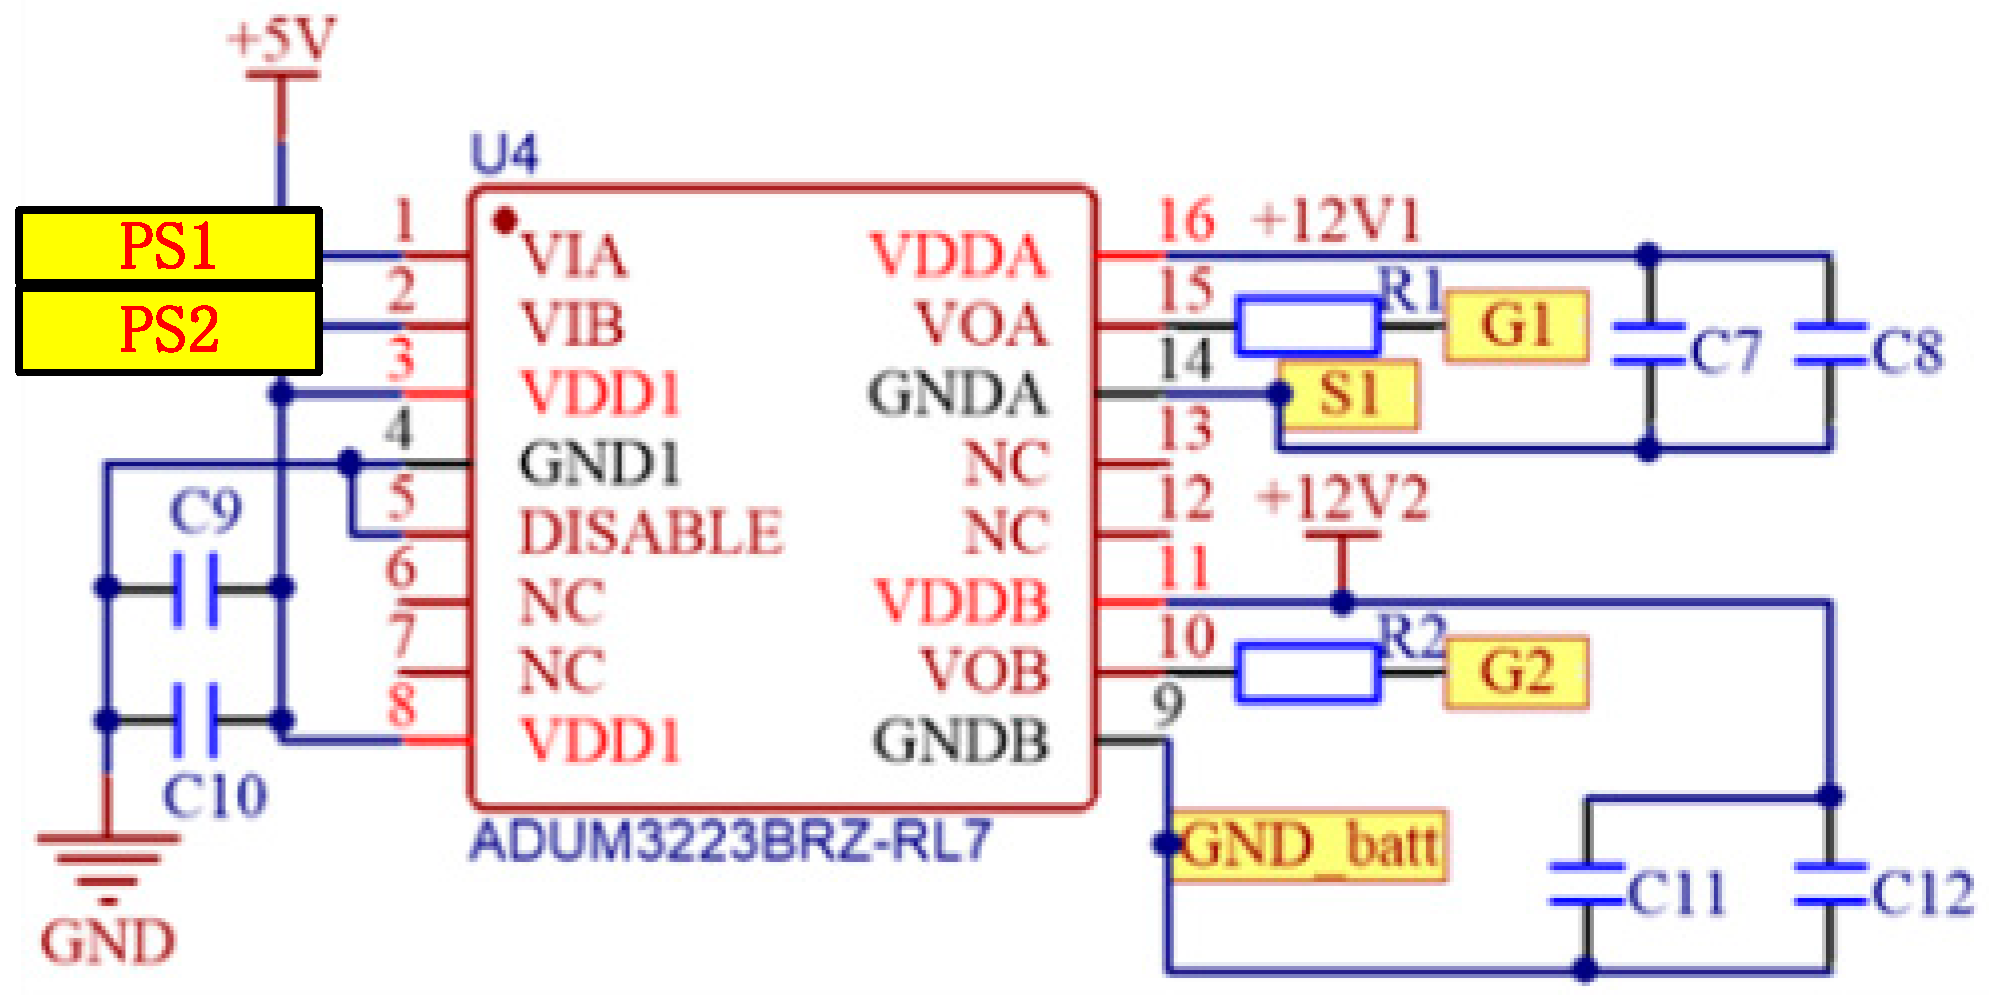
3.4. Switch Control Loop

The type of switch S1 and switch S2 is MCAC50N10Y-TP. Since the output voltage signal of the digital I/O device NI-USB 6501 is less than 5 V and the output power is small, it cannot directly drive the switch. The driver chip ADuM3223 is used to design the driving circuit as shown in Figure 7 in order to help the digital I/O device to drive the switch.
The two signals PS1 and PS2, which are output from the digital I/O device, can be converted into voltage signals G1 and G2 through the ADuM3223 driver chip. G1 and G2 are connected to the gate of switch S1 and switch S2, respectively, to control the switch. As shown in Figure 7, the drive module needs to provide one 5 V switching power supply and two 12 V switching power supplies. Three power conversion modules are designed to simplify wiring and improve the reliability of the test system. Those conversion modules are connected to a unified external 24 V DC power supply and generate one 5 V voltage signal and two 12 V voltage signals, respectively, in order to supply power to the ADuM3223 driver.
The switch control module and parts of the main loop are integrated on the PCB board, as shown in Figure 8.

3.5. Signal Acquisition and Processing

According to the design principle, the vibration of the wire and coil current is monitored during the test. Considering the acceleration variation range of the wire during vibration, a ca-YD-1160 piezoelectric acceleration sensor is used to monitor the vibration of typical points on the wire. The acquisition of acceleration signal and power supply of sensors is provided by the DSA device NI-USB 4431. Through the LabVIEW software, the relevant program was written to process and analyze the acceleration signal. It can realize the real-time display function of acceleration, velocity and displacement during wire vibration. According to the judgment basis of adaptive excitation interval time, two pulse signals as shown in Section 3.4 are output by the digital I/O device NI-USB 6501 so as to control the opening and closing of the switch. Detailed displacement calculation method and adaptive excitation judgment method will be introduced in Section 4. MIK-DZI-50A current transmitter is used for coil current monitoring. The sensor can monitor DC current based on the Hall effect, and the measuring range is 0~50 A DC.
The overall photo of the electromagnetism-based galloping test system is shown in Figure 9.

4. Test Results and Discussion

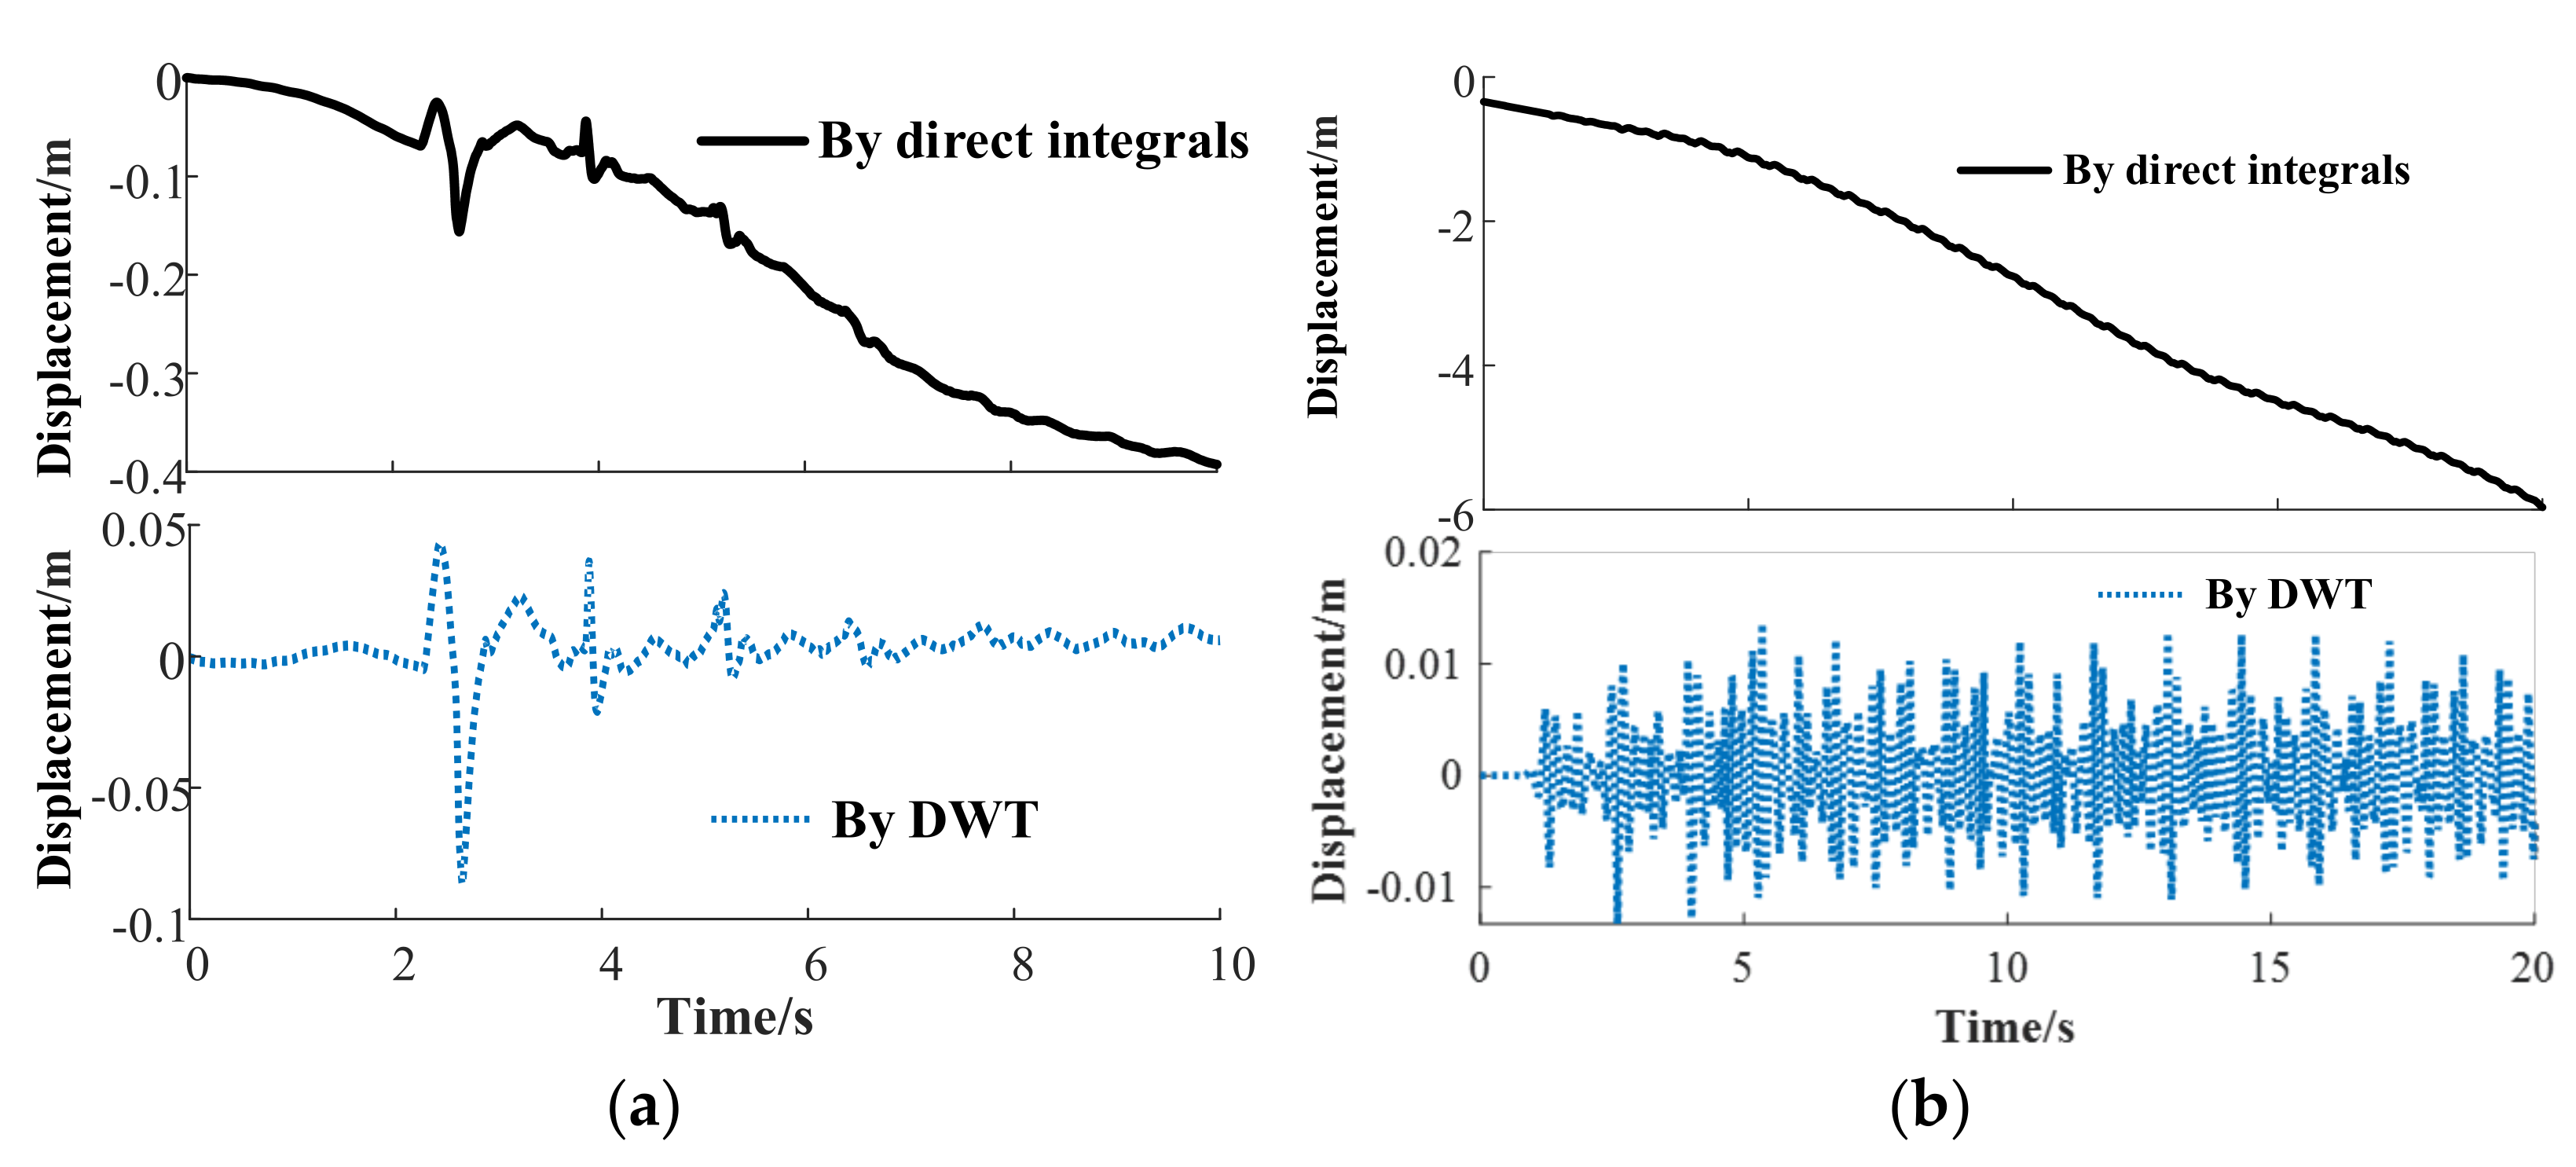
4.1. Calculation of Vibration Displacement

The acceleration time series {a(t)} of wire vibration can be obtained by the monitoring module designed in Section 3.5. The vibration displacement of the measured point at time t can be calculated by two-time integration:
s ( t ) = s ( 0 ) + 0 t v ( t ) d t = s ( 0 ) + v ( 0 ) t + 0 t a ( t ) d t
where s(t) and v(t) are the displacement and velocity at time t. In fact, the measured acceleration time series is discrete and contains various noises, such as thermal noise, system error and high-frequency noise. Especially due to the influence of low-frequency components, the displacement value calculated by direct integration will contain a trend term, resulting in a monotonic increase or decrease over time. However, the velocity and displacement time series of the wire vibration will oscillate around zero. Therefore, it is necessary to decompose the time series and remove the low-frequency and high-frequency components in order to accurately calculate the displacement of wire vibration.
The traditional Fourier transform is often used for signal decomposition; however, the localization information in the time domain is lost when using the fast Fourier transform algorithm (FFT). Considering the geometric nonlinearity of the wire system, the excitation force is not applied at a fixed frequency during the excitation process, and the vibration frequency of the wire will change with time. Therefore, wavelet decomposition and reconstruction are applied to the calculation of displacement in this paper. Due to the adaptive window, the wavelet transform can be analyzed locally in time and frequency domains. The time–frequency characteristics of wavelet analysis can be used to decompose the displacements of typical points of the wire.
The continuous wavelet transform (CWT) of a square-integrable signal y(t) is as follows [20,21]:
W T y ( τ , s ) = 1 s + y ( t ) ψ ( t τ s ) d t
where s is the scale parameter, τ is the translation parameter, * stands for complex conjugate and ψ(t) is the mother wavelet. The signal can be decomposed into high- and low-frequency components after multiple decomposition. The signal reconstruction expression is as follows:
y ( t ) = s 2 C ψ 0 + + W T y ( τ , s ) ψ a , b ( t ) d s d τ
Since the displacement signal is a discrete time series, a fast discrete wavelet transform (DWT) is adopted. In brief, the mean value of the collected acceleration data is subtracted and then two-time integrals are calculated at first. Then, through decomposing and reconstructing the displacement time series by using the above DWT method, the real displacement data of wire vibration can be obtained. Taking the acceleration data of the excitation point under single excitation and continuous excitation with second-order natural frequency interval as examples, the displacement–time curve obtained by direct integration is compared with that obtained by the DWT method, as shown in Figure 10.
Obviously, regardless of whether the displacement is calculated under single excitation or continuous excitation, the signal obtained by direct integration contains the first-order trend term, and the displacement signal is seriously distorted. The displacement–time curve obtained after DWT treatment fluctuates around 0, which is consistent with the observation result. The comparison results can prove the accuracy of displacement calculation.

4.2. Judgment of Excitation Interval Time

According to the design principle of the system, the vibration amplitude of the wire increases as the electromagnetic force continues to inject mechanical energy into the transmission line system. Therefore, the action direction of each exciting force should be consistent with the movement direction of the exciting point; otherwise, the vibration of the wire will be hindered. When the exciting force is applied to the wire, the exciting wave will be transmitted to the other end of the wire and the transmission time of one cycle will correspond to the natural frequency of the wire system. Due to the geometric nonlinearity of the overhead transmission wire system, the shape of the wire is changed and the natural frequency of the wire system is also changed with the increase in vibration amplitude. It is theoretically impossible to ensure that the direction of electromagnetic force action is consistent with the movement direction of the operating point when the wire is stimulated at a fixed time interval corresponding to the natural frequency. Thus, it is necessary to judge the adaptive excitation interval time by monitoring the vibration of the wire to ensure that the electromagnetic force infuses positive energy into the wire system each time the wire is excited.
Relative to acceleration, the displacement–time curve changes more gently. From the displacement curve, the time period when the excitation point moves downward from the highest point can be seen intuitively. However, it is found that the method of judging by displacement is not feasible in practical application for the following two reasons: The first reason is that the calculation of displacement requires two-time integration of acceleration time series, DC component removal, wavelet decomposition and signal reconstruction. Then, the calculation time is so long that the system cannot supply power to the coil in time to meet the requirements. The second reason is that there is a certain error in the calculated displacement data compared with the actual value, which may lead to inaccurate judgment. Thus, it is necessary to extract the characteristics of the original acceleration signal directly and judge whether the coil is energized or not.
The time–frequency characteristic of wavelet analysis can help the feature extraction of the original wire vibration acceleration signal. In this paper, the original acceleration signal is decomposed by wavelet analysis, and then the low-frequency component is reconstructed to obtain the characteristics of the acceleration signal, which can help to judge the switching time of the switches S1 and S2. Taking the measured acceleration under continuous excitation as an example, the acceleration signal is decomposed into 10 layers by wavelet decomposition, and the wavelet function is db7. The reconstructed results of different layers are shown in Figure 11.
According to Figure 11, if the number of reconstructed layers is small (layer 5), the spectral results are basically the same as those of the original measured acceleration signal, and the signal still contains a large number of high-frequency signals and is difficult to use for the judgment of excitation time interval. When the number of reconstruction layers is too large (layer 10), the useful signals are removed by wavelet decomposition, and the remaining components cannot reflect the feature of the original signal. As for the separated signal of layer 9, the results retain the components near the second-order natural frequency of the system well, and the curve is smooth with less interference, which can be used to judge the adaptive time interval well. Therefore, the signal of layer 9 should be reconstructed as the basis for judgment. When the system detects that the acceleration curve is at the lowest point, the excitation point will vibrate to the highest point. The coil is energized through the switch control module, and then the electromagnetic force is applied to the wire system, which continuously injects energy into the system. According to the actual measurement, the judgment time based on the acceleration signal is less than 10 ms, which fully meets the requirements of the system.

4.3. Measured Results of Wire Vibration under Adaptive Excitation

The acceleration sensors were installed at the typical points of the wire during the test. The excitation point was about 1 m away from the wire hanging point. In order to prove the superiority of the adaptive excitation method, the wire system was excited by fixed time interval excitation and adaptive excitation. The power supply voltage was set to 20 V for both excitation methods. The fixed electromagnetic excitation interval was 0.64 s, corresponding to the second-order natural frequency of the system. As for the adaptive excitation method, the first time interval of excitation was 0.64 s, and then the judgment method based on acceleration feature extraction as described in Section 4.2 was adopted. Monitoring results of wire displacement under fixed time interval excitation and the spectrum analysis results are shown in Figure 12a,e. Monitoring results under adaptive time interval excitation and the spectrum analysis results are shown in Figure 12b,f.
In order to explore the influence of coil current on wire vibration under adaptive excitation, the power supply voltage was changed to 25 and 30 V. The monitoring results are shown in Figure 12c,d, and spectrum analysis results are shown in Figure 12g,h.
As shown in Figure 12a, when the wire system is excited with fixed interval time, the vibration amplitude of each typical point on the wire cannot be stable in a certain range, even though the interval time corresponds to the second-order natural frequency of the system. In this way, the electromagnetic force cannot be guaranteed to act on the moment when the exciting wave is transmitted back to the exciting point every time, and the direction of the electromagnetic force may be inconsistent with the movement direction of the exciting point, so the vibration amplitude of the wire is sometimes large and sometimes small. It can also be seen from the spectrum in Figure 12e that the vibration of the wire caused by this excitation mode contains a large number of high-order components. The displacement results with the adaptive excitation method proposed in this paper are shown in Figure 12b–d. With the action of the pulsed electromagnetic force, the amplitude of wire vibration increases gradually at the beginning and finally stabilizes within a certain range due to the action of damping. The vibration amplitude is the largest at the one-fourth point of the wire, and the vibration amplitude is small at the midspan and excitation point of the wire, which is consistent with the characteristics of the two-loop mode of actual transmission line galloping. As shown by the spectrum analysis results in Figure 12f–h, the obvious peak of the vibration spectrum is at about 1.6 Hz, which is close to the second-order inherent frequency of the test line system. The results show that the vibration frequency of the wire is single and the vibration amplitude of the wire can be stable within a certain range. The vibration pattern of the wire is consistent with the two-loop mode of actual transmission line galloping.
When the power supply voltage is 20 V, the vibration amplitude of the wire in the stable stage is about 4–6 cm. When the power supply voltage is 25 V, the vibration amplitude is about 6–9 cm. When the power supply voltage is 30 V, the vibration amplitude is about 10–15 cm. The results show that the vibration amplitude of the wire can be controlled by changing the voltage. As the coil current increases, the electromagnetic force increases as well, and the vibration amplitude of the wire increases when the wire vibrationfinally stabilizes.

5. Conclusions

In this work, an electromagnetism-based transmission line galloping test system was designed, and the calculation method of vibration displacement and adaptive excitation method based on acceleration were studied in detail. The following conclusions are made:
(1)
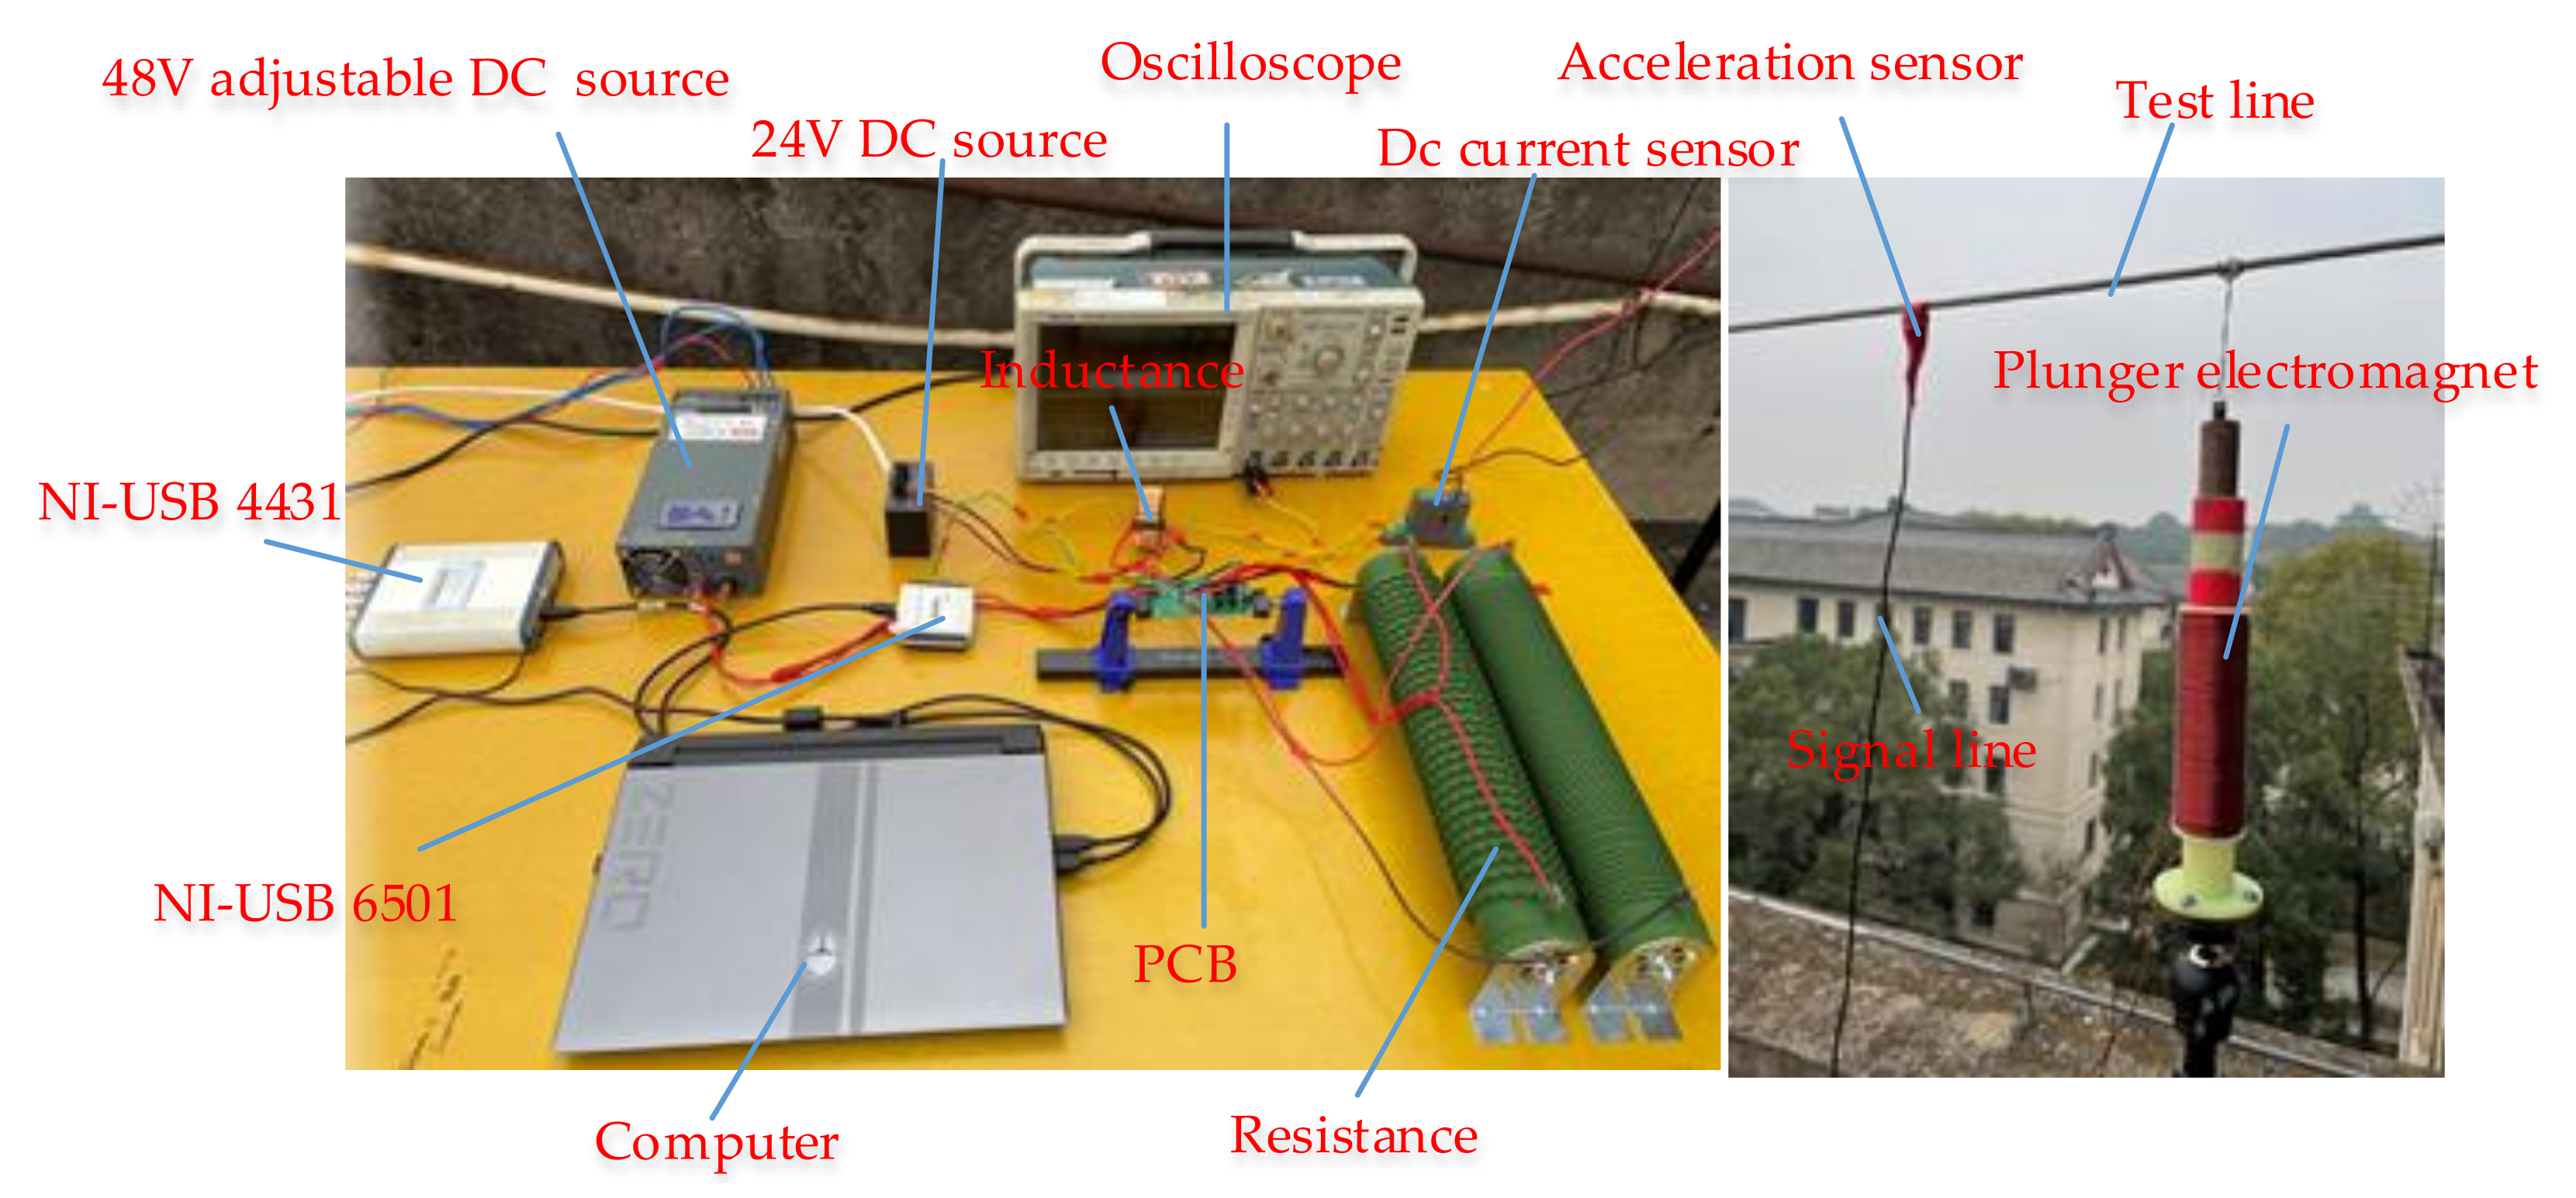
Taking a reduced-scale test line with a 35.4 m span as an example, the plunger electromagnet and the corresponding power supply loop were designed to provide the impulse excitation force for the wire system. Acceleration sensors, DSA device, digital I/O device and computer were used to monitor wire vibration and control the coil current.
(2)
The vibration displacement curve obtained by direct integration is seriously distorted. The calculation method based on DWT was proposed in this paper. The displacement–time curve obtained after DWT treatment fluctuates around 0, which is consistent with the observation result.
(3)
Considering the geometric nonlinearity, the adaptive excitation method based on wavelet analysis of the original measured acceleration data was proposed. It can extract the feature of acceleration and reduce the time of judging the excitation interval. The test results show that the wire displacement under fixed interval excitation contains high-order components, and the vibration amplitude fluctuates greatly. Under adaptive electromagnetic force excitation, the vibration frequency of the wire is close to the second-order inherent frequency, and the vibration amplitude increases at first and then remains constant within a certain range due to damping. The vibration pattern is consistent with the two-loop mode of actual transmission line galloping.
(4)
When the supply voltage is set as 20, 25 and 30 V, the vibration amplitude of the wire in the stable stage is about 4–6 cm, 6–9 cm and 10–15 cm, respectively. This shows that the vibration amplitude can be controlled by coil current.
Further work will focus on the damage analysis of towers and insulator strings by vibration amplitude, as well as the dynamic tension variation of transmission lines during galloping by using the designed electromagnetism-based transmission line galloping test system.

Author Contributions

Conceptualization, L.Z. and J.R.; data curation, L.Z. and J.L.; formal analysis, J.L.; investigation, L.Z.; methodology, L.Z.; resources, W.C., J.L. and Z.F.; software, L.Z.; supervision, J.R. and W.C.; validation, J.R., W.C. and D.H.; writing—original draft, L.Z.; writing—review and editing, J.R., J.L. and D.H. All authors have read and agreed to the published version of the manuscript.

Funding

This research was funded by the Key R&D Program of Hubei Province, China, grant number 2020BAB108.

Data Availability Statement

The data presented in this research study are available in this article.

Conflicts of Interest

The authors declare no conflict of interest.

References

  1. Tian, L.; Guo, L.; Ma, R.; Gai, X.; Wang, W. Full-Scale Tests and Numerical Simulations of Failure Mechanism of Power Transmission Towers. Int. J. Struct. Stab. Dyn. 2018, 18, 1850109. [Google Scholar] [CrossRef]
  2. Zhao, L.; Huang, X.; Zhang, Y.; Tian, Y.; Zhao, Y. A Vibration-Based Structural Health Monitoring System for Transmission Line Towers. Electronics 2019, 8, 515. [Google Scholar] [CrossRef] [Green Version]
  3. Tadeusiewicz, M.; Hałgas, S. A Method for Diagnosing Soft Short and Open Faults in Distributed Parameter Multiconductor Transmission Lines. Electronics 2021, 10, 35. [Google Scholar] [CrossRef]
  4. Yang, J.; Liu, B.; Zhao, B.; Liu, Y. Method for the Development of Galloping Distribution Maps for Overhead Transmission Lines. IEEE Trans. Power Syst. 2021, 36, 5956–5958. [Google Scholar] [CrossRef]
  5. Mou, Z.; Yan, B.; Yang, H.; Wu, K.; Wu, C.; Yang, X. Study on anti-galloping efficiency of rotary clamp spacers for eight bundle conductor line. Cold Reg. Sci. Technol. 2022, 193, 103414. [Google Scholar] [CrossRef]
  6. Den Hartog, J.P. Transmission line vibration due to sleet. Trans. Am. Inst. Electr. Eng. 1932, 51, 1074–1076. [Google Scholar] [CrossRef]
  7. Nigol, O.; Buchan, P. Conductor galloping-Part II Torsional mechanism. IEEE Trans. Power App. Syst. 1981, PAS-100, 708–720. [Google Scholar] [CrossRef]
  8. Lou, W.; Wu, D.; Xu, H.; Yu, J. Galloping Stability Criterion for 3-DOF Coupled Motion of an Ice-Accreted Conductor. J. Struct. Eng. 2020, 146, 04020071. [Google Scholar] [CrossRef]
  9. Li, X.; Nie, X.; Zhu, Y.; You, Y.; Yan, Z. Wind Tunnel Tests on Aerodynamic Characteristics of Ice-Coated 4-Bundled Conductors. Math. Probl. Eng. 2017, 2017, 1628173. [Google Scholar]
  10. Lu, J.; Wang, Q.; Wang, L.; Mei, H.; Yang, L.; Xu, X.; Li, L. Study on wind tunnel test and galloping of iced quad bundle conductor. Cold Reg. Sci. Technol. 2019, 160, 273–287. [Google Scholar] [CrossRef]
  11. Matsumiya, H.; Nishihara, T.; Yagi, T. Aerodynamic modeling for large-amplitude galloping of four-bundled conductors. J. Fluids Struct. 2018, 82, 559–576. [Google Scholar] [CrossRef]
  12. Zhou, L.; Yan, B.; Zhang, L.; Zhou, S. Study on galloping behavior of iced eight bundle conductor transmission lines. J. Sound Vib. 2016, 362, 85–110. [Google Scholar] [CrossRef]
  13. Zhou, A.; Liu, X.; Zhang, S.; Cui, F.; Liu, P. Wind tunnel test of the influence of an interphase spacer on the galloping control of iced eight-bundled conductors. Cold Reg. Sci. Technol. 2018, 155, 354–366. [Google Scholar] [CrossRef]
  14. Ruan, J.; Zhang, L.; Cai, W.; Huang, D.; Li, J.; Feng, Z. Study on Adaptive Excitation System of Transmission Line Galloping Based on Electromagnetic Repulsive Mechanism. Shock Vib. 2021, 2021, 2428667. [Google Scholar] [CrossRef]
  15. Cai, M.; Yan, B.; Lu, X.; Zhou, L. Numerical simulation of aerodynamic coefficients of iced-quad bundle conductors. IEEE Trans. Power Deliv. 2015, 30, 1669–1676. [Google Scholar] [CrossRef]
  16. Gurung, C.-B.; Yamaguchi, H.; Yukino, T. Identification and characterization of galloping of Tsuruga test line based on multi-channel modal analysis of field data. J. Wind Eng. Ind. Aerodyn. 2003, 91, 903–924. [Google Scholar] [CrossRef]
  17. Cai, M.; Yang, X.; Huang, H.; Zhou, L. Investigation on Galloping of D-Shape Iced 6-Bundle Conductors in Transmission Tower Line. KSCE J. Civ. Eng. 2020, 24, 1799–1809. [Google Scholar] [CrossRef]
  18. Zhao, G.; Lu, Z.; Wang, X.; Peng, Y.; Chang, S. Full Scale Experiment for Vibration Analysis of Ice-Coated Bundled-Conductor Transmission Lines. KSCE J. Civ. Eng. 2022, 26, 336–352. [Google Scholar] [CrossRef]
  19. Hu, J.; Yan, B.; Zhou, S.; Zhang, H. Numerical investigation on galloping of iced quad bundle conductors. IEEE Trans. Power Deliv. 2012, 27, 784–792. [Google Scholar] [CrossRef]
  20. Seo, Y.; Kim, S.; Kisi, O.; Singh, V.P. Daily water level forecasting using wavelet decomposition and artificial intelligence techniques. J. Hydrol. 2015, 520, 224–243. [Google Scholar] [CrossRef]
  21. Alickovic, E.; Kevric, J.; Subasi, A. Performance evaluation of empirical mode decomposition, discrete wavelet transform, and wavelet packed decomposition for automated epileptic seizure detection and prediction. Biomed. Signal Process. Control 2018, 39, 94–102. [Google Scholar] [CrossRef]
Figure 1. Scheme of the electromagnetism-based galloping test system.
Electronics 11 00771 g001
Figure 2. The 2D axisymmetric model of the plunger electromagnet. (a) Schematic diagram of the 2D axisymmetric model; (b) model in Maxwell software.
Electronics 11 00771 g002
Figure 3. Simulation results of electromagnetic force. (a) Influence of coil radial thickness on the electromagnetic force; (b) influence of coil axial thickness on the electromagnetic force; (c) influence of armature radial thickness on the electromagnetic force; (d) influence of armature axial thickness on the electromagnetic force.
Electronics 11 00771 g003aElectronics 11 00771 g003b
Figure 4. Photo of the plunger electromagnet.
Electronics 11 00771 g004
Figure 5. Power supply circuit of the plunger electromagnet.
Electronics 11 00771 g005
Figure 6. Simulation results of the loop current and voltage change process. (a) Coil current and power current curves. (b) Coil voltage curve.
Electronics 11 00771 g006
Figure 7. Circuit design of the drive module.
Electronics 11 00771 g007
Figure 8. Photo of the PCB.
Electronics 11 00771 g008
Figure 9. Overall photo of the galloping test system.
Electronics 11 00771 g009
Figure 10. Comparison of displacement calculated by direct integration and DWT method under (a) single excitation and (b) continuous excitation.
Electronics 11 00771 g010
Figure 11. Feature extraction of the measured acceleration signal. (a) Original signal. Reconstruction results of (b) layer 5, (c) layer 9 and (d) layer 10. (e) Spectrum of the original signal. Spectrum of (f) layer 5, (g) layer 9 and (h) layer 10.
Electronics 11 00771 g011
Figure 12. Vibration monitoring results of typical points on the wire under (a) fixed time interval with 20 V power supply voltage and adaptive time interval with (b) 20 V, (c) 25 V and (d) 30 V power supply voltage. Displacement spectrum under (e) fixed interval excitation and adaptive excitation with (f) 20 V, (g) 25 V and (h) 30 V power supply voltage.
Electronics 11 00771 g012
Table 1. Comparison of the existing transmission line galloping test and the proposed system.
ItemWind Tunnel TestFull-Scale TestProposed Test System
Test object sizeReduced small-scale modelFull-size modelReduced small-scale or full-size model
Necessary environmental conditionsArtificial windNatural windNone
Whether the galloping state can be sustainedYesNoYes
Whether the amplitude is controllableYesNoYes
Table 2. Parameters of the reduced-scale test line and the similarity coefficient with the prototype.
ParametersValueSimilarity Coefficient
Span length35.4 m1:8.4
Diameter6 mm1:9.92
Mass per unit length0.1353 kg/m1:65.36
Elasticity modulus110,000 N/mm21:0.59
Table 3. Comparison between in-plane modal analysis results and measured results.
Loop NumberMode Natural Frequency
(FEM Calculation)
Natural Frequency
(Measured Results)
1 Electronics 11 00771 i0010.7732 Hz0.78 Hz
2 Electronics 11 00771 i0021.5448 Hz1.57 Hz
3 Electronics 11 00771 i0032.6583 Hz2.75 Hz
4 Electronics 11 00771 i0043.0909 Hz3.12 Hz
Table 4. Initial parameters of the plunger electromagnet.
ParametersValueParametersValue
Coil materialCopperArmature materialElectrical pure iron
Coil external radius15 mmRelative permeability4000
Coil inside radius10 mmRadial thickness of armature8 mm
Axial thickness of coil100 mmAxial thickness of armature60 mm
Table 5. Designed parameters of the plunger electromagnet.
ParametersValueParametersValue
Coil materialCopperArmature materialElectrical pure iron
Coil external radius16.2 mmrelative permeability4000
Coil inside radius12 mmRadial thickness of armature10 mm
Axial thickness of coil100.8 mmAxial thickness of armature100 mm
Diameter of winding conductor part0.8 mmNumber of coil radial turns5
Thickness of winding insulation0.04 mmNumber of coil axial turns120
Publisher’s Note: MDPI stays neutral with regard to jurisdictional claims in published maps and institutional affiliations.

