Abstract
Solar photovoltaic (PV) power has several advantages such as free availability, absence of rotating parts, can be easily integrated with building architecture, and need little maintenance. However, the PV cell current–voltage (I–V) characteristics are non-linear and power generated from a PV array depends on solar insolation/irradiation and panel temperature. The extracted PV output power is influenced by the accuracy with which the nonlinear power–voltage (P–V) characteristic curve is traced by the maximum power point tracking (MPPT) controller. In this paper, a bio-inspired roach infestation optimization (RIO) algorithm is proposed to extract the maximum power from the PV system (PVS). To validate the usefulness of the RIO MPPT algorithm, MATLAB/Simulink simulations are performed under varying environmental conditions, for example, step changes in solar irradiance, partial shading, and the presence of system uncertainties and load variation conditions of the PV array. Furthermore, the search performance of the RIO algorithm is examined on different unconstrained benchmark functions, and it is realized that the RIO algorithm has improved search performance in terms of finding the optimal solution and faster convergence characteristics than Particle swarm optimization (PSO). The results demonstrated that the RIO-based MPPT performs remarkably in tracking with high accuracy as the PSO, perturb and observe (P&O), and incremental conductance (IC)-based MPPT schemes.
1. Introduction
The use of non-renewable energy sources such as oil, coal, and natural gas for the production of electricity emits harmful emissions that affect the environment and cause global warming. The urgent necessity to protect this planet has called for cleaner sources of energy, of which solar power plays a significant role. Solar energy has been one of the preferred renewable energy sources due to its low operating cost, nearly maintenance-free, and eco-friendly because it is one of the cleanest energy sources [1,2]. Additionally, solar energy is a pollution-free source of energy, and it is abundantly available. The global growth of solar photovoltaic (PV) capacity has been increased consistently since 2000. Between 2000 and 2019, numbers grew by 632.4 gigawatts. In 2019, solar PV capacity reached 633.7 gigawatts globally, with 116.9 gigawatts installed that year [3]. Figure 1 illustrates the aggregated solar PV capacity in gigawatts by select countries as of 2019.
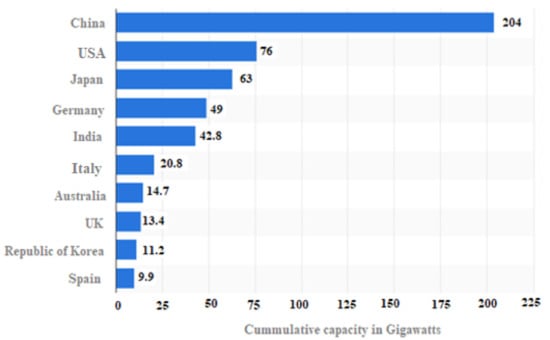
Figure 1.
Global cumulative solar PV capacity in 2019 [3].
Photovoltaics (PVs) is converting light (from the sun) into electricity by the use of semiconductor materials that shows the photovoltaic effect. A PV system utilizes solar modules, which comprise several solar cells, generating electrical energy or power [1,2]. Despite the recent technological enhancement in PV operational characteristics, such as reducing costs and improving efficiency, the lower energy conversion efficiency of PV systems (PVSs) remains a significant drawback to the utilization of PV power. Another major issue with PV power generation is the reliance on environmental influences, such as solar irradiance and ambient temperature and the high installation cost [4,5]. Since the cost involved in PV power generation is high and to make more profit on investment, it is very essential to extract most of the available solar energy through the panels. Subsequently, PV cells are constructed of semiconductor materials, they show nonlinear power–voltage characteristics, which require a maximum power point tracking (MPPT) technology to increase power extraction under all conditions. The maximum power point (MPP) is a distinctive point on the current–voltage (I–V) or power–voltage (P–V) plot at a given solar irradiance and temperature at which the PV system operates with optimal efficiency and produces its full output power. Since the climatic conditions vary continuously throughout the day, tracking the maximum power point from the PV is very challenging [6,7]. Therefore, the control unit of the PV system must be compelled through an efficient MPPT method for harvesting the maximum power from the installed PV arrays by generating an appropriate duty ratio to regulate the DC-DC converter embedded in the system [8,9,10]. In [9], a comprehensive review of the DC-DC converter topologies and their modulation strategies for solar PV systems. Considering all affecting factors of the PV, boosting the MPPT efficacy using a low-cost hardware approach is essential for improving the operation of the PVS [11,12,13].
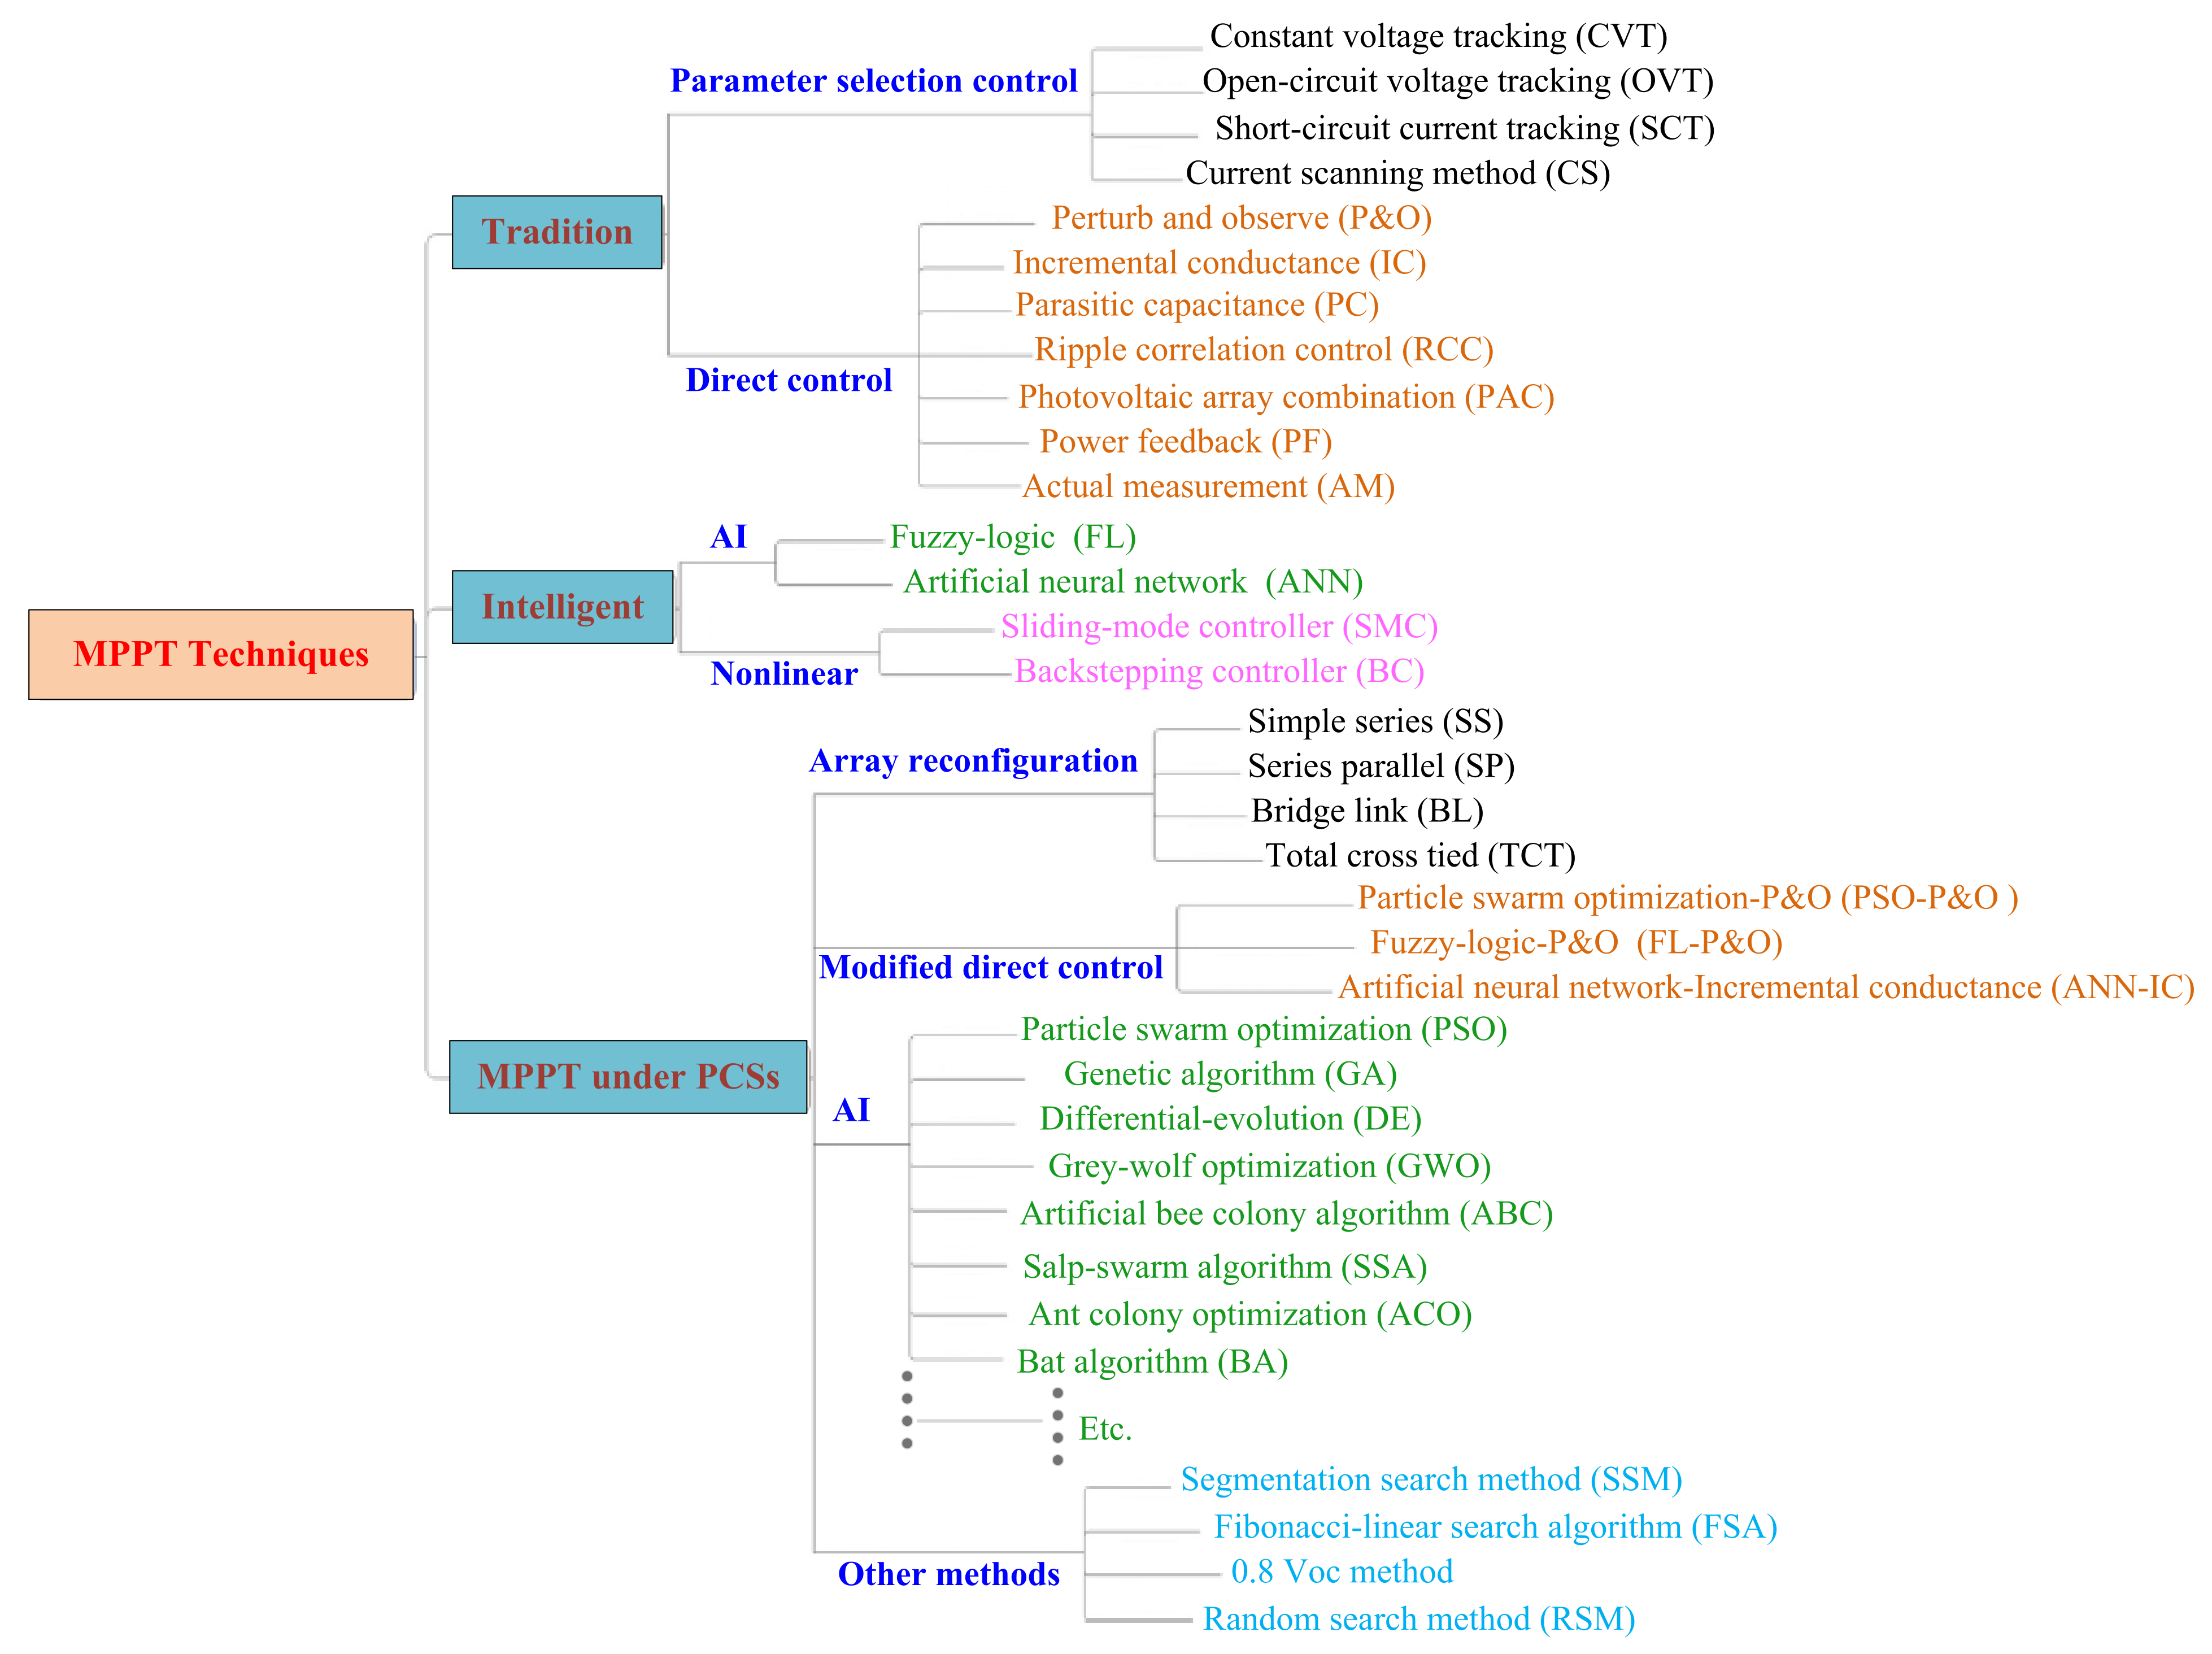
The objective of an efficient MPPT controller is to meet the ensuing characteristics such as accuracy, robustness, and faster-tracking speed under partial shading conditions (PSCs) and climatic variations such as a change in solar irradiation and temperature. To realize these objectives, several MPPT techniques to improve the overall performance of the PV system have been reported in the literature, [13,14,15,16]. Based on the search performance, application, and mathematical formulation the MPPT techniques are classified into three methods such as traditional/conventional, intelligence, and bio-inspired approaches/algorithms, as shown in Figure 2 [4].
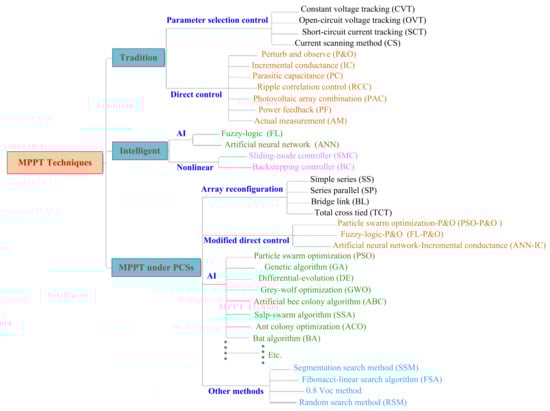
Figure 2.
Classification of some common MPPT control methods [4].
The most common conventional MPPT methods are the incremental conductance (IC) [17], perturb and observe (P&O) [18], and hill-climbing (HC) [19]. These conventional methods are simple, easy to implement, and can track the MPP effectively under normal environmental circumstances. However, they have a disadvantage as continuous oscillations follow around the MPP, causing significant power loss in the steady-state condition. In this perspective, various artificial intelligence (AI)-MPPT methodologies were implemented to handle the shortcomings of the conventional MPPT methods, especially highly intermittent conditions. These include fuzzy logic control (FLC) [20], artificial neural network (ANN) [21], firefly algorithm (FA) [22], PSO [23], ant colony optimization (ACO) [24], flower pollination algorithm (FPA) and differential evolution (DE) [25], invasive weed optimization [26], salp swarm optimization [27], bat optimization [28], Neighboring-Pixel-based virtual imaging technique [29], surface-based polynomial fitting [30], Jaya algorithm [31], most valuable player algorithm [32], shuffled frog-leaping and pattern search algorithm [33], artificial bee colony [34], dragonfly optimization algorithm [35], cuckoo search algorithm [36], backstepping super-twisting sliding mode control (BSTSMC) [37], and many more. The results demonstrated that the artificial intelligence algorithms have high accuracy and stability in tracking the global MPP in different environmental conditions.
In practice, each intelligent technique can only be employed in its best performance in a desirable scenario and is generally not fitting for a wide range of applications [16,38]. From this perspective, applying or designing a new intelligent algorithm has been welcomed, for improving the search performance [38,39,40]. By observing the efficacy of the soft-computing based intelligent optimization algorithms, in this paper, a bio-inspired Roach Infestation Optimization (RIO) for obtaining the maximum power from the PV is projected.
The main contributions of this work can be summarized as follows:
- The paper proposes the RIO algorithm to track the GMPP of the PV system under uniform solar irradiance and partial shading conditions.
- The efficacy of the proposed RIO algorithm was tested in different unconstrained benchmark functions.
- The proposed RIO technique is realized to have an excellent searching performance in terms of contributing a better dynamic response, faster convergence time, higher tracking accuracy, and more robustness against the presence of the system uncertainties and load variations in the PV system as compared to PSO, P&O, and IC schemes.
- The gains of the PI-controller are optimized with some commonly used performance indices (i.e., evaluation criteria) such as ISE, ITSE, IAE, and ITAE. It is found that the values obtained in the RIO technique improve the dynamic response of the PV system as compared to the PSO technique.
2. Studied Photovoltaic (PV) System
To establish the behavior of a solar cell electronically, an equivalent model is made based on basic electrical components. The solar cell is characterized/model by a current source in parallel with a diode, shunt resistance, and a series resistance component as presented in Figure 3 [7]. The detailed mathematical modeling of the PV cell is taken from [26].
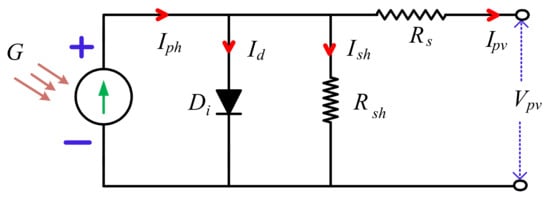
Figure 3.
Equivalent model of a solar cell.
In Figure 3, Rs and Rsh are the intrinsic series and shunt resistor of the PV cell (Ω), respectively. Ish is the current through Rsh. Di is the intrinsic diode. Id is diode current (A), Ish is shunt current (A), Iph is the light-generated current in the cell (A). Vpv and Ipv are the PV output voltage (V) and current (A), respectively. G is the solar irradiation (W/m2).
In Figure 3, the current generated by the solar cell is equivalent to that produced by the current source minus that which flows through the diode and the shunt resistor which is established by Kirchhoff’s current law as follows [19]:
The current through these elements can be given by the voltages across them:
where Vd is the voltage across the diode (V).
The PV cell is quantified by current–voltage (I–V) characteristic operation as follows [19]:
with
where ns and np are the number of cells connected in series and parallel, q is the electron charge (C), K is Boltzmann’s constant (J/K), A is the p-n junction’s idealistic factor, T is the cell’s absolute temperature (°K), Tr is the cell reference temperature (°K), Iph is the cell’s photocurrent (it depends on the solar irradiance and temperature), Irs is the cell’s reverse saturation current, Isc is the short-circuit current of the PV cell, Voc is the open-circuit voltage of the PV cell and G is the solar irradiance.
The studied PV system (PVS) consists of four-series (4S) connected PV modules, a resistive load, and a non-isolated DC-DC boost converter with the MPPT technique as shown in Figure 4. PV module. In Figure 4, R is the load resistance. L and C are the boost converter inductor and capacitor, respectively. Sw is the power electronics switch (e.g., MOSFET). D1 is the freewheeling diode, C1 is the input filter capacitor and D is the duty ratio.
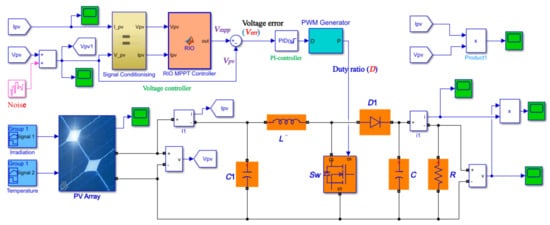
Figure 4.
Simulink diagram of the studied PV system with applied noise.
The DC-DC converter acts as an interface between the PV panel and the load which allows for follow-up of the maximum power point during system events such as partial shading, variations of solar irradiation, temperature and load, etc. The power electronic (metal-oxide-semiconductor field-effect transistor) (MOSFET) switch (Sw) is regulated by the duty cycle (D), which is generated from the reference voltage signal (i.e., Vmpp). The MPP and corresponding voltage signal (Vmpp) of the PV system for different shading patterns are obtained from the RIO algorithm. The voltage error signal (Verr) between Vmpp and actual PV voltage (i.e., Ppv) is given to proportional plus integral (PI)-controller to generate the desired PWM signal for MPPT and enhance the system dynamics. In this paper, different evaluation criteria such as integral of squared error (ISE), integral of time-squared error (ITSE), integral of absolute error (IAE), and integral of time-absolute error (ITAE) are employed for tuning the gains of the PI-controller. The mathematical minimization function is used for solving the ISE, ITSE, IAE, and ITAE evaluation criteria. The MATLAB/Simulink model of the studied PVS is shown in Figure 4. The modeling parameters of the PVS and DC-DC converter are given in Table 1 and Table 2, respectively. The detailed modeling and selection of the DC-DC converter components/parameters are taken from [41,42].

Table 1.
Studied solarex MSX60 PV module parameters [43].
Table 2.
DC-DC boost converter parameters.
In this study, the Solarex MSX60, a typical 60 W PV module is selected for modeling the PV system [43]. Generally, a PV module performance is rated under standard test conditions (STC) such as solar irradiance of 1000 W/m2, the solar spectrum of air mass 1.5, and module temperature at 25 °C. Manufacturers of photovoltaic modules typically provide the ratings at only one operating condition (i.e., STC) [44,45]. However, the PV module operates over a large range of environmental conditions such as variations of solar irradiation, temperature, partial shading, etc., in the field. The suitability of a PV module technology for a particular site depends on five major factors which include the annual solar irradiation distribution, variations in the efficiency of PV module technology with solar irradiation, annual temperature distribution and module temperature coefficient, variations in the solar spectrum distribution, and rate of power degradation of the PV modules with time. Since temperature affects the amount of power we get from a solar system, the electrical efficiency of the PV module depends on ambient temperature, and it reduces when the temperature increases and vice versa [44,45]. The temperature coefficient implies how much will be the decrement in power output if the PV module temperature varies from STC. It is also true that this temperature coefficient varies from one type of solar cell technology to another [44].
3. Roach Infestation Optimization (RIO) Based MPPT Algorithm
The RIO was originally introduced by Haven et al., as a cockroach-inspired algorithm [46]. The RIO was adapted from the traditional PSO algorithm, and therefore it has some parameters similar to the PSO. It is studied that cockroaches dislike the light and like gathering [46]. Whenever a cockroach encounters another neighboring cockroach, it stops and socializes. During this period, information about the darkest known location is shared. When a cockroach is hungry it leaves friends and comfortable shelter and searches for food. The equation that developed to find the Darkness behavior of a cockroach is evaluated as follows [46]:
where vli represents the velocity of ith particle/agent (i.e., cockroach) for the lth iteration, xli is the current location for the lth iteration, is the best dark place (location) of the ith agent, C0 and Cmax are constants and R1 is a random number.
If a cockroach comes within a detection radius of another cockroach, they stop, and these cockroaches will group and share information by adapting the darkest local place in the search space.
where (i, j) are representative of the two socializing cockroaches and is the darkest recognized place for the individual cockroach. Now, (4) can be presented as (6):
It is noticeable that (6) is very much similar to the PSO velocity update. While the global best is substituted by a group best in RIO.
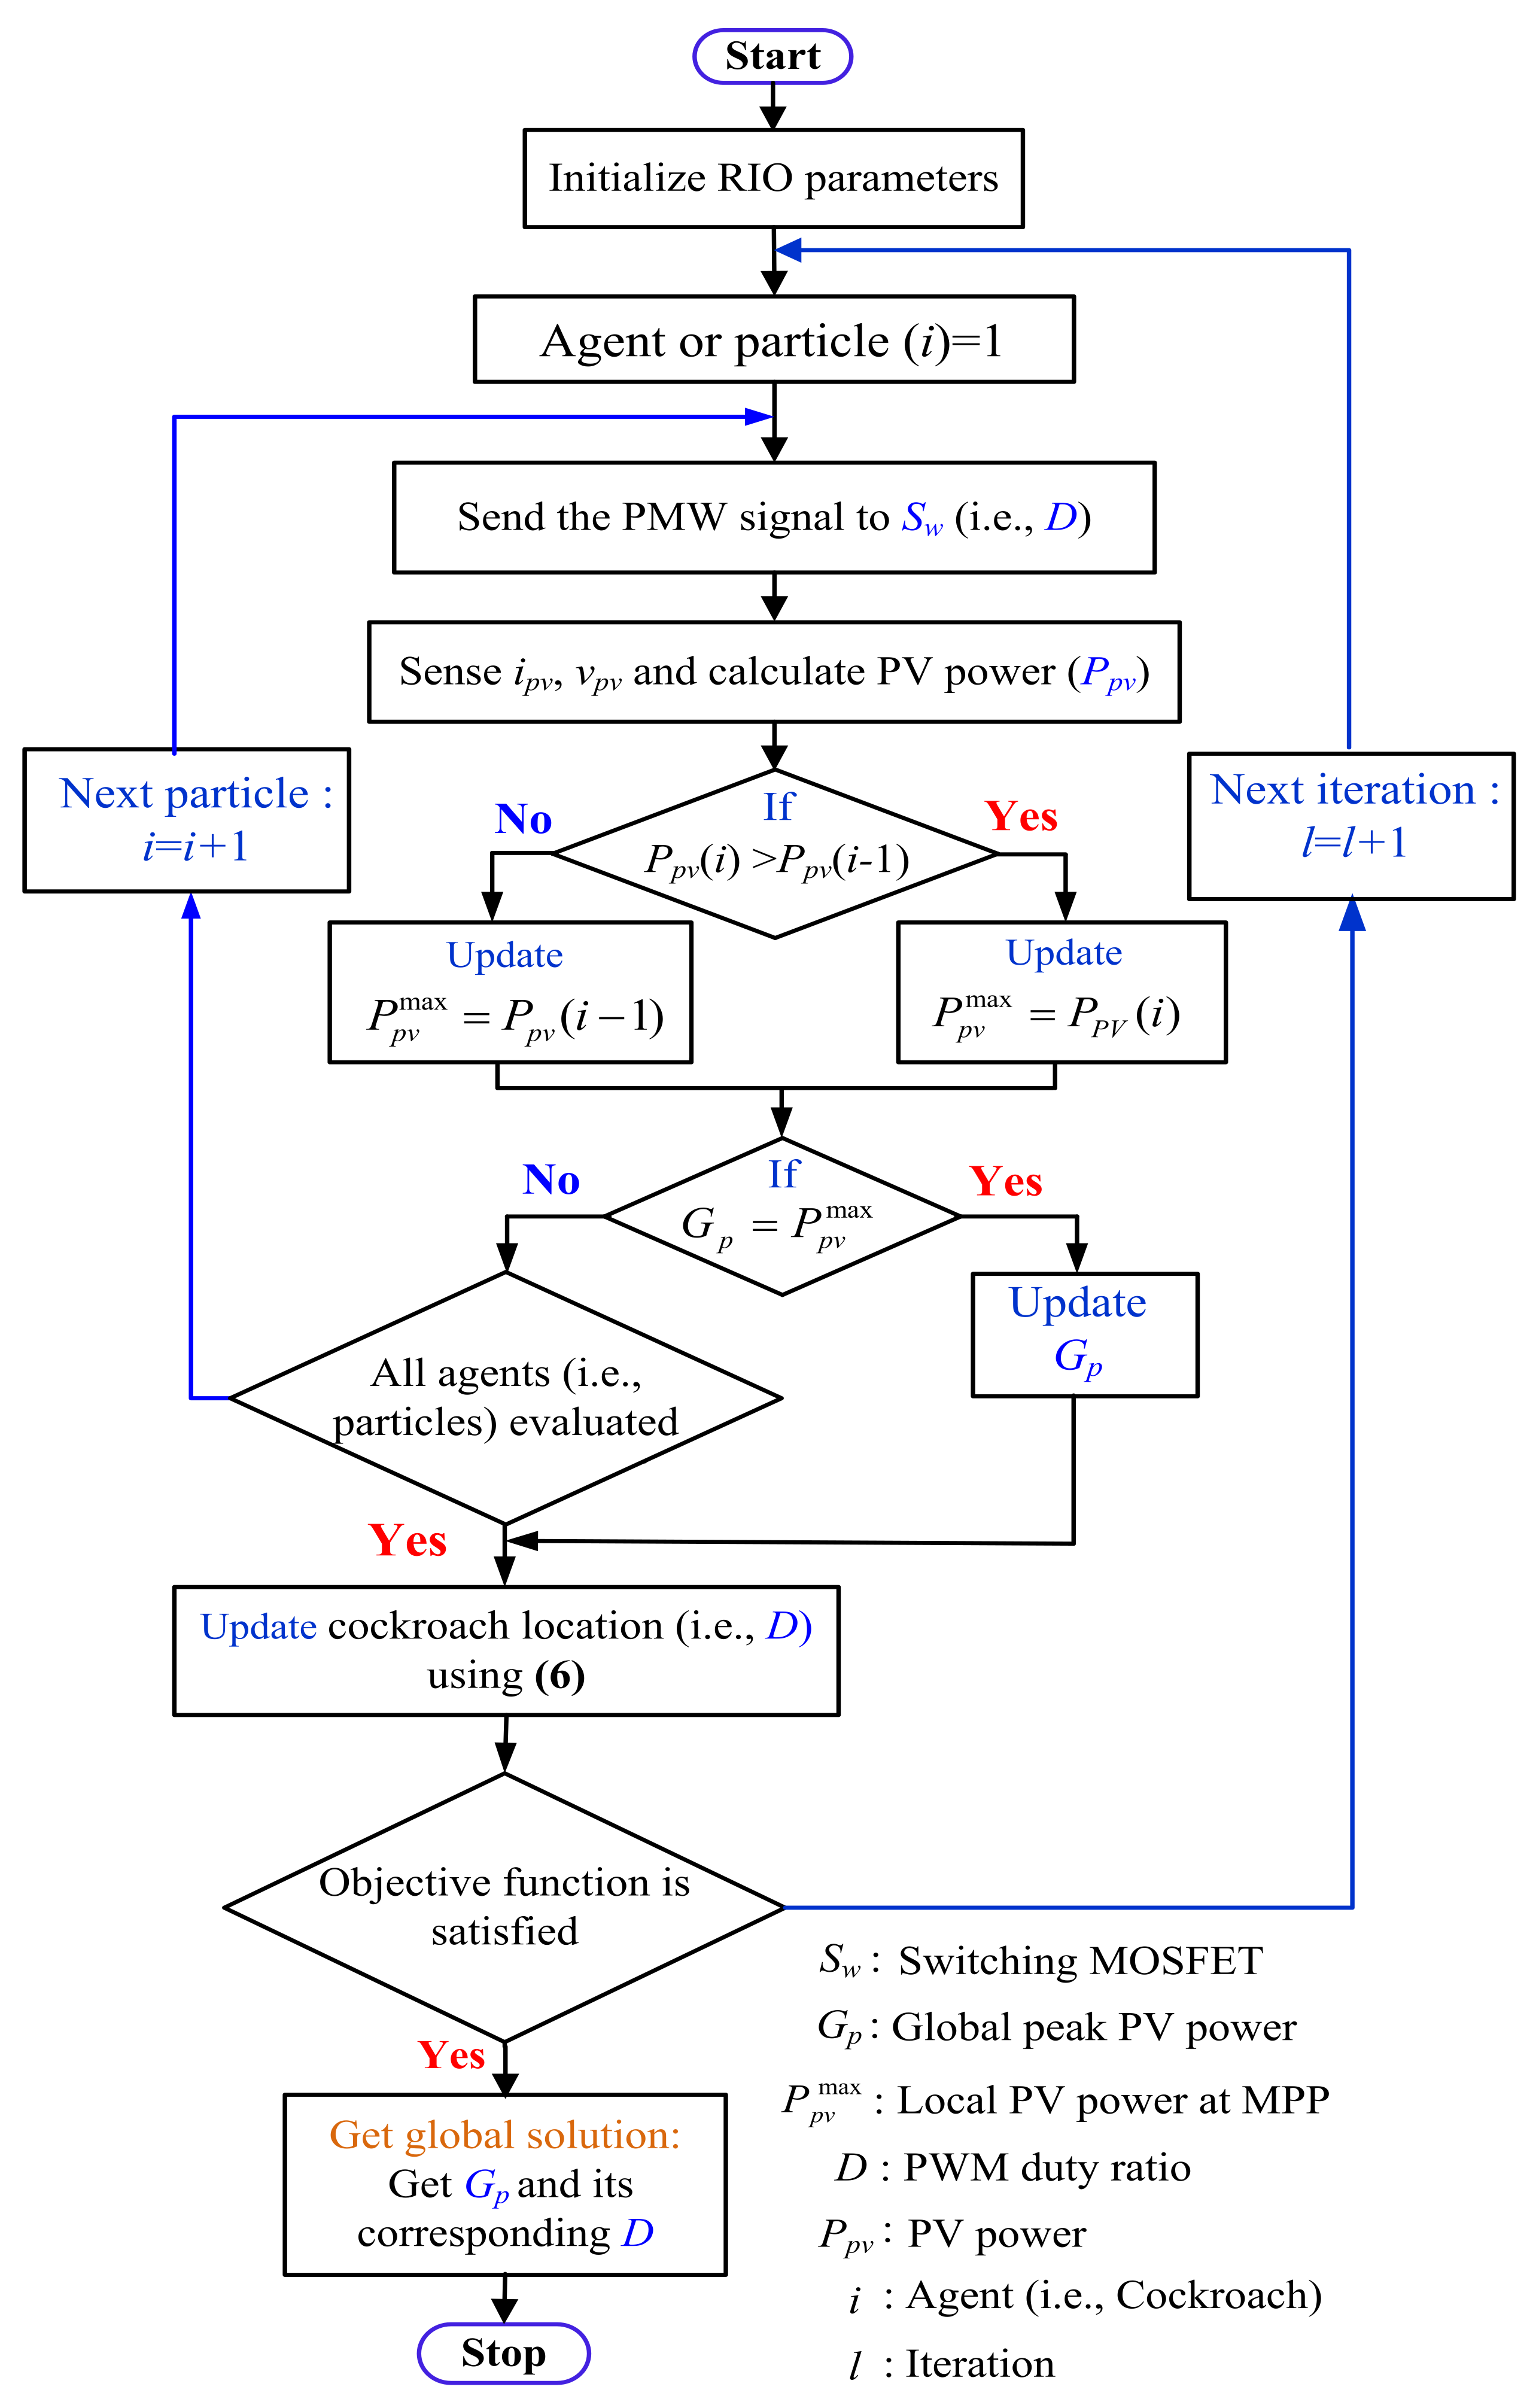
The flowchart of the RIO for MPPT is presented in Figure 5. To obtain the results, the value of the algorithm-specified control parameters of the PSO and RIO algorithms is given in Table 3. The DC-DC boost converter receives the PV voltage (Vpv) and current (Ipv) from the PVS and subsequently regulates it by adjusting the duty ratio (D). The value of D is updated using the optimization algorithms to achieve the MPP as shown in Figure 4. In this work, the global peak power (GP) of the PV system is attained using the optimization algorithm to update D in the search process during both uniform irradiation/temperature and PSCs.
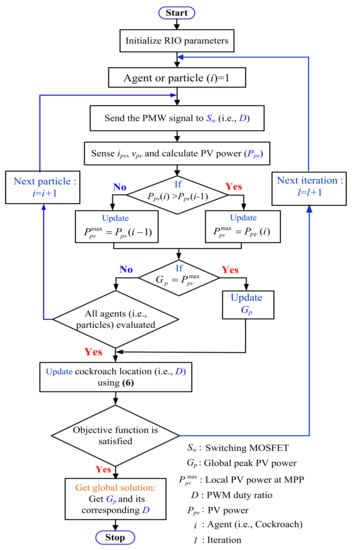
Figure 5.
Flowchart of proposed RIO algorithm for MPPT.
Table 3.
Parameters for RIO [46] and PSO [47] algorithms.
4. Results and Discussion
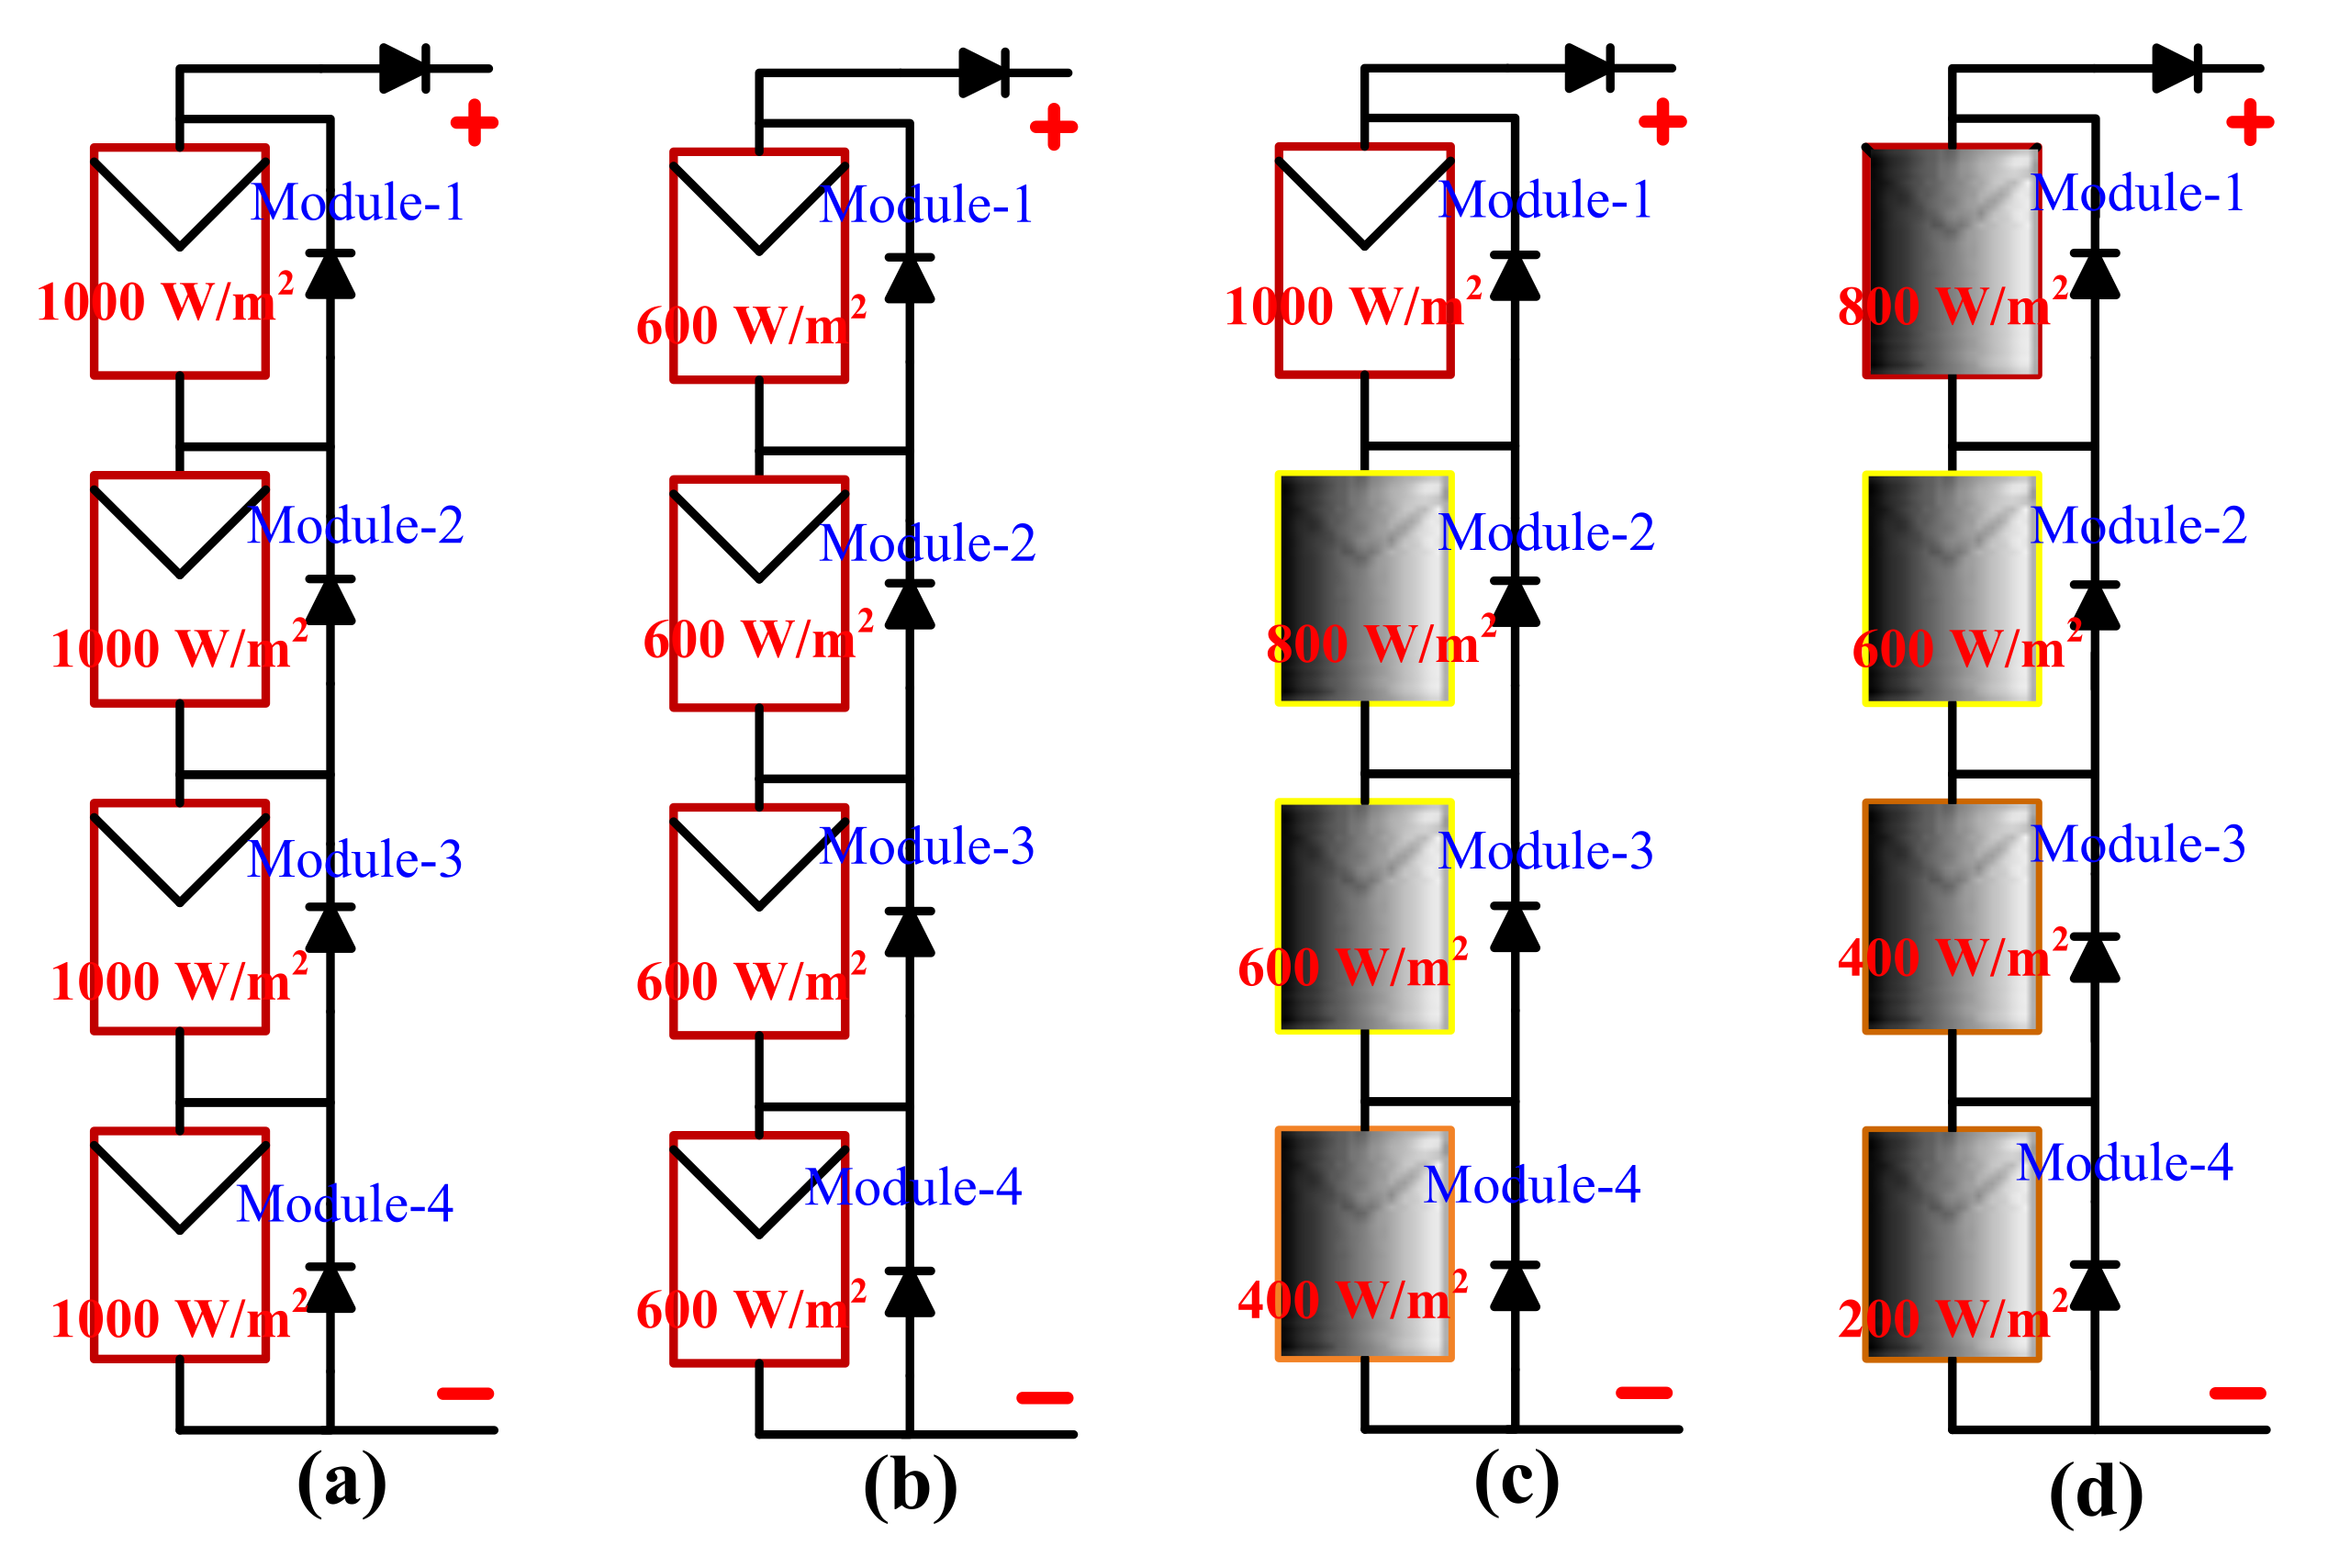
A MATLAB/Simulink (R2020b) software is employed for modeling and to justify the effectiveness of the RIO-based MPPT method of the PV system (Figure 4). Different case studies were realized to show the efficacy of the RIO algorithm than PSO for getting the optimal solution of different unconstrained benchmark functions and GMPP of the PV system. The time–domain simulations were accomplished for both uniform irradiation and PSCs such as (i). Uniform solar irradiance (Patterns 1, 2, 5 and 7) and (ii). PSCs (Patterns 3, 4 and 6), as shown in Figure 6. Table 4 illustrates the combination of various patterns selected for the PVS to plot the graphs. In the case of uniform/symmetrical solar irradiance, both solar irradiance and temperature remain constant, whereas, for PSCs, different values of solar irradiation (G) are considered, for the PV modules. The PVS is simulated under the various scenarios and the simulation results are demonstrated which are discussed below:
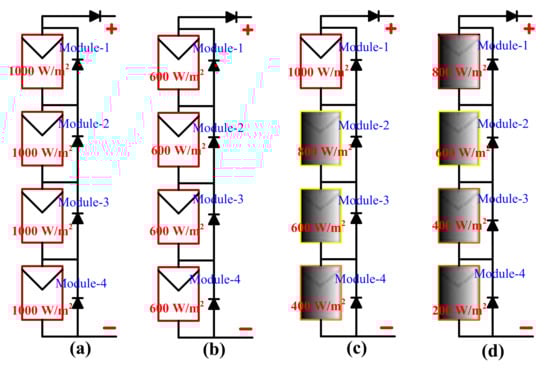
Figure 6.
A 4S structure of PV array system (a). Pattern-1, (b). Pattern-2, (c). Pattern-3, (d). Pattern-4.
Table 4.
Shading patterns of PVS for different solar irradiation (G).
4.1. P–V and I–V Characteristics Curves of the PV System
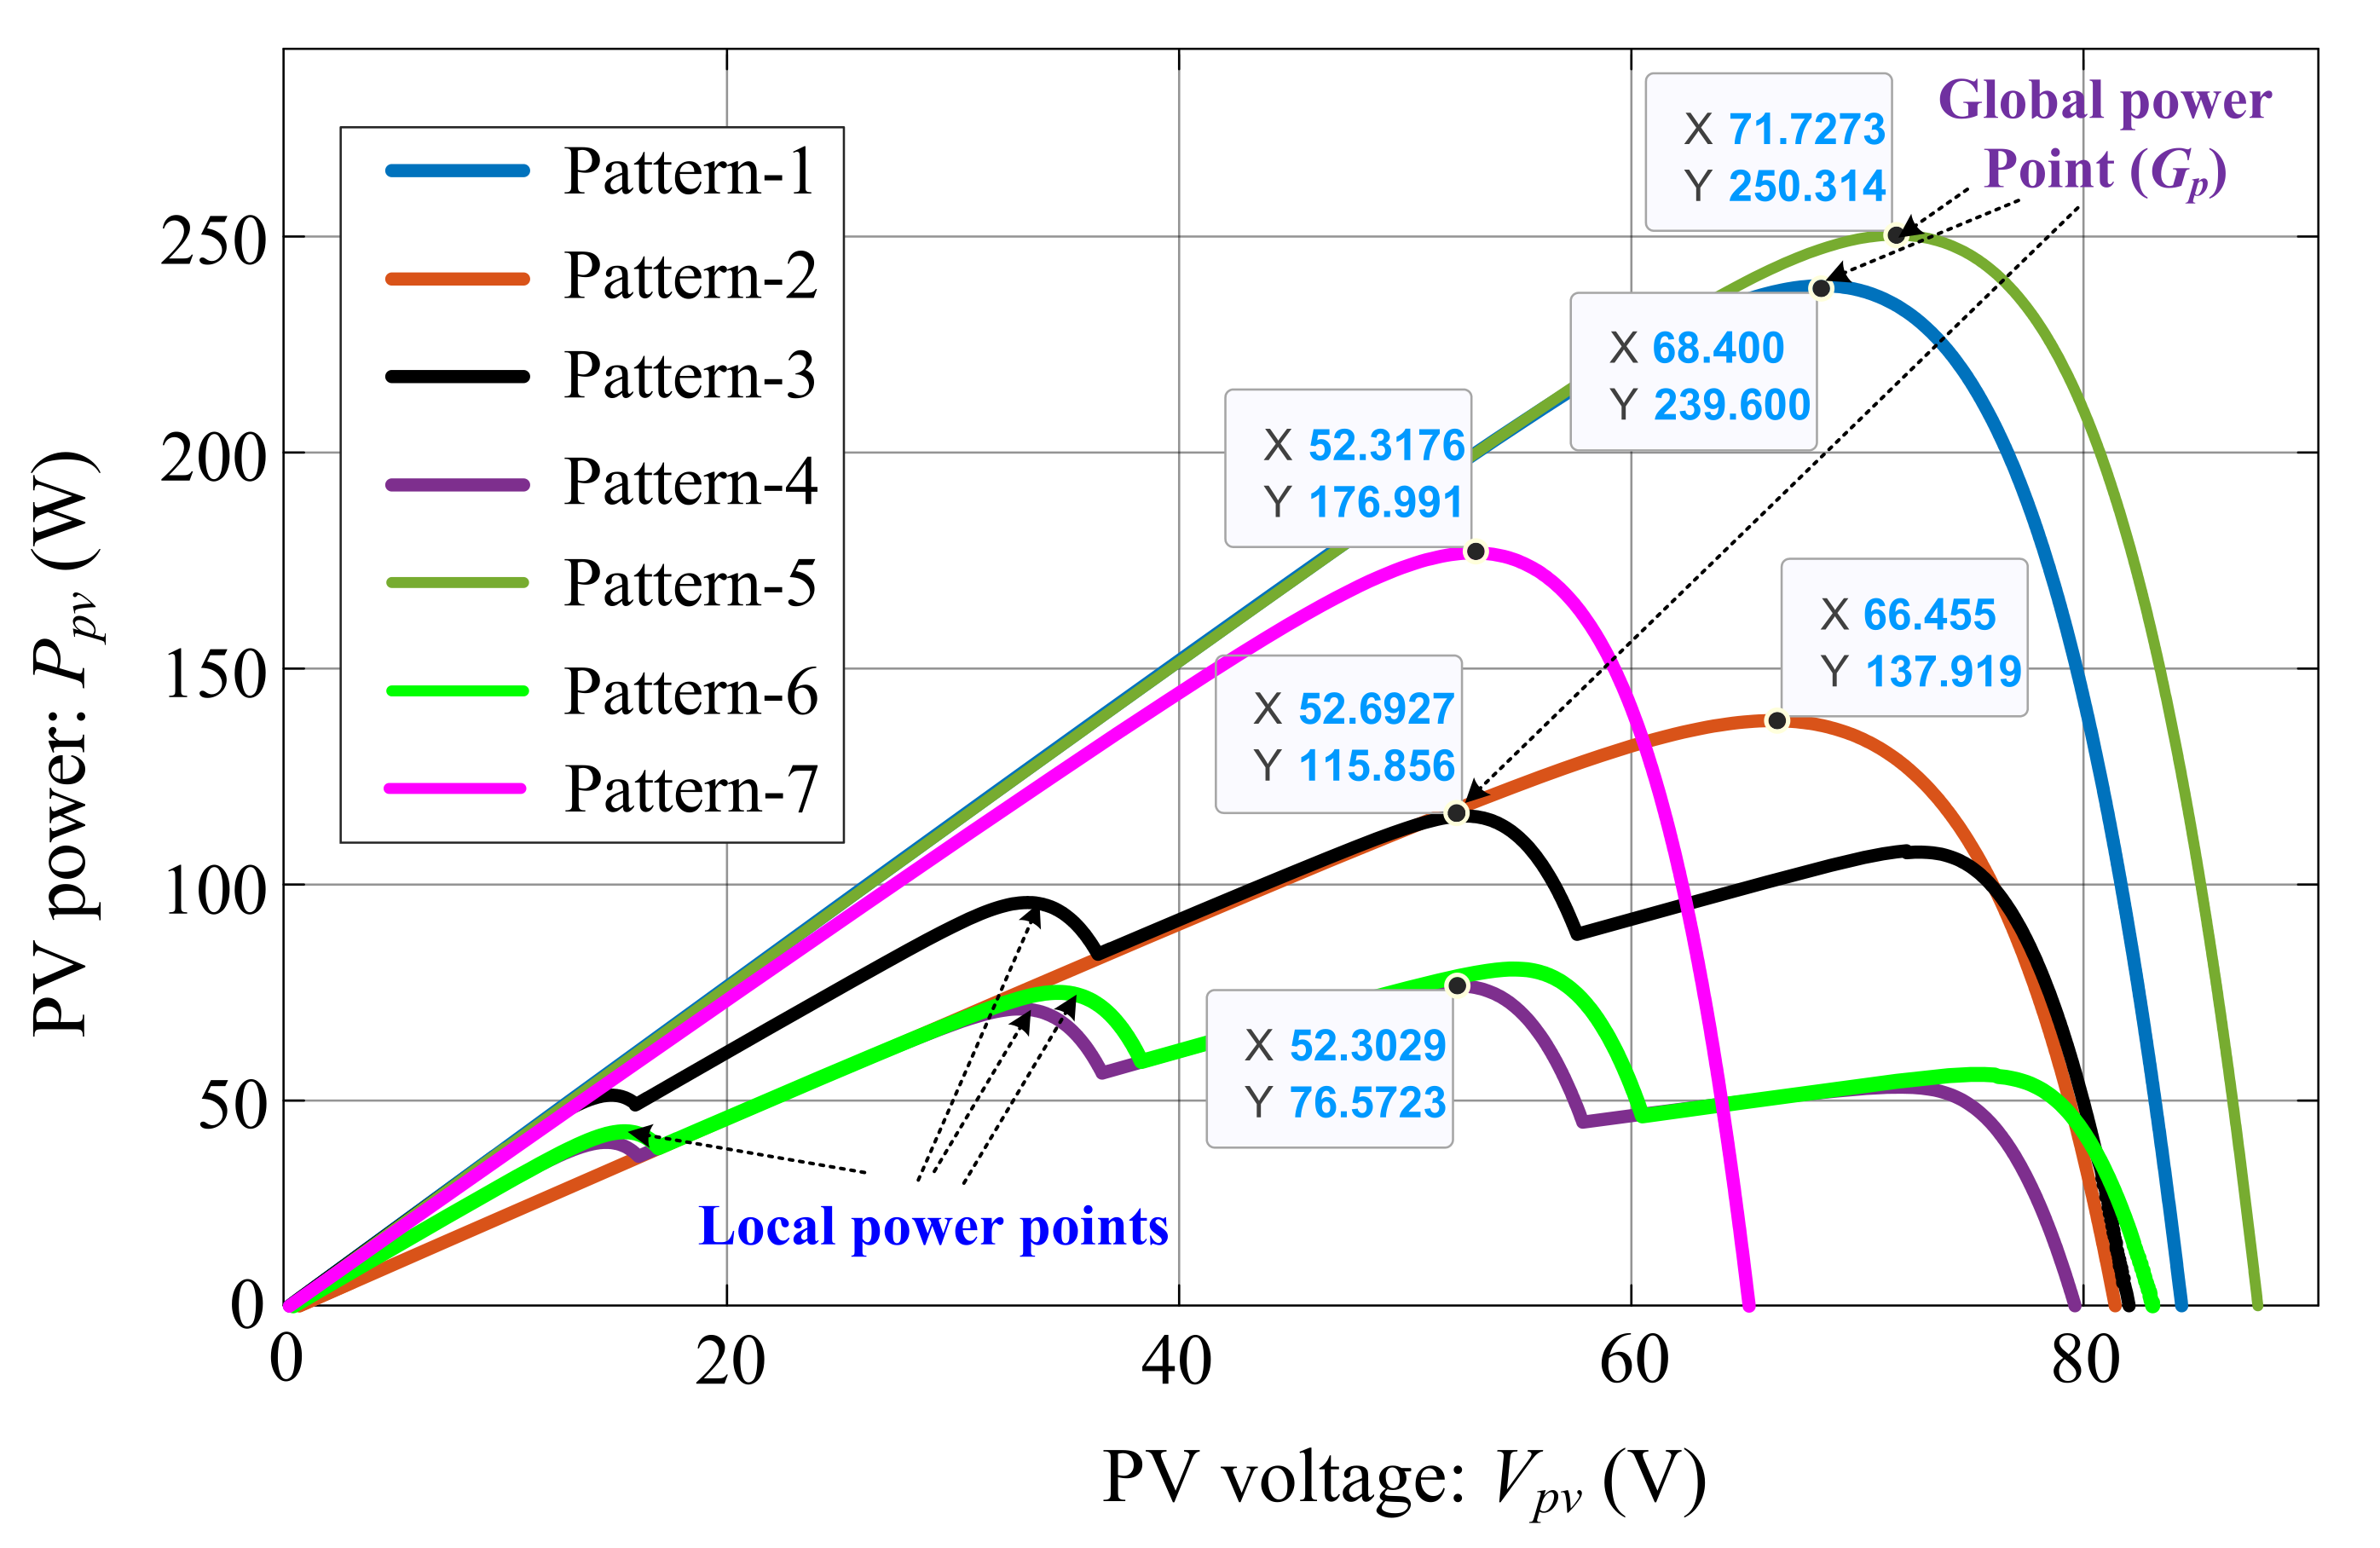
The performance of a solar panel affects both uniform irradiation/temperature and PSCs. The PV system, whether a module, string, or array exhibits a P–V curve exhibiting multiple peaks, a Global Maximum Power Point (GMPP) which is the highest peak and Local Maximum PowerPoints (LMPPs) are the other multiple peaks. The P–V and I–V graphs under each pattern are given in Figure 7 and Figure 8, respectively.
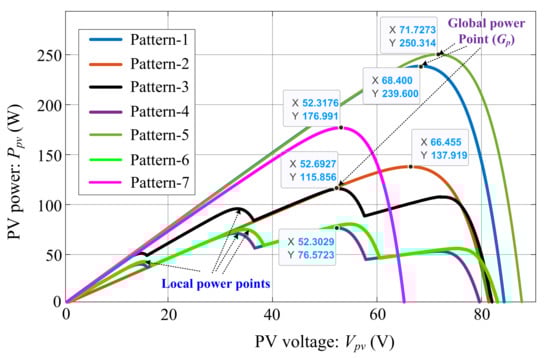
Figure 7.
P–V graph for different shading patterns.
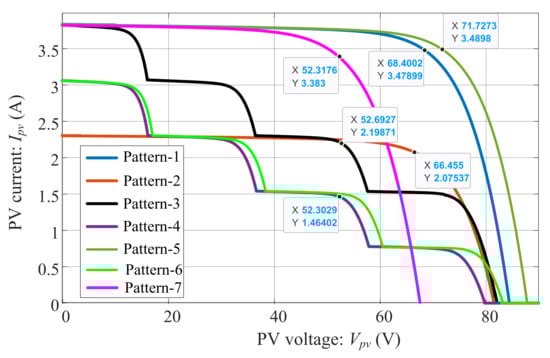
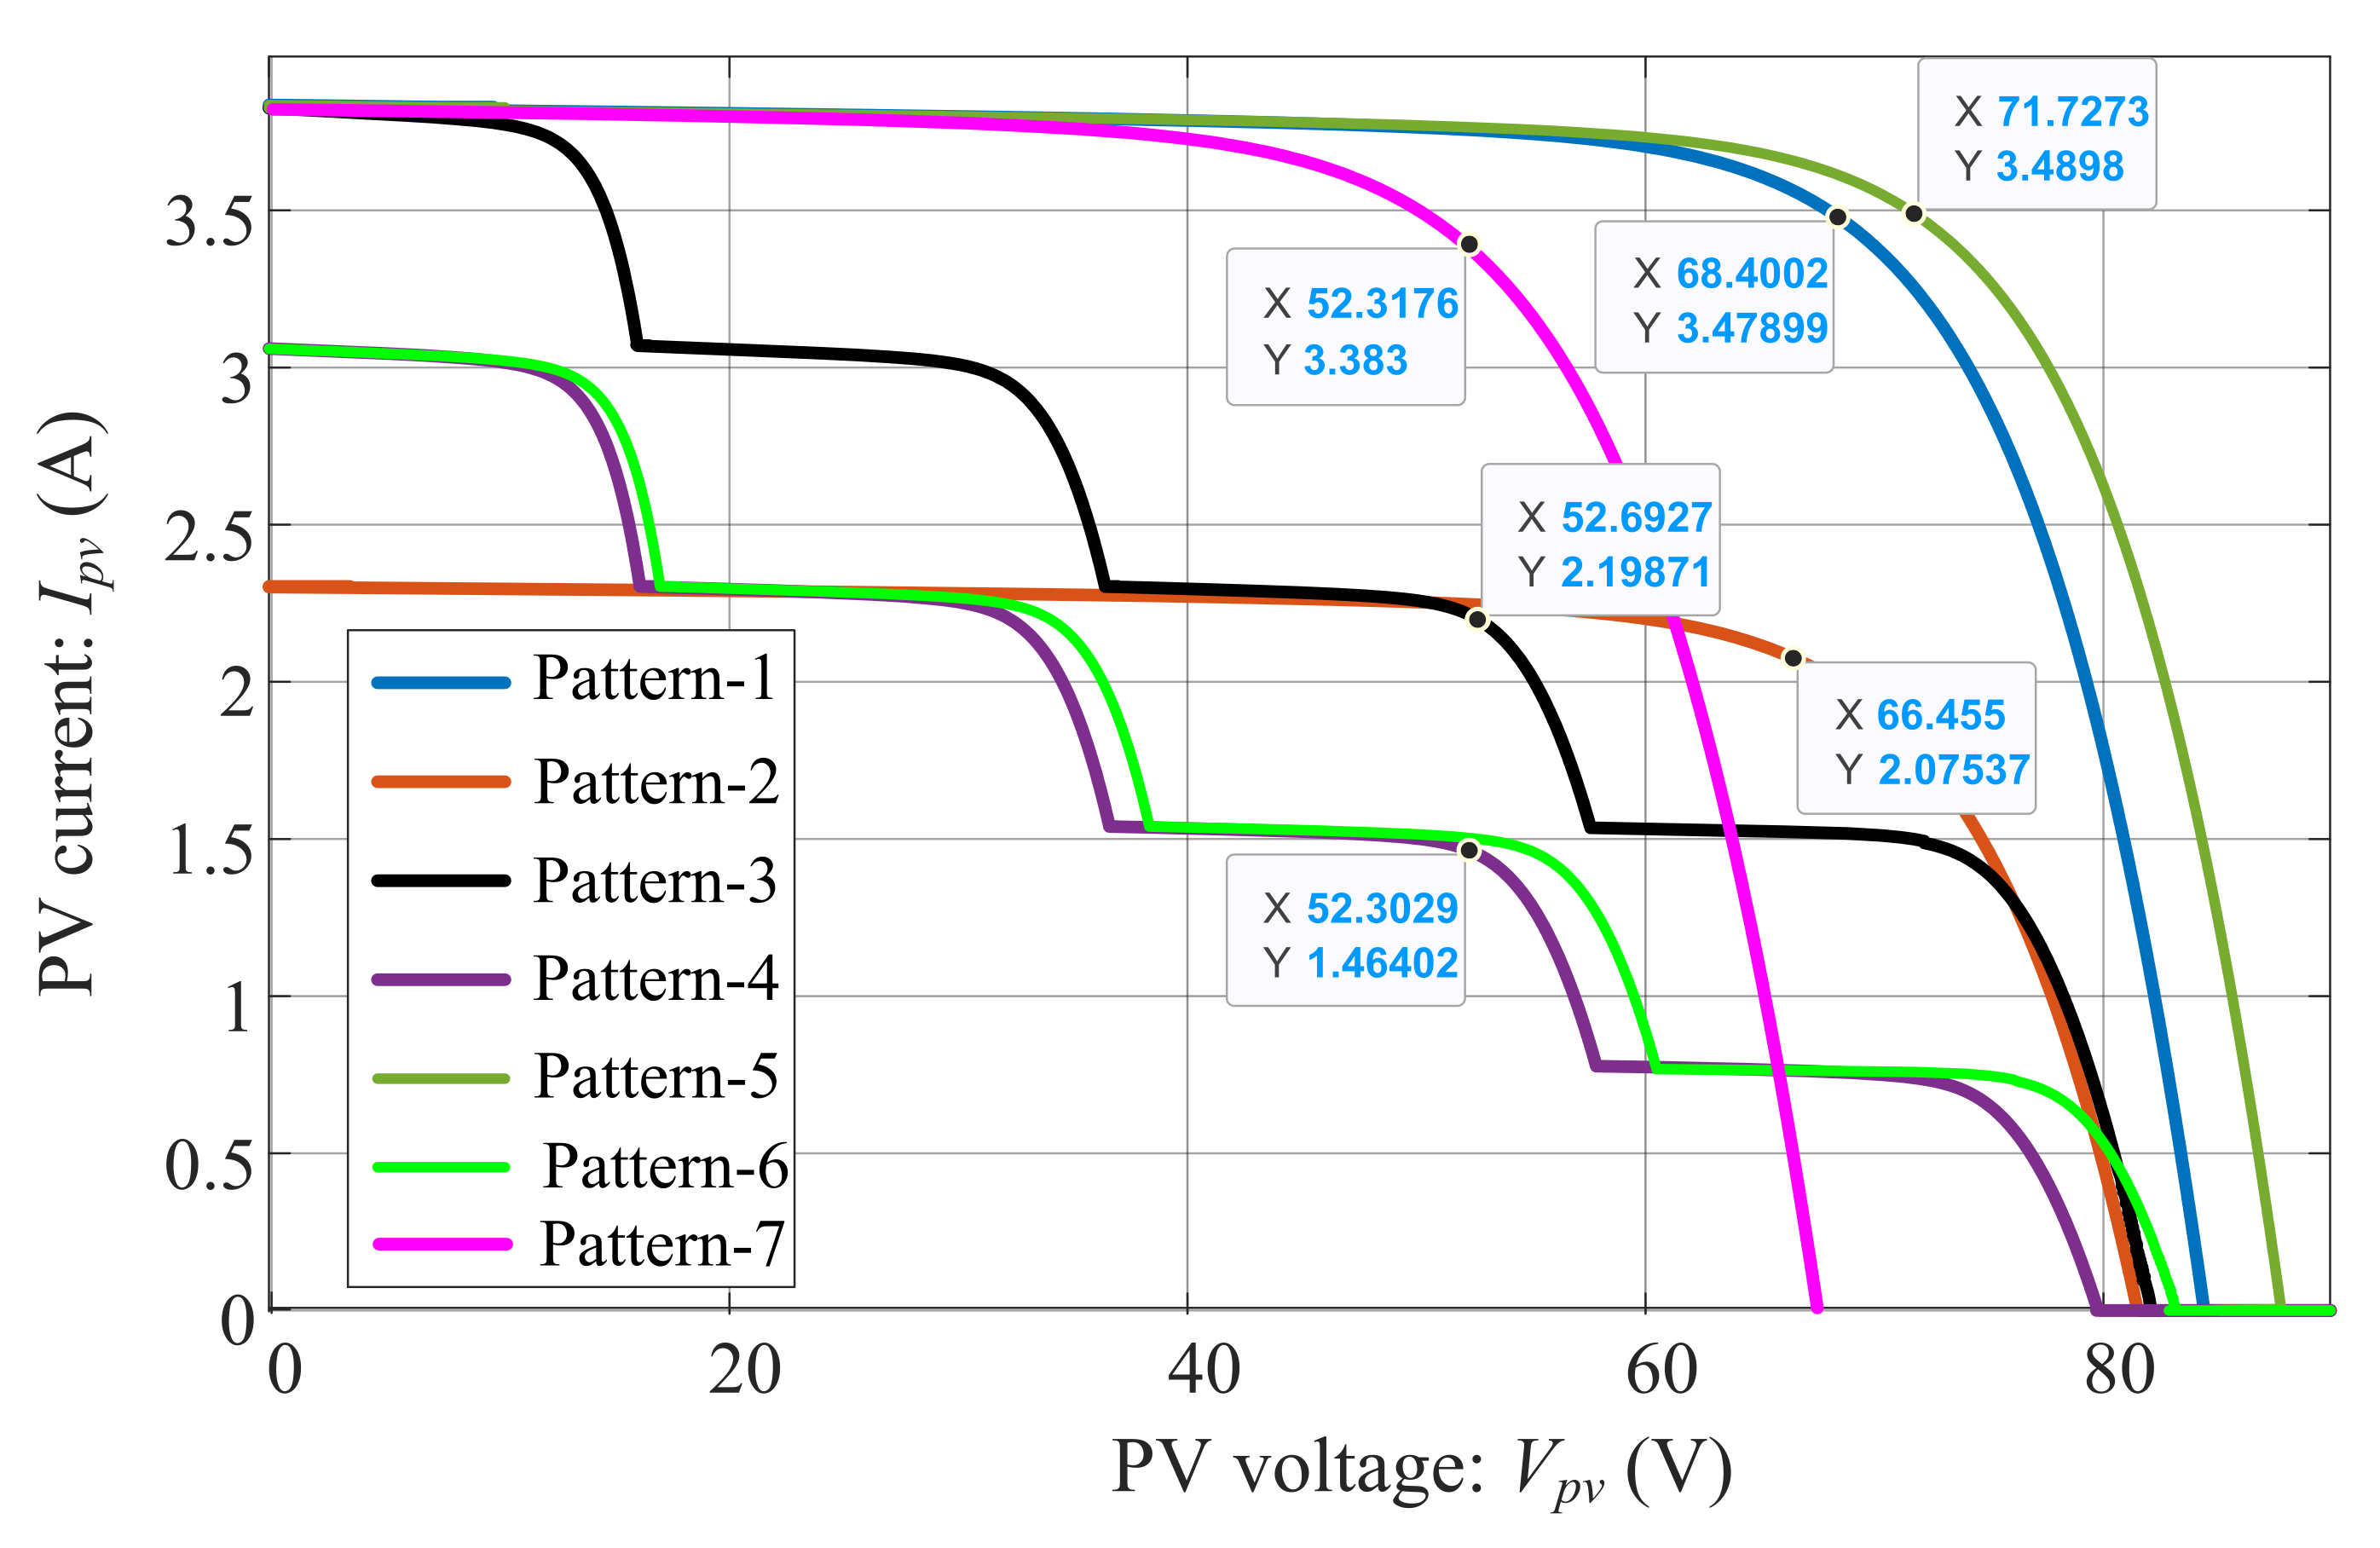
Figure 8.
I–V graph for different shading patterns.
In Figure 7 and Figure 8, it is seen that under uniform shading conditions (i.e., patterns 1, 2, 5, and 7), the P–V and I–V graphs produce only one maximum point. However, when partial shading (i.e., patterns 3, 4, and 6) occurs in the PVS, the P–V and I–V characteristic graphs start producing multiple maximum points due to the working of the bypass diodes in the system. From the graphs (i.e., patterns 1 to 7), it can be seen that the MPP shifts to the lower left region with the decrease in irradiation, and a decrease in temperature helps to shift the MPP upwards (in Figure 7). Meanwhile, the corresponding PV voltage (Vmpp) at MPPT will be higher with a high value of peak power under different shading patterns, as observed in Figure 7. A similar analysis can be examined in Figure 8 that the corresponding PV current (Impp) at MPPT will be higher with a high value of peak power.
From the figures, it can be observed that the higher the solar irradiation, the peak PV will be higher and vice versa. The same can be observed for other combinations of solar irradiation and temperature. The exact value of the global peak power (Gp), the corresponding voltage (Vmpp), current (Impp) and resistance (Zmpp) values at MPP of the PVS under the selected test patterns are given in Table 5.
Table 5.
Global peak power (Gp) for different patterns.
4.2. Performance Assessment of the RIO and PSO Algorithms for Different Benchmark Functions
A comparative performance assessment of the RIO and PSO is given in Table 6 for different benchmark functions. In this case study, a minimization problem (i.e., objective function) is considered to get the comparative statistical search performance results of the benchmark functions for 120 iterations. From Table 6, it can be observed that the data obtained by the RIO algorithm are better than PSO in terms of mean, standard deviation (SD), and best value (fmin).
Table 6.
Comparative performance indexes of different test functions.
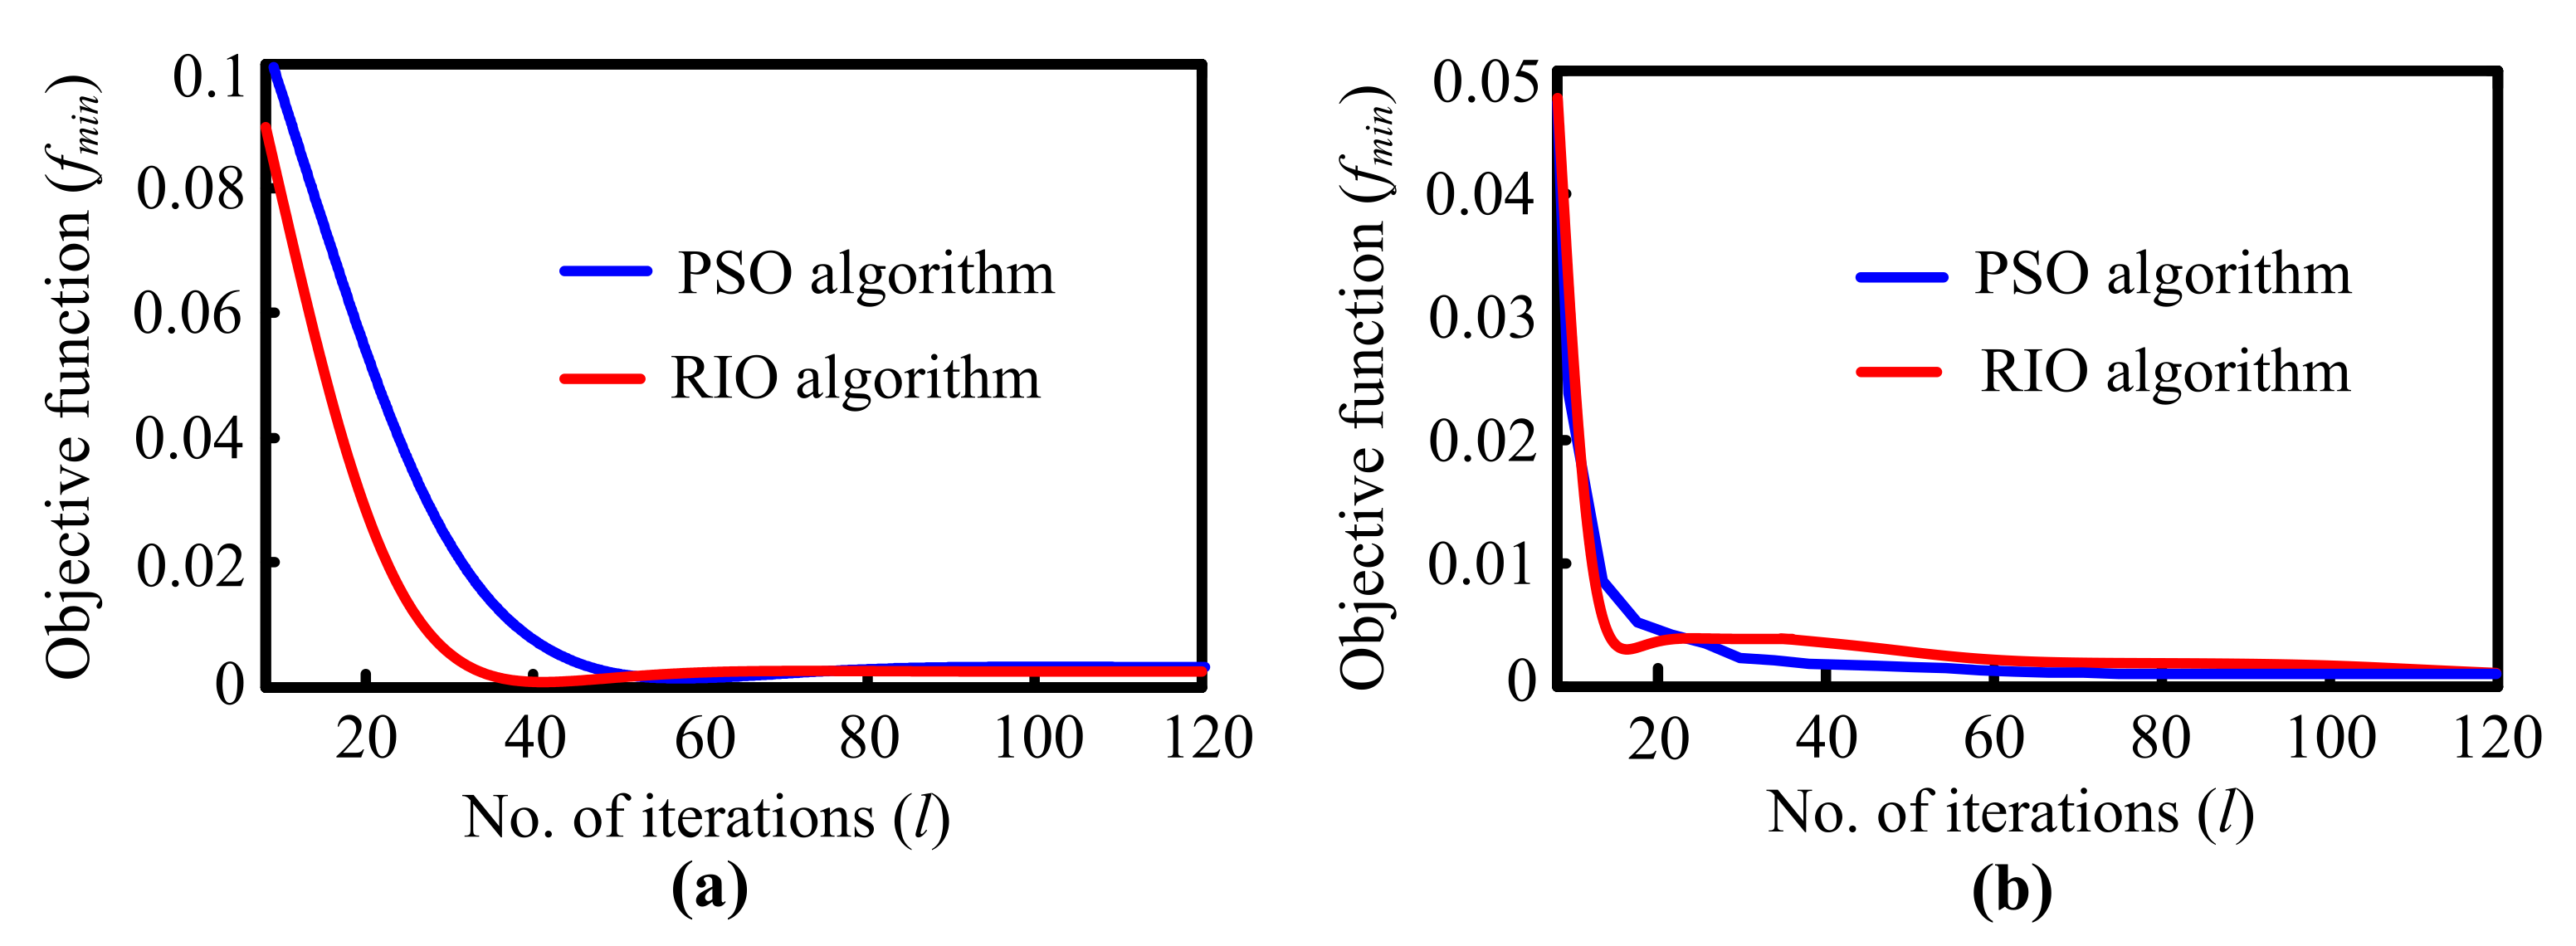
Additionally, the convergence characteristic curve for two benchmark functions: Bohachevsky-1 and Langerman-5 is demonstrated in Figure 9. Figure 9 shows that the RIO algorithm obtains its global minimal solution for a smaller number of iterations in comparison to PSO. This accomplishment of the RIO algorithm was proved by evaluating the results with that of the PSO for different test functions in [46].
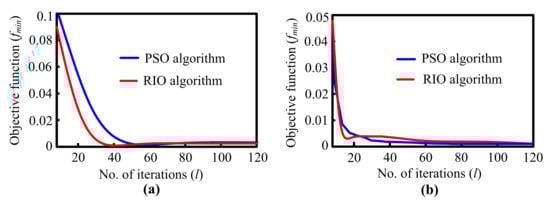
Figure 9.
Convergence characteristic graph for: (a). Langerman-5 function, (b). Bohachevsky-1 function.
4.3. Performance Assessment of the RIO and PSO Algorithms for Tuning the PI-Controller Parameters
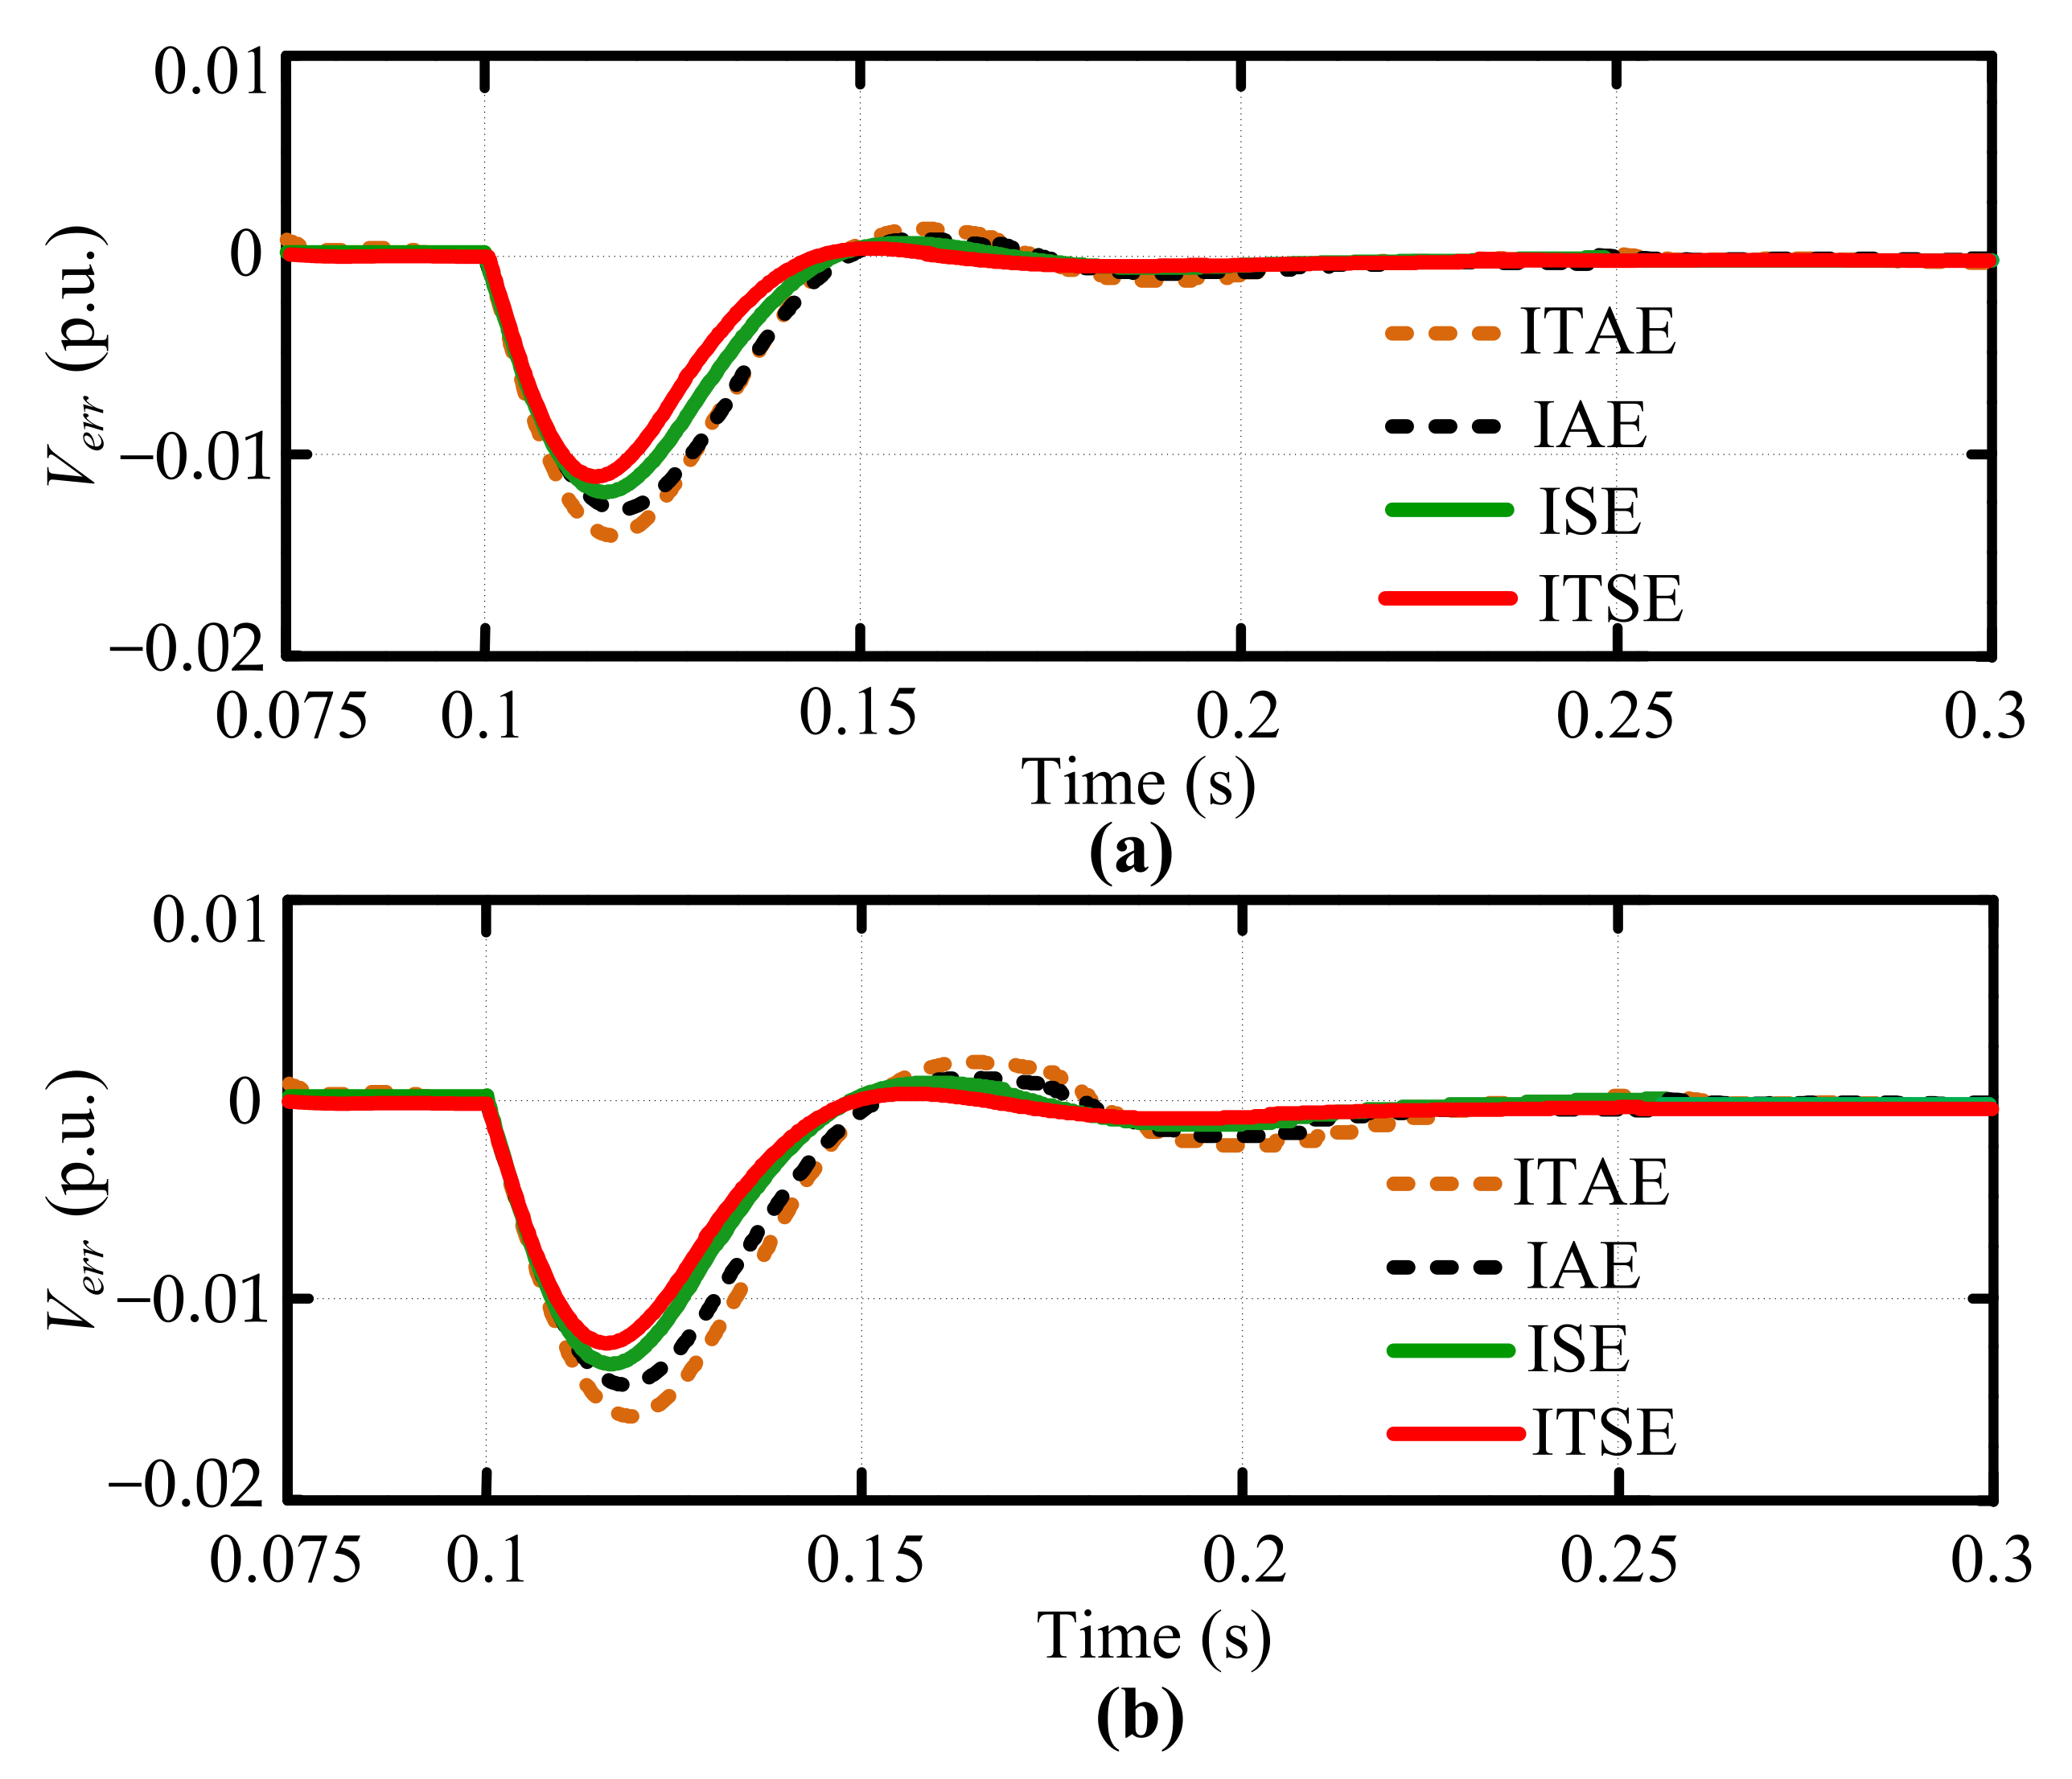
In practice, the tuning of the PI-control gains affects the dynamics such as settling time, overshoots/undershoots in PV voltage, current, and power of the PV system. Additionally, the design of a controller is based upon the well-defined objective or cost functions to meet the system requirements and constraints [38,46]. In this work, four evaluation criteria (i.e., objective function) such as ISE, ITSE, IAE, and ITAE are employed for tuning the proportional (Kp) and integral (Ki) gains of the PI-controller using PSO and RIO algorithms. The above-mentioned four objective functions (f) are derived from the voltage error signal (Verr) between the voltage at MPP (Vmpp) and the actual PV voltage (Vpv) as shown in Figure 4. The details about the ISE, ITSE, IAE, and ITAE functions can be found in [48,49].
The comparative performance of the proposed strategy (RIO) and PSO for these four objection functions are presented in Figure 10 and Table 7. In this case study, the shading pattern changes from Pattern-1 to Pattern-2 at the time (t) = 0.1 s is considered to plot the voltage error (Verr) graph of each objective function. The simulation results are obtained from Figure 4 with load resistance (R) = 50 Ω.
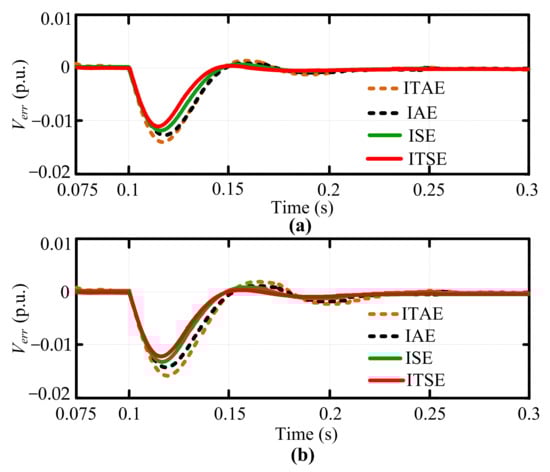
Figure 10.
Dynamic response of voltage error (Verr) graph for: (a). RIO algorithm, (b). PSO algorithm.
Table 7.
Comparative performance indices for different objective functions.
Figure 10 demonstrates that the RIO algorithm contributes an improved Verr dynamics in terms of a lower value of overshoot/undershoot with a faster settling time response than PSO. Moreover, it can be seen that the tuning of the PI-controller parameters by the ITSE function provides a better response as compared to ISE, ITAE, and ITSE functions. The comparison Verr performance indices such as the settling time (ts), maximum dip (Vderr), and the optimal parameters of the PI-controller for RIO and PSO are listed in Table 7. From the results, it is found that the best results are obtained with ITSE for both RIO and PSO algorithms than IAE, ISE, and ITAE values. The same can be examined for other transitions of the uniform and partial shading conditions in the studied PV system (Figure 4).
4.4. Comparison between Different Algorithms for MPPT
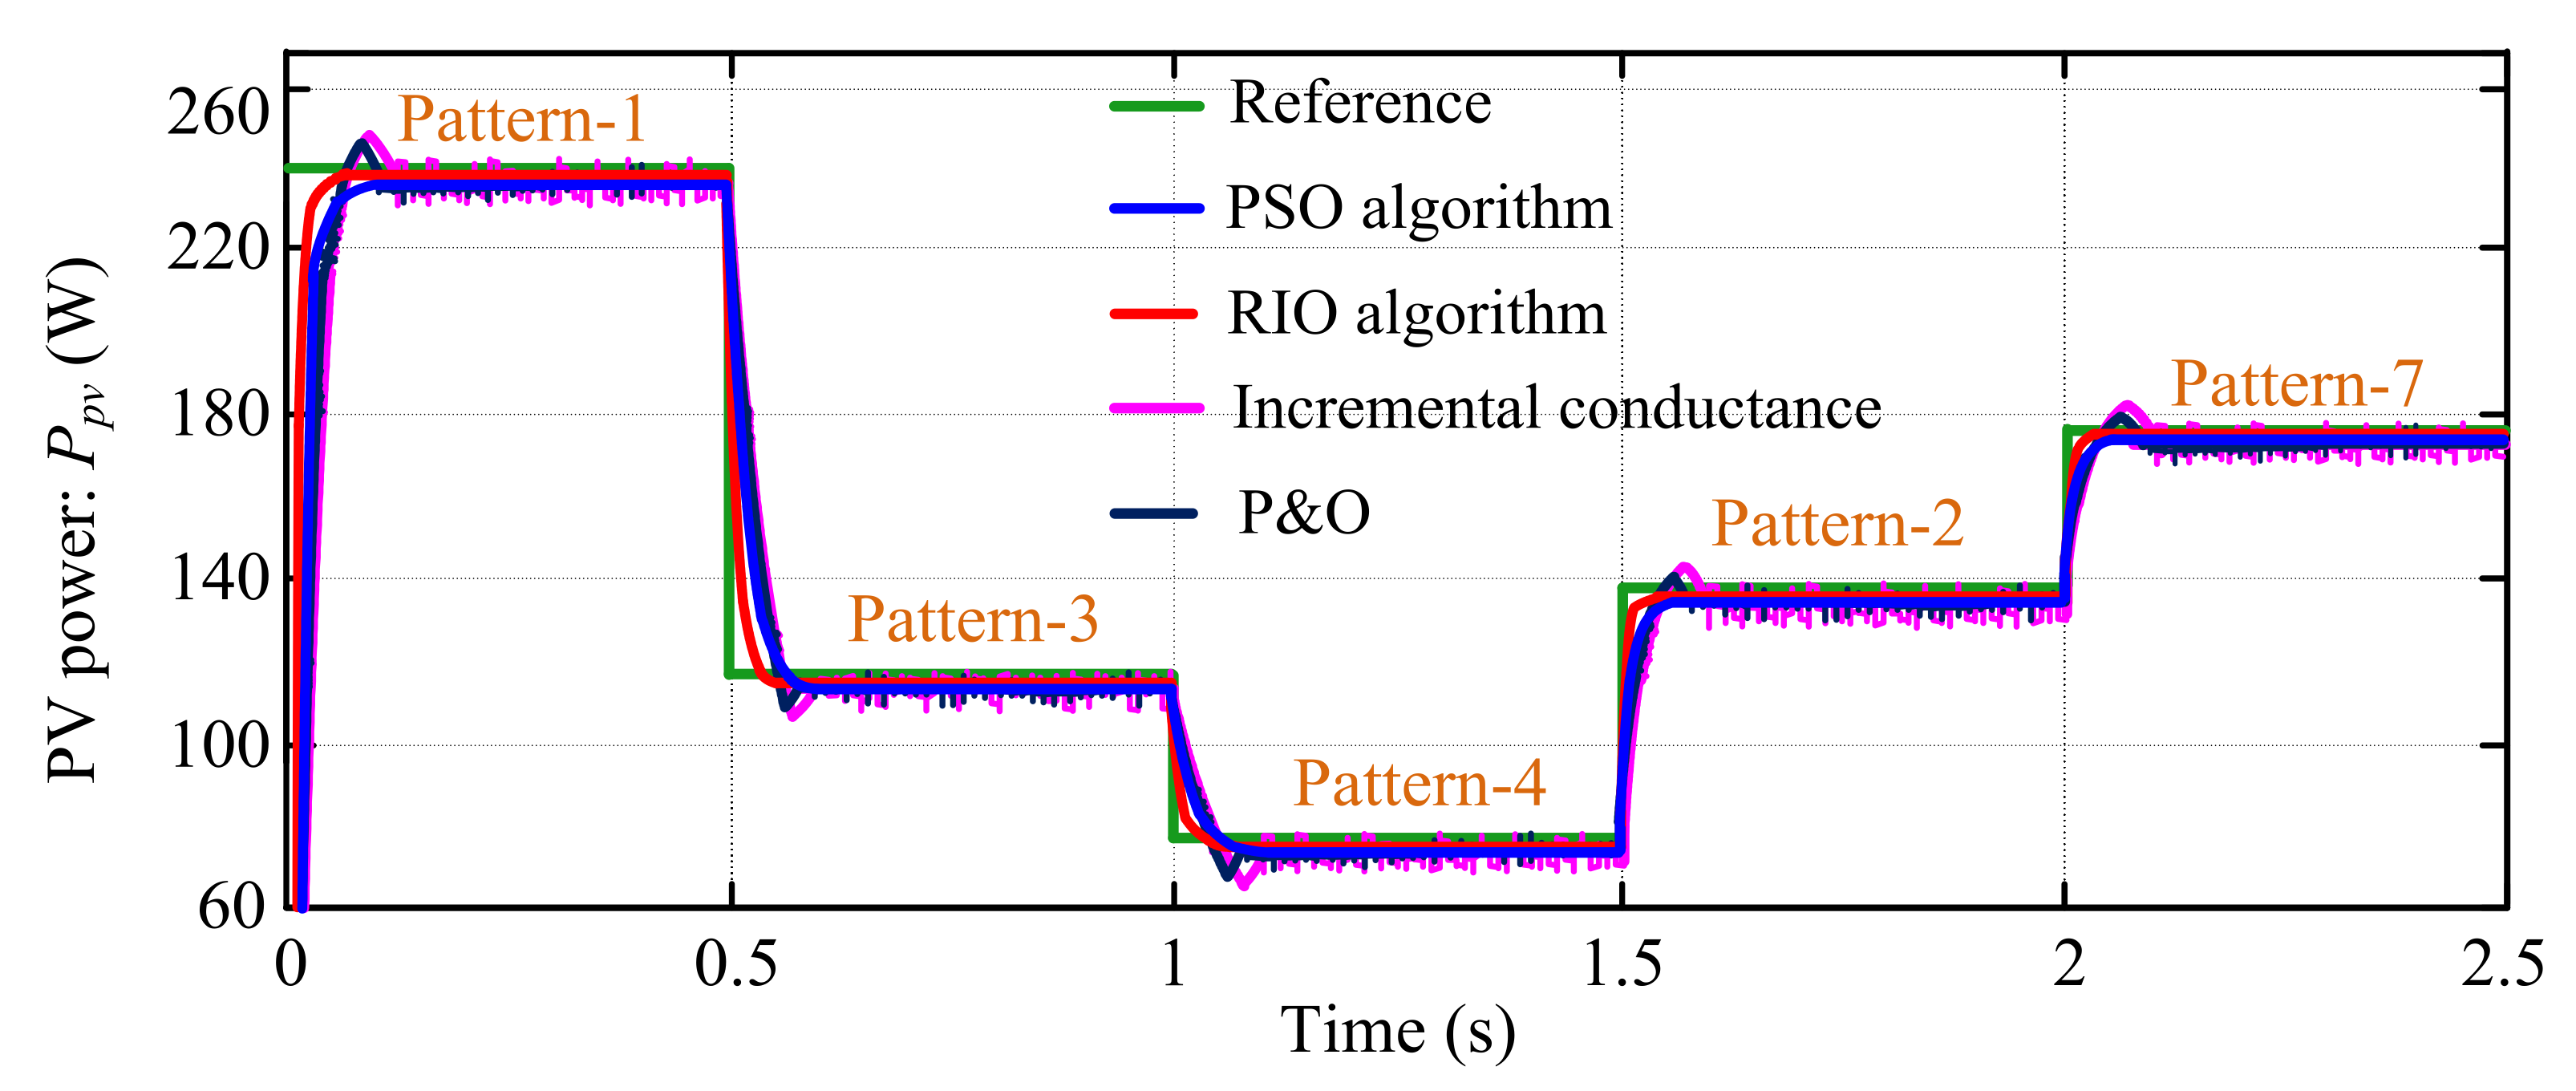
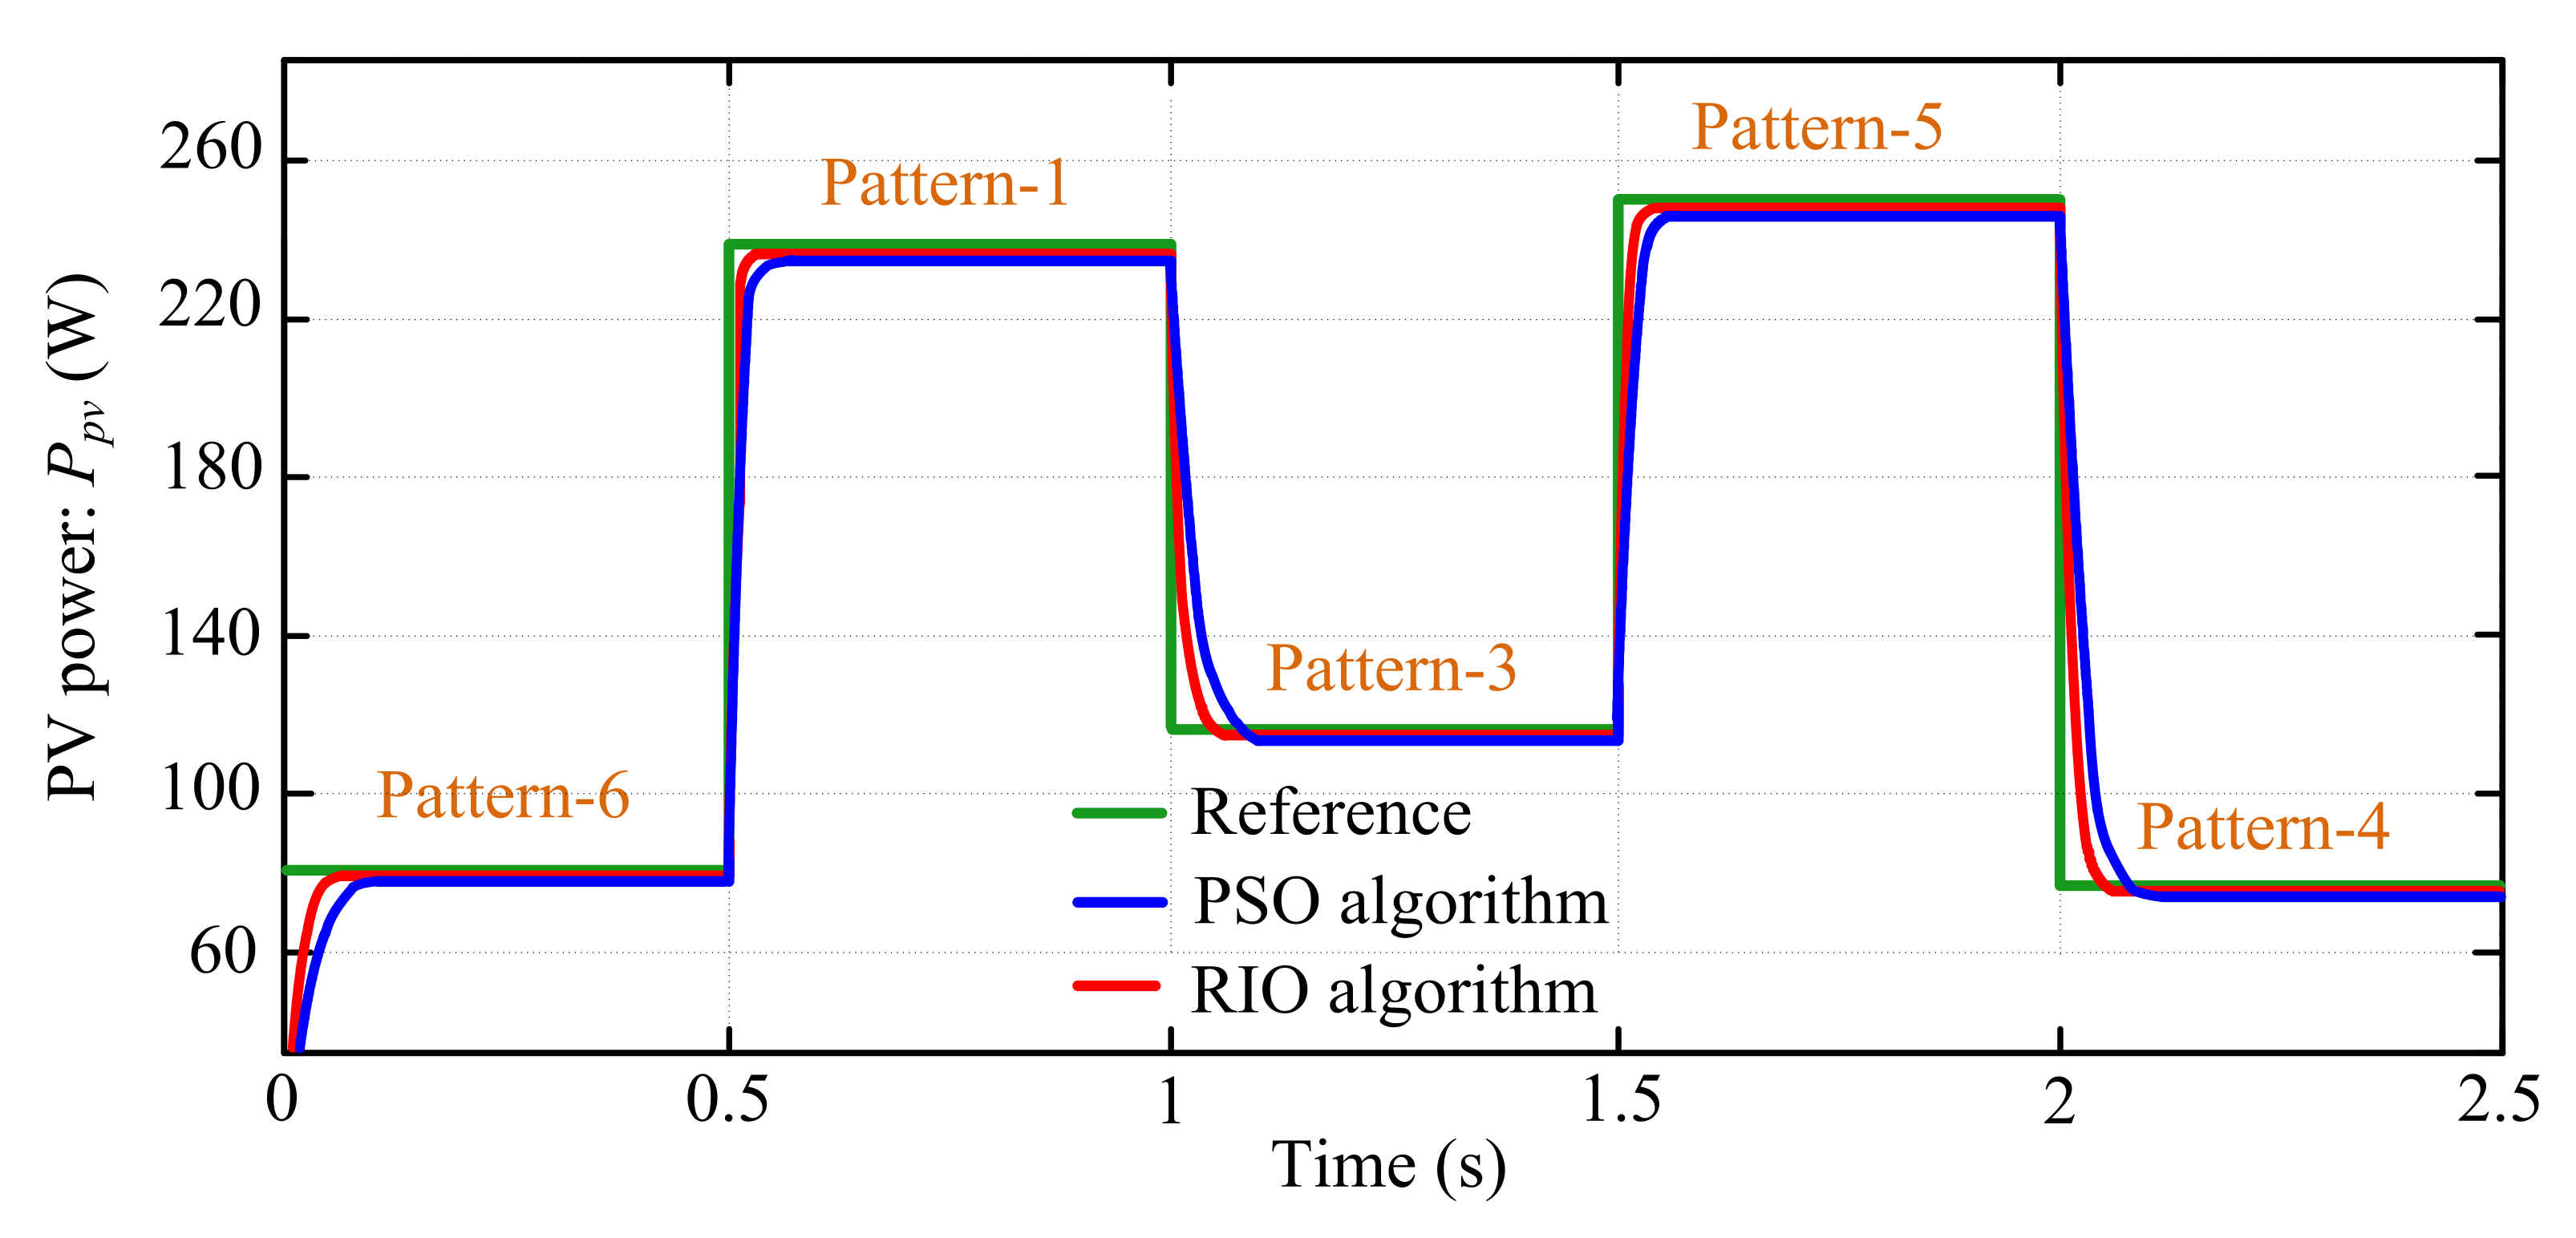
To ensure satisfactory performance under partial shading, the RIO-based MPPT recognizes the GMPP. For GMPP tracking, the Vpv and Ipv are significant for identifying the MPP by the algorithms. The harvested actual PV power (Ppv) of the PVS based on the results obtained from the P&O technique, incremental conductance (IC) method, PSO, and the proposed RIO algorithms are presented in Figure 11 and Figure 12. The simulation results are carried out under the same patterns as shown in Case-4.1 and the obtained PI-controller gains by the ITSE method.
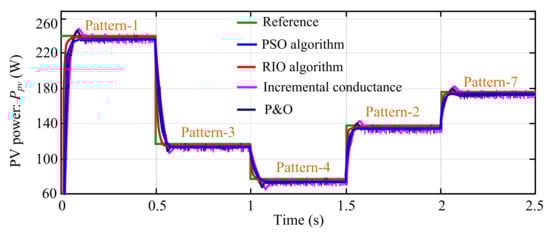
Figure 11.
PV system output power performance graph.

Figure 12.
Output power performance graph of the PV system.
From Figure 11, it can be seen that PV power response (Ppv) is more oscillating (i.e., minimum chattering) in the conventional P&O and IC methods as compared to the PSO and the proposed RIO techniques. Moreover, the results obtained with the IC method are less oscillating than the P&O method. The same was examined in the case study, which is shown in Figure 12 and other partial shading conditions. Hence, from the results, it can be concluded that the bio-inspired PSO and RIO MPPT techniques have significantly improved search performance as compared to the conventional P&O and IC-based methodologies. These accomplishments of the bio-inspired algorithms were demonstrated by assessing the results with that of the conventional MPPT techniques such as P&O and IC for different uniform and PSCs in the PV system [8,40].
As shown in Figure 11 and Figure 12, the RIO-based technique tracked the MPP with higher accuracy around the GMPP during steady-state and extract more power than the PSO, P&O, and IC techniques from the PV system. The same can be examined in other shading patterns for different values of solar irradiation and temperature. The exact value of the actual power (Ppv) tracked by each technique of the PVS is presented in Table 8, as assessed in Figure 11 and Figure 12. Additionally, in order to evaluate the actual MPPT performance attained by both algorithms, the mathematical formulation for MPPT efficiency (ηMPPT) is represented as follows [7]:
where PMPPT is the maximum achievable power or true MPP of the PV system. Ppv is the actual power extracted from the PV array which depends upon the ability of the MPPT technique to attain a closer value of the true MPP (values shown in Figure 11 and Figure 12). It is true that the higher the MPPT algorithm’s accuracy, the higher the ηMPPT. The tracking efficiency of the MPPT algorithms for the PV system is shown in Table 8.
Table 8.
Comparative performance of different MPPT techniques.
From the above results, it can be concluded that the proposed RIO technique has a higher tracking competency compared to the above-mentioned P&O, IC, and PSO-based MPPT techniques. Moreover, it can be observed that ηMPPT varies with change in partial shading pattern due to the search behavior of the optimization algorithms being random in nature to track the optimal point/solution. Additionally, the convergence speed (i.e., searching process time) is the time that the PV system takes to achieve the steady-state value of Ppv. The searching process time (tc) of the P&O, IC, and PSO techniques (Table 8) is more than that of the RIO technique for MPPT, as studied in Figure 11 and Figure 12. Furthermore, it can be seen that the value of tc is higher for the partial shading scenario as compared to the uniform irradiation on the PV panel.
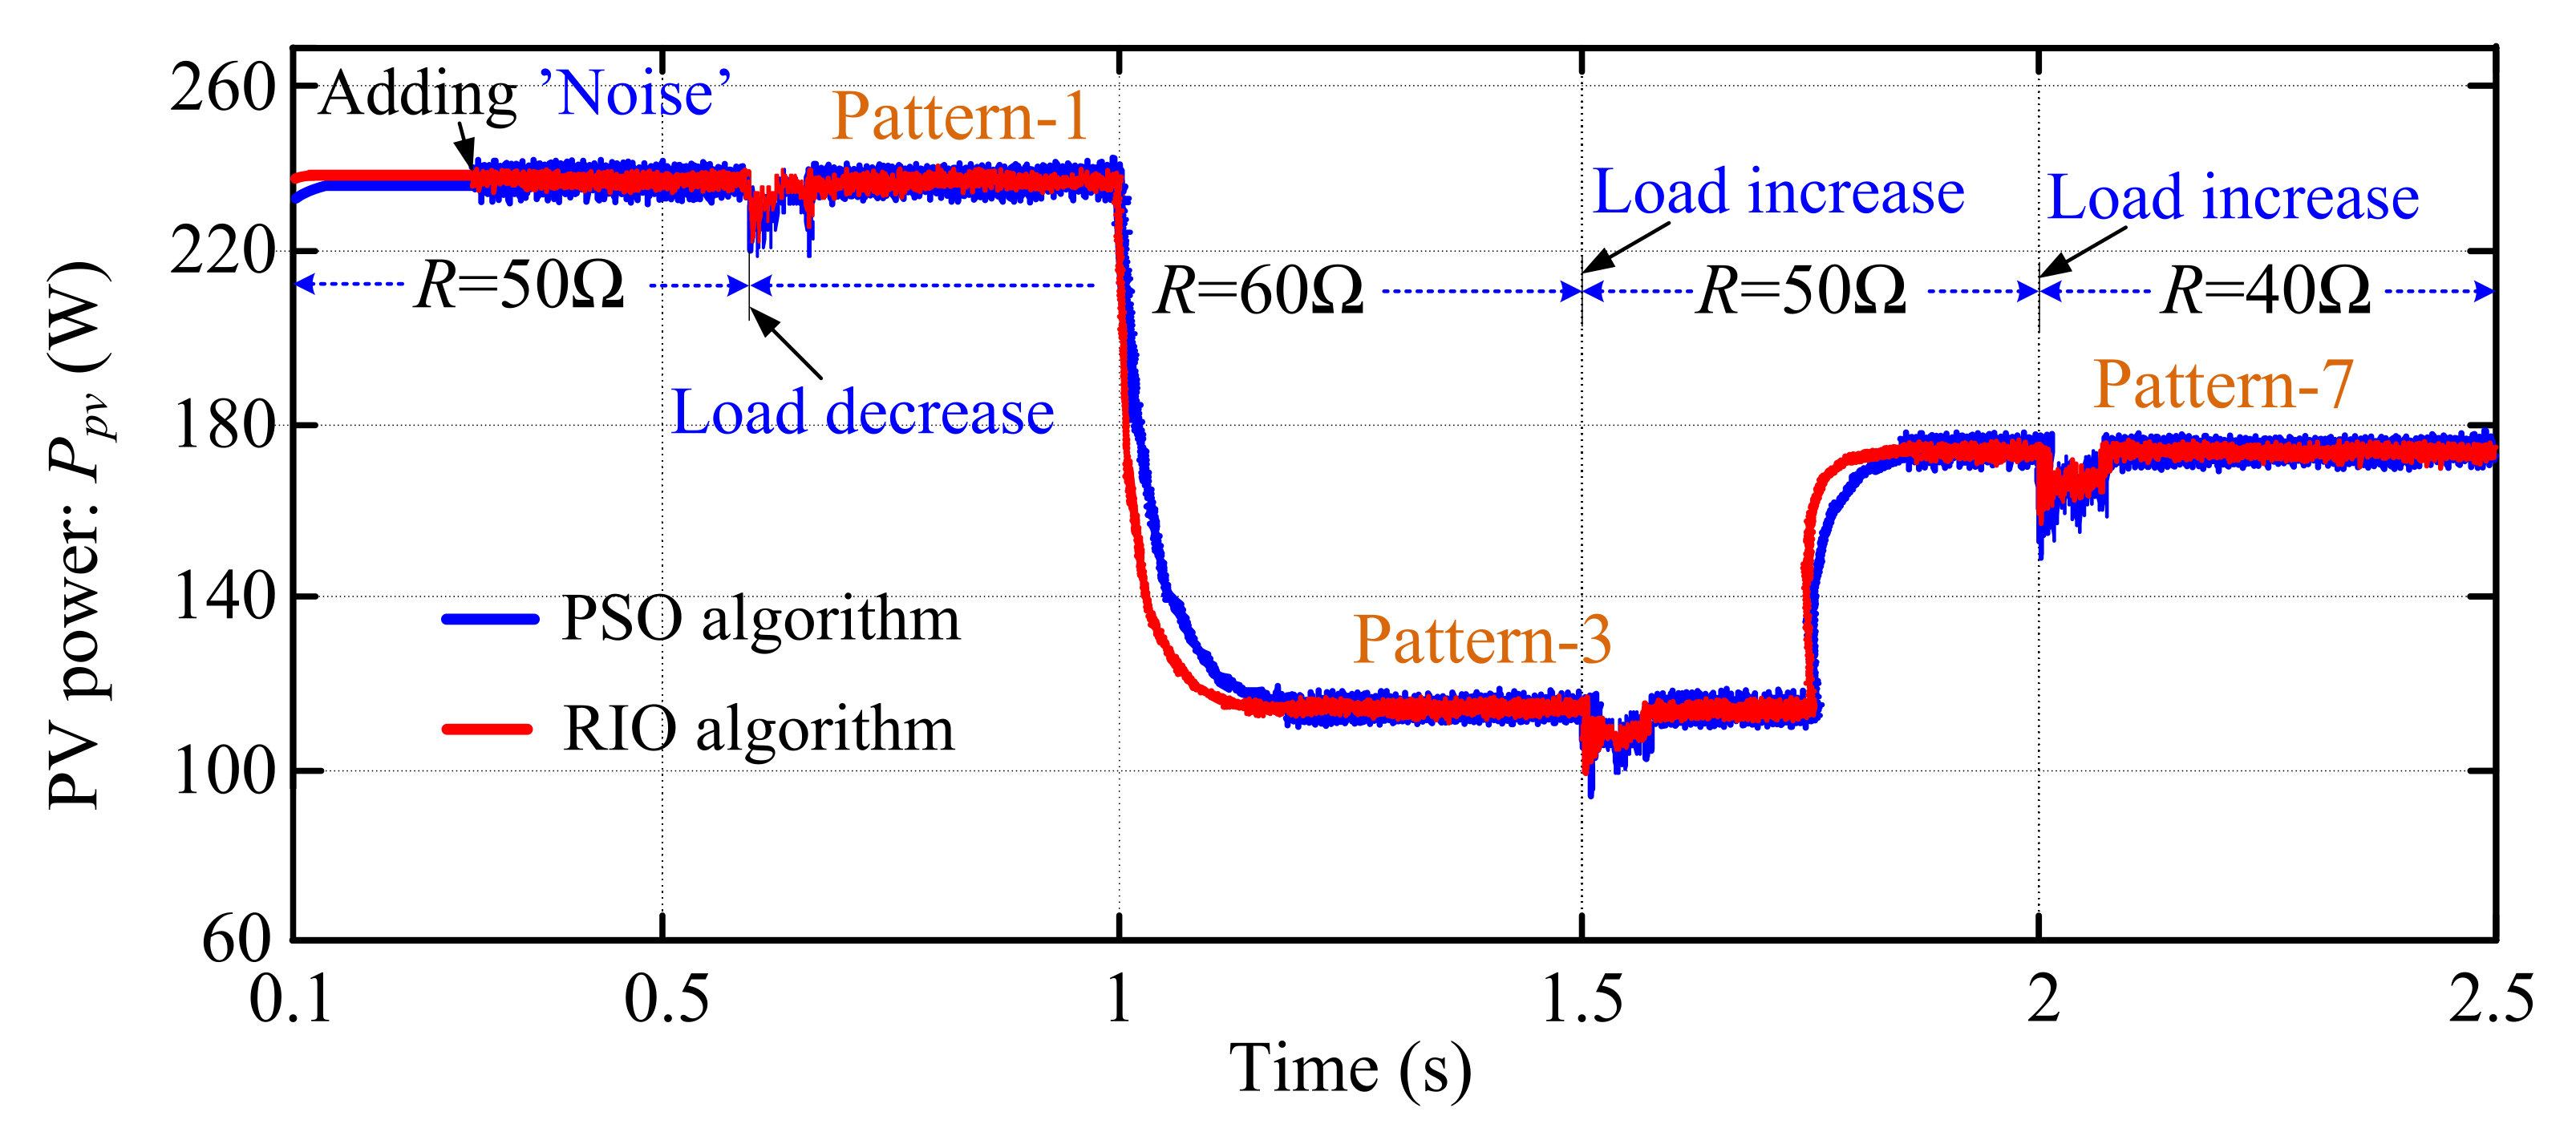
4.5. Comparison Performance Evaluation for the Presence of Uncertainty and Variation of Load (R)
In this case, the effectiveness/robustness of the proposed RIO algorithm is tested in the presence of noise and variations of the load resistance (R) of the PV system. The noise signal is introduced into the system when the voltage and current are measured and/or due to the uncertainties of the temperature and solar irradiance variations (i.e., noisy environments). Assume an expected noise of 40 dB signal to noise ratio (SNR) is introduced in the PV voltage as shown in Figure 4. The SNR is typically quantified in terms of the logarithmic decibel scale as follows:
where Psignal and Pnoise represent the average received signal power and noise power, respectively. Vsignal and Vnoise are the corresponding signal voltage and noise voltage, respectively.
In Section 4.4, it is found that the PSO algorithm offers better results to get the GMPP as compared to P&O and IC techniques. Hence, in this case, the effectiveness of the proposed RIO algorithm is compared with the results obtained by PSO. In the presence of noise/uncertainties and variations of load (i.e., R), the comparative PV output powers for RIO and PSO algorithms are shown in Figure 13. Figure 13 illustrates that the RIO-based scheme exhibits the best performance than PSO. The RIO algorithm continuously finds the possible optimal point in the search space to ensure that the output result of the algorithm is GMPP with low oscillations in the variations of the load and PSCs. When the load variation occurs, the duty cycle changes to operate the PV system at Zmpp. As a result, the GMPP can be tracked back for load variations. The value of Zmpp for different shading patterns is presented in Table 5. Changing the output load does not prevent the algorithm from effectively obtaining the proper MPP in RIO. The RIO algorithm is tested and compared with PSO, P&O, and IC schemes under different PCSs, variations of load, and the presence of uncertainties to prove the system’s robustness and reliability.
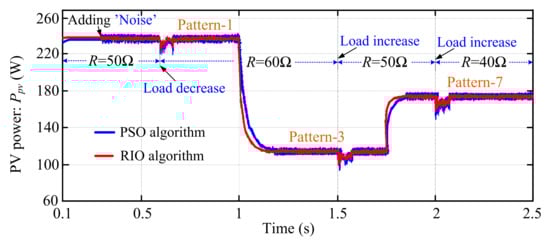
Figure 13.
Comparative dynamic response of PV power (Ppv).
5. Conclusions and Future Work
In this work, an MPPT technique based on a bio-inspired Roach infestation algorithm is projected to harvest the maximum power from a solar PV under uniform irradiation and PSC uses a step-change in irradiation. The obtained results are examined and evaluated with the PSO algorithm, P&O, and IC techniques. When the MPPT performance of the proposed RIO technique is equated with the PSO, P&O, and IC techniques, the RIO algorithm is realized to have a superior performance in terms of contributing a fast dynamic response, higher tracking accuracy to get the GMPP, and with more robustness against the presence of system uncertainties and load variations. From the results, the RIO method gives a higher efficiency of 99.19% in uniform shading and 99.86% during partial shading conditions which is lower as compared to the PSO, P&O, and IC techniques. Additionally, the settling time is less, i.e., 58.5 ms than the other three algorithms. In addition, the RIO algorithm is investigated for various benchmark functions and the findings show that the RIO is superior to the PSO in requirements of faster computational convergence and getting the optimal solution.
Future research work may be about proposing a modified RIO algorithm to enhance its search performance for solving different optimization problems. Additionally, the supremacy of the suggested RIO algorithm can be validated in an experimental hardware platform.
Author Contributions
Conceptualization, C.P.; Methodology, C.P. and N.K.N.; Software, C.P., M.K.S. and N.K.N.; Validation, C.P., M.K.S. and N.K.N.; Formal analysis, C.P., M.K.S. and R.K.C.; Writing—original draft preparation, C.P. and N.K.N.; Supervision, C.P.; Writing—review and editing, C.P., M.K.S. and R.K.C. All authors have read and agreed to the published version of the manuscript.
Funding
This research was supported by Arctic Centre for Sustainable Energy (ARC), The University of Tromsø-UiT The Arctic University of Norway, Norway, grant number: ARC-381300.
Institutional Review Board Statement
Not applicable.
Informed Consent Statement
Not applicable.
Data Availability Statement
Not applicable.
Acknowledgments
The authors are very grateful to the Arctic Centre for Sustainable Energy (ARC) and the UiT The Arctic University of Norway, Norway for providing an environment to do this research. Additionally, the authors acknowledge Pawan Sharma for the technical help and support of the manuscript.
Conflicts of Interest
The authors declare no conflict of interest.
Abbreviations
The following abbreviations are used in this manuscript:
| DC | Direct Current |
| GMPP | Global Maximum Power Point |
| IAE | Integral of Absolute Error |
| ISE | Integral of Squared Error |
| ITAE | Integral of Time-Absolute Error |
| ITSE | Integral of Time-Squared Error |
| MATLAB | MATrix LABoratory |
| MOSFET | Metal-Oxide Field Effect Transistor |
| MPP | Maximum Power Point |
| MPPT | Maximum Power Point Tracking |
| PSC | Partial Shading Condition |
| PSO | Particle Swarm Optimization |
| PV | Photovoltaic |
| PVS | Photovoltaic System |
| RIO | Roach Infestation Optimization |
References
- Amin, N.; Shahahmadi, S.A.; Chelvanathan, P.; Rahman, K.S.; Hossain, M.I.; Akhtaruzzaman, M.D. Solar Photovoltaic Technologies: From Inception Toward the Most Reliable Energy Resource. In Encyclopedia of Sustainable Technologies; Abraham, M.A., Ed.; Elsevier: Oxford, UK, 2017; pp. 11–26. [Google Scholar]
- Choudhary, P.; Srivastava, R.K. Sustainability perspectives—A review for solar photovoltaic trends and growth opportunities. J. Clean. Prod. 2019, 227, 589–612. [Google Scholar] [CrossRef]
- Jaganmohan, M. Global Cumulative Installed Solar PV Capacity 2000–2019. 2021. Available online: https://www.statista.com/statistics/280220/global-cumulative-installed-solar-pv-capacity/ (accessed on 20 February 2022).
- Mao, M.; Cui, L.; Zhang, Q.; Guo, K.; Zhou, L.; Huang, L. Classification and summarization of solar photovoltaic MPPT techniques: A review based on traditional and intelligent control strategies. Energy Rep. 2020, 6, 1312–1327. [Google Scholar] [CrossRef]
- Obeidat, F. A comprehensive review of future photovoltaic systems. Sol. Energy 2018, 163, 545–551. [Google Scholar] [CrossRef]
- Lupangu, C.; Bansal, R.C. A review of technical issues on the development of solar photovoltaic systems. Renew. Sustain. Energy Rev. 2017, 73, 950–965. [Google Scholar] [CrossRef]
- Pradhan, C.; Senapati, M.K.; Malla, S.G.; Nayak, P.K.; Gjengedal, T. Coordinated Power Management and Control of Standalone PV-Hybrid System with Modified IWO-Based MPPT. IEEE Syst. J. 2020, 15, 97–108. [Google Scholar] [CrossRef]
- Javed, M.Y.; Mirza, A.F.; Hasan, A.; Rizvi, S.T.H.; Ling, Q.; Gulzar, M.M.; Safder, M.U.; Mansoor, M. A Comprehensive Review on a PV Based System to Harvest Maximum Power. Electronics 2019, 11, 1480. [Google Scholar] [CrossRef] [Green Version]
- Raghavendra, K.V.G.; Zeb, K.; Muthusamy, A.; Krishna, T.N.V.; Prabhudeva Kumar, S.V.S.V.; Kim, D.-H.; Kim, M.-S.; Cho, H.-G.; Kim, H.-J. A Comprehensive Review of DC–DC Converter Topologies and Modulation Strategies with Recent Advances in Solar Photovoltaic Systems. Electronics 2020, 9, 31. [Google Scholar] [CrossRef] [Green Version]
- Li, X.; Wang, Q.; Wen, H.; Xiao, W. Comprehensive Studies on Operational Principles for Maximum Power Point Tracking in Photovoltaic Systems. IEEE Access 2019, 7, 121407–121420. [Google Scholar] [CrossRef]
- Li, G.; Jin, Y.; Akram, M.W.; Chen, X.; Jie, J. Application of Bio-inspired Algorithms in Maximum Power Point Tracking for PV Systems under Partial Shading Sonditions—A review. Renew. Sustain. Energy Rev. 2018, 81, 840–873. [Google Scholar] [CrossRef]
- De Paulo, A.F.; Porto, G.S. Evolution of collaborative networks of solar energy applied technologies. J. Clean. Prod. 2018, 204, 310–320. [Google Scholar] [CrossRef]
- Kermadi, M.; Berkouk, E.M. Artificial intelligence-based maximum power point tracking controllers for Photovoltaic systems: Comparative study. Renew. Sustain. Energy Rev. 2017, 69, 369–386. [Google Scholar] [CrossRef]
- da Luz, C.M.A.; Vicente, E.M.; Tofoli, F.L. Experimental evaluation of global maximum power point techniques under partial shading conditions. Sol. Energy 2020, 196, 49–73. [Google Scholar] [CrossRef]
- Ko, J.-S.; Huh, J.-H.; Kim, J.-C. Overview of Maximum Power Point Tracking Methods for PV System in Micro Grid. Electronics 2020, 9, 816. [Google Scholar] [CrossRef]
- Motahhir, S.; El Hammoumi, A.; El Ghzizal, A. The most used MPPT algorithms: Review and the suitable low-cost embedded board for eachalgorithm. J. Clean. Prod. 2020, 246, 118983. [Google Scholar] [CrossRef]
- Owusu-Nyarko, I.; Elgenedy, M.A.; Abdelsalam, I.; Ahmed, K.H. Modified Variable Step-Size Incremental Conductance MPPT Technique for Photovoltaic Systems. Electronics 2021, 10, 2331. [Google Scholar] [CrossRef]
- Ahmed, J.; Salam, Z. A Modified P&O Maximum Power Point Tracking Method with Reduced Steady-State Oscillation and Improved Tracking Efficiency. IEEE Trans. Sustain. Energy 2016, 7, 1506–1515. [Google Scholar] [CrossRef]
- Rawat, R.; Chandel, S. Hill Climbing Techniques for Tracking Maximum Power Point in Solar Photovoltaic Systems—A Review. Spec. Issue Int. J. Sustain. Dev. Green Econ. 2013, 2, 90–95. [Google Scholar]
- Subramanian, V.; Indragandhi, V.; Kuppusamy, R.; Teekaraman, Y. Modeling and Analysis of PV System with Fuzzy Logic MPPT Technique for a DC Microgrid under Variable Atmospheric Conditions. Electronics 2021, 10, 2541. [Google Scholar] [CrossRef]
- Kulaksız, A.A.; Akkaya, R. A genetic algorithm optimized ANN-based MPPT algorithm for a stand-alone PV system with induction motor drive. Sol. Energy 2012, 86, 2366–2375. [Google Scholar] [CrossRef]
- Huang, Y.-P.; Huang, M.-Y.; Ye, C.-E. A Fusion Firefly Algorithm with Simplified Propagation for Photovoltaic MPPT Under Partial Shading Conditions. IEEE Trans. Sustain. Energy 2020, 11, 2641–2652. [Google Scholar] [CrossRef]
- Ishaque, K.; Salam, Z. A Deterministic Particle Swarm Optimization Maximum Power Point Tracker for Photovoltaic System under Partialshading Condition. IEEE Trans. Ind. Electron. 2013, 60, 3195–3207. [Google Scholar]
- Titri, S.; Larbes, C.; Toumi, K.Y.; Benatchba, K. A new MPPT controller based on the Ant colony optimization algorithm for Photovoltaic systems under partial shading conditions. Appl. Soft Comput. 2017, 58, 465–479. [Google Scholar] [CrossRef]
- Zaki Diab, A.A.; Rezk, H. Global MPPT based on flower pollination and differential evolution algorithms to mitigate partial shading in building integrated PV system. Sol. Energy 2017, 157, 171–186. [Google Scholar] [CrossRef]
- Senapati, M.K.; Pradhan, C.; Calay, R.K. A computational intelligence based maximum power point tracking for photovoltaic power generation system with small-signal analysis. Optim. Control Appl. Methods 2021, 32, 1–20. [Google Scholar] [CrossRef]
- Mirza, A.F.; Mansoor, M.; Ling, Q.; Yin, B.; Javed, M.Y. A Salp-Swarm Optimization based MPPT technique for harvesting maximum energy from PV systems under partial shading conditions. Energy Convers. Manag. 2020, 209, 11625. [Google Scholar] [CrossRef]
- Liao, C.Y.; Subroto, R.K.; Millah, I.S.; Lian, K.L.; Huang, W.-T. An Improved Bat Algorithm for More Efficient and Faster Maximum Power Point Tracking for a Photovoltaic System Under Partial Shading Conditions. IEEE Access 2020, 8, 96378–96390. [Google Scholar] [CrossRef]
- Rehman, H.; Murtaza, A.F.; Sher, H.A.; Noman, A.M.; Al-Shamma’a, A.A.; Alkuhayli, A.; Spertino, F. Neighboring-Pixel-Based Maximum Power Point Tracking Algorithm for Partially Shaded Photovoltaic (PV) Systems. Electronics 2022, 11, 359. [Google Scholar] [CrossRef]
- González-Castaño, C.; Lorente-Leyva, L.L.; Muñoz, J.; Restrepo, C.; Peluffo-Ordóñez, D.H. An MPPT Strategy Based on a Surface-Based Polynomial Fitting for Solar Photovoltaic Systems Using Real-Time Hardware. Electronics 2021, 10, 206. [Google Scholar] [CrossRef]
- Pervez, I.; Pervez, A.; Tariq, M.; Sarwar, A.; Chakrabortty, R.K.; Ryan, M.J. Rapid and Robust Adaptive Jaya (Ajaya) Based Maximum Power Point Tracking of a PV-Based Generation System. IEEE Access 2020, 9, 48679–48703. [Google Scholar] [CrossRef]
- Pervez, I.; Shams, I.; Mekhilef, S.; Sarwar, A.; Tariq, M.; Alamri, B. Most Valuable Player Algorithm based Maximum Power Point Tracking for a Partially Shaded PV Generation System. IEEE Trans. Sustain. Energy 2021, 12, 1876–1890. [Google Scholar] [CrossRef]
- Guo, S.; Abbassi, R.; Jerbi, H.; Rezvani, A.; Suzuki, K. Efficient maximum power point tracking for a photovoltaic using hybrid shuffled frog-leaping and pattern search algorithm under changing environmental conditions. J. Clean. Prod. 2021, 297, 126573. [Google Scholar] [CrossRef]
- Gonzalez-Castano, C.; Restrepo, C.; Kouro, S.; Rodriguez, J. MPPT Algorithm Based on Artificial Bee Colony for PV System. IEEE Access 2021, 9, 43121–43133. [Google Scholar] [CrossRef]
- Lodhi, E.; Wang, F.-Y.; Xiong, G.; Mallah, G.A.; Javed, M.Y.; Tamir, T.S.; Gao, D.W. A Dragonfly Optimization Algorithm for Extracting Maximum Power of Grid-Interfaced PV Systems. Sustainability 2021, 13, 10778. [Google Scholar] [CrossRef]
- Ali, E.M.; Abdelsalam, A.K.; Youssef, K.H.; Hossam-Eldin, A.A. An Enhanced Cuckoo Search Algorithm Fitting for Photovoltaic Systems’ Global Maximum Power Point Tracking under Partial Shading Conditions. Energies 2021, 14, 7210. [Google Scholar] [CrossRef]
- Khan, R.; Khan, L.; Ullah, S.; Sami, I.; Ro, J.-S. Backstepping Based Super-Twisting Sliding Mode MPPT Control with Differential Flatness Oriented Observer Design for Photovoltaic System. Electronics 2020, 9, 1543. [Google Scholar] [CrossRef]
- Pradhan, C.; Bhende, C.N. Online Load Frequency Control in Power Systems using Modified Jaya Optimization Algorithm. Eng. Appl. Artif. Intell. 2019, 77, 212–228. [Google Scholar] [CrossRef]
- Pradhan, C.; Gjengedal, T. Adaptive Jaya Algorithm for Optimized PI-PD Cascade Controller of Load Frequency Control in Interconnected Two-Area Power System. In Proceedings of the 2020 International Conference on Smart Systems and Technologies (SST), Osijek, Croatia, 14–16 October 2020; pp. 181–186. [Google Scholar]
- Ali, A.; Almutairi, K.; Padmanaban, S.; Tirth, V.; Algarni, S.; Irshad, K.; Islam, S.; Zahir, M.H.; Shafiullah, M.; Malik, M.Z. Investigation of MPPT Techniques Under Uniform and Non-Uniform Solar Irradiation Condition—A Retrospection. IEEE Access 2020, 8, 127368–127392. [Google Scholar] [CrossRef]
- Dileep, G.; Singh, S.N. Selection of non-isolated DC-DC converters for solar photovoltaic system. Renew. Sustain. Energy Rev. 2017, 76, 1230–1247. [Google Scholar]
- Asadi, F.; Eguchi, K. Dynamics and Control of DC-DC Converters. Synth. Lect. Power Electron. 2018, 6, 1–241. [Google Scholar] [CrossRef]
- Walker, G. Evaluating MPPT converter topologies using a Matlab PV model. Aust. J. Electr. Electron. Eng. 2001, 21, 49–56. [Google Scholar]
- Dash, P.K.; Gupta, N.C. Effect of Temperature on Power Output from Different Commercially available Photovoltaic Modules. Int. J. Eng. Res. Appl. 2015, 5, 148–151. [Google Scholar]
- Hasan, K.; Yousuf, S.B.; Tushar, M.S.H.K.; Das, B.K.; Das, P.; Islam, S. Effects of different environmental and operational factors on the PV performance: A comprehensive review. Energy Sci. Eng. 2022, 10, 656–675. [Google Scholar] [CrossRef]
- Havens, T.C.; Spain, C.J.; Salmon, N.G.; Keller, J.M. Roach Infestation Optimization. In Proceedings of the 2008 IEEE Swarm Intelligence Symposium, St. Louis, MO, USA, 21–23 September 2008; pp. 1–7. [Google Scholar]
- Pradhan, C.; Gjengedal, T. A Novel Fuzzy Adaptive Jaya Optimization for Automatic Generation Control in Multi-Area Power System. In Proceedings of the 2020 IEEE 17th India Council International Conference (INDICON), New Delhi, India, 10–13 December 2020; pp. 1–6. [Google Scholar]
- Sahib, M.A.; Ahmed, B.S. A new multiobjective performance criterion used in PID tuning optimization algorithms. J. Adv. Res. 2016, 7, 125–134. [Google Scholar] [CrossRef] [PubMed] [Green Version]
- Özdemir, M.T.; Öztürk, D. Comparative Performance Analysis of Optimal PID Parameters Tuning Based on the Optics Inspired Optimization Methods for Automatic Generation Control. Energies 2017, 10, 2134. [Google Scholar] [CrossRef] [Green Version]


Publisher’s Note: MDPI stays neutral with regard to jurisdictional claims in published maps and institutional affiliations. |
© 2022 by the authors. Licensee MDPI, Basel, Switzerland. This article is an open access article distributed under the terms and conditions of the Creative Commons Attribution (CC BY) license (https://creativecommons.org/licenses/by/4.0/).