Abstract
Context: The definition and prioritization of indicators is now a common reality and an integral part of the evolution of the strategic, technical and business processes of any organization, whether public or private. Purpose: This paper proposes a new model regarding the definition and prioritization of indicators. Herein, we also investigate the definition and prioritization models currently adopted by academia and industry, and analyze the context of the proposed strategies against the traditional view of indicator definition currently adopted. In addition, we conducted a survey with organizations that had well-defined indicator management processes, seeking to identify customer expectations with a new indicator management model proposed by this work. Method: To gather evidence, we defined a methodology that relates the literature review and an exploratory case study with the application of an experiment. Driven by a set of research questions, this methodology comprised four main phases: planning, literature review, experiment execution and documentation of results. The method used is supported by some techniques, such as design thinking, design sprint and the Cynefin framework. Results: The analysis of the results was carried out in two different ways: Through the verification of the achievement of specific objectives and through a questionnaire applied to assess the degrees of perception of all employees who participated in the work. Regarding the specific objectives, it is clear that most of the objectives were achieved. Regarding the applied questionnaire, it is clear that, although the collaborators did not have adequate knowledge regarding the conceptual and practical aspects of some approaches used in the proposed model, there was a general perception that the model, in fact, supported top management for decision making. For professionals, the proposed model has a restricted scope; that is, it does not serve all types of organizations. Conclusion: The model proposed in this work proved to be effective, considering that the indicators were defined, prioritized and optimized, with a focus on the user experience. As future work, we intend to expand the scope of the model’s performance, evaluating business indicators alongside IT indicators.
1. Introduction
Since the appearance of organizations oriented by process and projects, there has been a need to obtain a degree of increasing efficiency with regard to the usefulness and importance of certain processes and projects for the business of organizations [1]. An attempt was made to define indicators that would cover all the activities necessary for the development and operation of the activities inherent to an organization; however, the utility and suitability of indicators for the business context were not taken into account. Only with improvements in the steps that make up management processes, did researchers begin to realize the importance of obtaining a clear understanding of business needs [2].
Some frameworks or methodologies, such as Ikons Customer Relationship Management (iCRM) and tool support for consistency management and validation of requirements (MaramaAIC), prescribe and/or suggest a set of steps to be followed to efficiently and effectively achieve a clear definition of business needs [2,3,4,5]. However, they adopt a more traditional structure, where business needs are assessed based on specific techniques for defining and prioritizing indicators [6]. Throughout the definition and prioritization of the indicators, it is determined, within a pre-defined context, what are the needs and desires of the business managers. Driven by the need to discover the real needs of the user, information technology (IT) professionals do not limit themselves to the definition and prioritization of indicators through methods that do not take into account the user and business experience [7]. Hence, there is a process of trying to understand the user to seek what, in fact, the business needs.
A fundamental measure of success for the definition and prioritization of indicators is the level of involvement that the development team assumes with the user. To maintain user engagement and trust, the analyst must seek full understanding of the user through sharing and requiring knowledge, experiences, visions and values [8]. By being properly stimulated, users can express needs that they did not even know could exist. This factor reinforces the success of an alternative approach by introducing a mechanism for defining and prioritizing indicators aimed at creative thinking, empathy, ideation and the creation of innovative solutions [9].
Some researchers are focusing their research on approaches that seek to define and prioritize indicators in a more assertive way [10,11,12]. According to Ciriello et al. [11], a very interesting tool, but little used in software engineering, is storytelling. This tool establishes a common understanding between technical teams, business teams and users. When used in conjunction with the prototyping technique, it becomes an efficient tool with which to define and prioritize indicators [11]. A proposal made by Lucassen et al. [10] to make the definition and prioritization of indicators more assertive involves establishing a framework for the definition of users’ stories. The approach defines a series of criteria to be followed and the tool called AQUSA—Automatic Quality User Story Artisian [13]—which is used to support the definition of more effective user stories, so that, through user stories, it is possible understand which indicators should be developed, and of those that already exist, which ones should be prioritized to be improved [10]. This approach seems to be more appropriate when choosing to use a methodology based on agile practices.
Using this new approach is expected to provide efficiency in the processes and projects whose indicators are prioritized. The efficiency gain would occur through the reduction in expenses with rework related to the redesign, analysis, development and implementation of the solution. The reduction in costs would consequently also result in a reduction in the time for delivering the solution to the user [10].
In this work we propose a model for defining and prioritizing IT indicators, within a context related to agile software development, using specific mechanisms and tools for decision making and focusing on the end user, such as design thinking—which refers to the cognitive, strategic and practical processes by which design concepts (proposals for new products, buildings, softwares, etc.) are developed by designers and/or design teams [14,15,16]; design sprint—an exercise in five phases restricted by time to reduce the risks involved in bringing a software product to market [17,18,19]; and the Cynefin framework —a tool that guides professionals’ decision making by analyzing the context in which that decisions are made [20,21]. For this purpose, we have identified in the literature and industry indicators, and we validated them in a real context of agile software development.
The main accomplishments of this work were: (i) identification of the best practices adopted in academia and industry for the definition and prioritization of indicators oriented to creative thinking; (ii) a survey of technological solutions adopted by organizations in the indicator management processes; (iii) presentation of a model to prioritize and define indicators centered on the user, in which it is feasible to implement them in organizations that develop information and communication technology solutions.
2. Background and Related Works
The activities related to the management of indicators represent an important part in the process of developing IT solutions. The context in which the problems of indicator management are analyzed change over time, and the approach related to the definition and prioritization of indicators has remained inert, given that it has not adapted to the changes that have arisen in the context of problems reported by customers [8,22]. The consequences of this negligence can lead to delays in the schedule and additional costs; a high level of defects in the solution delivered; and most importantly, the delivery of a solution that does not fully satisfy the user’s needs [3].
The indicator management study area oriented toward creative thinking is a promising but understudied research area to date. Nguyen and Shanks [23] proposed an approach that defines five creativity clusters: product, process, domain, people and context:
- Product: It is often described as having the following main characteristics: novelty, value and surprisingness.
- (a)
- Novelty: A creative product must be new and original. Based on the three levels of creativity, novelty can be determined as levels P, S or H. P-level ideas seem new to the individual creator. S-level ideas result from a confluence of individual effort and the collective cultures of professional domains and social groups; therefore, S-level ideas are recognized as new and original to both the professional and the social group(s) involved. H-level ideas seem original to everyone [23].
- (b)
- Value: An innovative product must also be useful, i.e., it must be feasible and effective in solving a problem. Nguyen and Shanks [23] described value through suitability, including the correctness and appropriateness of the creative product to its context of use.
- (c)
- Surprisingness: Surprise is often associated with creative products. Nguyen and Shanks [23] described surprise as an unusual and unexpected impact that can either shock or surprise a person.
- Process: The creative process can be defined as an internal process of exploring and transforming conceptual spaces in an individual mind.
- Domain: The role of the domain is strongly recognized in the systemic view of creativity. First, the domain provides a symbolic system and body of knowledge of a subject. Second, the value and novelty of a creative product must be defined within a specific domain and the state of the art of that domain [23].
- People: The common personal characteristics of creative individuals can be categorized as follows: Traits (original, articulate and fluent in generating ideas), cognitive skills (metaphorical thinking, problem sensitivity and cognitive flexibility) and problem-solving styles (holistic approach to thinking, logical thinking approach and experimentation) [23].
- Context: Creative products are usually the result of teamwork, done collaboratively. The main factors that influence team creativity can be classified as cognitive or social. Cognitive factors include analysis and synthesis skills, procedural and organizational skills and political knowledge. Individual social factors include each team member’s education, work experience and background culture. Collaborative social factors include group dynamics and conflicts [23].
Each creativity group has direct involvement with the software requirements of elicitation activity, as presented in Table 1. Hickey and Davis [24] were interested in unifying the indicator definition models through the formula:
to explicitly highlight the role that user knowledge plays in the process of selecting indicators to be prioritized and to provide a unified framework for understanding the role of indicator management in software development.

Table 1.
Implications of creative research for requirements engineering (RE) [23].
2.1. Requirement Indicators
The systematic literature review carried out by Inayat et al. [25], found seventeen requirement-related engineering practices adopted by professionals, including five challenges of traditional requirements engineering overcomes with the adoption of agile requirements engineering and eight challenges related to agile requirements engineering. Some examples can be mentioned, in critical projects, of failures in solutions or in projects in which the deficiency in prioritizing requirements indicators caused problems in the final delivery of the solution [3].
According to Vlas and Robinson [26], requirement indicators serve as a way of measuring different types of aspects that involve requirements engineering. According to the authors, requirements can be measured using 23 different types of indicator categories: traceability, completeness, consistency, accuracy, error tolerance, execution efficiency, storage efficiency, access control, access auditing, operability, training, communicability, simplicity, conciseness, instrumentation, self-description, expandability, generality, modularity, software system independence, machine independence, common communication, common data and average approval time [26,27,28,29].
2.2. Performance Indicators
Managing indicators is an essential task for achieving an organization’s strategic objectives. Measuring the efficiency of processes and projects in the achievement of these objectives provides the organization with essential information for making the right decisions.
Sanchez [30] proposed an integration between sustainability issues and project management. According to Sanchez [30], it is necessary to develop a structure to help ensure that an organization is working on the right projects to achieve its business strategy and the demands of interested parties. For this, the author’s proposal addresses the problems related to portfolio selection and project tracking. The author used the Balanced Scorecard (BSC) [31] and its respective indicators to measure the impacts of sustainability on defining and monitoring a project portfolio, along with the most suitable key performance indicators (KPIs) for each project or process. KPIs are the critical key indicators of progress toward an intended result. KPIs provide focuses for strategic and operational improvements, create an analytical basis for decision making and help focus attention on what matters most [32].
The following performance indicators were identified in the literature: market size, competition, sales potential, profitability or technical likelihood of success, return on investment (ROI), market share, customer acquisition, churn rate, customer satisfaction, failure rate, employee training, percentage of action plans completed on time and percentage of the IT master plan executed in the current period [30,33,34,35].
2.3. Risk Indicators
In addition to the requirements and performance indicators, there is a need to define indicators to measure the risk of a particular project or process. Based on this premise, Kumar et al. [36] proposed the identification of risk indicators for agile software in agile software development projects. According to the authors, the use of risk indicators is useful for planning risk assessments in any agile software project that one is planning to develop. It is useful for process optimization and helps management decisions.
Despite the importance of risk management in software projects, this practice is still generally ignored by organizations that develop agile software. A reason for this is that the concept of risk is non-configurable and distorted, and its management does not bring visible immediate practical results. To achieve a satisfactory result in performing risk management processes, risk indicators are needed for one or more risk components that have been identified in the project [36]. The following risk indicators have been identified from the literature: software environment risks, process problem risks, team size and experience, technical problem risks, technology risks and schedule risks [36,37,38,39,40,41].
2.4. Test Indicators
According to Juhnke et al. [42], testing is an important quality assurance activity during software development. Thus, the authors proposed some potential indicators of quality: test case efficiency index, percent distribution of contained object types, test case size, test case specification type, linked object types, number of linked object types, template conformance percent, percent of untested demands, percent of bugs per function point, percent of demands failed by test, average test cycles, percent of bugs by severity and percent of bugs by resolution [42,43].
2.5. Service Operation Indicators
According to Mittmann [44], it is important to analyze the results of the implementation and operation of a service center through indicators. Such analysis is necessary, considering that, without the adoption of indicators, the analysis can become very subjective. Granulo and Tanovic [45] also highlighted the need to measure the processes of the Information Technology Infrastructure Library (ITIL) model, using the indicators defined by the library itself [45]. Thus, the authors proposed the use of a group of indicators used to measure the processes related to the operation of services, namely, incidents, problems, interaction, request fulfillment and access [44].
2.6. Deployment Indicators
Moeller [46] also practically defined a group of indicators used to measure the demands that are conceived through the demand management process, both from the perspective of ITIL and from the perspective of Control Objectives for Information and Related Technologies (COBIT) [47]. Rose [48] proposed a guide to project management, using the Project Management Body of Knowledge (PMBOK). The author emphasizes the importance of clearly defining indicators to measure all aspects that involve project management [49].
Among the existing guidelines in the literature, we have selected some indicators related to the deployment of solutions: percentage of rejected normal deployments, percentage of rejected emergency deployments, percentage of emergency deployments, percentage of successful deployments, percentage of deployments return, percentage of corrections in deployments, percentage of results return, percentage of manager satisfaction, percentage of satisfaction response, percentage of unavailability and failures and quantity of deployments by status in execution.
2.7. Applying Indicator Management in Organizations
Indicator management is a growing trend these days. In particular, the management of indicators in organizations has been transforming the relationship between the end-user and the company. This process has been seen as a great opportunity for companies to ensure users’ satisfaction, offering products and services with more quality and agility, thereby promoting the continuity of the relationships between the clients and the organization [50].
Although the benefits are undeniable [51,52,53], the methods for defining and prioritizing indicators vary, and each organization adopts different and varied practices according to its goals and possibilities. Therefore, it is a complex task to establish comparisons between organizations regarding the maturity levels of indicator management. By evaluating the context of organizations in Brazil, we could observe some initiatives of Brazilian organizations that defined and more efficiently prioritized performance indicators, for the development of software, guidelines, and institutional support.
The management of indicators aims to help the organization’s decision-makers to understand which indicators will bring more significant benefits to their customers, improving the business environment and the efficiency of the organizational management [54]. In these unpredictable times, organizations anticipate that proper and efficient indicator management will be essential for their survival in the coming years. Thus, this research aims to understand which indicator an organization should focus on to add more value to the end-user, proposing a model to define, prioritize and optimize information technology indicators.
3. Materials and Methods
The research methodology used in this work was design science research (DSR). According to Wieringa [55], this methodology is divided into 4 phases. For each research phase, some approaches were defined for its implementation, along the instruments of data collection and analysis. Each method is described within the next sections, which correspond to the phases of the DSR life cycle. In the implementation assessment phase, a literature review was carried out, which aimed to recognize the unity and interpretive diversity existing in the thematic axis in which the problem under study exists, to explain the context for the interpretative analysis, and to properly present the background for the arguments of the researchers [55]. At the end of the literature review, we expected to obtain a set of indicators that would be used in the application of the proposed model (Figure 1).
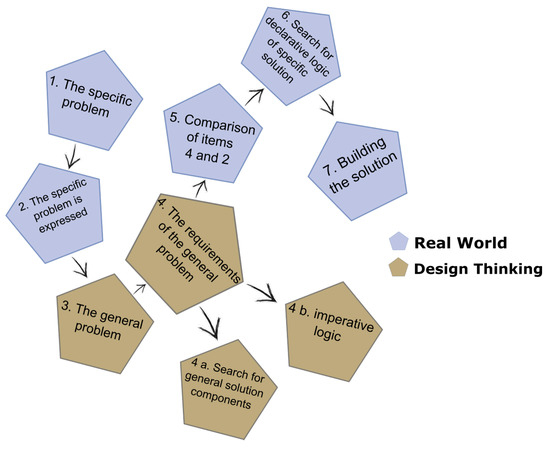
Figure 1.
DSR—real world and design thinking, adapted from [60].
In the solution design phase, the selected artifact was built to respond to the general objective of the proposed work. The selected artifact was a conceptual model to define, prioritize and optimize IT indicators. Conceptual models are useful to represent and graphically explain constructs of a specific domain and their relationships in an intuitive way [56]. The construction of propositions to support each relationship between elements of the artifact facilitated the validation, which was performed later. The construction of the artifact followed the instructions of Sjoberg et al. [57] and was based on the results obtained from the literature review.
The solution validation phase consisted of checking and refining the proposed artifact through an interview with some experts. The results were obtained through informal interviews with experts and representatives of senior management to validate both the conceptual aspects of the model, such as the proposals made and the degrees of understanding of the conceptual model; and the technical aspects, such as the techniques and approaches used to compose the model. The criteria of Sjoberg et al. [57] were used to evaluate the artifact.
The solution implementation phase was conducted through an exploratory case study, the purpose of which was to provide more information on the subject to be investigated, enabling its definition and delineation—that is, facilitating the delimitation of the theme of the search. This guided the setting of objectives and the formulation of hypotheses, and as a result, we discovered a new type of approach to the subject [55]. The exploratory case study was carried out based on the model proposed by Yin [58], which consists of 6 steps:
- Plan the case study: Identify a relevant situation for conducting a case study; compared research methods; understand the benefits of using a case study; address concerns about using a case study; and finally, decide whether you want to do a case study, as shown in Figure 2.
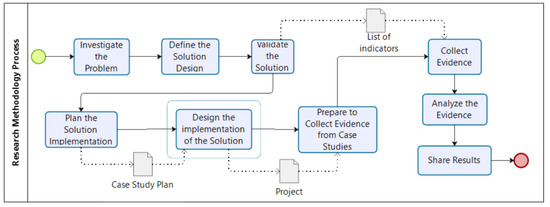 Figure 2. Process of implementing the adopted methodology.
 - Design the case study: Identify the cases and establish the logic of your case study; define the case(s) to be studied; develop the theory, propositions and related questions to guide the case study and generalize its findings; identify the design of the case study (single or multiple cases, holistic or embedded); and test the project based on pre-defined criteria to maintain the quality of a case study (Figure 2).
- Prepare to collect evidence from case studies: Improve skills to conduct the case study; train for a specific case study; develop the case study protocol; together with the general strategy, take into account some analytical techniques and address opposite explanations and interpretations (Figure 2).
- Collect evidence from case studies: Make data available from different perspectives; check the promising patterns, ideas and concepts; and develop a general analytical strategy (Figure 2).
- Analyze the evidence from the case study: Start with the definition of the questions (for example, the questions in your case study protocol) and not with the data. Focus son a small question first and then identify the evidence that deals with it. Draw an experimental conclusion based on the weight of the evidence. Consider how you should display the evidence so that interested parties can verify your assessment (Figure 2).
- Share the case studies: Define the audience and medium of communication; develop textual and visual materials; display enough evidence for the reader to reach his own conclusions; and review and recompose the research until it is adequate and well structured (Figure 2).
For the development of the exploratory case study, we used a simulated environment of an organization that does not have an effective mechanism to define and prioritize indicators, and later implemented it in a real environment: a financial institution in Brasilia (Brazil) that understands that information technology (IT) is part of any good strategic vision. The performances of the studied methodology and the proposed model were measured based on the services provided and products generated by IT, foreseen in the IT Strategic Plan (ITSP), according to the needs defined by the business and foreseen in the Institutional Strategic Plan (ISP) of the organizations. Figure 2 represents the execution process of the adopted methodology.
The DSR offers specific guidelines for evaluation and iteration in research projects. It is a method that establishes and operationalizes the research when the desired objective is an artifact or a recommendation. In addition, DSR-based research can be carried out in an academic environment and in an organizational context [59]. Thus, DSR research is a research method focused on problem solving [59]. Based on the understanding of the problem, this method can be used to build and evaluate artifacts that enable the transformation of situations, changing their conditions to better or desirable states. The artifacts that are built or evaluated by DSR research are constructions, models and methods, which can result in improvements in theories [59].
Venable et al. [60] proposed a method called research in soft design science, which encompasses concepts from the following approaches: research in design science together with some systems’ methodologies that address soft skills. This new method is suitable for conducting research to solve problems and improve conditions in organizations, especially considering the social aspects inserted in the main research activities in design science: designing, developing and evaluating. As seen in Figure 1, Venable et al. [60] distinguished between two “worlds” for conducting research based on the soft design science method: the “real world” and a more abstract world that is called “design thinking”. The “real world” comprises, for example, the construction and evaluation of the artifact that will be implemented to solve the problem. In the more abstract world of thought, activities are based on the concepts of design science due to the search for a solution and the evaluation of the proposed solution.
As shown in Figure 1, in the first stage of the proposed method, the researcher must identify and outline a specific problem. In the second step, the problem must be detailed in the form of a set of requirements. These two steps of the method take place in the real world. Design thinking occurs in the third stage, in which the researcher generalizes the specific problem into a general problem. This generalization identifies a class of problems that guide the research. Subsequently, the general requirements of the problem must be defined; that is, in the same way that a class of problems is defined, a class of solutions to the general problem must be developed. This step can be accomplished using techniques known as brainstorming; the result is a series of general requirements that will guide the researcher in the subsequent phases of the method.
4. Proposed Model
The proposed model aims to identify which indicators should be prioritized by the organization, for optimization, through a project, an action plan or a design thinking workshop, in order to provide products and services oriented to users’ needs and make the most efficient business processes. The proposed model was developed from the list of indicators identified in the literature and will use a list of indicators previously filtered and analyzed by the organization that will use the model. After the application of the model, the organization will output a new list of indicators to be optimized and prioritized in order of importance, according to the process defined in Figure 3.
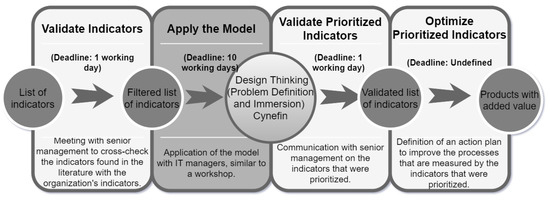
Figure 3.
Execution process of the proposed model.
Based on related works and literature review, it was decided to define the scope of the indicators that would be used in the proposed model. As shown in Figure 3, the chosen indicators were used as input for the processes that compose the model to be proposed, and the output of this process is a new list of indicators (there may be new indicators, because the model is for prioritization and definition of indicators) prioritized by the positive impacts they will cause in the delivery of the business product or service to be offered to the end user.
The proposed model for the prioritization and definition of indicators process consists of a process centered on the end user, where each phase represents the mandatory activities to be performed, always focusing on the end user. In the “validate indicators” phase, the organization is expected to be able to cross-check the list of indicators that have been identified in the literature with the list of indicators that are implemented in the organization, according to the steps below:
- Select Indicators in Literature: Activity responsible for defining a list of indicators that will be used to define the scope of the organization’s indicators that will be evaluated based on the literature review.
- Interaction with Stakeholders: not applicable.
- Select Organization Indicators: Activity responsible for carrying out a survey of all indicators defined and monitored by the organization, within the scope of work previously established.
- Interactions with Stakeholders: sending emails, requesting a list of all indicators; for each indicator, it is necessary to supply: name, origin and documentation.
- Analyze Indicators in Common: Activity responsible for crossing the indicators from the literature review with the indicators coming from the organization, selecting the indicators in common and analyzing the feasibility of using the indicator as an entry in the prioritization model and optimization of indicators to be optimized.
- Interaction with Stakeholders: not applicable.
- Validate the List of Indicators with the Management Area: After defining the list of indicators, this activity will be responsible for validating it with senior management and business managers, whose processes will be impacted with the optimization of indicators to be prioritized.
- Interaction with Stakeholders: sending emails to all stakeholders, requesting acceptance of the resulting list of indicators.
- Communicate to Stakeholders the Impossibility of Executing the Model: If any stakeholder involved does not validate the list of indicators, this activity will be responsible for communicating to the other stakeholders involved the impossibility of continuing the process of prioritizing indicators. In this case, it will be necessary to select new indicators for the organization to be used in the process of prioritizing and optimizing indicators.
- Interaction with Stakeholders: sending an email informing stakeholders that it is impossible to proceed with the execution of the model and the need to select new indicators.
The activity flow indicated to be performed in the “validate indicators” phase of the proposed model is shown in Figure 4.
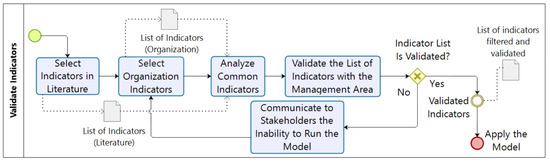
Figure 4.
Validate indicators phase.
In the “apply the model” phase, it is expected that the proposed model will be able to receive a list of indicators from the organization and will be able to produce a new list of indicators (there may be new indicators in this list), prioritized for optimization:
- Interviewing the End User: Activity responsible for conducting the interview with the customer to understand what are their main difficulties in using the organization’s product or service and understanding what their future expectations are (Figure 5).
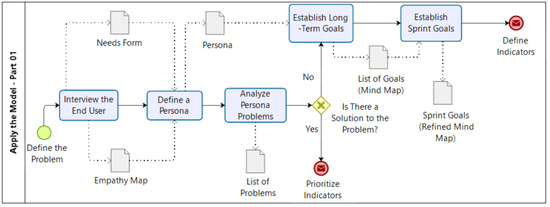 Figure 5. Apply the model–part 1.
- Interaction with Stakeholders: meeting with stakeholders.
- Define a Persona: Activity responsible for establishing and creating a profile that reflects the end user who benefits from the optimization of the prioritized indicators. It is necessary to define some information for the persona, such as (Figure 5): biography; personal data; greater challenges and frustrations; goals and objectives; responsibilities at work; day-to-day tools; your work is measured by; preferred means of communication; personality analysis (DISC–dominance, influence, stability and compliance).
- Interaction with Stakeholders: not applicable.
- Analyze Persona Problems: Based on the persona’s definitions and the interviews carried out by the end user, this activity will be responsible for analyzing the main persona problems, in which they need to be solved through the optimization of indicators (Figure 5).
- Interaction with Stakeholders: meeting to define and analyze problems.
- Establishing Long-Term Objectives: Activity responsible for establishing long-term objectives, as they direct the strategic vision of the organization’s future (Figure 5).
- Interaction with Stakeholders: meeting with stakeholders.
- Define Sprint Objectives: Activity responsible for defining what the current sprint’s objectives and deliverables will be, as the objectives direct where the end of the sprint should be reached, and the deliverables show us what should be done at the end sprint (Figure 5).
- Interaction with Stakeholders: design thinking workshop.
- Define the Indicator’s Objective: Activity responsible for clearly defining what the indicator’s objective will be. Defining the objective of the indicator is the first step in defining an indicator. It is through the objective that it is possible to clearly define the purpose of creating the indicator (Figure 6).
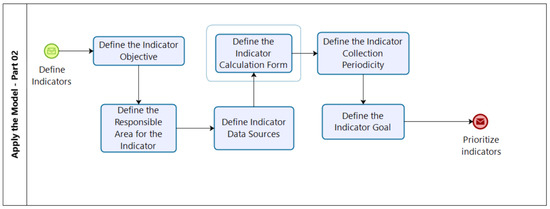 Figure 6. Apply the model–part 2.
- Interaction with Stakeholders: design thinking workshop.
- Define the Area Responsible for the Indicator: Activity responsible for defining the area responsible for managing the indicator, from its creation to its monitoring (Figure 6).
- Interaction with Stakeholders: design thinking workshop.
- Define Indicator Data Sources: Activity responsible for clearly defining which data sources will be used by the indicator. An example of a data source could be: a database, spreadsheet, extraction via ETL, etc. (Figure 6).
- Interaction with Stakeholders: design thinking workshop.
- Define the Indicator Calculation Form: Activity responsible for defining the calculation to be used to score each indicator that makes up the list of indicators (Figure 6).
- Interaction with Stakeholders: design thinking workshop.
- Define the Indicator Collection Periodicity: Activity responsible for establishing what the indicator collection periodicity will be (every hour, once a day, every 12 hours, etc.) (Figure 6).
- Interaction with Stakeholders: design thinking workshop.
- Define the Indicator’s Goal: Activity responsible for establishing the indicator’s goals, to be defined by the responsible manager. When defining goals, it is necessary to establish criteria to define what a good, medium or bad goal is (Figure 6).
- Interaction with Stakeholders: design thinking workshop.
- Classify All Indicators in Cynefin Domains: Activity responsible for classifying all indicators that make up the list of prioritized indicators according to the domains established in Cynefin (obvious, complicated, complex and chaotic) (Figure 7);
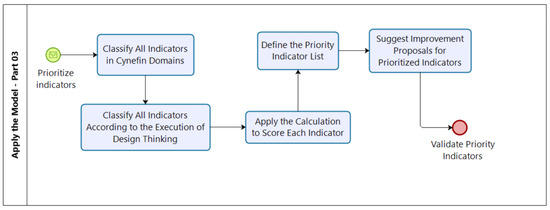 Figure 7. Apply the model–part 3.
- Interaction with Stakeholders: design thinking workshop.
- Classify All Indicators According to the Execution of Design Thinking: Activity responsible for classifying all indicators that make up the list of prioritized indicators according to the design thinking process (Figure 7);
- Interaction with Stakeholders: design thinking workshop.
- Apply the Calculation to Score each Indicator: Activity responsible for defining the calculation that will be used to score each indicator that makes up the list of indicators. The calculation to be defined should use the scoring of the indicators, both from the point of view of Cynefin and from the point of view of design thinking (Figure 7);
- Interaction with Stakeholders: not applicable.
- Define the Priority Indicators List: Activity responsible for defining a ranking of all indicators that make up the list of all prioritized indicators, based on the calculation performed in the previous activity (Figure 7);
- Interaction with Stakeholders: not applicable.
The activity flow indicated to be carried out in the “apply the model” phase of the proposed model is shown in Figure 5, Figure 6 and Figure 7.
In the “validate prioritized indicators” phase, it is expected that participants involved in the model’s execution and in top management will be able to validate the indicators that were prioritized, and if the validation does not occur successfully, it is necessary that they identify the activity that failed in the model, so that the model runs again, from the activity that failed:
- Validate the List of Indicators with Participants: Activity responsible for validating the list of indicators that were prioritized, based on the model performed, and if the list is not successfully validated, it is necessary for the participants to identify the activity that failed for the process to run again from this activity (Figure 8).
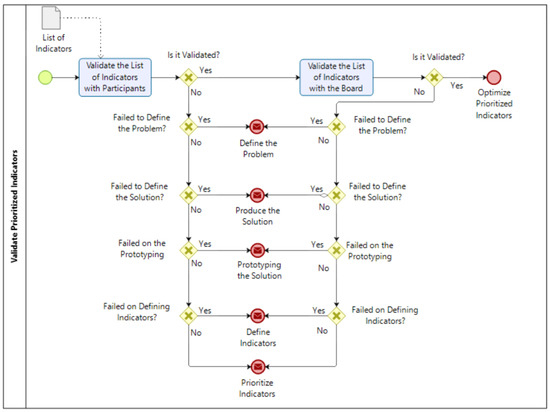 Figure 8. Validating prioritized indicators.
- Interaction with Stakeholders: at the end of the design thinking workshop.
- Validate the List of Indicators with Senior Management: Based on the model executed, this activity will be responsible for validating the list of indicators that have been prioritized. The organization’s top management will be responsible for validating the list of indicators that has been prioritized, from a strategic and business point of view. If the list is not successfully validated, it is necessary for top management to identify the activity that failed in order for the process to be executed again from this activity (Figure 8);
- Interaction with Stakeholders: validation carried out through a meeting or by email.
The activity flow indicated to be carried out in the validate prioritized indicators: phase of the proposed model is shown in Figure 8.
In the phase Optimize the Prioritized Indicators it is expected that, using the prioritized list of indicators, the organization develops an action plan, integrated with all the areas involved, with the objective of defining the scope of optimization of the indicators and all necessary actions for the optimization of the indicator:
- Identifying the weaknesses of the prioritized indicators: Activity responsible for identifying the weaknesses measured by the indicators that were prioritized. This weakness can correspond to a process, a procedure, a project, etc. (Figure 9).
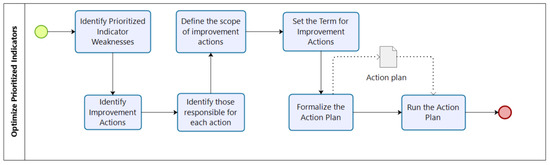 Figure 9. Optimizing the prioritized indicators.
- Interaction with Stakeholders: Meeting with everyone involved in the prioritized indicator.
- Identify Improvement Actions: Activity responsible for establishing the set of improvement actions that will solve the problems identified by the determined indicator (Figure 9).
- Interaction with Stakeholders: Design Thinking Workshop
- Define the Scope of Improvement Actions: Activity responsible for delimiting the scope of improvement actions up to the limit measured by the indicator (Figure 9).
- Interaction with Stakeholders: Design Thinking Workshop
- Identify those responsible for each action: Activity responsible for identifying who will be responsible for making each of the actions in the proposed action plan viable (Figure 9).
- Interaction with Stakeholders: Design Thinking Workshop
- Define the Period for Improvement Actions: Activity responsible for establishing the maximum period for the execution of each action plan improvement action (Figure 9).
- Interaction with Stakeholders: Design Thinking Workshop
- Formalize the Action Plan or Project: Activity responsible for formally initiating the execution of the action plan (Figure 9).
- Interaction with Stakeholders: The area responsible for improving the indicator will define the best way to interact with stakeholders.
The activity flow indicated to be carried out in the “optimize the prioritized indicators” phase of the proposed model is shown in Figure 9.
Model Assumptions and Constraints
Identifying the premises and restrictions for the model’s execution is important in order to analyze the feasibility of executing this model in a given organization and what the limitations will be in its execution, according to the characteristics of the organization whose model will be executed. It can be said that a premise is something that is assumed to be true at a given moment, because there is not enough information. As soon as we have more detailed knowledge of the premise and it is not met within the context of execution of the proposed model, the model is unable to be executed.
Constraints can be defined as internal or external limitations to the model’s execution. If the restriction is not met, its non-compliance will not prevent the model from being executed. However, its execution will be carried out with some limitations, and possibly, losses in performance, efficiency and quality [61]. Table 2 presents the list of premises and restrictions for the execution of the proposed model.
Table 2.
Assumptions and constraints of the proposed model.
5. Model Execution
5.1. Execution of the Validate Indicators Step
This step is responsible for crossing the indicators found in the literature and the indicators that are used in the organization. This step has the following steps: 1. Identify all indicators related to the object of study in question, which are found in the literature. 2. Identify all the indicators that have been defined by the organization, until this moment and that are within the competent scope of the IT area. 3. Check which indicators are found both in the literature’s list of indicators and in the organization’s list of indicators. 4. Validate the resulting list of indicators with the organization’s top management and inform stakeholders about the list of indicators that will be used in applying the proposed model.
The work started with the presentation of the proposed model and with the presentation of the survey done on the group of indicators that should be analyzed. The instrument used to establish communication with senior management was the corporate email tool. As the list of indicators became very long, it was established that the indicators to be prioritized would follow the following criteria: 1. Organization indicators must be based on the literature. 2. Organization indicators must each have a goal. 3. Organization indicators should have values below the targets.
5.2. Execution of the Apply Model Step
The execution of the apply the model step begins with the analysis of the selected indicators, by defining the scopes of the problems related to each of the indicators listed in the list in question. In a second step, having all the problems identified and categorized in a matrix of certainty, assumptions and doubts (CSD), the problems are categorized in the Cynefin framework.
After analyzing the indicators, from the perspective of Cynefin and evaluating the structure of the organization, in which the case study was performed, it was decided to use some techniques in the execution of design thinking [62,63]. The techniques were chosen according to the work developed by Tonkinwise [64], Penzenstadler et al. [65], Feher and Varga [66], Neubauer et al. [67] and Parizi et al. [68]:
- Empathy Map: The empathy map is a tool used to map the user’s perception of the product or service to be offered. The purpose of this tool is to try to put itself in the end user’s shoes and identify how he interacts with the product or service he is consuming [67]. This tool was used to guide participants regarding the definition and classification of problems in the CSD matrix.
- CSD Matrix (Assumptions, Assumptions and Doubts): The CSD matrix is a tool used in the beginning of the execution of the design thinking process, which works from three issues: What is known about the needs of the end user? What are the hypotheses or what are you supposed to know? What are the doubts and what questions could be asked? With the CSD Matrix, you define what exactly you should focus and concentrate your efforts on to propose a solution to a given problem [68].
In order to verify which domain of each indicator in question is more related, it was decided to use the analysis defined by Shalbafan et al. [20] in conjunction with Gray’s approach [69]. The approaches try to verify the relationship between the processes and projects with the domains defined in Cynefin. This approach was used in this study object, making the same parallel with the indicators to be analyzed.
We used a questionnaire to guide senior management on which Cynefin domain in a given problem should be categorized. The objective was not to apply the questionnaire to each problem identified in each of the indicators that were defined. The questionnaire was used in the problems in which it was not possible to find a consensus among the members of the top management about its categorization within Cynefin. The items covered in the questionnaire were:
Obvious
- The problem measures a totally restricted, predictable and repetitive behavior;
- Validation checklists help the problem to be solved;
- The indicator below the target identifies problems that are easily overcome;
- The relations of cause and effect are very clear and are always repeated;
- The solutions are easy and simple to pass on.
Complicated
- The problem measures well-known, orderly and predictable practices, but needs a specialist to solve the problem;
- The restrictions are evident and applicable;
- The cause and effect relationships are evident, but the solution is open to analysis;
- Solution analysis involves an unrestricted set of processes;
- The solutions are not easy and simple to be passed on.
Complex
- The problem measures a system that partially restricts the behavior, despite the behavior modifying the restrictions;
- Cause and effect relationships are variable. The effects are not always repeated;
- Indicator below the target obliges senior management to provide real-time feedback;
- The analysis of the solution is usually modularized;
- If the problem is contained, it is good for innovation.
Chaotic
- The problem measures a random and unrestricted behavior that is difficult to create or sustain;
- There is no cause and effect relationship between the problem identified;
- Indicator below the target generates crisis if it is not optimized quickly;
- If the problem is contained, it is good for the organization’s operational resilience;
- It is not easy to reproduce the problem and the relationship between the system and the agents is impossible.
The top management of the organization in the case study chose to give more emphasis to the indicators whose problems would be concentrated in the Cynefin domains, in the following order: Obvious, Complicated, Complex and Chaotic. Thus, the scores defined for problems occurred in the following order: Obvious: 4 points; Complicated: 3 points; Complex: 2 points; Chaotic: 1 points. The calculation used to measure the degree of relevance of each indicator is defined by:
The indicator score is the sum of k problems, from problem 1 to problem n. After the completion of phase 2 of the proposed model, the classification of the indicators was defined, as shown in Table 3.
Table 3.
Ranking of indicators.
5.3. Execution of the Validate Prioritized Indicators Step
This step is responsible for carrying out the validation of the indicators that were prioritized in the previous stages. Its execution must be carried out according to the following steps:
- Communicate to all stakeholders about the completion of the previous steps and the need to validate the list of indicators that have been prioritized.
- Validate the list of indicators prioritized by all stakeholders. If any interested party disagrees with the result, it is necessary to understand the reasons for which the disagreements occurred, and if applicable, review the model in question and perform the previous steps again.
- Formalize for senior management the list of prioritized indicators, as the optimization of these indicators is part of the organization’s strategic planning.
The end of phase 3 is evidenced by the approval of all members of senior management. The approval instrument used in this case study was the corporate email tool. After receiving by email the approval of all members of the top management, phase 3 was formally concluded.
5.4. Execution of the Optimize the Prioritized Indicators Step
This step is responsible for optimizing the indicators that were prioritized in the previous steps. The optimization can happen through a project or an action plan to improve one or more processes. However, before structuring the approach to optimize the indicators, it will be necessary to run a design thinking workshop, to better define the scope of the problem from the perspective of the end user. The objective now is to identify which are the main problems identified in the process in which the prioritized indicator performs the measurement and to propose solutions to improve the process in question.
5.4.1. Design Thinking Workshop
A design thinking workshop is the format used to perform all the steps that make up the design thinking process [70]. In this approach, we aim to achieve the results of each stage through collaborative activities among workshop participants, with the direct involvement of the end user of the product or service to be proposed [71]. In summary, a design thinking workshop can be defined, according to: 1. Situation: There is no clear understanding of the problem to be addressed, and consequently, of the solution to be used to solve the problem. It is necessary to identify the scope of the problem and propose a solution. 2. Execution: Application of a design thinking workshop with business managers and technical managers responsible for optimizing the prioritized indicator. 3. Result: A proposal for improving the indicator to be prioritized, to be structured in terms of a project or action plan.
After analyzing the indicators, from the perspective of Cynefin and evaluating the structure of the organization whose case study will be applied, it was decided to use some techniques in the execution of design thinking. The techniques were chosen according to the work developed by Tonkinwise [64], Penzenstadler et al. [65], Feher and Varga [66], Neubauer et al. [67] and Souza and Mendonça [68]:
- Personas Analysis: a persona is a fictional user designed to represent the typical user, literally speaking to them during the design process. The objective of the method is to develop solutions that go beyond the needs of these individuals. However, a persona is precisely a profile that represents most of the personality and characteristics of the end user of the solution to be proposed [64].
- Blueprint: It is a tool used to map the interactions between the user and the service provider, helping to standardize these interactions and find the points of failure of this interaction, in order to create more attractive value propositions for the end user [65].
- User Journey Map: It is a graphical representation of the user’s relationship steps with a product or service, which describes the steps taken before, during and after use [66].
5.4.2. Project
A project is a temporary effort undertaken to propose improvements to a product, service or exclusive result [72]. In addition to the need for making an exclusive delivery, it is important to evaluate the value generated by the IT project. Thus, some organizations, in different contexts, manage the value of their IT projects along with what challenges are encountered in these processes. In summary, a project can be defined according to:
- Situation: The most proper solution when the organization already has more detailed knowledge of the problem to be addressed and the problem needs a more elaborated and planned solution (long term) [73].
- Execution: Develop a project plan, consisting of: definition of scope, schedule, communication plan, risk management and budget.
- Result: Improvement in the object measured by the optimized indicator.
5.4.3. Action plan
An IT action plan is a sequence of activities that must be completed for a strategy to be successful. In general, they consist of three elements: specific tasks (what will be done and by whom), timelines (when these activities will be done and in what time) and those responsible for each activity [74]. To define an action plan, it is necessary to receive a set of information, such as qualitative characteristics of the environment or knowledge bases that contain actions from previous administrations. An effective action plan is reached when productivity is improved in terms of achieving the expected results [75]. In summary, an action plan can be defined, according to:
- Situation: The most proper solution when the organization already has more detailed knowledge of the problem to be addressed and the problem does not need a more elaborated and/or planned solution. Simpler planning addresses the problem resolution (short and medium term).
- Execution: Definition of a set of actions necessary to optimize the indicator, along with the deadline and the person responsible for executing each action.
- Result: Improvement in the object measured by the optimized indicator.
5.5. Execution of the Proposed Model
The proposed model was applied in the technology area of a financial institution created in 1964, in the form of a mixed capital company, whose largest shareholder is the Government of the Federal District—GDF—Brazil. Company A’s role is to act as an intermediary between the users and some financial market services, for investments, loans and financing, among other services. Among the main activities of the financial institution is the fundraising through demand deposits, such as current accounts, and also through time deposits, such as the supply of bank products that presupposes the delivery of funds to a credit institution, which is obliged to repay these funds at the end of an agreed period of time and to pay a fee. In the case of time deposits, securities are issued, such as bank deposit certificates (CDBs) and mortgage bonds (LCIs).
The financial institution’s technology area is responsible for implementing IT strategies; the management of production activities; the infrastructure, support, development, maintenance and acquisition of computerized systems; structuring and construction of IT solutions;the control, monitoring and definition of IT indicators; and planning management through IT processes. Currently, the IT area of this institution has about 154 indicators. Each indicator measures a process or procedure which is the responsibility of a specific department. Currently, the indicators are classified as follows:
- Systems and Solutions Development
- Context: Area responsible for activities related to: development, measurement by function points, tests and management of external systems.
- Quantity of Indicators: 57.
- IT infrastructure
- Context: Area responsible for activities related to: configuration, change, deployment, database, connectivity, service desk and network.
- Quantity of Indicators: 60.
- IT Governance
- Context: Area responsible for activities related to: IT planning, IT internal controls, IT process management, IT contract planning, data administration, IT architecture and IT service level agreement management.
- Quantity of Indicators: 37.
The results of executing the step validate indicators are shown below. Following the criteria defined in the proposed model, the following results were found for Company A:- Total Indicators: 154
- Goal Indicators: 99
- Indicators Below the Goal: 26
The results of the execution of the step validate prioritized indicators are shown in Figure 10. The ranking was validated by the higher levels that represented the top management in the execution of the case study (director, systems superintendent, infrastructure superintendent and IT governance superintendent).
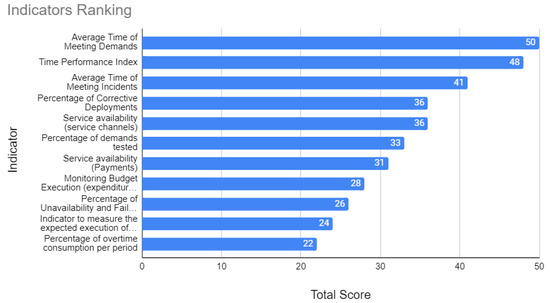
Figure 10.
Ranking of indicators that were prioritized for optimization by the board.
The best ranked indicator to be optimized was “average time to respond to demands.” Therefore, the fourth stage, in this first moment, was performed in order to optimize the indicator in question. The design thinking workshop was carried out as planned. Figure 11 presents the filled empathy map to identify the clients’ feelings and actions in relation to the object measured by the indicator. In this case, the indicator “average time to respond to demands” measures the demand management process and has a tool that supports the execution of the process. The clients in question are the business managers who need to open demands for the IT areas of the financial institution.
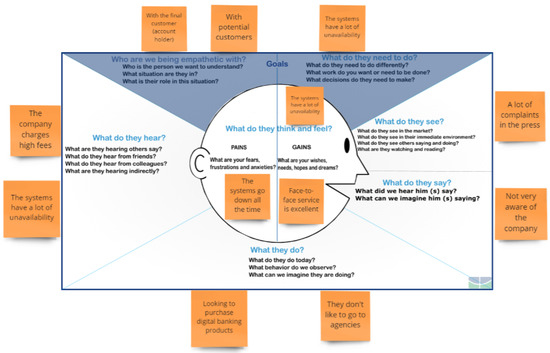
Figure 11.
Empathy map filled–Company A.
5.6. Results and Discussion
With the execution of the proposed model, an analysis of the evidence collected was carried out, alongside an analysis of the responses of all stakeholders who participated in the execution of the model. Results were found for the research problem defined in the work, and for the most part, the specific objectives that were defined were later achieved. When defining the research problem, it was said that, “It is necessary to define a model that influences and encourages those responsible for business processes to express their problems, so that it is possible to clearly understand which indicators have the greatest impacts on business processes”. The second stage of the model concerns the definition and immersion in the problem, where the top management was able to express its problems in a context related to two distinct artifacts: the CSD matrix and the Cynefin model.
It was also mentioned that, “It is necessary to use tools, such as design thinking [14], design sprint [17] and the Cynefin framework [20], which are able to capture business needs and identify the indicators considered to have the greatest impacts on the execution of services”. It was found that, in fact, these tools were able to capture business needs and establish a ranking of indicators to be optimized, based on experience and feedback from interested parties. Regarding the use of the tools in question, in the proposed model, it was decided to use the first phases of design thinking, related to the definition of the problem and immersion, in the second stage of the model; and the last phases of design thinking, related to ideation and experimentation, in the fourth stage of the model. Regarding Cynefin, it was also used in the second stage of the model to support the prioritization of the indicators to be optimized. Regarding design sprint, it was used to define a process structure to be executed in the fourth stage of the model: the stages of execution of the design thinking workshops, the deadlines, the groups of indicators that would be included in each optimization cycle, etc.
Regarding the specific objectives defined above, it is clear that most of them were successfully achieved. In order to assess the perceptions of stakeholders regarding the level of knowledge that each had of the topics related to the proposed model, a survey was conducted with a questionnaire that contained 10 questions: 4 questions related to design thinking, 4 questions related to design sprint and 2 questions related to Cynefin. Most questions had five alternative answers, according to the Likert scale: I totally disagree, I disagree, neutral, I totally agree and I agree. The research focus was restricted to participants only.
The research involved the application of a questionnaire based on bibliographic studies. As the concepts of design thinking, design sprint and Cynefin are relatively new and still have little presence in academic content, it was believed that this method would allow an advance on the understanding of the concept. In total, around 20 employees of the organization, whose case study was carried out, were invited to answer the questionnaire, with most of the employees being managers who made up senior management and analysts who participated in the execution of step 4 of the proposed model. Among the 20 invited employees, 15 responded to the questionnaire. In questions relating to the perceptions of the approaches used, 14 questions were written (Table 4) to try to identify the participants’ perceptions regarding the use of the chosen approaches to compose the model.
Table 4.
Perception questionnaire of the approaches that were used.
Regarding the questions related to design thinking, around 55.25% answered that they agreed and 38.5% answered that they did not agree or disagreed with the statements. The answers to this question demonstrate that the organization’s stakeholders were updating themselves in relation to the topic addressed, because despite being a new topic in the information technology knowledge area, more than half of the employees answered that they already knew the concepts related to design thinking methodology.
Regarding the questions related to Cynefin, 48.25% answered that they agreed with the issues addressed and 45% answered that they did not agree or disagreed with the concepts related to Cynefin. The answers to this question demonstrate that a good portion of the collaborators understood conceptual aspects related to Cynefin. However, more than a half of the collaborators demonstrated that they did not know the framework, which had a negative influence on the application of the model, mainly in step 2.
Regarding the questions related to the design sprint, 36.5% answered that they agreed with the aforementioned statements and 53.5% answered that they neither agreed nor disagreed. The answers to this question demonstrate that, although the collaborators know conceptual aspects related to design thinking, they did not have knowledge related to design sprint, showing that the organization did not have much experience related to the execution of the design thinking stages through a structured process.
Regarding the questions related to the proposed model, 47% answered that the model, in fact, contributed to the prioritization and optimization of the organization’s indicators, and 8.5% answered that there was no clear contribution regarding the application of the model to improve the corporate indicators. The answers to this question demonstrated that according to most managers who represented top management and employees who represented the workers of the organization, the model, in fact, contributed to supporting senior management in decision making in relation to the indicators.
Some questions addressed in the questionnaire were related to conceptual aspects, and others to the experience of the system being in action, from the personal point of view of each employee who answered the questionnaire. Table 5 presents the results of the application of the aforementioned questions. Regarding design thinking, 67% said they knew the concept, and 20% said they already had some practical experience in using design thinking. Regarding Cynefin, 33% said they knew the concept, and 7% said they already had some practical experience in using Cynefin. Regarding design sprint, 40% said they know the concept, and 13% said they already had some practical experience in using design sprint.
Table 5.
General perceptions questionnaire.
Regarding design thinking, this result demonstrates that, although employees have practical knowledge related to the approach, its use is not reflected in the activities performed in the organization, given that more than a quarter of respondents answered that they had no practical experience with relation to design thinking, which can influence the application of the proposed model.
Regarding to Cynefin, these results show that the approach is something new for the organization’s employees. Thus, for the application of the proposed model to be carried out more effectively, it will be necessary at first to train the organization’s employees in conceptual aspects of the approach to later apply these concepts in the organization itself.
Regarding design sprint, these results show that employees have some knowledge related to the concepts of the approach, which was expected, because design sprint is very similar to design thinking. However, there is not much practical experience in its use. What really differentiates design thinking from design sprint is the form of execution. Therefore, it is important that employees obtain experience in executing this approach so that step 4 of the proposed model is performed more efficiently.
6. Threats to Validity
In this work, the results of a study related to the proposal of a model to define, prioritize and optimize indicators were detailed, in order to support top management in decision making. This type of research presents some threats for generalizing (external validity) the results to other contexts. For example, it was fine-tuned for a case study in an organization with a specific performance profile, in the banking sector,. Thus, we cannot generalize the results found to other possible configurations, considering that the case study carried out fails to reflect all sectors and types of organizations that use indicators to support decision making. However, it is important to note that the case study was carried out with the participation of several employees from different areas related to information technology in the organization, such as areas related to infrastructure, service operation, systems development, IT architecture, IT governance and general IT, among others. Therefore, it is believed that our findings are relevant to academia and industry.
Regarding the validity of specific objectives, in the analysis of the fourth specific objective (Table 6) of our research, it was difficult to verify the effectiveness of the model based on the proposed comparison, considering that it is necessary to wait a minimum period of time until more data are generated and the comparison can be carried out successfully.
Table 6.
Results found by specific objectives.
Regarding the fifth specific objective (Table 6), there was a need to establish a more adequate study to define the variables that must be taken into account to perform this simulation. The initial idea was to perform a simple arrangement without repetition (Equation (2)) to check all possible combinations of ranking the indicators, and for each possible combination, perform the calculation of the degree of relevance related to the optimization of the indicators in the proposed order (Ex: ROI of each group of indicators calculated for each arrangement). However, there was a certain difficulty in creating the calculation that defines the degree of relevance related to the optimization of the indicators in the proposed order. Another problem is related to the number of indicators that make up the ranking. The higher the ranking, the greater the number of possible combinations to be performed in the simple arrangement without repetition (Equation (2)), which makes the comparison more complex than initially imagined.
Regarding the questions that made up the questionnaire, we believed that the practitioners who would have more experience with the approaches used in the proposed model would be practitioners in areas related to IT management and governance, who make up the top management of the organization. However, the areas that stood out most in the research were the areas of software development and production. The reason for this divergence is not yet clear. One possibility could be related to the small sample used in the research, which may not reflect the reality of the organization. Another option is that the questions used in the questionnaire were not well designed, leading to a wrong conclusion.
7. Conclusions
The literature review made it possible to find scientific and/or technical publications on the subject addressed, which together with the exploratory case study, provided a very useful research tool, since there have been scientific studies that were carried out within the same field of study. A work was developed with the aim of proposing an innovative contribution, through a case study. Thus, in this work, several articles related to the use of design thinking, Cynefin and design sprint were identified. Among them, works focusing on the management of indicators, the main area of interest of this research, were studied. The indicators found in the literature for measuring processes should allow criteria to be defined to verify which indicators should be prioritized for optimization, from the perspective of what is most necessary for the end user. The optimization of indicators requires several fronts and a comprehensive team in the process, in order to establish an appropriate action plan and adhere to the institution’s strategic planning. By not establishing a model that prioritizes the indicators to be optimized, there is a risk of optimizing an indicator that will not generate the expected positive impact, while consuming a large amount of resources.
This work presented a scientific contribution related to the management of indicators, through the identification of mechanisms to promote the choice of the best indicators to be optimized; verification of the ways to include the end user in the process of prioritizing indicators to be optimized; surveying the best practices adopted for the process of prioritizing and optimizing indicators and synthesizing the models adopted in the processes of prioritizing and optimizing indicators. The model of prioritization and definition of indicators oriented toward the needs of the user proposed in this work can assist organizations in reaching their goals related to process improvements—making them run more efficiently while providing end users with the conditions they require, thereby achieving greater satisfaction on the part of those involved in the process as a whole.
As future work, we intend to expand the scope of the model’s performance, evaluating business indicators in tandem with IT indicators. We also intend to conduct a case study to evaluate the model in an organization focused on providing quality products and services to the end user. From this, the model could be complemented with the identification of roles responsible for carrying out certain activities of the prioritization process and by defining indicators. We also intend to provide a quantitative validation of the indicators that were prioritized. Defining validation on a quantitative bias will allow the model’s results to be validated in an objective way, reducing the degree of subjectivity in the model validation and allowing people with different points of view to carry out the evaluation. Adaptations can be made to meet unmentioned situations during the creation of the model, and the impact assessment of its application can be performed.
A survey to carry out a predictive analysis of the indicators that may be prioritized in terms of their optimization is foreseen among the list of future works. Together with the predictive analysis, we intend to develop a system that will support the management of the indicators. This system will support the process of prioritizing and defining indicators, through the automation of some activities provided in the process, including treatment of the datasets of the indicators (generating reports), and a dashboard to support decision making and provisioning of templates of all documents that will be necessary for the execution of the model.
Author Contributions
Conceptualization, F.V.A. and E.D.C.; methodology, F.V.A., E.D.C. and L.J.G.V.; validation, F.V.A., E.D.C., R.d.O.A., F.E.G.d.D. and A.L.S.O.; investigation, F.V.A.; E.D.C., F.E.G.d.D., R.d.O.A., A.L.S.O. and L.J.G.V.; resources, F.V.A., E.D.C. and R.d.O.A.; data curation, F.V.A., E.D.C., R.d.O.A., F.E.G.d.D. and L.J.G.V. writing—original draft, F.V.A., E.D.C., R.d.O.A., A.L.S.O. and L.J.G.V.; writing—review and editing, E.D.C., R.d.O.A., A.L.S.O. and L.J.G.V.; visualization, F.V.A., E.D.C., R.d.O.A. and A.L.S.O.; supervision, E.D.C., R.d.O.A. and L.J.G.V. All authors have read and agreed to the published version of the manuscript.
Funding
This research work was supported by HEROES project. This project has received funding from the European Union’s Horizon 2020 research and innovation program under grant agreement number 101021801.
Acknowledgments
R.d.O.A. gratefully acknowledges the General Attorney of the Union - AGU grant 697.935/2019; the General Attorney’s Office for the National Treasure - PGFN grant 23106.148934/ 2019-67; the support from EC Horizon 2020 HEROES project grant 101021801 and the support of ABIN grant 08/2019.
Conflicts of Interest
The authors declare no conflict of interest.
References
- Turner, R. How Does Governance Influence Decision Making on Projects and in Project-Based Organizations? Proj. Manag. J. 2020, 51, 670–684. [Google Scholar] [CrossRef]
- Chatterjee, S.; Ghosh, S.K.; Chaudhuri, R. Knowledge management in improving business process: An interpretative framework for successful implementation of AI-CRM-KM system in organizations. Bus. Process. Manag. J. 2020, 26, 1261–1281. [Google Scholar] [CrossRef]
- Jeong, J.; Kim, N. Does sentiment help requirement engineering: Exploring sentiments in user comments to discover informative comments. Autom. Softw. Eng. 2021, 28, 18. [Google Scholar] [CrossRef]
- Ferrari, A.; Esuli, A. An NLP approach for cross-domain ambiguity detection in requirements engineering. Autom. Softw. Eng. 2019, 26, 559–598. [Google Scholar] [CrossRef]
- Kamalrudin, M.; Hosking, J.G.; Grundy, J. MaramaAIC: Tool support for consistency management and validation of requirements. Autom. Softw. Eng. 2017, 24, 1–45. [Google Scholar] [CrossRef]
- Sommerville, I.; Fowler, M.; Beck, K.; Brant, J.; Opdyke, W.; Roberts, D. Edition: Software Engineering. Instructor. 2019. Available online: http://www.cse.yorku.ca/~zmjiang/teaching/eecs4314/EECS4314_CourseOutline.pdf (accessed on 5 February 2022).
- Wanner, J.; Hofmann, A.; Fischer, M.; Imgrund, F.; Janiesch, C.; Geyer-Klingeberg, J. Process Selection in RPA Projects—Towards a Quantifiable Method of Decision Making; ICIS—Association for Information Systems: Munich, Germany, 15–18 December 2019. [Google Scholar]
- Kucukaltan, B.; Irani, Z.; Aktas, E. A decision support model for identification and prioritization of key performance indicators in the logistics industry. Comput. Hum. Behav. 2016, 65, 346–358. [Google Scholar] [CrossRef] [Green Version]
- Thomas Lockwood, E.P. Innovation by Design: How Any Organization Can Leverage Design Thinking to Produce Change, Drive New Ideas, and Deliver Meaningful Solutions; Career Press: Wayne, NJ, USA, 2017; pp. 1–224. [Google Scholar]
- Lucassen, G.; Dalpiaz, F.; van der Werf, J.M.E.M.; Brinkkemper, S. Improving agile requirements: The Quality User Story framework and tool. Requir. Eng. 2016, 21, 383–403. [Google Scholar] [CrossRef] [Green Version]
- Ciriello, R.F.; Richter, A.; Schwabe, G. When Prototyping Meets Storytelling: Practices and Malpractices in Innovating Software Firms. In Proceedings of the 2017 IEEE/ACM 39th International Conference on Software Engineering: Software Engineering in Practice Track (ICSE-SEIP), Buenos Aires, Argentina, 20–28 May 2017; Volume 37, pp. 163–172. [Google Scholar]
- Kirlangiç, G.; Obaid, M.; Yantaç, A.E. Storytelling before or after Prototyping with a Toolkit for Designing Classroom Robots; OZCHI; ACM: Sydney, NSW, Australia, 2020; pp. 582–593. [Google Scholar]
- Hotomski, S. Supporting Requirements and Acceptance Tests Alignment during Software Evolution. Ph.D. Thesis, University of Zurich, Zurich, Switzerland, 2019. [Google Scholar]
- Mayer, S.; Haskamp, T.; de Paula, D. Measuring what Counts: An Exploratory Study about the Key Challenges of Measuring Design Thinking Activities in Digital Innovation Units. In Proceedings of the HICSS 54th Hawaii International Conference on System Sciences, Kauai, HI, USA, 5 January 2021; pp. 1–10. [Google Scholar]
- Almeida, F.V.; Canedo, E.D.; da Costa, R.P. Definition of Indicators in the Execution of Educational Projects with Design Thinking Using the Systematic Literature Review. In Proceedings of the IEEE Frontiers in Education Conference—FIE, Covington, KY, USA, 16–19 October 2019; IEEE: Cincinnati, OH, USA, 2019; pp. 1–9. [Google Scholar]
- Souza, A.F.; Ferreira, B.; Valentim, N.M.C.; Correa, L.; Marczak, S.; Conte, T. Supporting the teaching of design thinking techniques for requirements elicitation through a recommendation tool. IET Softw. 2020, 14, 693–701. [Google Scholar] [CrossRef]
- Ferreira, V.G.; Canedo, E.D. Using design sprint as a facilitator in active learning for students in the requirements engineering course: An experience report. In Proceedings of the 34th ACM/SIGAPP Symposium on Applied Computing, Limassol, Cyprus, 8–12 April 2019; pp. 1852–1859. [Google Scholar]
- Henreaux, E.; Noutcha, M.; Phan-Ngoc, T.; Kieffer, S. Design Sprints Integrating Agile and Design Thinking: A Case Study in the Automotive Industry. In AHFE (12); Springer: New York, NY, USA, 2021; Volume 270, pp. 189–195. [Google Scholar]
- Ferreira, V.G.; Canedo, E.D. Design sprint in classroom: Exploring new active learning tools for project-based learning approach. J. Ambient Intell. Humaniz. Comput. 2020, 11, 1191–1212. [Google Scholar] [CrossRef]
- Shalbafan, S.; Leigh, E.; Pollack, J.; Sankaran, S. Decision-making in project portfolio management: Using the Cynefin framework to understand the impact of complexity. In Proceedings of the International Research Network on Organizing by Projects, Boston, MA, USA, 11–14 June 2018. [Google Scholar]
- Fierro, D.; Putino, S.; Tirone, L. The Cynefin Framework Furthermore, The Technical Leadership: How To Handle The Complexity. In CIISE; CEUR-WS.org: Naples, Italy, 2017; Volume 2010, pp. 72–81. [Google Scholar]
- Sirisawat, P.; Hasachoo, N.; Kaewket, T. Investigation and Prioritization of Performance Indicators for Inventory Management in the University Hospital. In Proceedings of the 2019 IEEE International Conference on Industrial Engineering and Engineering Management (IEEM), Macao, China, 15–18 December 2019; pp. 691–695. [Google Scholar]
- Lemai Nguyen, G.S. A Framework for Understanding Creativity in Requirements Engineering. J. Inf. Softw. Technol. 2009, 51, 655–662. [Google Scholar] [CrossRef]
- Hickey, A.M.; Davis, A.M. A Unified Model of Requirements Elicitation. J. Manag. Inf. Syst. 2015, 20, 65–84. [Google Scholar]
- Inayat, I.; Salim, S.S.; Marczak, S.; Daneva, M.; Shamshirband, S. A systematic literature review on agile requirements engineering practices and challenges. Comput. Hum. Behav. 2015, 51, 915–929. [Google Scholar] [CrossRef]
- Robinson, W.; Vlas, R. Requirements evolution and project success: An analysis of SourceForge projects. In Proceedings of the 21st Americas Conference on Information Systems (AMCIS), Puerto Rico, 13–15 August 2015; pp. 1–12. Available online: https://aisel.aisnet.org/cgi/viewcontent.cgi?article=1383&context=amcis2015 (accessed on 5 February 2022).
- Vlas, R.; Robinson, W. Extending and Applying a Rule-Based Natural Language Toolkit for Open Source Requirements Discovery and Classification. In Proceedings of the Open Source Systems (OSS’11), Salvador, Brazil, 6–7 October 2011. [Google Scholar]
- Vlas, R.; Robinson, W. A pattern-based method for requirements discovery and classification in open-source software development projects. J. Manag. Inf. Syst. (JMIS) 2012, 28, 11–38. [Google Scholar] [CrossRef] [Green Version]
- Vlas, R.; Robinson, W.N. Applying a Rule-Based Natural Language Classifier to Open Source Requirements: A Demonstration of Theory Exploration. In Proceedings of the 2013 46th Hawaii International Conference on System Sciences, Wailea, HI, USA, 7–10 January 2013; pp. 3158–3167. [Google Scholar]
- Sánchez, M.A. Integrating sustainability issues into project management. J. Clean. Prod. 2015, 96, 319–330. [Google Scholar] [CrossRef]
- Chopra, M.; Gupta, V. Linking knowledge management practices to organizational performance using the balanced scorecard approach. Kybernetes 2020, 49, 88–115. [Google Scholar] [CrossRef]
- Vad, T.; Stec, K.; Larsen, L.B.; Nellemann, L.J.; Czapla, J.J. Development of a framework for UX KPIs in Industry—A case study: ABSTRACT. In Proceedings of the OzCHI ’20: 32nd Australian Conference on Human-Computer-Interaction, Sydney, NSW, Australia, 2–4 December 2020; pp. 141–147. [Google Scholar]
- Kaplan, R.S.; Norton, D.P. The Balanced Scorecard: Measures that Drive Performance; Harvard Business Review; Harvard University: Boston, MA, USA, 1992. [Google Scholar]
- Vandaele, N.J.; Decouttere, C.J. Sustainable R&D portfolio assessment. Decis. Support Syst. 2013, 54, 1521–1532. [Google Scholar]
- Egilmez, G.; Kucukvar, M.; Tatari, O. Sustainability assessment of US manufacturing sectors: An economic input output-based frontier approach. J. Clean. Prod. 2013, 53, 91–102. [Google Scholar] [CrossRef]
- Rai, A.K.; Agrawal, S.; Khaliq, M. Identification of agile software risk indicators and evaluation of agile software development project risk occurrence probability. In Proceedings of the 7th International Conference on Engineering Technology, Science and Management Innovation (ICETSMI-2017), Delhi, India, 11 June 2017; pp. 489–494. [Google Scholar]
- Agrawal, R.; Singh, D.; Sharma, A. Prioritizing and optimizing risk factors in agile software development. In Proceedings of the 2016 Ninth International Conference on Contemporary Computing (IC3), Noida, India, 11–13 August 2016; pp. 1–7. [Google Scholar]
- Marzagão, D.S.L.; Carvalho, M.M. Critical success factors for Six Sigma projects. Int. J. Proj. Manag. 2016, 34, 1505–1518. [Google Scholar] [CrossRef]
- Chow, T.; Cao, D.B. A survey study of critical success factors in agile software projects. J. Syst. Softw. 2008, 81, 961–971. [Google Scholar] [CrossRef]
- Mahnic, V.; Zabkar, N. Using COBIT indicators for measuring scrum-based software development. Wseas Trans. Comput. 2008, 7, 1605–1617. [Google Scholar]
- Kremljak, Z.; Kafol, C. Types of risk in a system engineering environment and software tools for risk analysis. Procedia Eng. 2014, 69, 177–183. [Google Scholar] [CrossRef] [Green Version]
- Juhnke, K.; Tichy, M.; Houdek, F. Quality Indicators for Automotive Test Case Specifications. In Proceedings of the Workshops of the German Software Engineering Conference 2018 (SE 2018), Ulm, Germany, 6 March 2018; pp. 96–100. [Google Scholar]
- Lima, D.S.; Cerdeiral, C.T.; Santos, G. Indicadores de Medição de Testes em um Contexto ágil Usando o Template ASM.br. In Proceedings of the XXI Iberoamerican Conference on Software Engineering, Bogota, Colombia, 23–27 April 2018; Genero, M., Kalinowski, M., Molina, J.G., Pino, F., Conte, T., Marín, B., Brito, I., Giachetti, G., Eds.; Curran Associates: New York, NY, USA, 2018; pp. 395–408. [Google Scholar]
- Paredes-Gualtor, J.; Moscoso-Zea, O.; Luján-Mora, S. The role of enterprise architecture as a management tool. In Proceedings of the 2018 International Conference on Information Systems and Computer Science (INCISCOS), Quito, Ecuador, 13–15 November 2018; pp. 306–311. [Google Scholar]
- Granulo, A.; Tanovic, A. The advantage of using SWOT analysis for companies with implemented ITIL framework processes. In Proceedings of the 2020 43rd International Convention on Information, Communication and Electronic Technology (MIPRO), Opatija, Croatia, 28 September–2 October 2020; pp. 1656–1661. [Google Scholar]
- Moeller, R.R. Executive’s Guide to IT Governance: Improving Systems Processes with Service Management, COBIT, and ITIL; John Wiley & Sons: Hoboken, NJ, USA, 2013; Volume 637. [Google Scholar]
- Kusumasari, T.F.; Fauzi, R. Design Guidelines and Process of Metadata Management Based on Data Management Body of Knowledge. In Proceedings of the 2021 7th International Conference on Information Management (ICIM), London, UK, 27–29 March 2021; pp. 87–91. [Google Scholar]
- Rose, K.H. A Guide to the Project Management Body of Knowledge (PMBOK® Guide)—Fifth Edition. Proj. Manag. J. 2013, 44, e1. [Google Scholar] [CrossRef]
- Mateo, J.R.S.C.; Diaz, E.; Carral, L.; Fraguela, J.A.; Iglesias, G. Complexity and Project Management: Challenges, Opportunities, and Future Research. Complexity 2019, 2019, 6979721:1–6979721:2. [Google Scholar]
- Kozak, M.; Beaman, J. Relationship between customer satisfaction and loyalty. Tour. Anal. 2006, 11, 397–409. [Google Scholar] [CrossRef]
- Alemanni, M.; Alessia, G.; Tornincasa, S.; Vezzetti, E. Key performance indicators for PLM benefits evaluation: The Alcatel Alenia Space case study. Comput. Ind. 2008, 59, 833–841. [Google Scholar] [CrossRef] [Green Version]
- Jetter, J.; Eimecke, J.; Rese, A. Augmented reality tools for industrial applications: What are potential key performance indicators and who benefits? Comput. Hum. Behav. 2018, 87, 18–33. [Google Scholar] [CrossRef]
- Niemann, L.; Hoppe, T.; Coenen, F. On the benefits of using process indicators in local sustainability monitoring: Lessons from a Dutch municipal ranking (1999–2014). Environ. Policy Gov. 2017, 27, 28–44. [Google Scholar] [CrossRef] [Green Version]
- De Almeida Filgueiras, A.; de Souza Barros, L.P.; Gomes, J.S. O processo de implantação do Balanced Scorecard em uma empresa estatal brasileira: O caso Petrobras. REGE Rev. Gestão 2010, 17, 45–57. [Google Scholar]
- Wieringa, R.J. Design Science Methodology for Information Systems and Software Engineering; Springer: Berlin, Germany, 2014; Volume 1, pp. 1–337. [Google Scholar]
- Dalpiaz, F.; Gieske, P.; Sturm, A. On deriving conceptual models from user requirements: An empirical study. Inf. Softw. Technol. 2021, 131, 106484. [Google Scholar] [CrossRef]
- Sjøberg, D.I.; Dybå, T.; Anda, B.C.; Hannay, J.E. Building theories in software engineering. In Guide to Advanced Empirical Software Engineering; Springer: Berlin, Germany, 2008; pp. 312–336. [Google Scholar] [CrossRef]
- Yin, R.K. Case Study Research and Applications: Design and Methods; Sage Publications: Thousand Oaks, CA, USA, 2017; pp. 1–352. ISBN 150633615. [Google Scholar]
- Siponen, M.T.; Soliman, W.; Holtkamp, P. Research Perspectives: Reconsidering the Role of Research Method Guidelines for Interpretive, Mixed Methods, and Design Science Research. J. Assoc. Inf. Syst. 2021, 22, 1. [Google Scholar]
- Venable, J.R.; Pries-Heje, J.; Baskerville, R. Choosing a Design Science Research Methodology. In Proceedings of the 28th Australasian Conference on Information SystemsIEEE/ACIS International Conference on Computer and Information Science, University of Tasmania, Hobart, Australia, 24–26 May 2017; pp. 67–102. [Google Scholar]
- Adenso-Díaz, B.; Lozano, S.; Gutiérrez, E.; Calzada, L.; Garcia, S. Assessing individual performance based on the efficiency of projects. Comput. Ind. Eng. 2017, 107, 280–288. [Google Scholar] [CrossRef]
- Martins, H.F.; de Oliveira Junior, A.C.; Canedo, E.D.; Kosloski, R.A.D.; Paldês, R.Á.; Oliveira, E.C. Design Thinking: Challenges for Software Requirements Elicitation. Information 2019, 10, 371. [Google Scholar] [CrossRef] [Green Version]
- Castiblanco Jimenez, I.A.; Mauro, S.; Napoli, D.; Marcolin, F.; Vezzetti, E.; Rojas Torres, M.C.; Specchia, S.; Moos, S. Design Thinking as a Framework for the Design of a Sustainable Waste Sterilization System: The Case of Piedmont Region, Italy. Electronics 2021, 10, 2665. [Google Scholar] [CrossRef]
- Tonkinwise, C. A taste for practices: Unrepressing style in design thinking. Des. Stud. 2011, 32, 533–545. [Google Scholar] [CrossRef]
- Penzenstadler, B.; Betz, S.; Venters, C.C.; Chitchyan, R.; Porras, J.; Seyff, N.; Duboc, L.; Becker, C. Blueprint and Evaluation Instruments for a Course on Software Engineering for Sustainability. arXiv 2018, arXiv:1802.02517. [Google Scholar]
- Fehér, P.; Varga, K. The Value of Customer Journey Mapping and Analysis in Design Thinking Projects. In International Conference on Business Process Management; Springer: Berlin, Germany, 2019; pp. 333–336. [Google Scholar]
- Neubauer, D.; Paepcke-Hjeltness, V.; Evans, P.; Barnhart, B.; Finseth, T. Experiencing Technology Enabled Empathy Mapping. Des. J. 2017, 20, S4683–S4689. [Google Scholar] [CrossRef]
- Parizi, R.; da Silva, M.M.; Couto, I.; Trindade, K.; Plautz, M.; Marczak, S.; Conte, T.; Candello, H. Design Thinking in Software Requirements: What Techniques to Use? A Proposal for a Recommendation Tool. In Proceedings of the XXIII Iberoamerican Conference on Software Engineering, CIbSE, Curitiba, Brazil, 9–13 November 2020; pp. 320–333. [Google Scholar]
- Gray, B. The Cynefin framework: Applying an understanding of complexity to medicine. J. Prim. Health Care 2017, 9, 258–261. [Google Scholar] [CrossRef]
- Vogel, J.; Schuir, J.; Koßmann, C.; Thomas, O.; Teuteberg, F.; Hamborg, K. Let us do Design Thinking Virtually: Design and Evaluation of a Virtual Reality Application for Collaborative Prototyping. In Proceedings of the 28th European Conference on Information Systems—Liberty, Equality, and Fraternity in a Digitizing World, ECIS, Marrakech, Morocco, 15–17 June 2021. [Google Scholar]
- Thoring, K.; Müller, R.M. Understanding design thinking: A process model based on method engineering. In Proceedings of the DS 69: E&PDE 2011, the 13th International Conference on Engineering and Product Design Education, London, UK, 8–9 September 2011; pp. 493–498. [Google Scholar]
- Bayona, S.; Bustamante, J.; Saboya, N. PMBOK as a Reference Model for Academic Research Management. In Proceedings of the WorldCIST’18, Naples, Italy, 27–29 March 2018; Springer: Cham, Switzerland, 2018; pp. 863–876. [Google Scholar] [CrossRef]
- Martinsuo, M.; Klakegg, O.J.; van Marrewijk, A. Delivering value in projects and project-based business. Int. J. Proj. Manag. 2019, 37, 631–635. [Google Scholar] [CrossRef]
- Rivoir, A.; Landinelli, J. ICT-mediated Citizen Engagement—Case Study: Open Government National Action Plan in Uruguay. In Proceedings of the 10th International Conference on Theory and Practice of Electronic Governance, ICEGOV, New Delhi, India, 7–9 March 2017; pp. 214–217. [Google Scholar]
- Ribeiro, R.; Casanova, D.; Teixeira, M.; Wirth, A.L.; Gomes, H.M.; Borges, A.P.; Enembreck, F. Generating action plans for poultry management using artificial neural networks. Comput. Electron. Agric. 2019, 161, 131–140. [Google Scholar] [CrossRef]


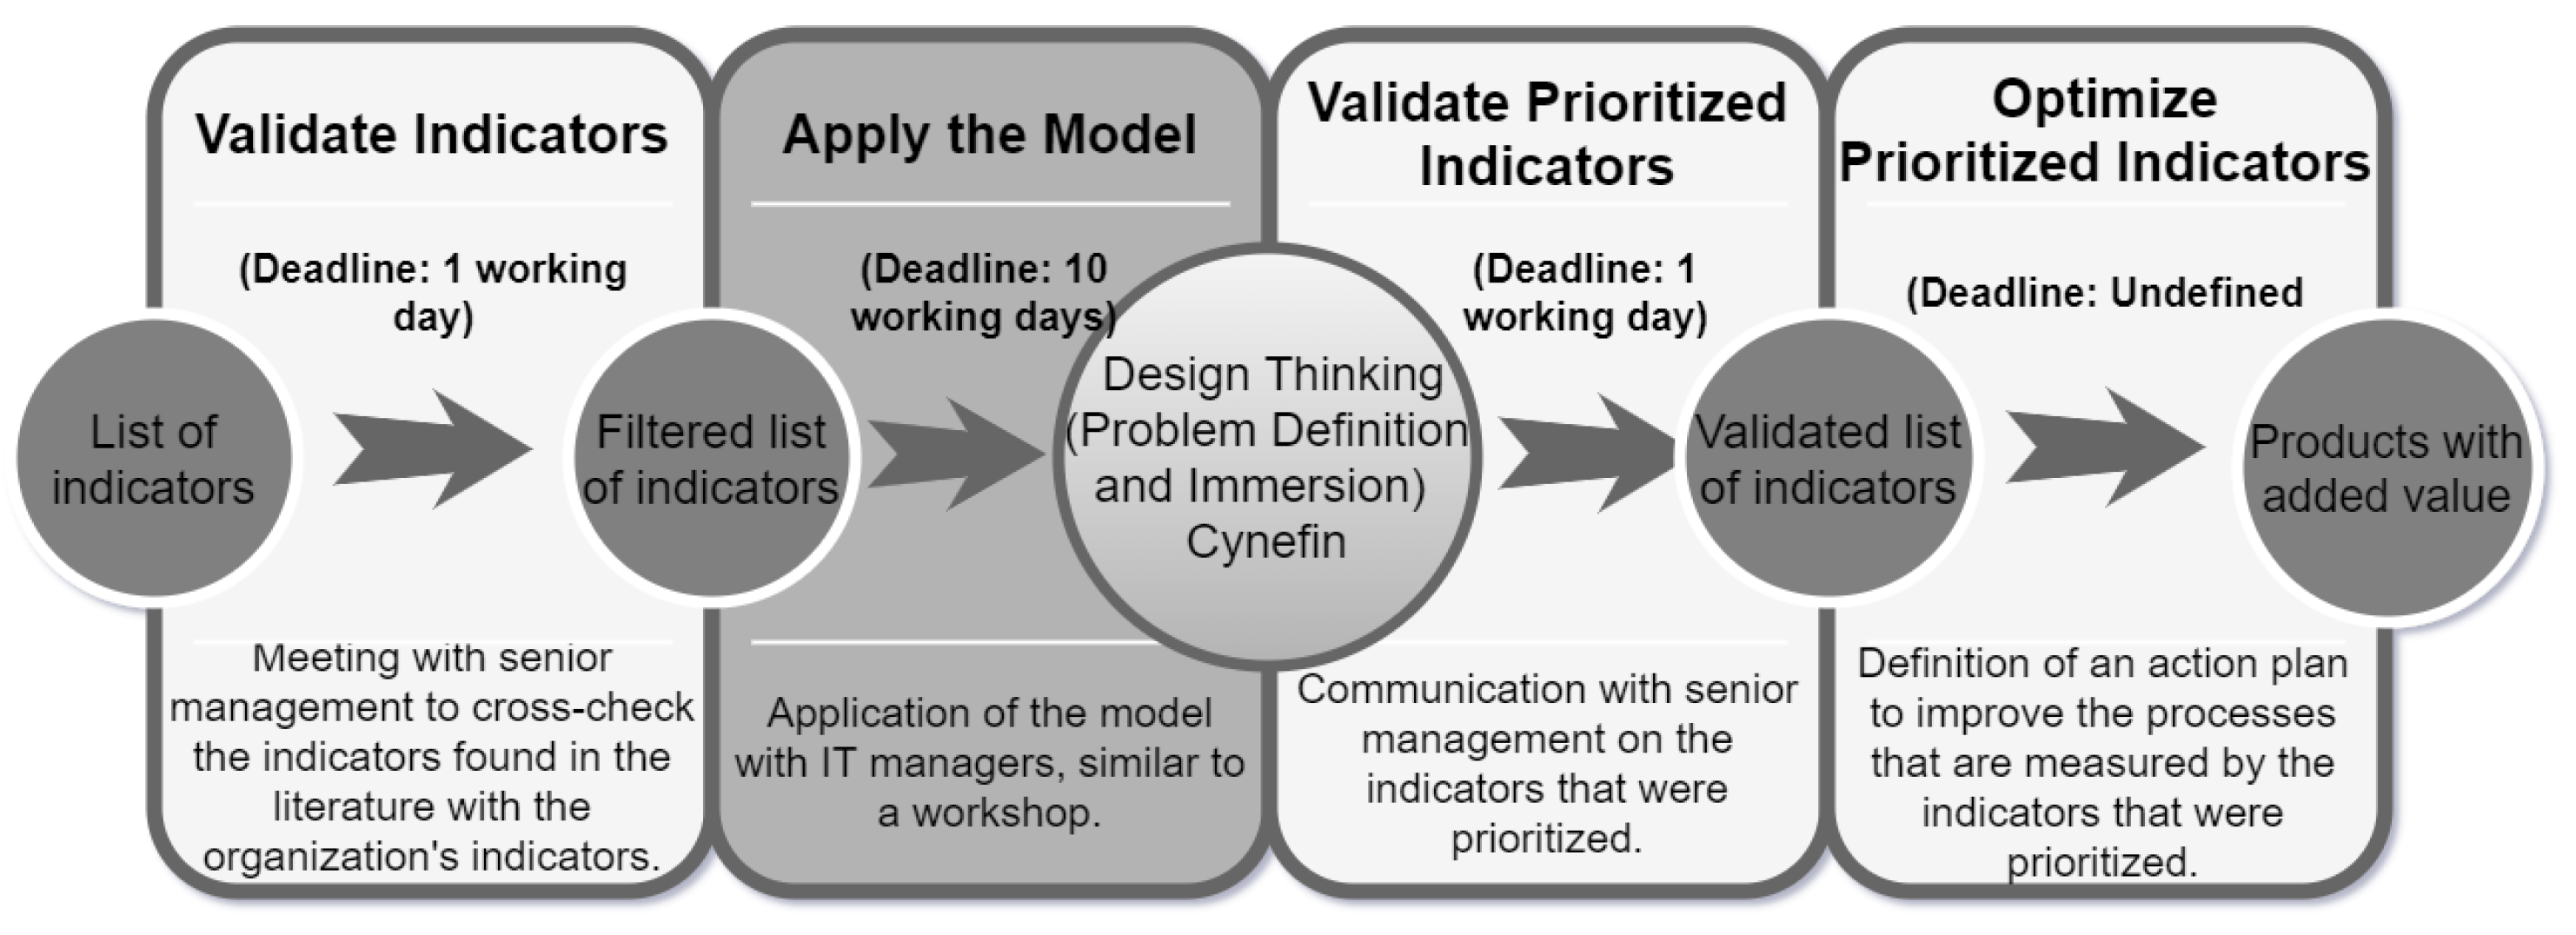
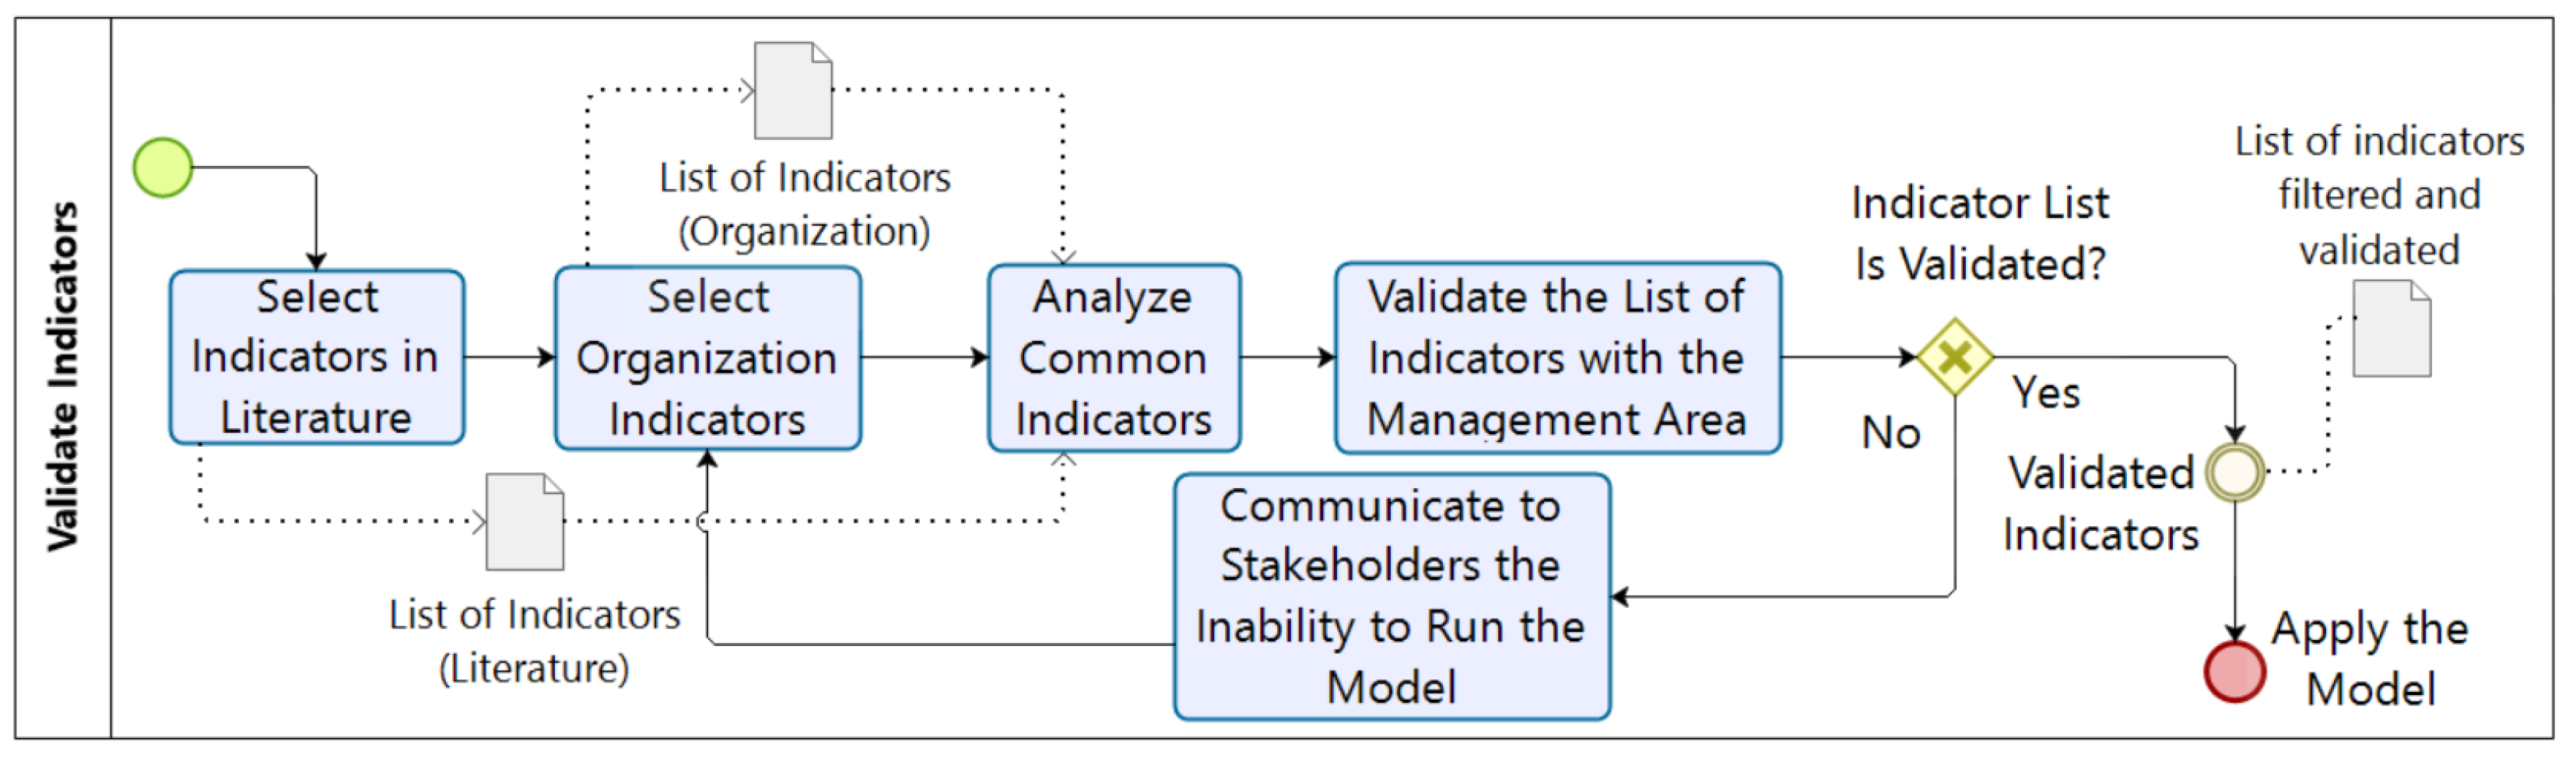
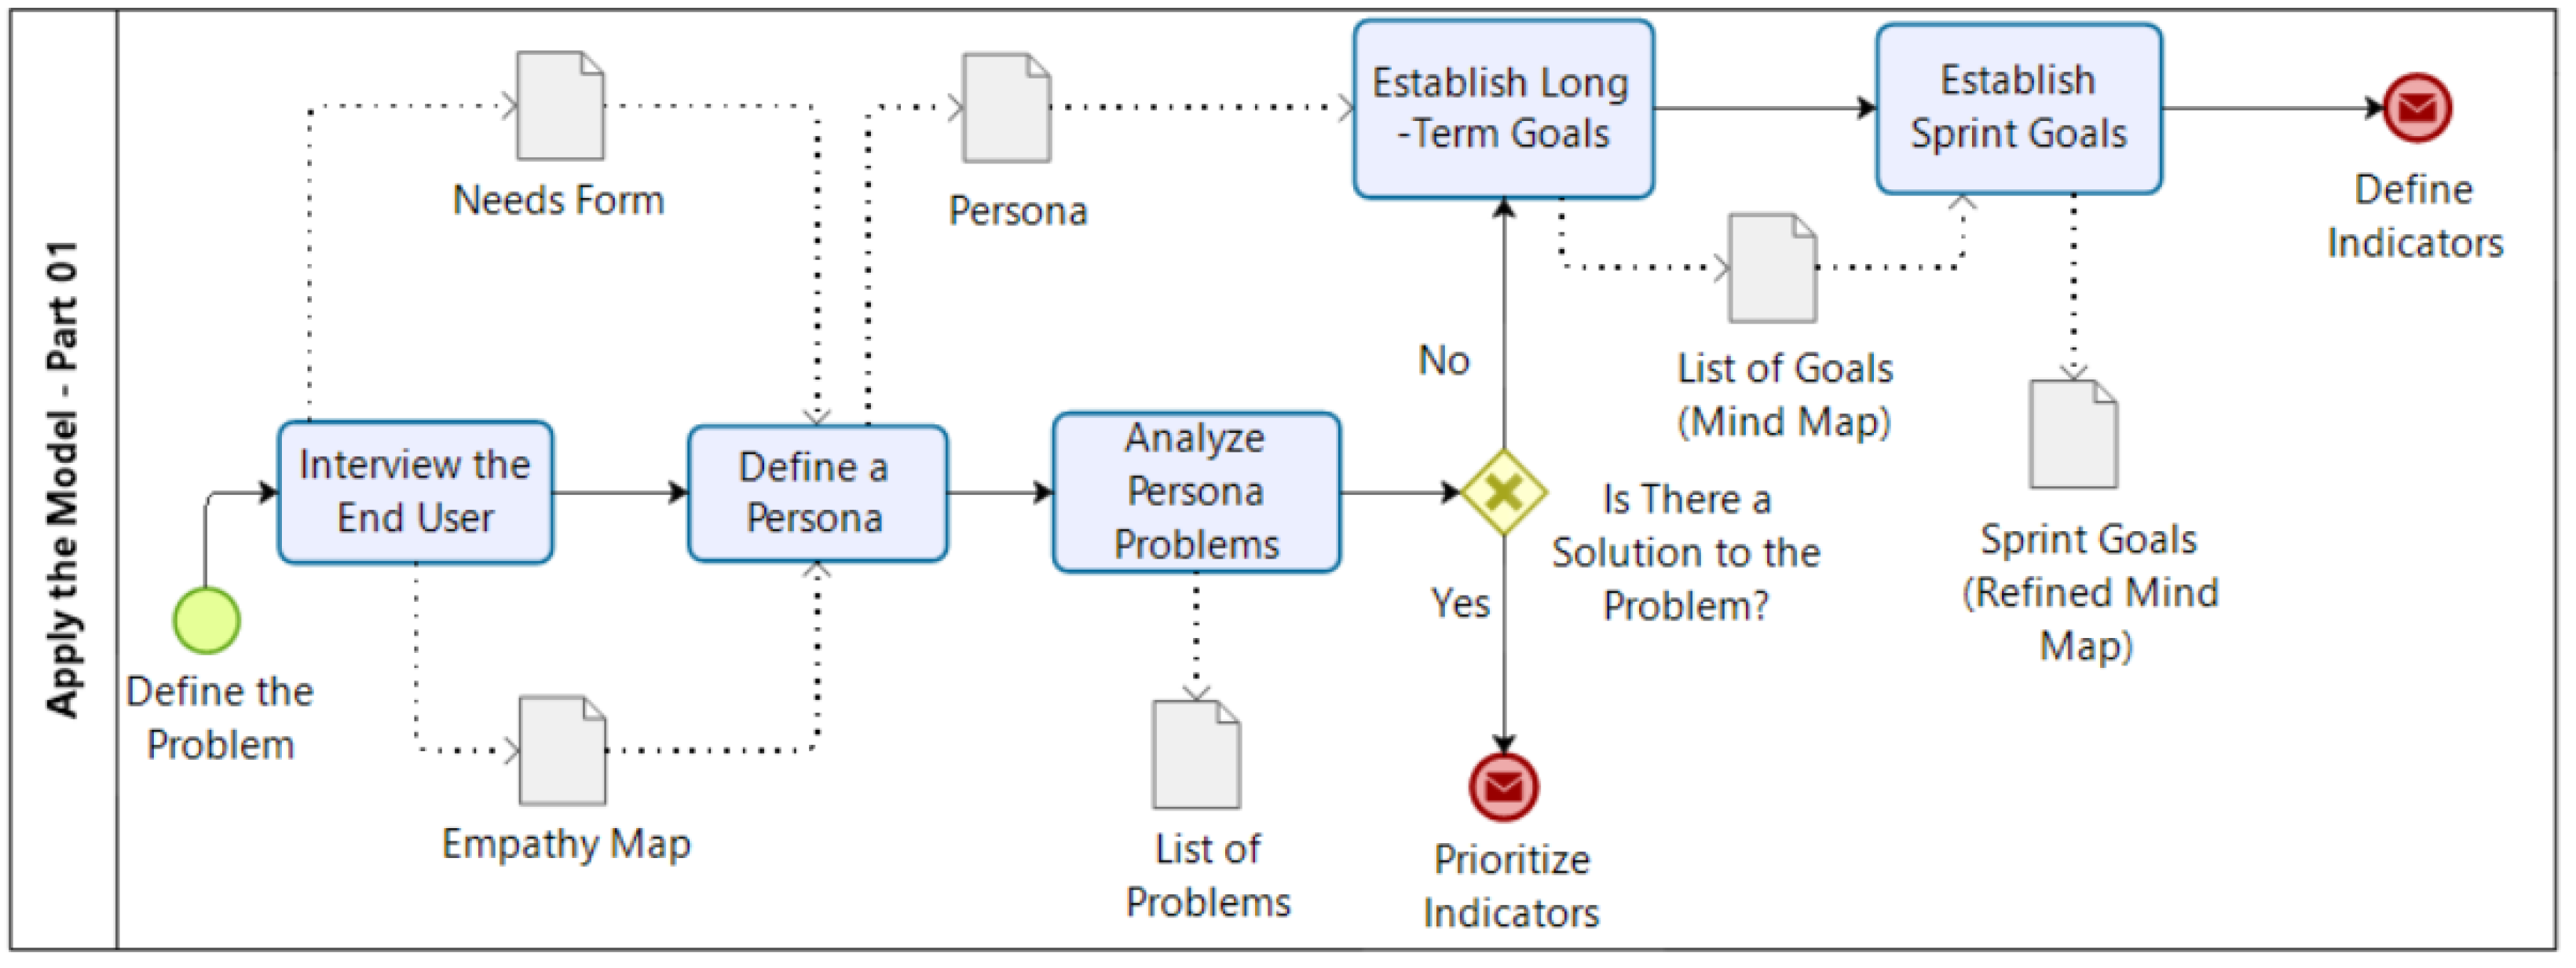
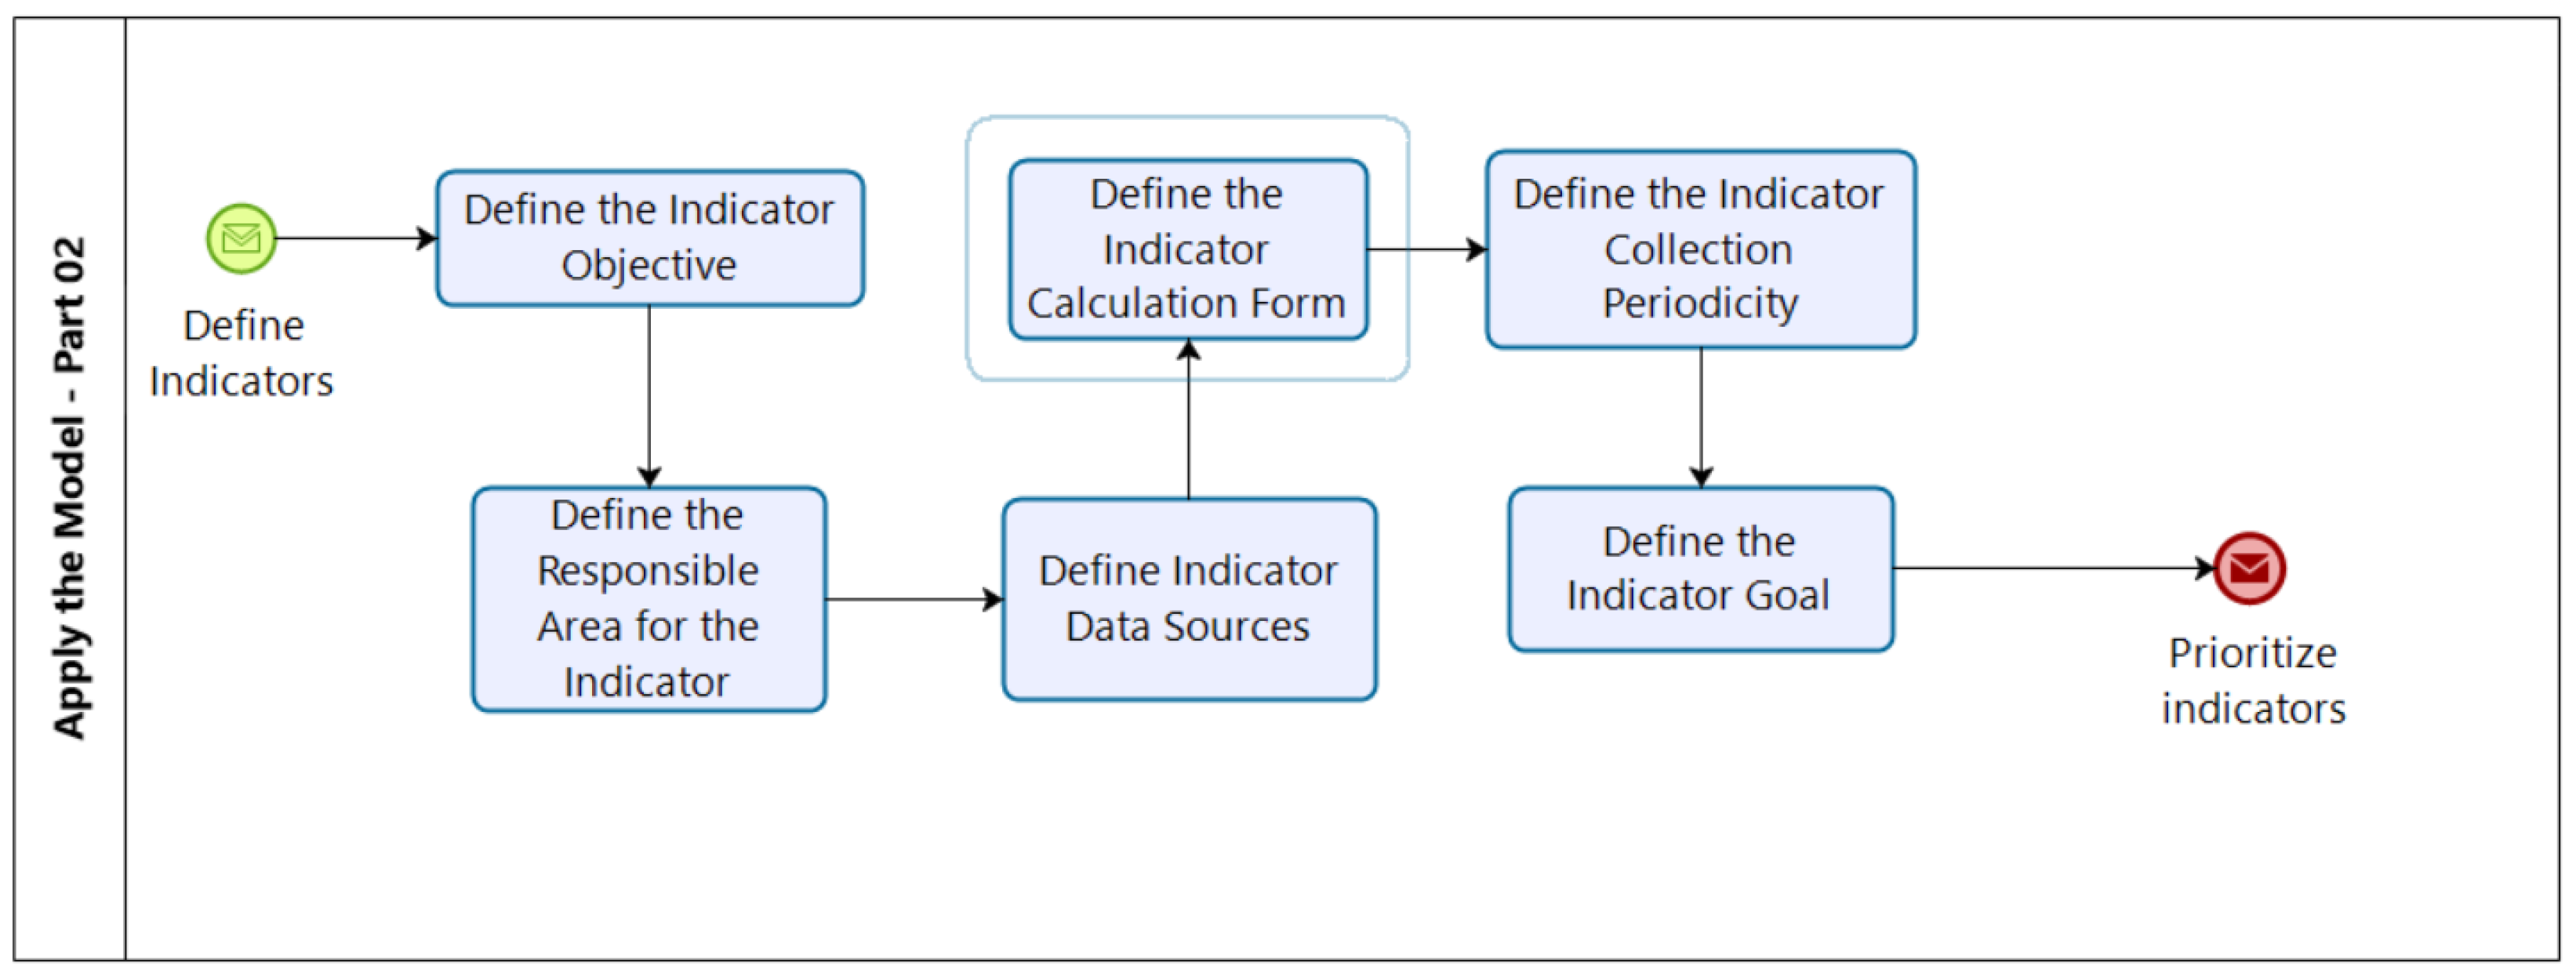

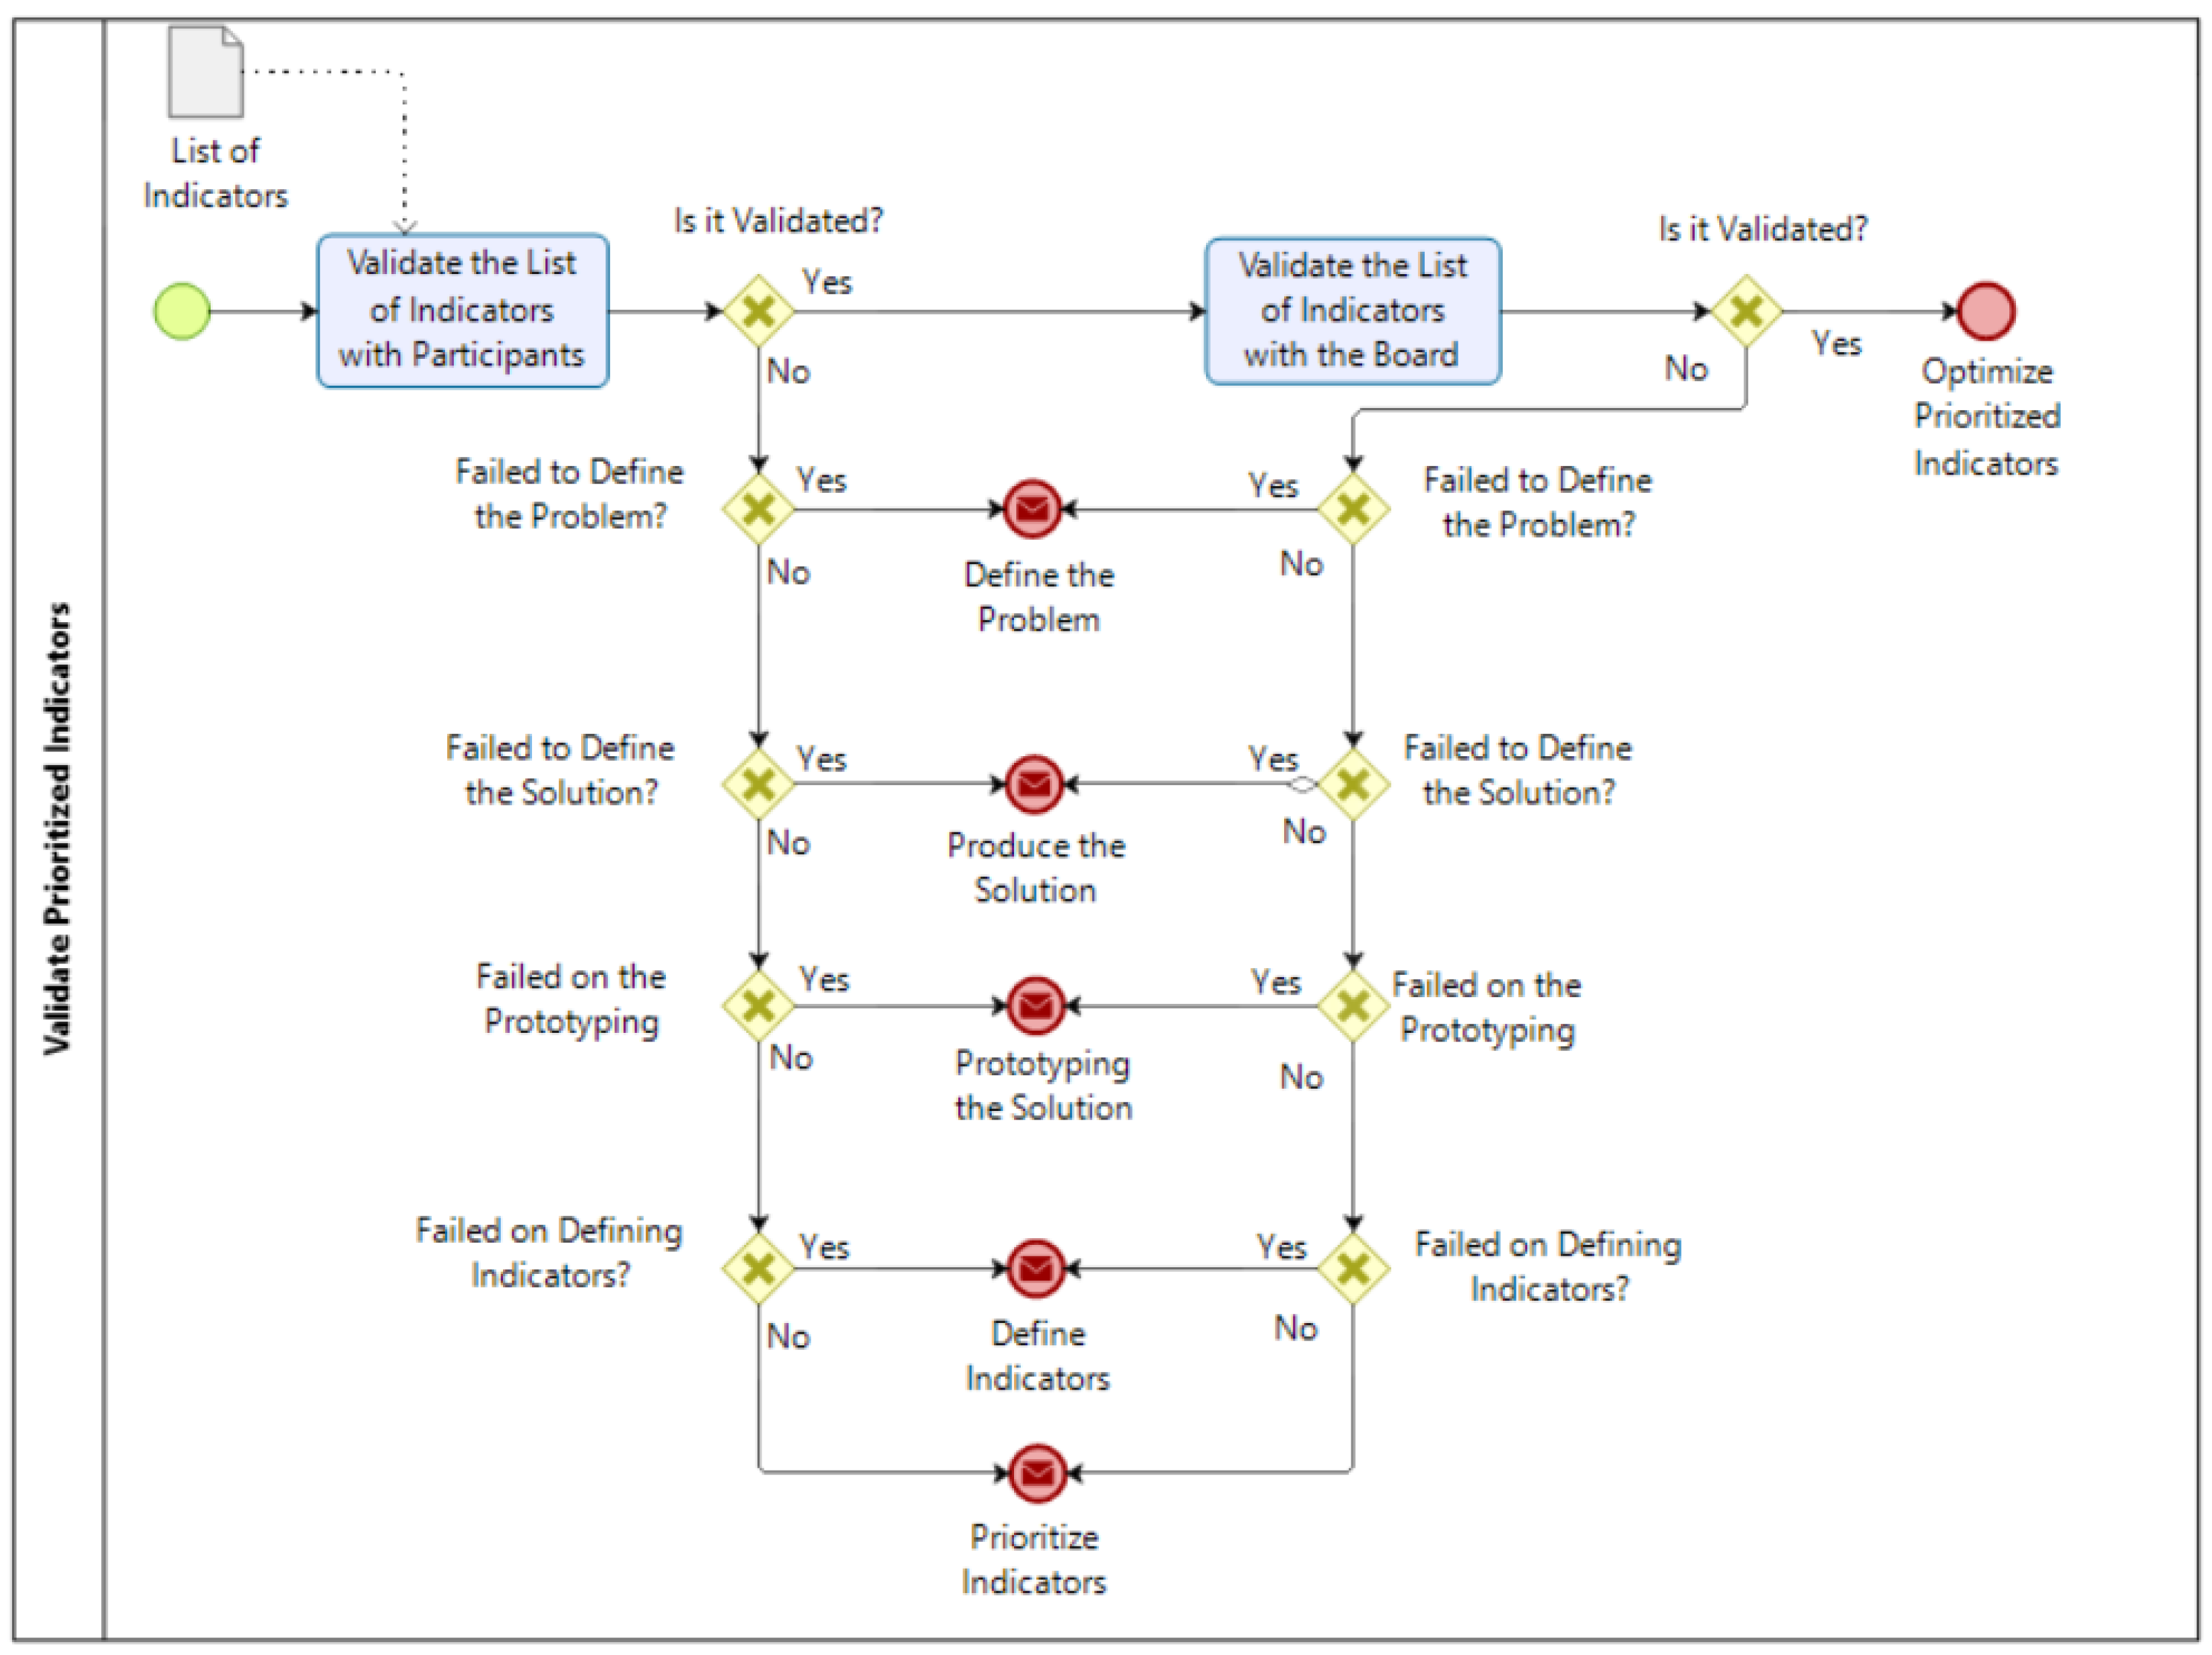

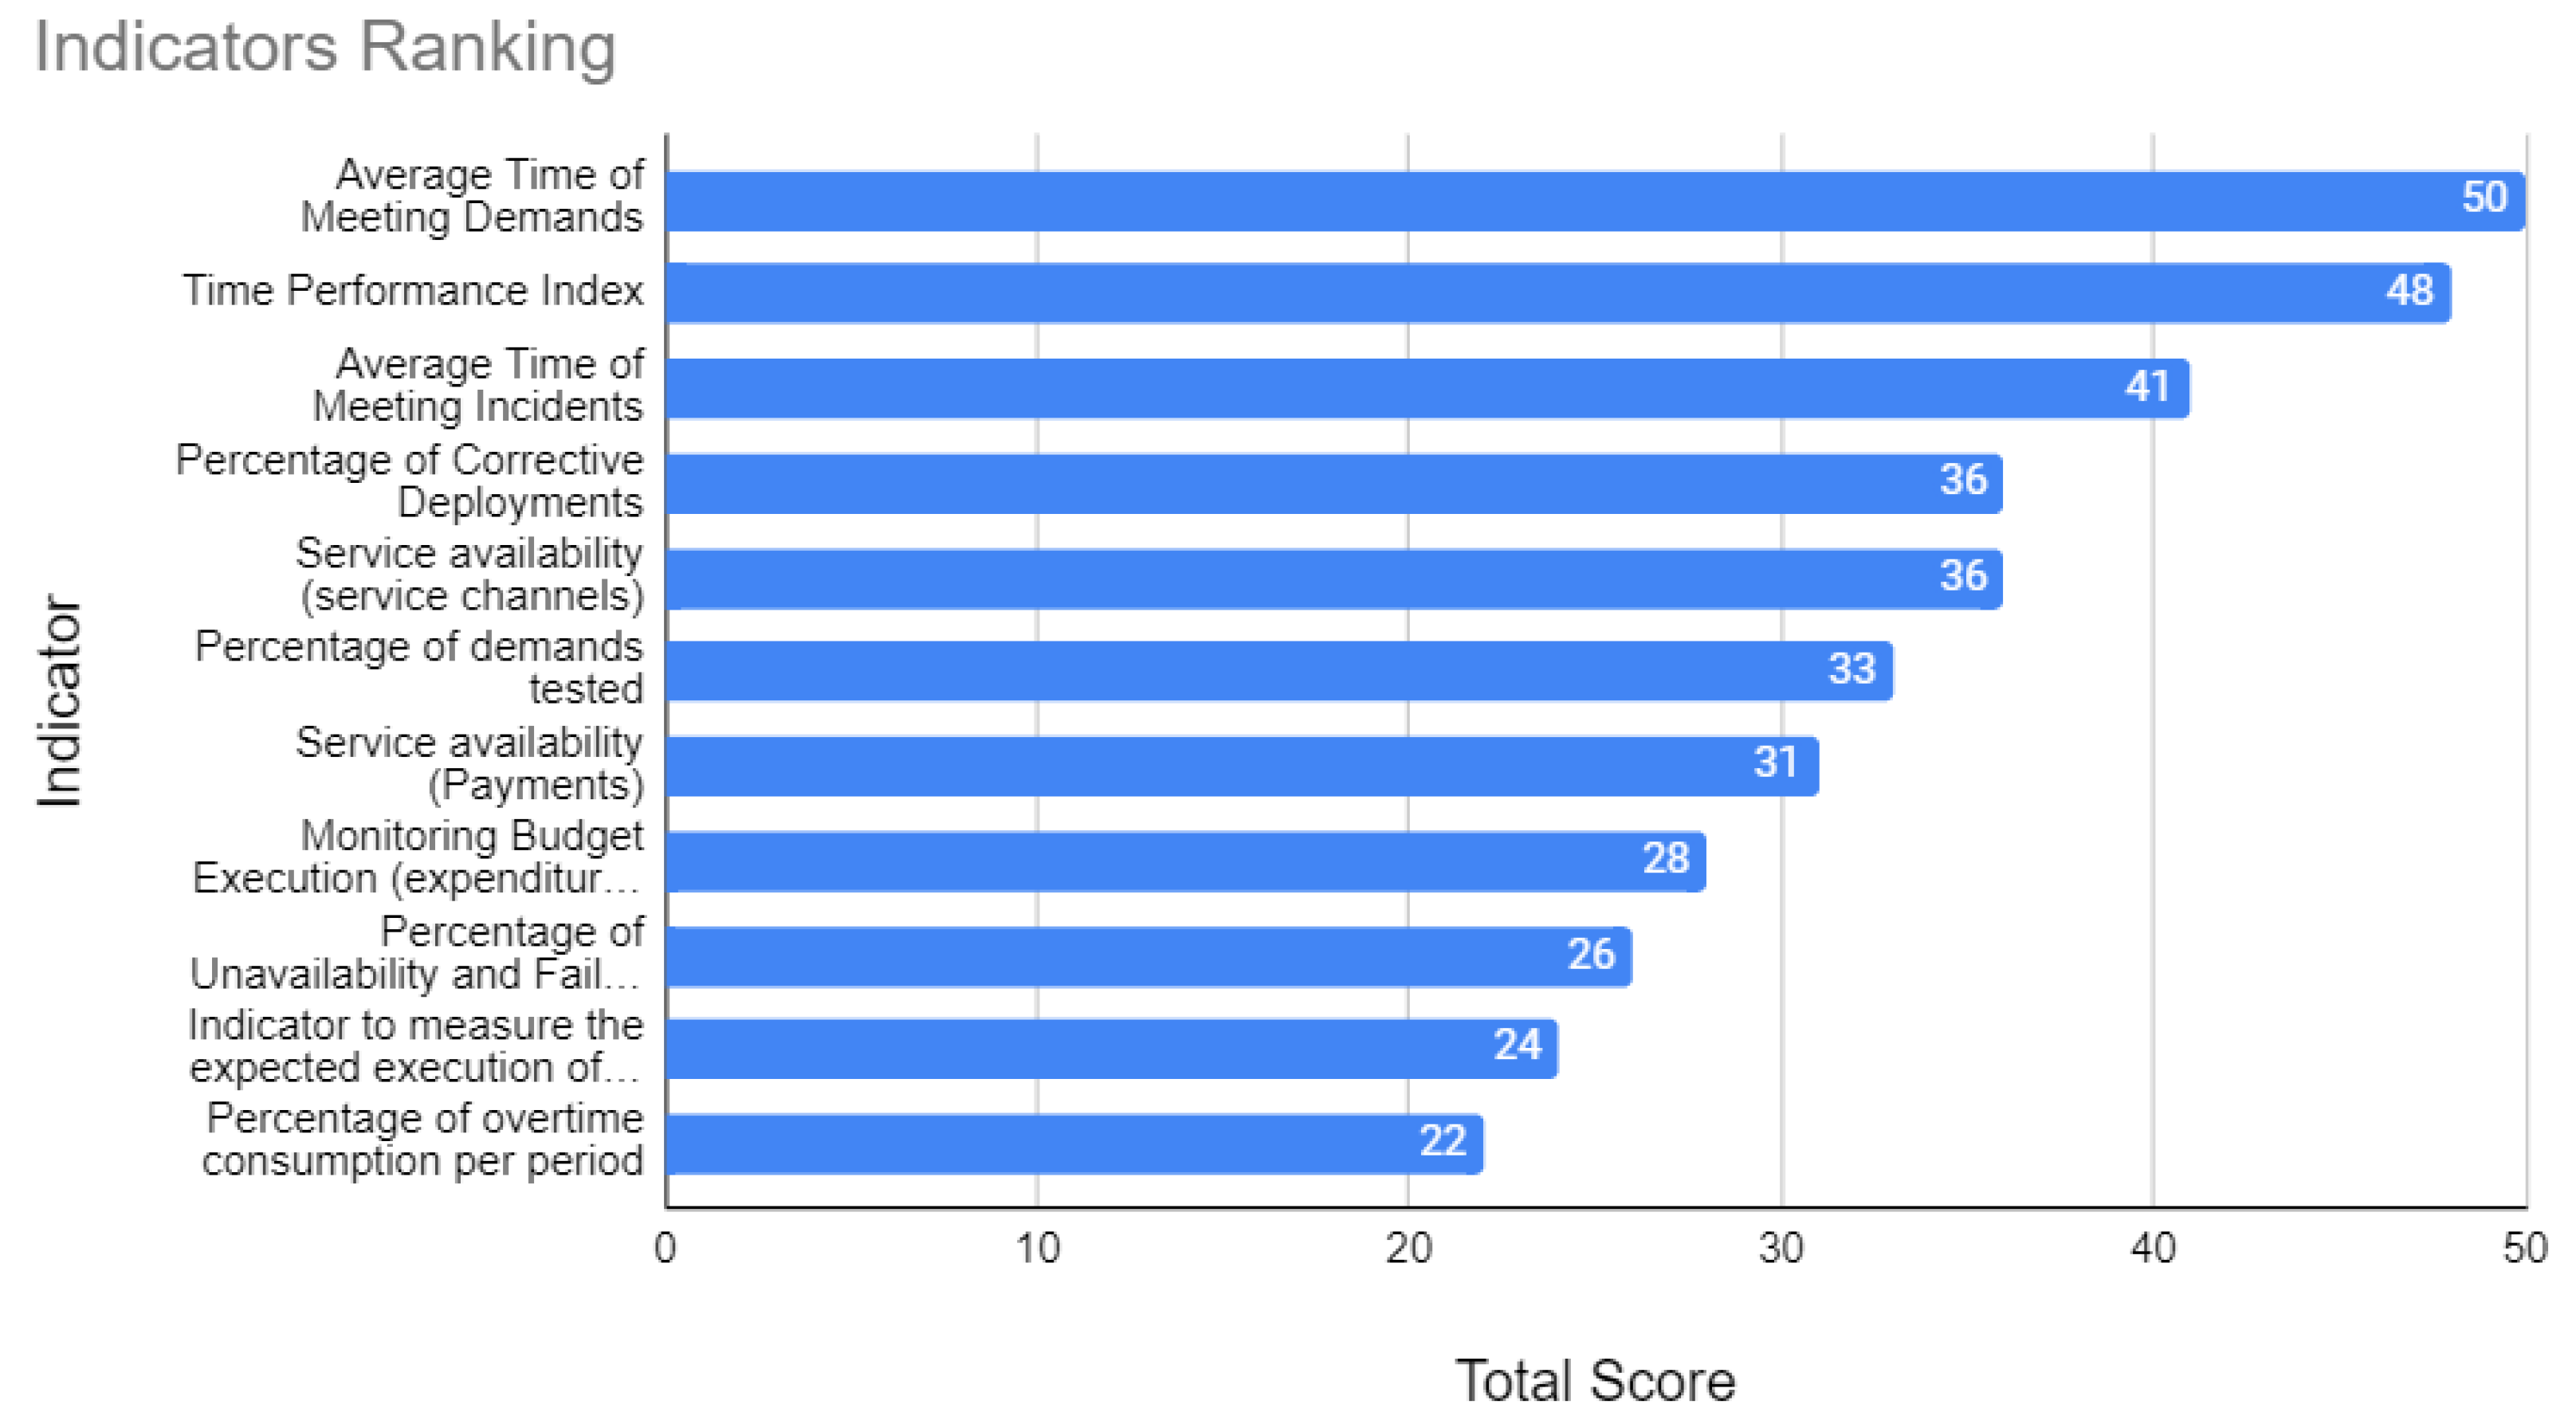
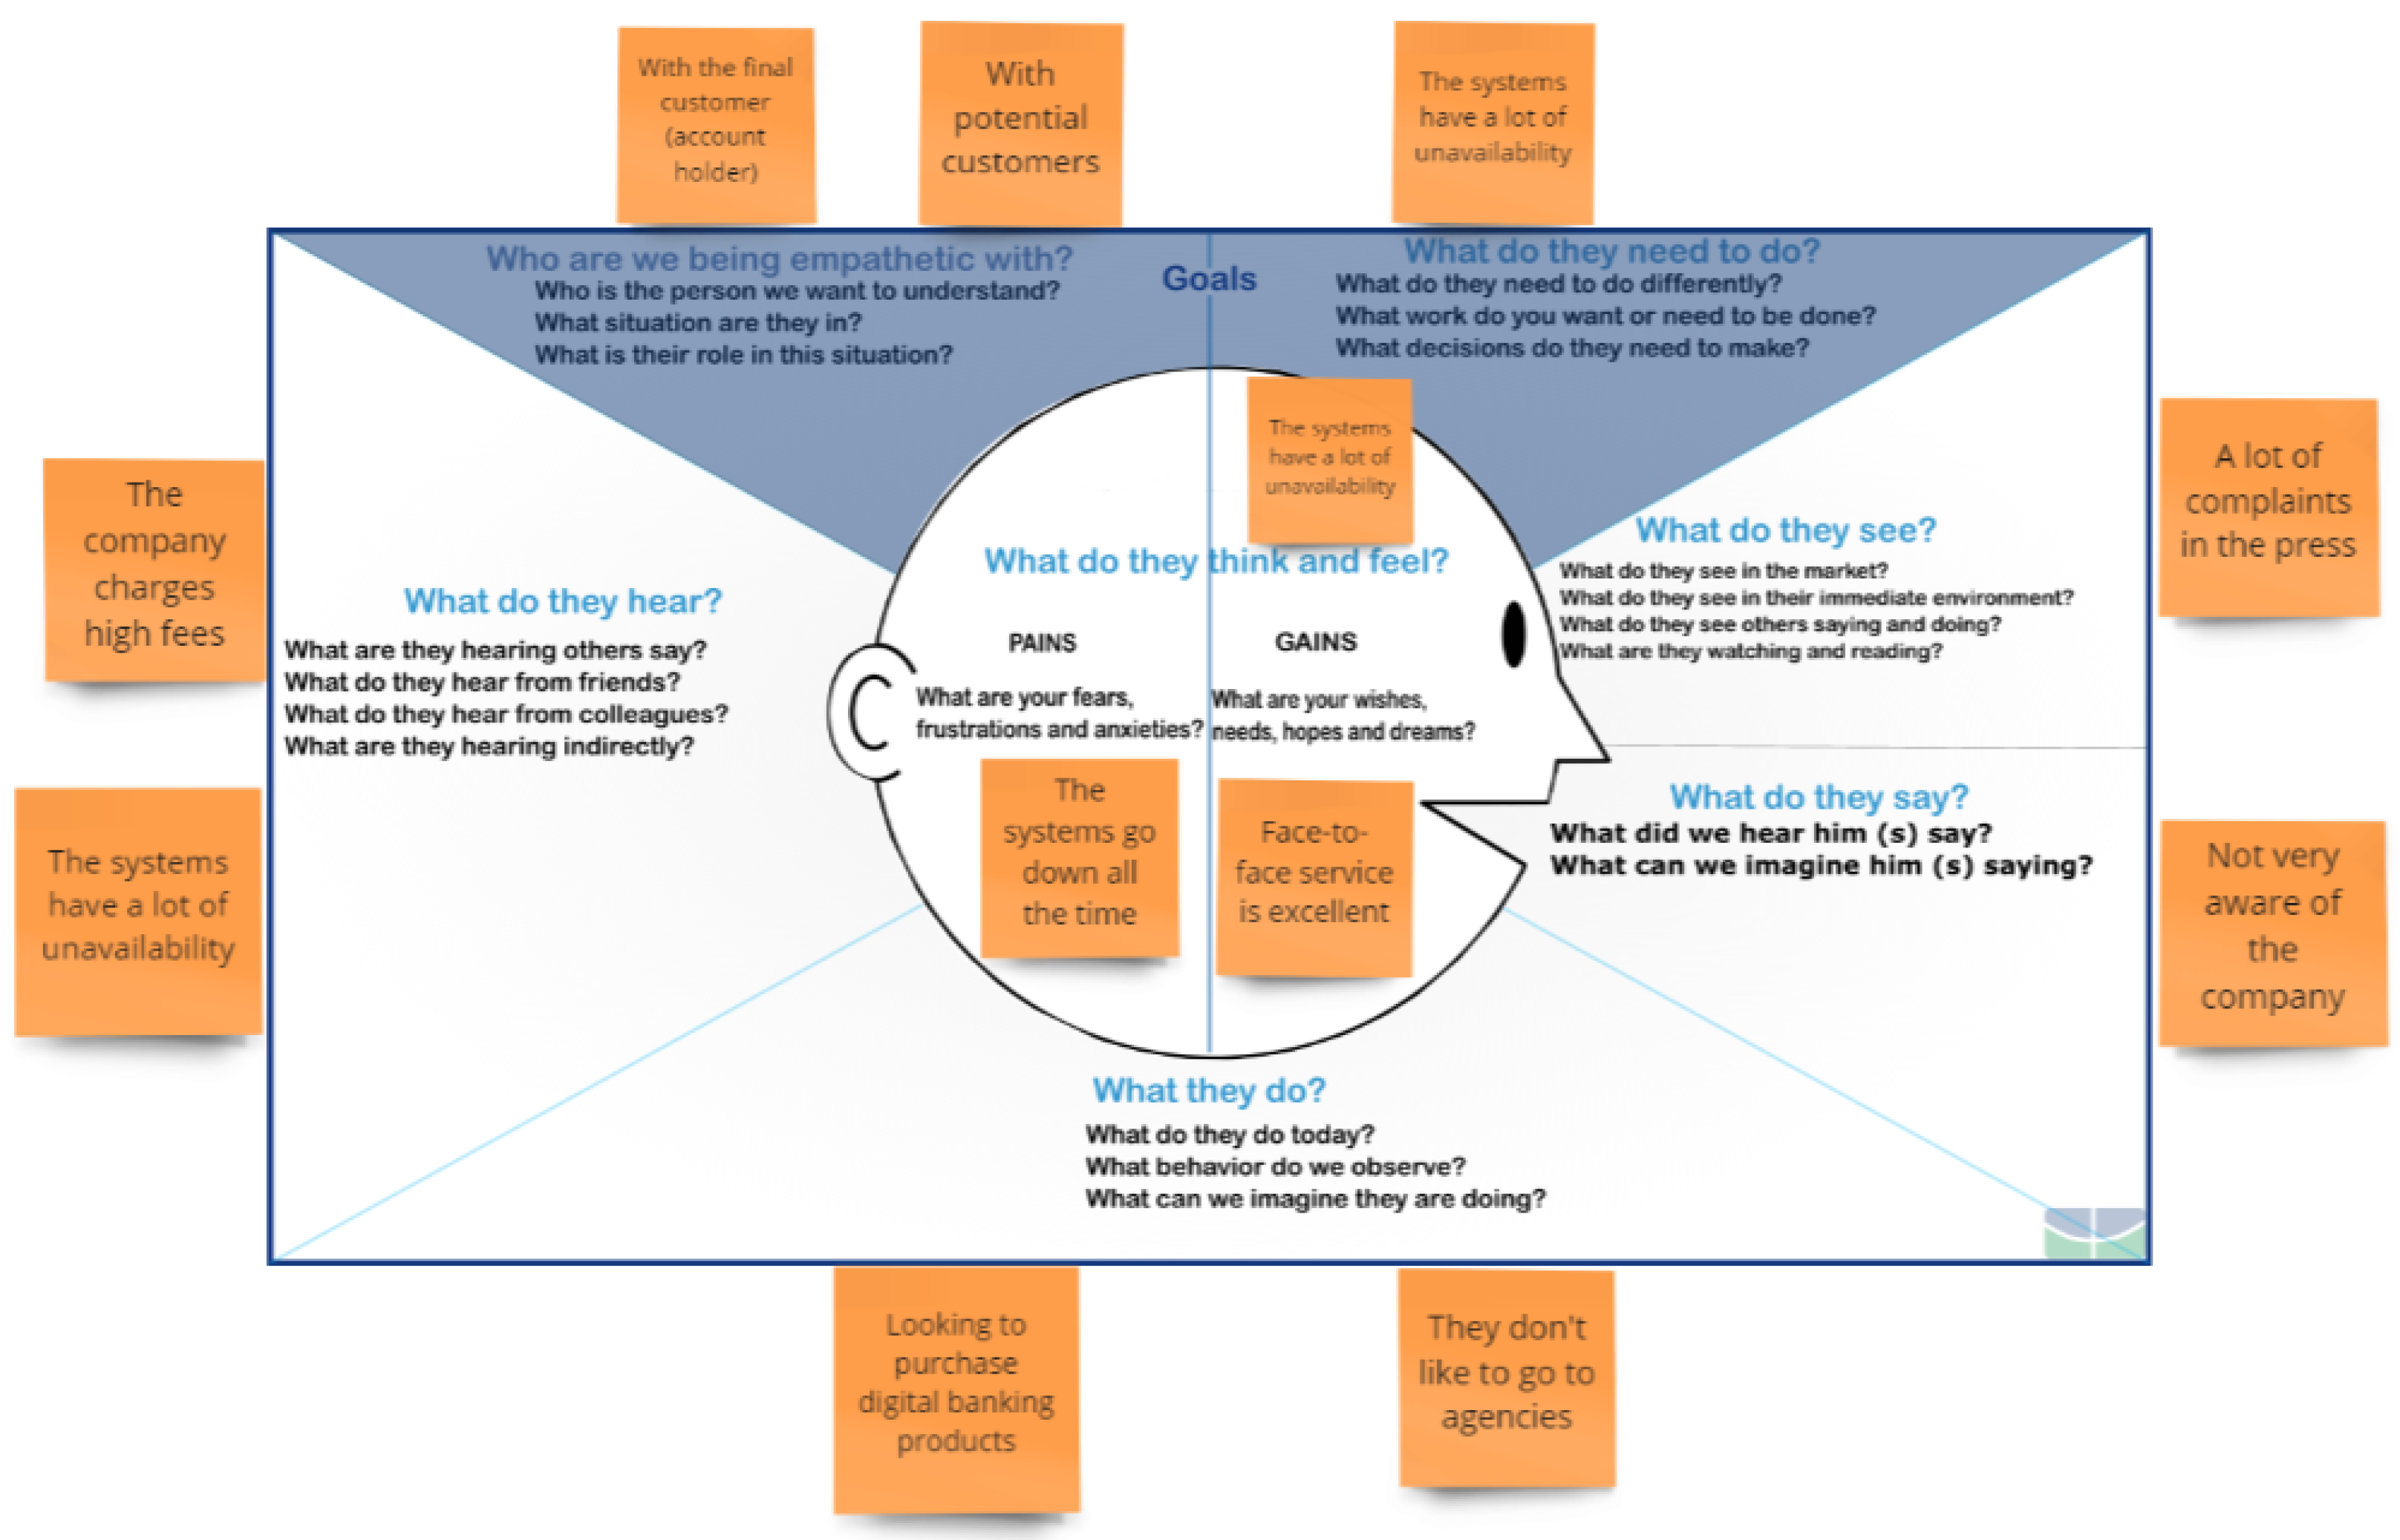
Publisher’s Note: MDPI stays neutral with regard to jurisdictional claims in published maps and institutional affiliations. |
© 2022 by the authors. Licensee MDPI, Basel, Switzerland. This article is an open access article distributed under the terms and conditions of the Creative Commons Attribution (CC BY) license (https://creativecommons.org/licenses/by/4.0/).