Abstract
Drones, flying Internet of Things (IoT), have been widely used in several industrial fields, including rescue, delivery, military, and agriculture. Motors connected to a drone’s propellers play a crucial role in its movement. However, once the motor is damaged, the drone is at risk of falling. Thus, to prevent the drone from falling, an accurate and reliable prediction of motor vibration is necessary. In this study, four types of time series vibration data collected in the time domain from motors are predicted using long short-term memory (LSTM) and gated recurrent unit (GRU), and the accuracy and time efficiency of the predicted and actual vibration waveforms are compared and examined. According to the simulation results, the coefficient of determination, , and the root mean square error values obtained from the actual and predicted vibrations by the LSTM and GRU are similar. Furthermore, both the LSTM and GRU show excellent performance in forecasting future motor vibration, but GRU can predict future vibration about 22.79% faster than LSTM.
1. Introduction
Drones are defined as flying Internet of Things (IoT) [1]. Unlike IoT devices mounted in fixed locations, flying drones extend the reach of the IoT and enable extensive data collection from the outside. Therefore, the application area of the IoT is broadly expanded through flying drones. In addition, drones connected with wireless communication are expanding the communication range of the IoT in various industrial fields [2]. Drones have emerged as a crucial technology of the fourth Industrial Revolution and are being used in various industrial fields, such as search and rescue [2,3,4], delivery [5], patrol [6], military surveillance [7], and agricultural applications [8,9]. According to a market report published in June 2020 by DRONEII, a global drone market research company, the global drone market size is expected to grow from USD 22.5 billion in 2020 to USD 42.8 billion in 2024 at an annual growth rate of 13.8%. Furthermore, according to DRONEII, the commercial drone industry is expected to sell 1,000,000 drones annually by 2021. It also announced that, based on the expected growth rate of the drone market between 2020 and 2025, drone sales are forecasted to increase by more than twice from 2020 to 2025 [10].
However, as drone usage becomes more common, crashes are also increasing, and in the worst-case scenario, there is a significant risk of casualties. According to the Korea Consumer Agency’s drone safety survey, propellers were the highest risk at 67.0%, followed by motors and engines at 49.8%, and batteries and chargers at 46.2%. Furthermore, depending on the drone’s location when it crashes, the risk of secondary accidents is very high [11]. Thus, research into predicting and preventing drone crashes is critical since drones are used in many industries. Therefore, in this study, long short-term memory (LSTM) and gated recurrent unit (GRU) are used to predict the abnormal state of a drone by predicting the future vibration from the collected time series vibration data in the time domain.
Recently, many artificial intelligence studies have been conducted in various fields. In particular, the recurrent neural network (RNN), one of the deep learning networks, has sequences such as natural language, weather, and stock prices, and shows high accuracy in predicting time series data. However, the RNN has a long-term dependency problem, making accurate prediction difficult as the input data becomes longer [12]. LSTM and GRU modified from the LSTM have been proposed to solve this long-term dependency problem [13,14]. LSTM solves the long-term dependency problem by adding cell states between the input and output and preserving or discarding information from previous layers. Furthermore, the GRU have a faster learning rate than the LSTM due to their simpler structures, although they perform similarly to the LSTM. Thus, both deep learning-based LSTM and GRU are suitable for forecasting future vibration.
Many studies have been previously conducted to detect the vibrations and abnormalities of motors by deep learning [15,16,17]. In the previous study, a failure diagnostic approach was used to analyze the drone’s vibration and predict the abnormality using deep learning to detect the abnormal state of the drone [18,19,20]. Furthermore, studies are conducted to diagnose abnormalities by analyzing and predicting the vibration of a motor using LSTM [21,22,23,24,25,26,27,28,29] and GRU [30,31,32,33,34,35]. Moreover, Table 1 represents the papers using more than two RNN techniques in terms of purpose, method, and evaluation criteria.

Table 1.
Literature using more than two RNN techniques.
In this study, the predictive performances of LSTM and GRU are compared and analyzed by predicting the future vibrations of vibrations obtained from a normal motor, a motor with low power, a motor with a bent shaft, and a motor with a damaged rotor. To compare the predictive performance between LSTM and GRU, and root mean square error (RMSE) values between the actual vibration value and predicted vibration value are compared, and time efficiency is examined by comparing the time spent in the simulation. This study is expected to be utilized in the development of motor-state management to minimize the consequent overload accidents related to the drone’s motor.
The remainder of the study is organized as follows: In Section 2, methodologies provide details on future vibration forecasting based on LSTM and GRU with vibration data. Future vibration forecasting results are presented in Section 3. To analyze the comparative performances of the LSTM and GRU approaches, the predicted vibration waveforms from LSTM and GRU are compared with the and RMSE values. Finally, Section 4 summarizes the conclusions and future perspectives from the simulation results.
2. Methodologies
This section describes the proposed LSTM- and GRU-based vibration prediction method and waveforms from the four types of motors, followed by the description of the structures of the LSTM and GRU.
2.1. Proposed Vibration Prediction Method
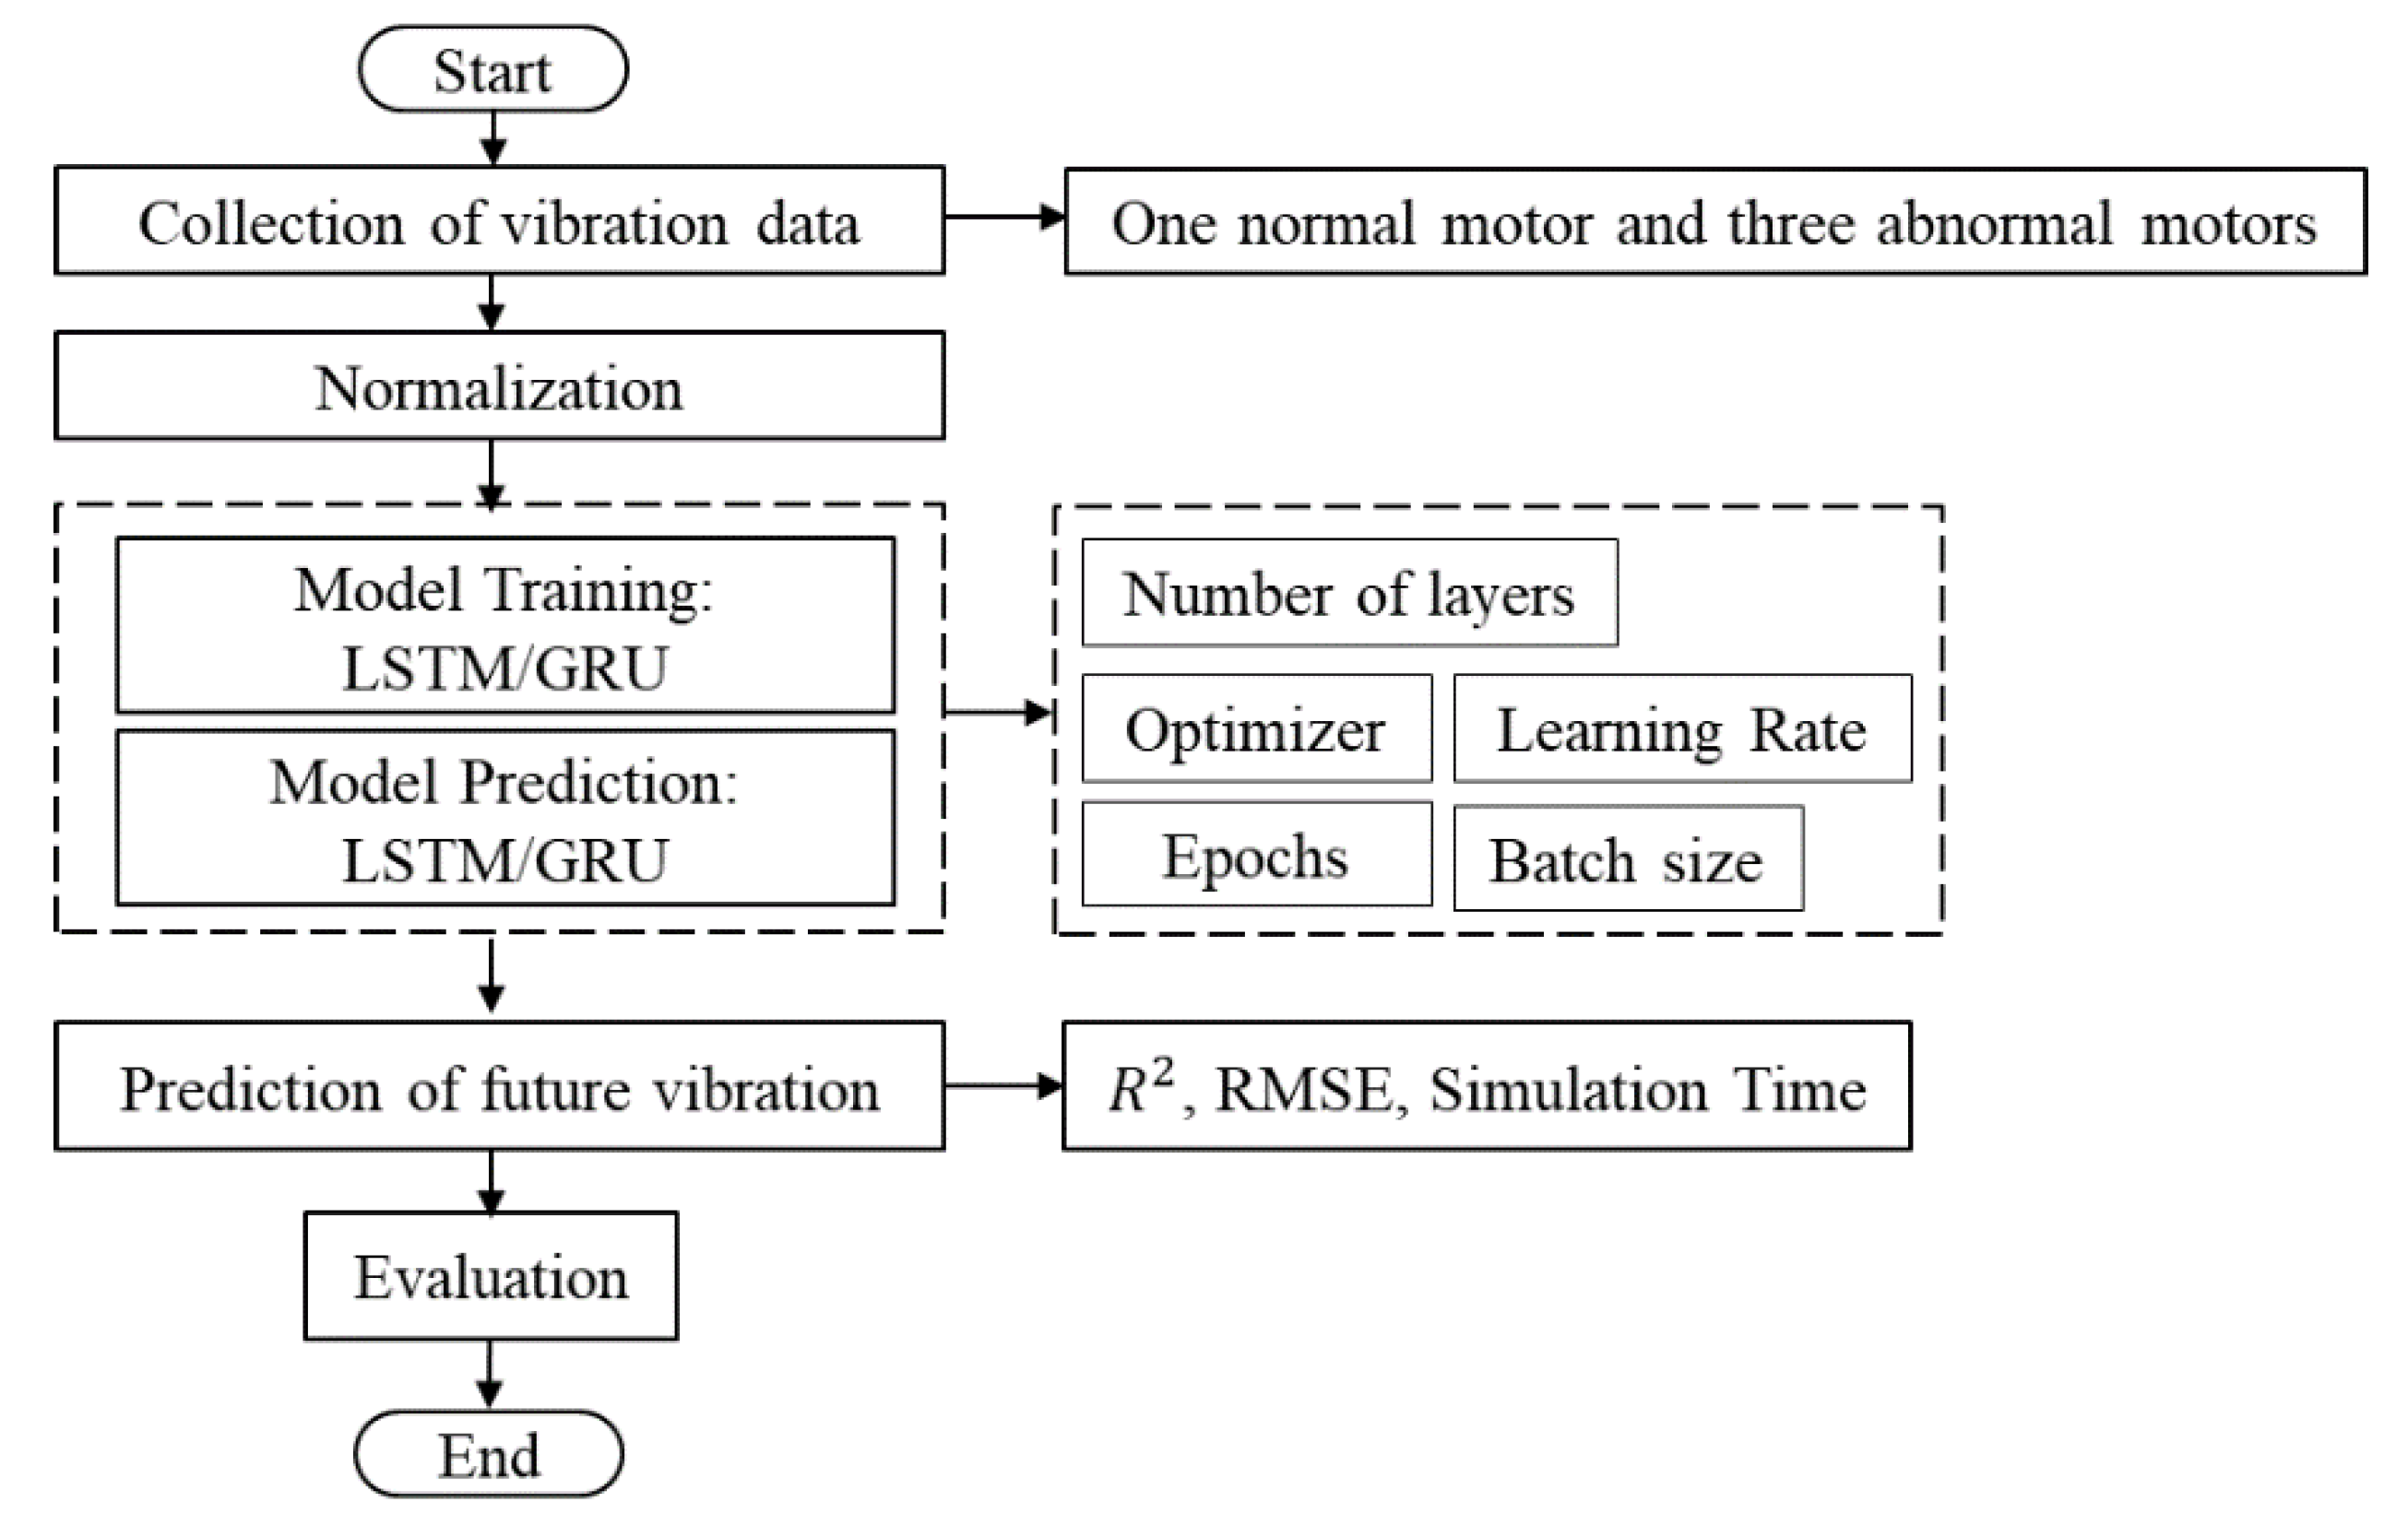
The proposed approach of LSTM- and GRU-based vibration forecasting is described in this subsection. Figure 1 shows the flowchart of the proposed simulation approach.

Figure 1.
The flowchart of the proposed method.
To compare the forecasting performance of the LSTM and GRU, four types of vibration data from the drone’s motor are collected, as shown in Figure 1. The collected time series vibration data included normal vibration data from a normal motor and abnormal vibration data from three types of abnormal motors, such as a motor with low power, a motor with a bent shaft, and a motor with a damaged rotor.
The time series vibration values are normalized to be in the range (0, 1) using min–max normalization after collecting the four types of vibration dataset. Normalization is achieved by conducting a linear transformation on the input vibration data values. The following equation represents the min–max normalization process
where x and represent the original vibration value and the normalized vibration value, respectively. Furthermore, using LSTM and GRU to compare the accuracy of the predicted vibration, 90% of the collected time series vibration data are used as the training data and the remaining 10% is used as the test data to predict future vibration.
To compare the accuracy of the predicted vibration waveform between LSTM and GRU, the coefficients of determination, , are calculated to compare the accuracy between the actual and predicted vibration values by LSTM and GRU. The coefficients of determinations can be written as the following:
where is the total number of vibration samples used to predict the future vibration. , , and represent the actual, predicted, and overall average vibration values, respectively.
Additionally, the RMSE is calculated from the actual and predicted vibration values to compare the forecasting performance of the vibration between LSTM and GRU. RMSE can be written as
where is the total number of vibration samples used to predict the future vibration. and represent the actual and the predicted vibration values, respectively.
2.2. Collection of Time Series Vibration Data
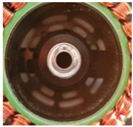
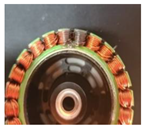
Time series vibration data are collected from four types of motors connected to the drone’s propellers to compare the vibration forecasting performance of LSTM and GRU. The collected time series vibration data included normal vibration data from a normal motor and abnormal vibration data from three types of abnormal motors: a motor with low power, a motor with a bent shaft, and a motor with a damaged rotor.
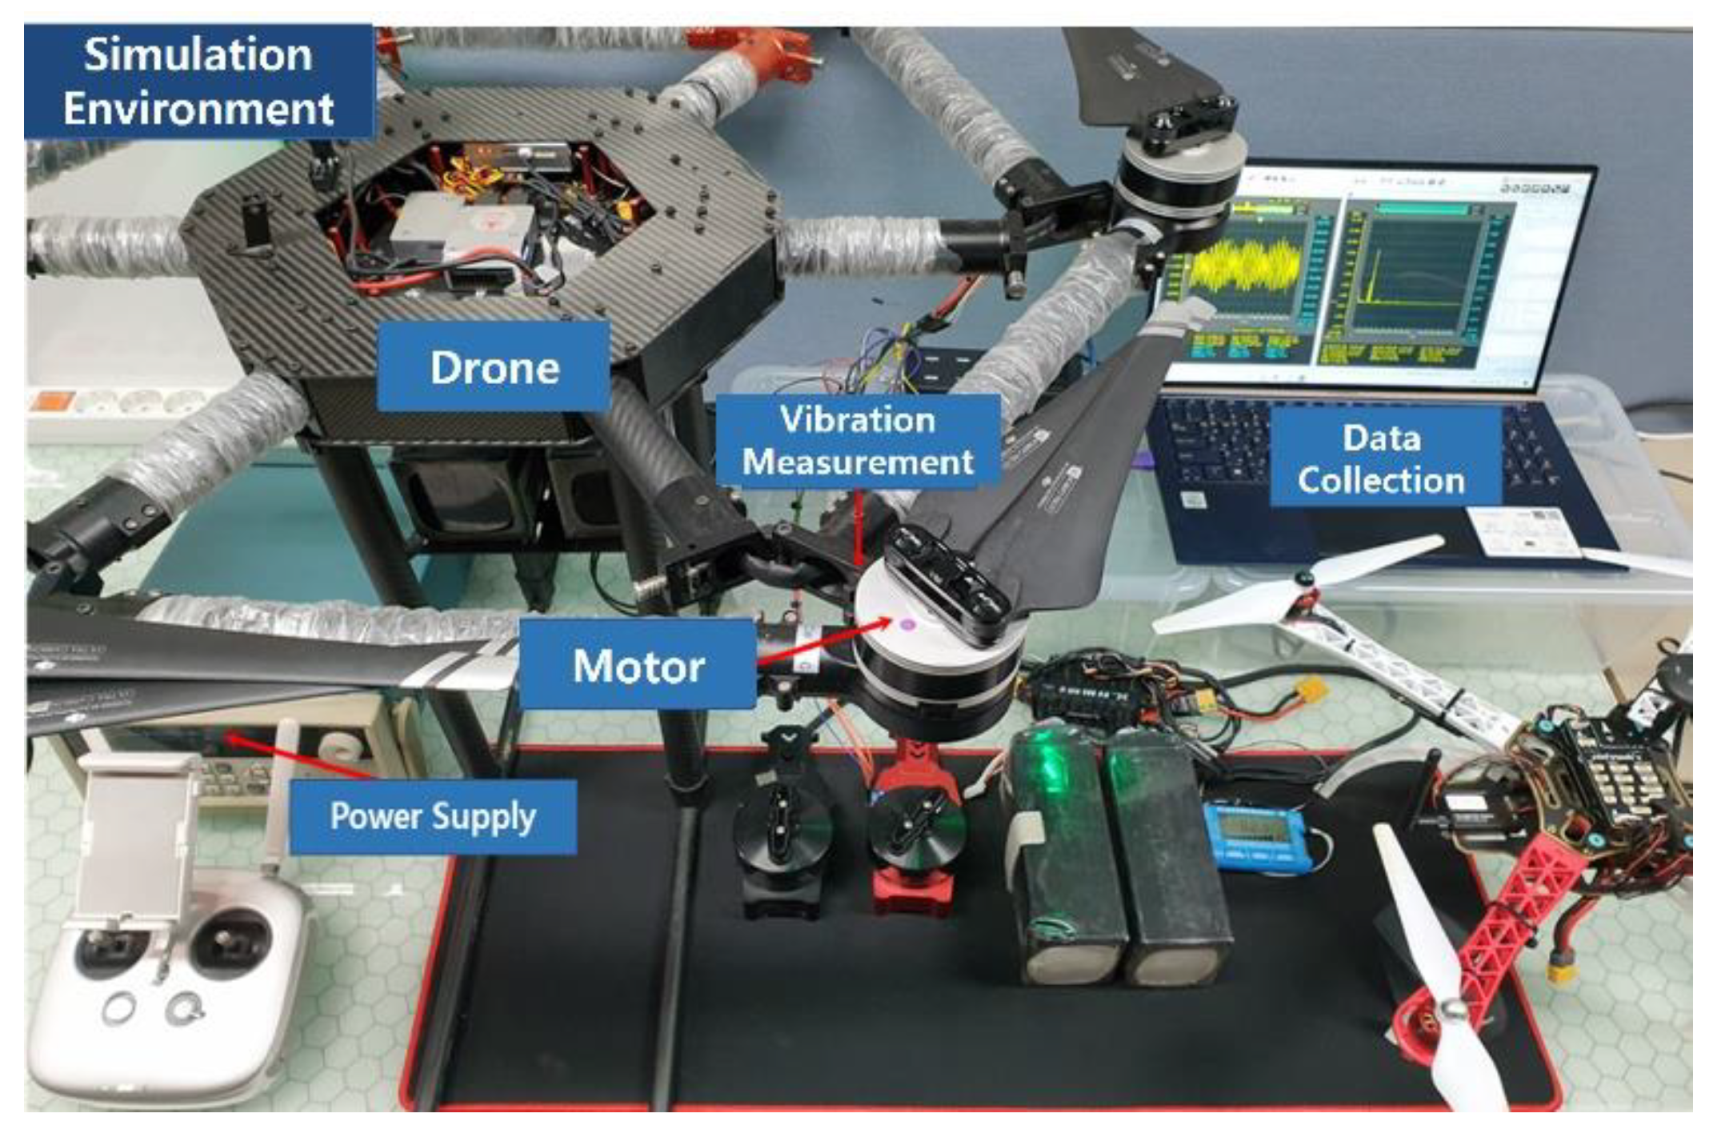
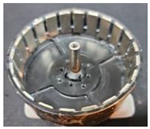
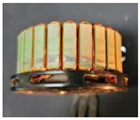
Figure 2 demonstrates the configuration of the simulation environment to collect time series vibration data from the motor connected to the drone propeller. The constant velocity, maximum power, and maximum torque of the motor used in the simulation are 180 Kv, 1484.6 W, and 1.992 N⋅m, respectively. In order to collect the vibration data from one normal motor and three abnormal motors, the motor frequency was set to 20 Hz, which is 1200 RPM rotation rate.
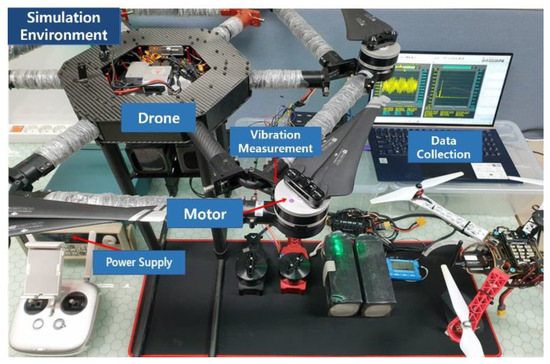
Figure 2.
Configuration of collecting time series vibration data.
The environment is configured to collect data by a vibration measurement sensor mounted on the motor and the data is saved on a laptop, as shown in Figure 2.
In this study, normal vibration data and three abnormal vibration data of drone motors are collected, and the collected data are used to predict future vibrations using LSTM and GRU. The time required to predict the future vibration of LSTM and GRU is then compared with the prediction accuracy.
As shown in Table 2, to collect normal vibration data and three types of abnormal vibration data, a vibration sensor is installed on the drone motor rotating at 1200 RPM and time series vibration data are collected at 100 ms intervals.
Table 2.
Four types of motor conditions.
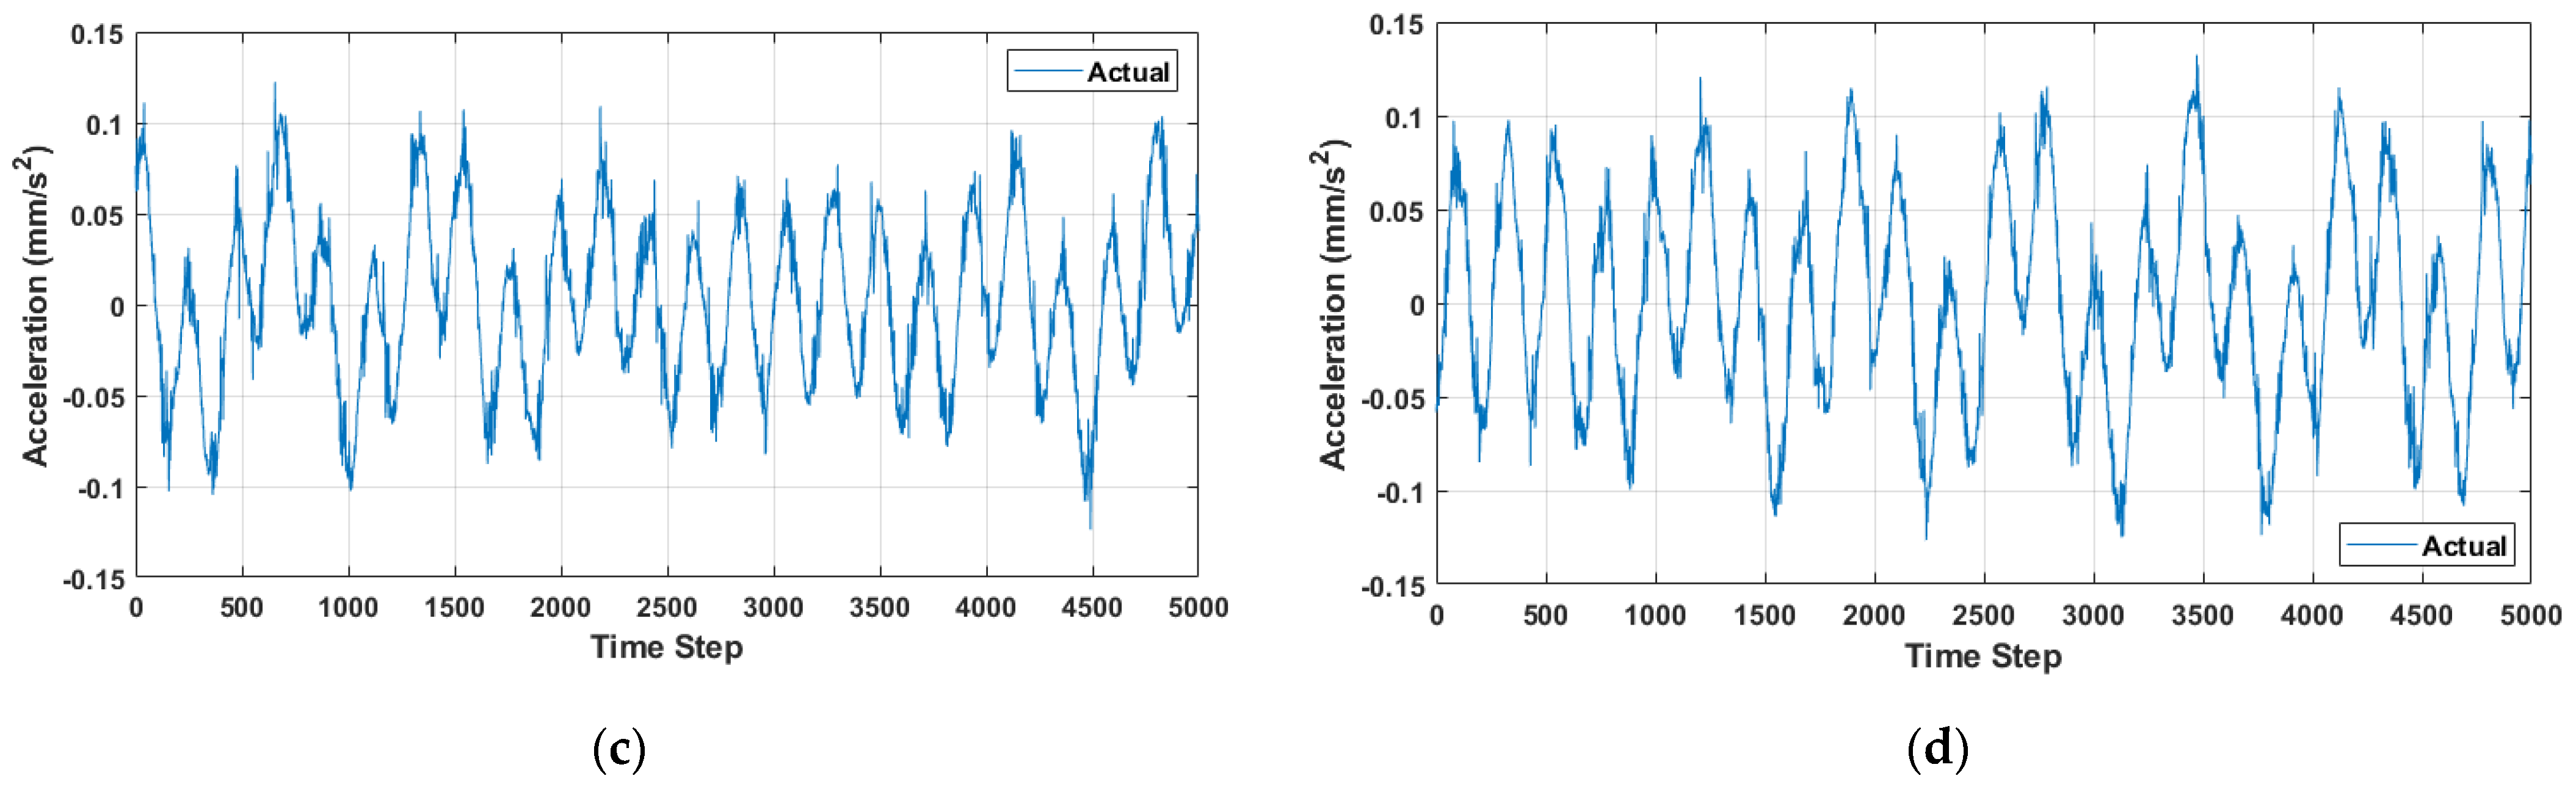
Figure 3a–d show a total of 5000 vibration data collected from a normal motor, a motor with low power, a motor with a damaged rotor, and a motor with a bent shaft. The waveforms of vibration data collected from the normal motor show constant period and acceleration values, as shown in Figure 3a. However, Figure 3b demonstrates the vibrations of a low-power motor, which shows vibrations similar to those of a normal motor, but with reduced acceleration and more vibrations at the waveform’s end. The vibration waveforms in Figure 3c,d exhibit the instability in the period and acceleration compared to the vibrations of the normal motor in Figure 3a.
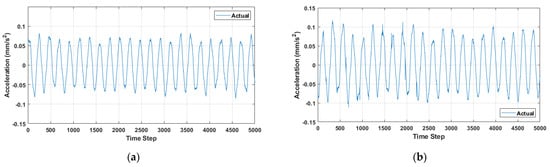
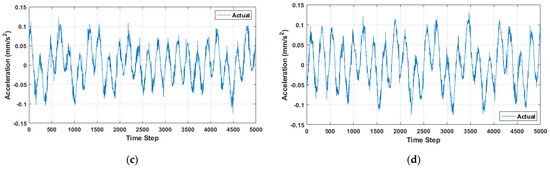
Figure 3.
Collected time series vibration data from: (a) a normal motor; (b) a motor with low power; (c) a motor with a bent shaft; (d) a motor with a damaged rotor.
Therefore, 90% of the 5000 vibration data collected from the four types of motors is trained by LSTM and GRU to predict the remaining 10% of future vibrations. Descriptions of LSTM and GRU used to predict future vibrations are described in Section 2.3 and Section 2.4, respectively.
2.3. Vibration Prediction with LSTM
The input layer, hidden layer, and output layer are the three steps in the conventional artificial neural network (ANN), and they have a simple structure composed of numerous neurons arranged in layers. Even though this simple ANN can be used to perform various analyses, they have limitations in predicting present values using past data. However, in the RNN, past information is stored in nodes and passed on to the next time step, allowing past data to be used for predicting current values. In a basic RNN model, if the length of past data used for forecasting current values is long, some of the past information is lost during the transmission process, and learning is not smoothly accomplished due to the vanishing gradient problem. Thus, LSTM was proposed to address the RNN’s long-term dependency problem. LSTM addresses the conventional RNN’s vanishing gradient problem using the gates within the structure of LSTM. In other words, it solves the problem of long-term dependencies by transmitting the output of the preceding time step through the cell state that goes through the entire chain without significant changes.
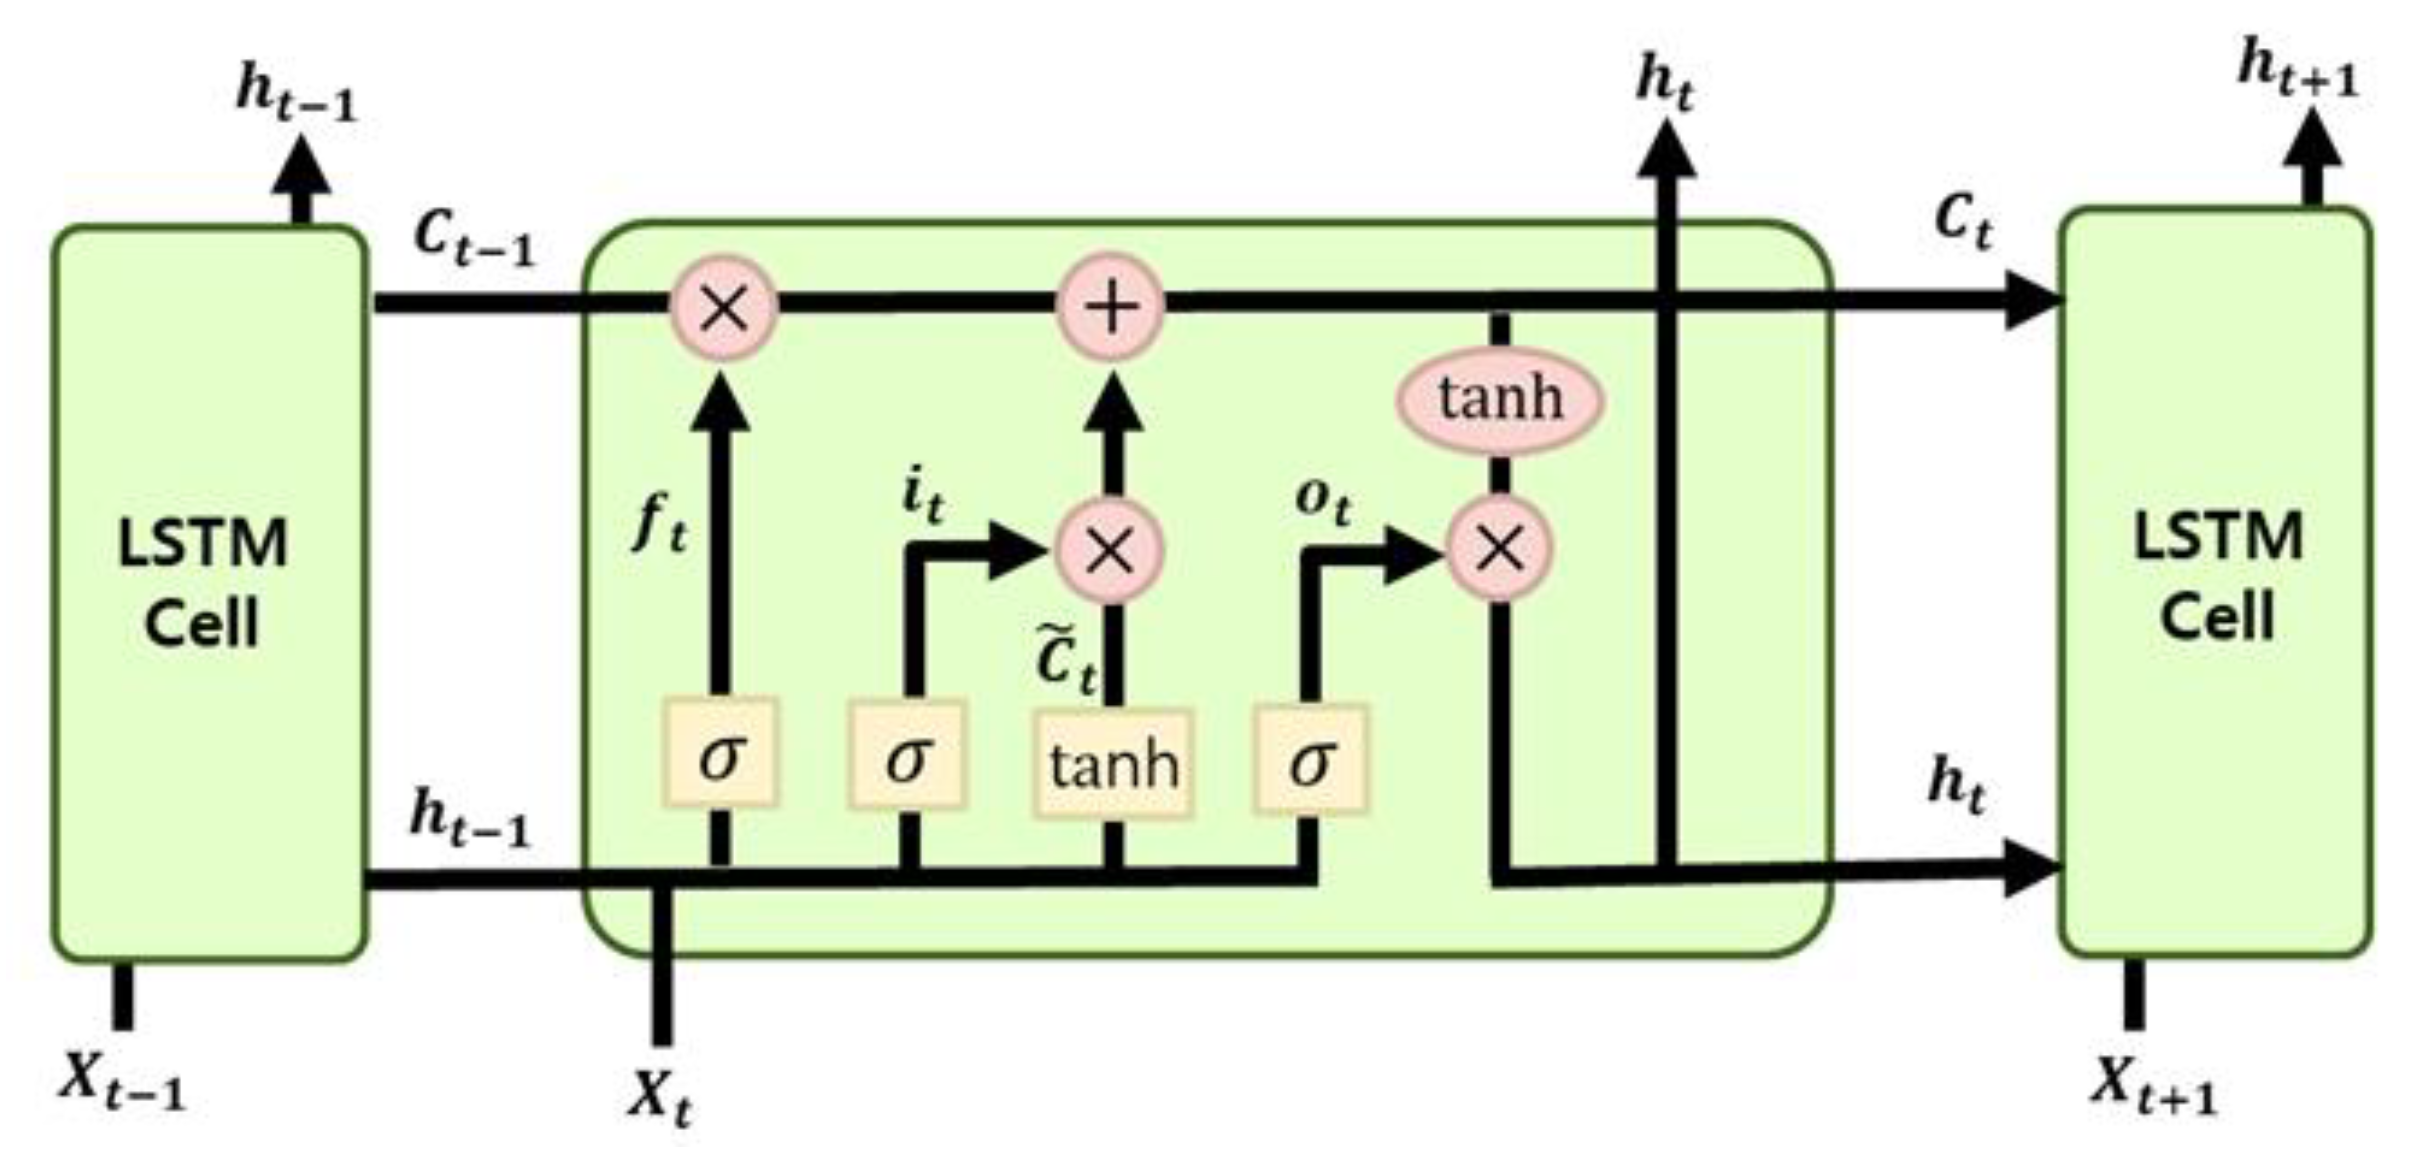
In Figure 4, and represent the input and hidden state at time t, respectively. Furthermore, i, f, and o denote the input gate, forget gate, and output gate, respectively. In the first step, LSTM uses a sigmoid function to determine the information to be eliminated, and in the second step, it uses another sigmoid function and a tanh function to determine whether to store new information in the cell state. The cell state is updated in the third step, and the output value is determined using the final sigmoid function and the final tanh function through which the output from the cell state is passed.
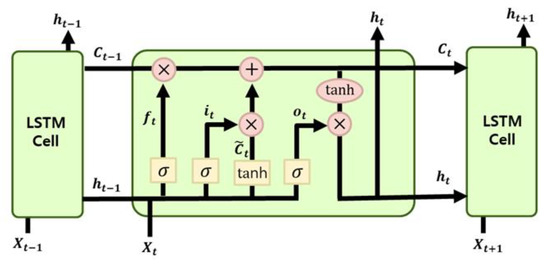
Figure 4.
Structure of long short-term memory (LSTM).
The LSTM used in this study has a structure composed of continuously connected units in the left and right directions. At each step, the LSTM receives the previous time step’s hidden and cell state, receives the current step’s input value, performs computation through gates, updates the hidden and cell state, and transmits them to the next time step.
The aim of using LSTM is to predict vibration in the next time step based on the prior vibration sequence. The input gate , forget gate , output gate , intermediate cell state , memory cell , and hidden memory cell , can be written as
where and denote weight matrices and bias vectors, respectively. and are used to connect the input layer, memory block, and output layer. σ() is the standard logistics sigmoid function. is the extent of the stand sigmoid function with the range of [−1, 1].
In this study, is the input vibration data. The input time series vibration data is expressed as and the hidden state of memory cells are denoted by where is the length of the vibration data values.
2.4. Vibration Prediction with GRU
GRU are an extended approach of LSTM [14]. The GRU are based on the LSTM. However, their internal structure is simpler, making it easier to train since an update to their hidden state requires fewer computations. Furthermore, it solves the problem of LSTM’s vanishing gradient problem.
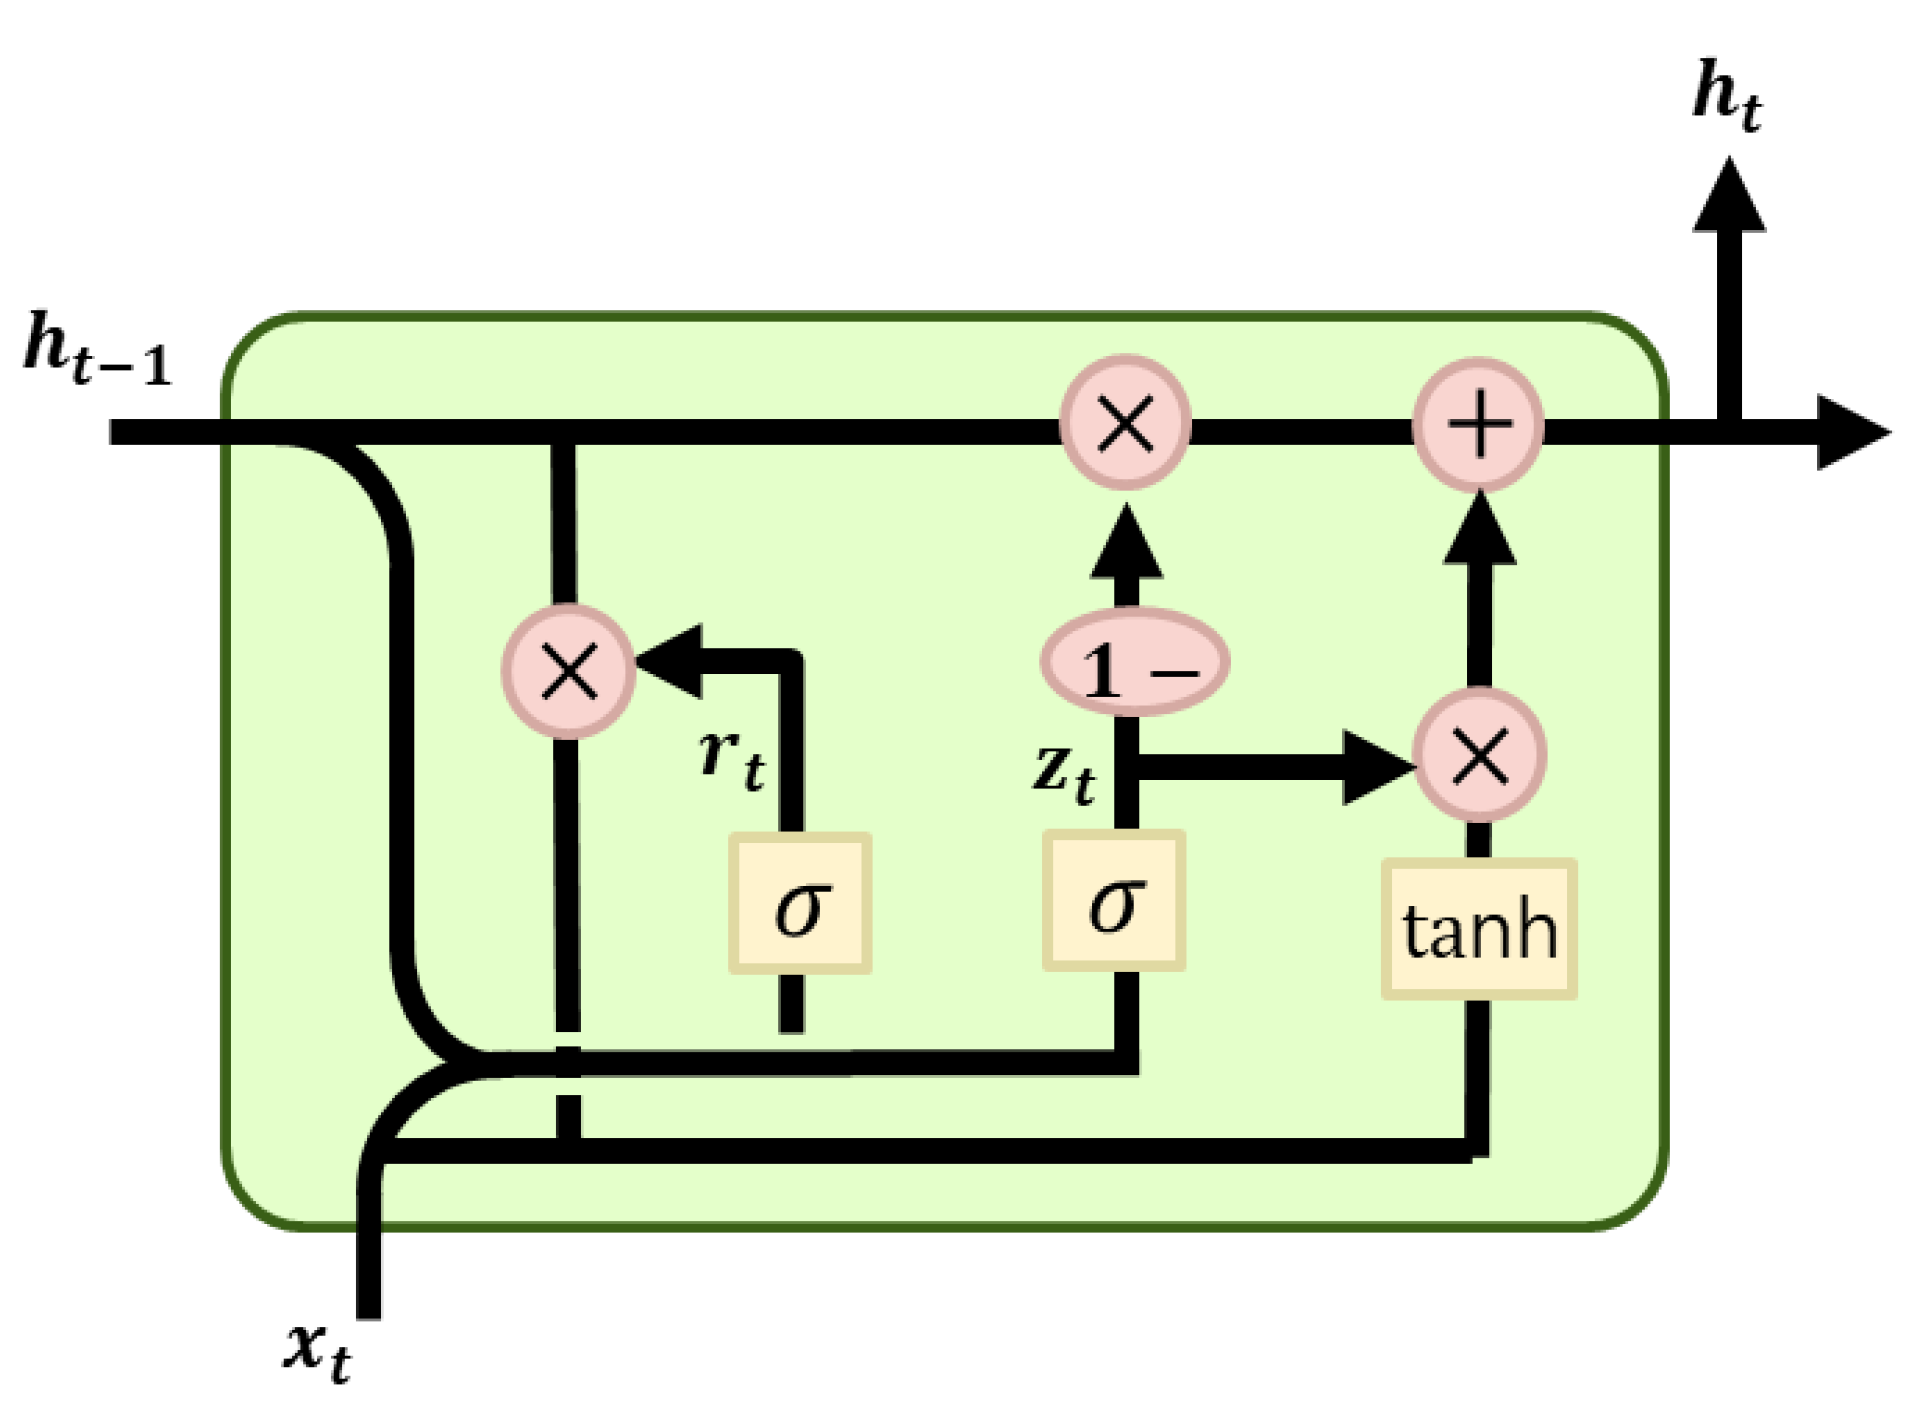
Figure 5 shows the GRU’s update gate and a reset gate, which are similar to the forget and input gates in the LSTM. The update gate specifies how much previous memory to keep and the reset gate specifies how to combine the new input with the previous memory. The major difference is that the GRU uses integration only to fully expose its memory content.
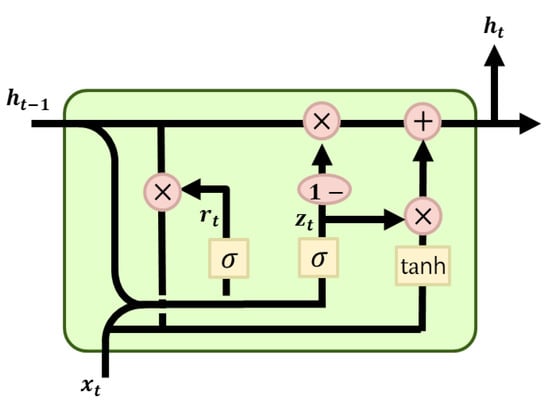
Figure 5.
Structure of gated recurrent unit (GRU).
Inside a GRU, the update gate determines which information can be retained to the next state, and the reset gate determines how the previous state information is combined with the new input information. The calculation formula of a GRU can be written as
where, the definition of , , are the same as in LSTM and is the weight matrix. and denote the output of the current and previous states, respectively. and denote the reset and update gates, respectively. is input vibration data. The input time series vibration data is expressed as and the hidden state of memory cells are denoted by where is the length of the vibration data values.
3. Simulation Results
This section describes the simulation parameters for both LSTM and the GRU, followed by the description of the comparative simulation results of the predicted waveforms, , RMSE, and simulation time between LSTM and the GRU.
3.1. Simulation Parameters
This subsection explains the simulation environment for predicting future vibrations using the four types of collected vibration data. Table 3 shows the values of the simulation parameters.
Table 3.
Simulation parameters for both LSTM and GRU.
Furthermore, the adaptive moment estimation (Adam) optimization is applied to minimize training errors and prevent local minimum points, which is an improvement over a stochastic gradient descent optimizer with an adaptive rate [40]. The Adam optimizer is advantageous for efficiently finding, in a short time, the optimal sales forecasting based on temperature by flexibly adjusting the learning rate.
3.2. Comparative Analysis of Vibration Forecasting
3.2.1. Normal Motor
This subsection presents a comparative analysis of the vibration waveform predicted using LSTM and GRU from vibration data collected from four types of motors. The changes in period and acceleration values in the predicted vibration waveforms of the three types of abnormal motors are compared using the actual and predicted vibration waveforms of the normal motor described in this subsection. Thus, the period and acceleration of the normal motor’s predicted vibration waveform are used as a reference to distinguish normal vibrations from abnormal vibrations and to differentiate among abnormal vibrations.
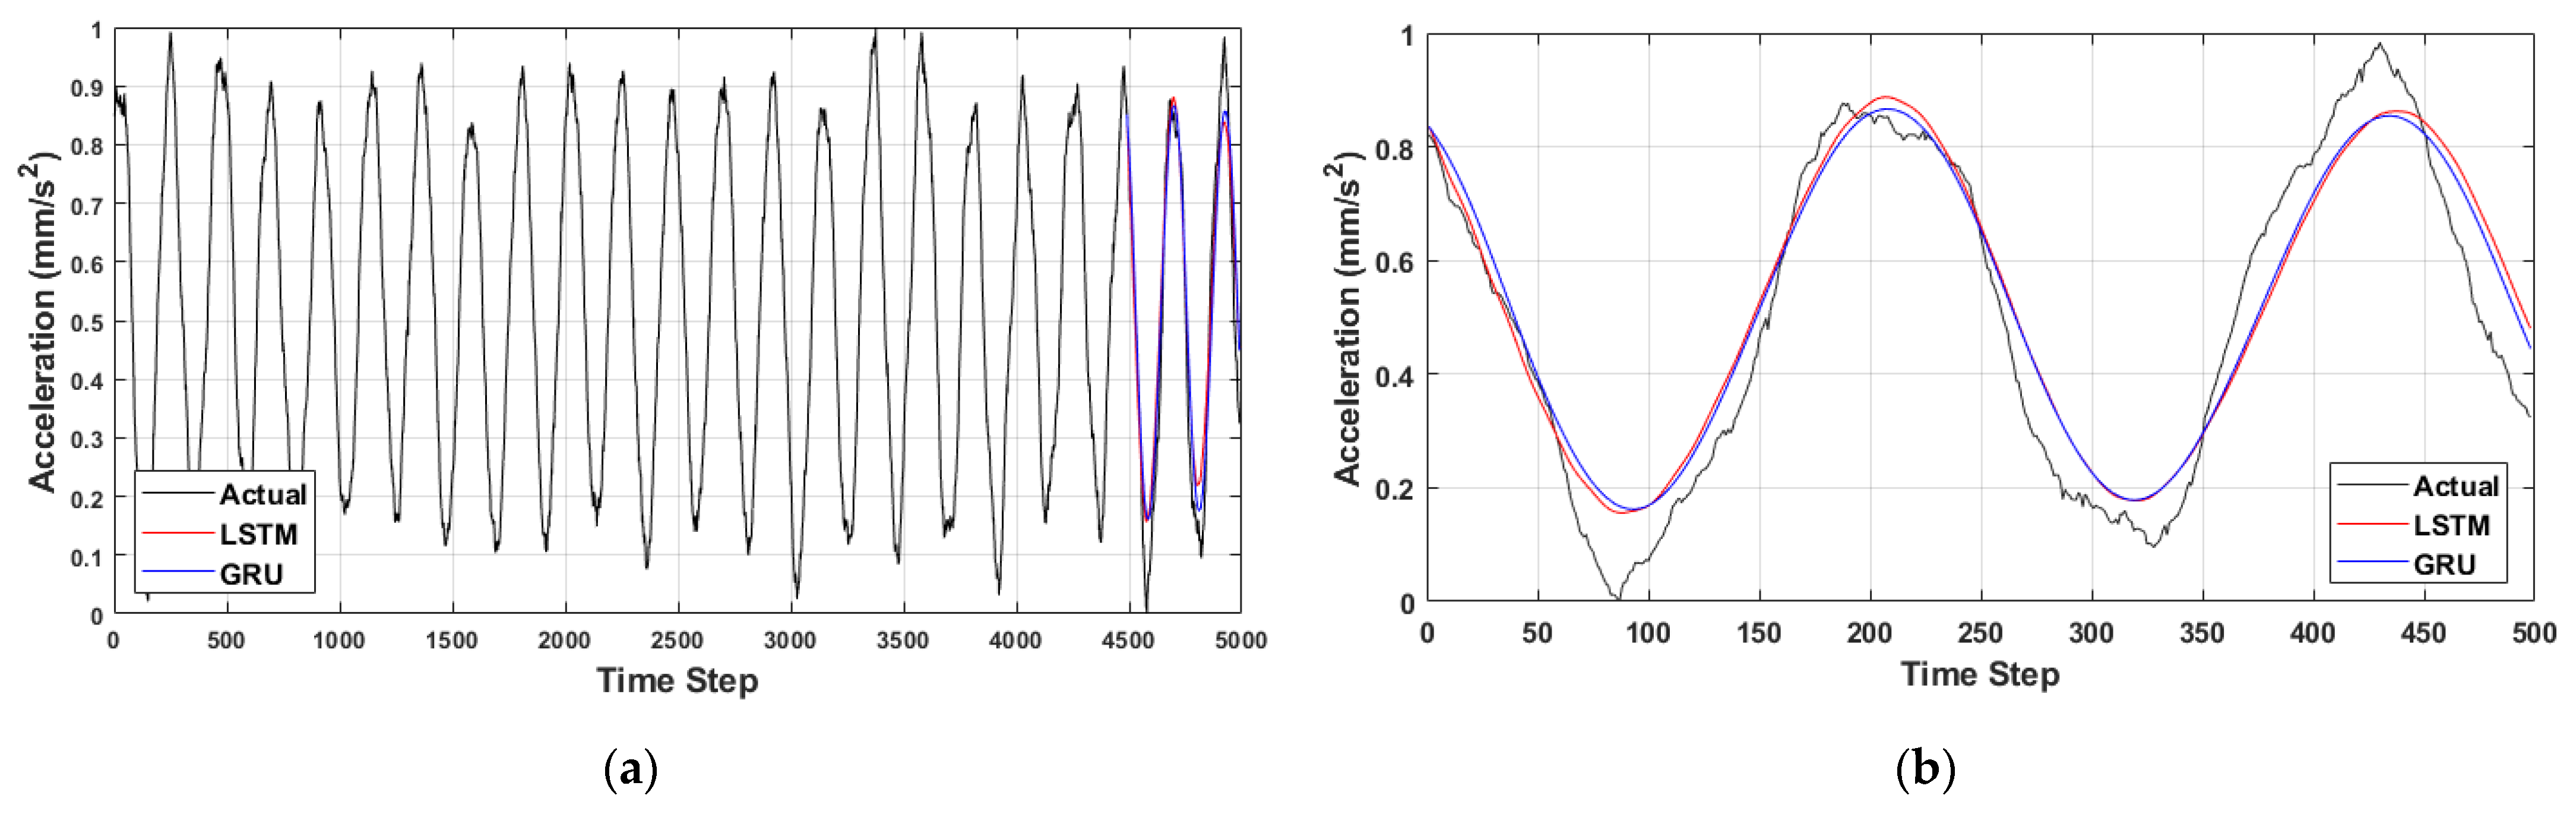
The black graph in Figure 6a,b represents the actual vibration waveform of the normal motor collected from an actual drone, while the blue and red graphs represent the predicted vibration waveform obtained by training LSTM and GRU with 90% of the 5000 samples of vibration data and using the remaining 10% as the test data for predicting future vibration. Figure 6b shows the actual vibration values of 500 time steps, 10% of the total 5000 time steps, and the predicted vibration values using LSTM and GRU.
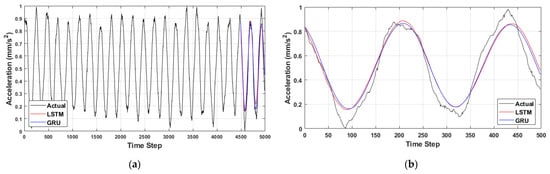
Figure 6.
Predicted vibration waveform of the normal motor: (a) actual and predicted vibration waveforms; (b) magnified graph of the predicted vibration waveforms from 4500 to 5000 time steps.
Since it is difficult to observe extremely small changes in vibrations with the eye, the actual and predicted vibration waveforms are enlarged for comparative analysis, as shown in Figure 6b. The RMSE values of predicted and actual vibration using the LSTM and GRU of normal motors are 0.1054 and 0.0822, respectively, and both approaches accurately predict future vibration waveforms. Additionally, Section 3.4. provides a more detailed comparative description of the RMSE and simulation time efficiency for each of the four motor conditions.
3.2.2. Motor with Low Power
This subsection presents an analysis of the predicted vibration from the vibration data collected from a low-power motor.
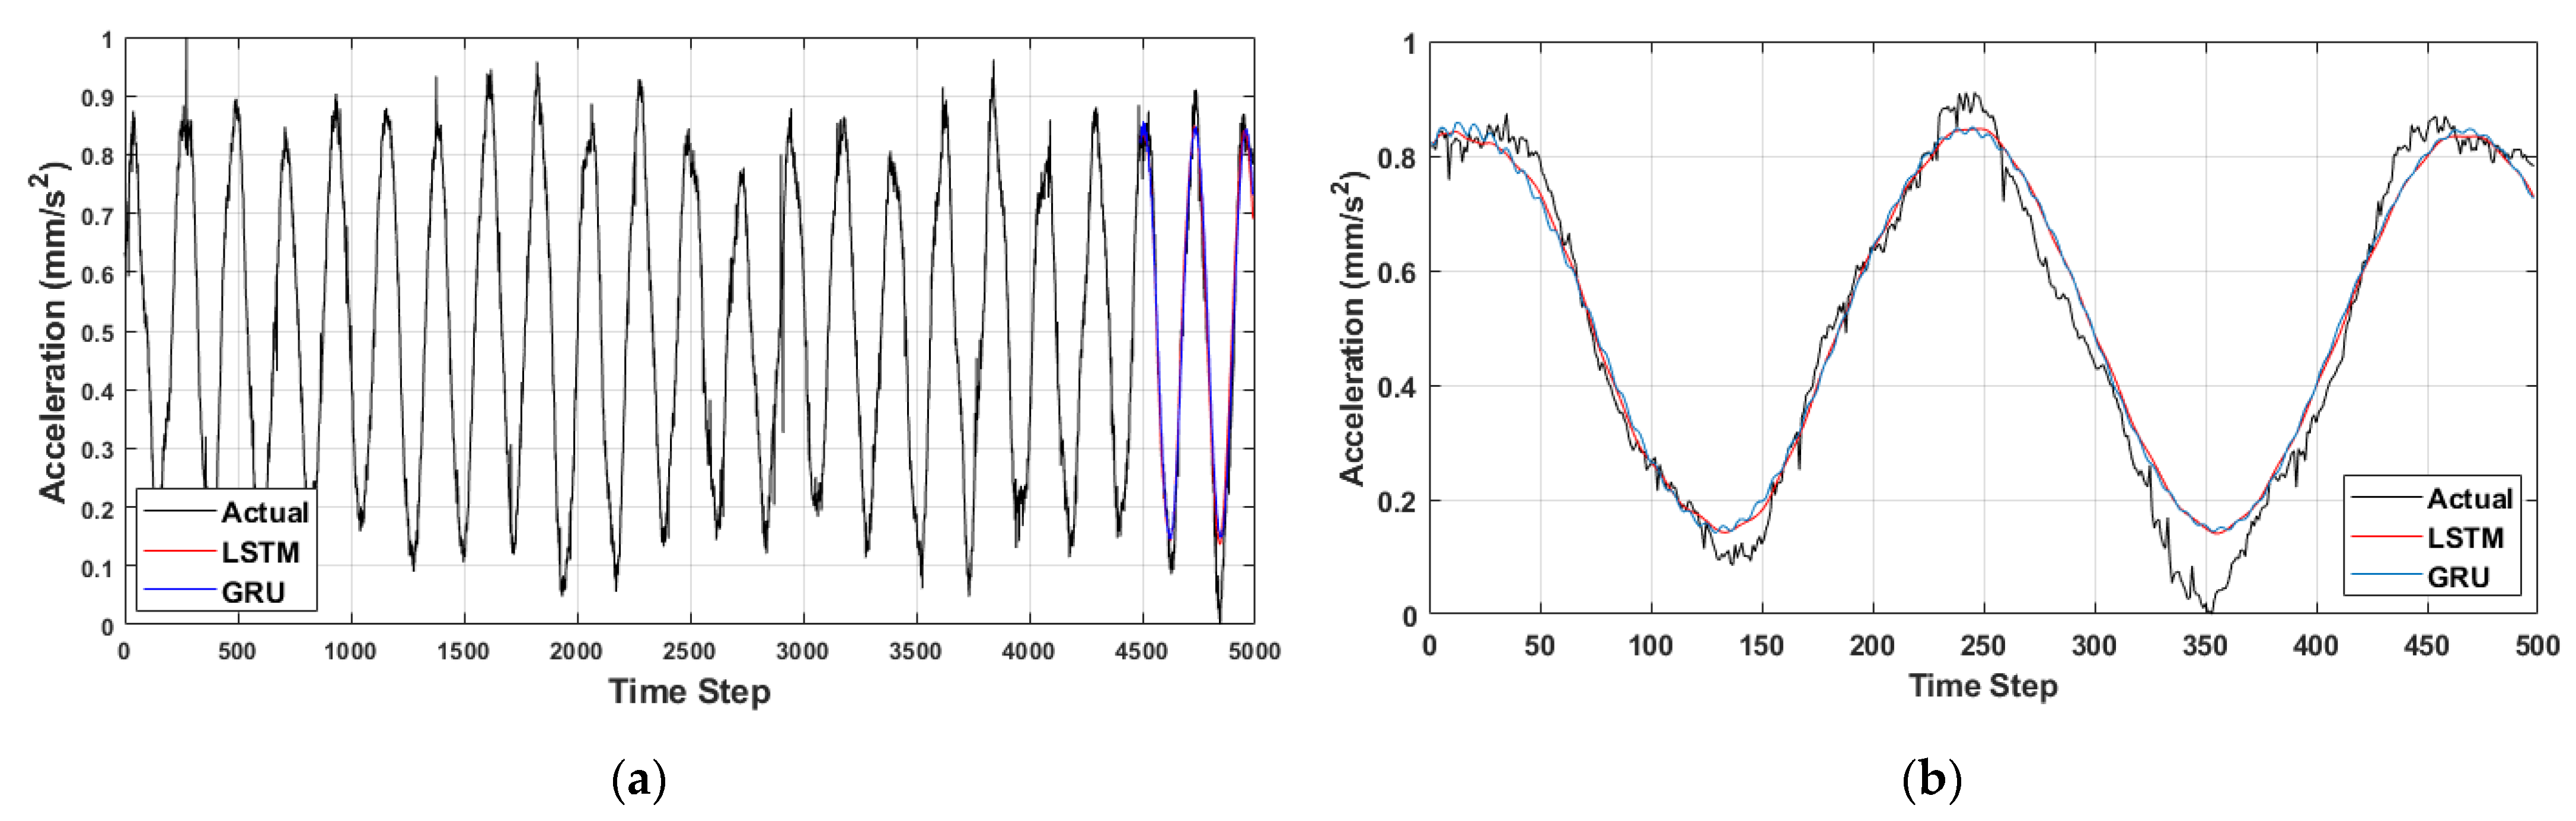
The black, red, and blue graphs in Figure 7a show the actual vibrations of the low-power motor and the vibrations predicted using LSTM and GRU, respectively. As shown in Figure 7b, it can be confirmed that the vibrations collected from the low-power motor have more severe residual vibration compared to Figure 6b, which shows the vibration graph of a normal motor.
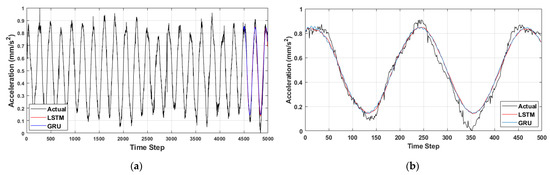
Figure 7.
Predicted vibration waveform of a motor with low power: (a) actual and predicted vibration waveforms; (b) magnified graph of the predicted vibration waveforms from 4500 to 5000 time step.
The RMSE values between the actual vibration value and the vibration value predicted using LSTM and GRU are 0.0595 and 0.0559, respectively, indicating that both approaches’ predicted vibration waveforms are similar to the actual vibration waveform.
3.2.3. Motor with a Bent Shaft
This subsection presents a comparative analysis of the vibration waveform predicted from the vibration data of the motor with a bent shaft. The comparison of the actual and predicted vibrations of the normal motor in Section 3.2.2. revealed that the predicted waveform’s period and acceleration values closely matched those of the actual waveform. However, the predicted vibration waveform of the motor with a bent shaft is discovered to be different from the waveform of the normal motor’s predicted vibration.
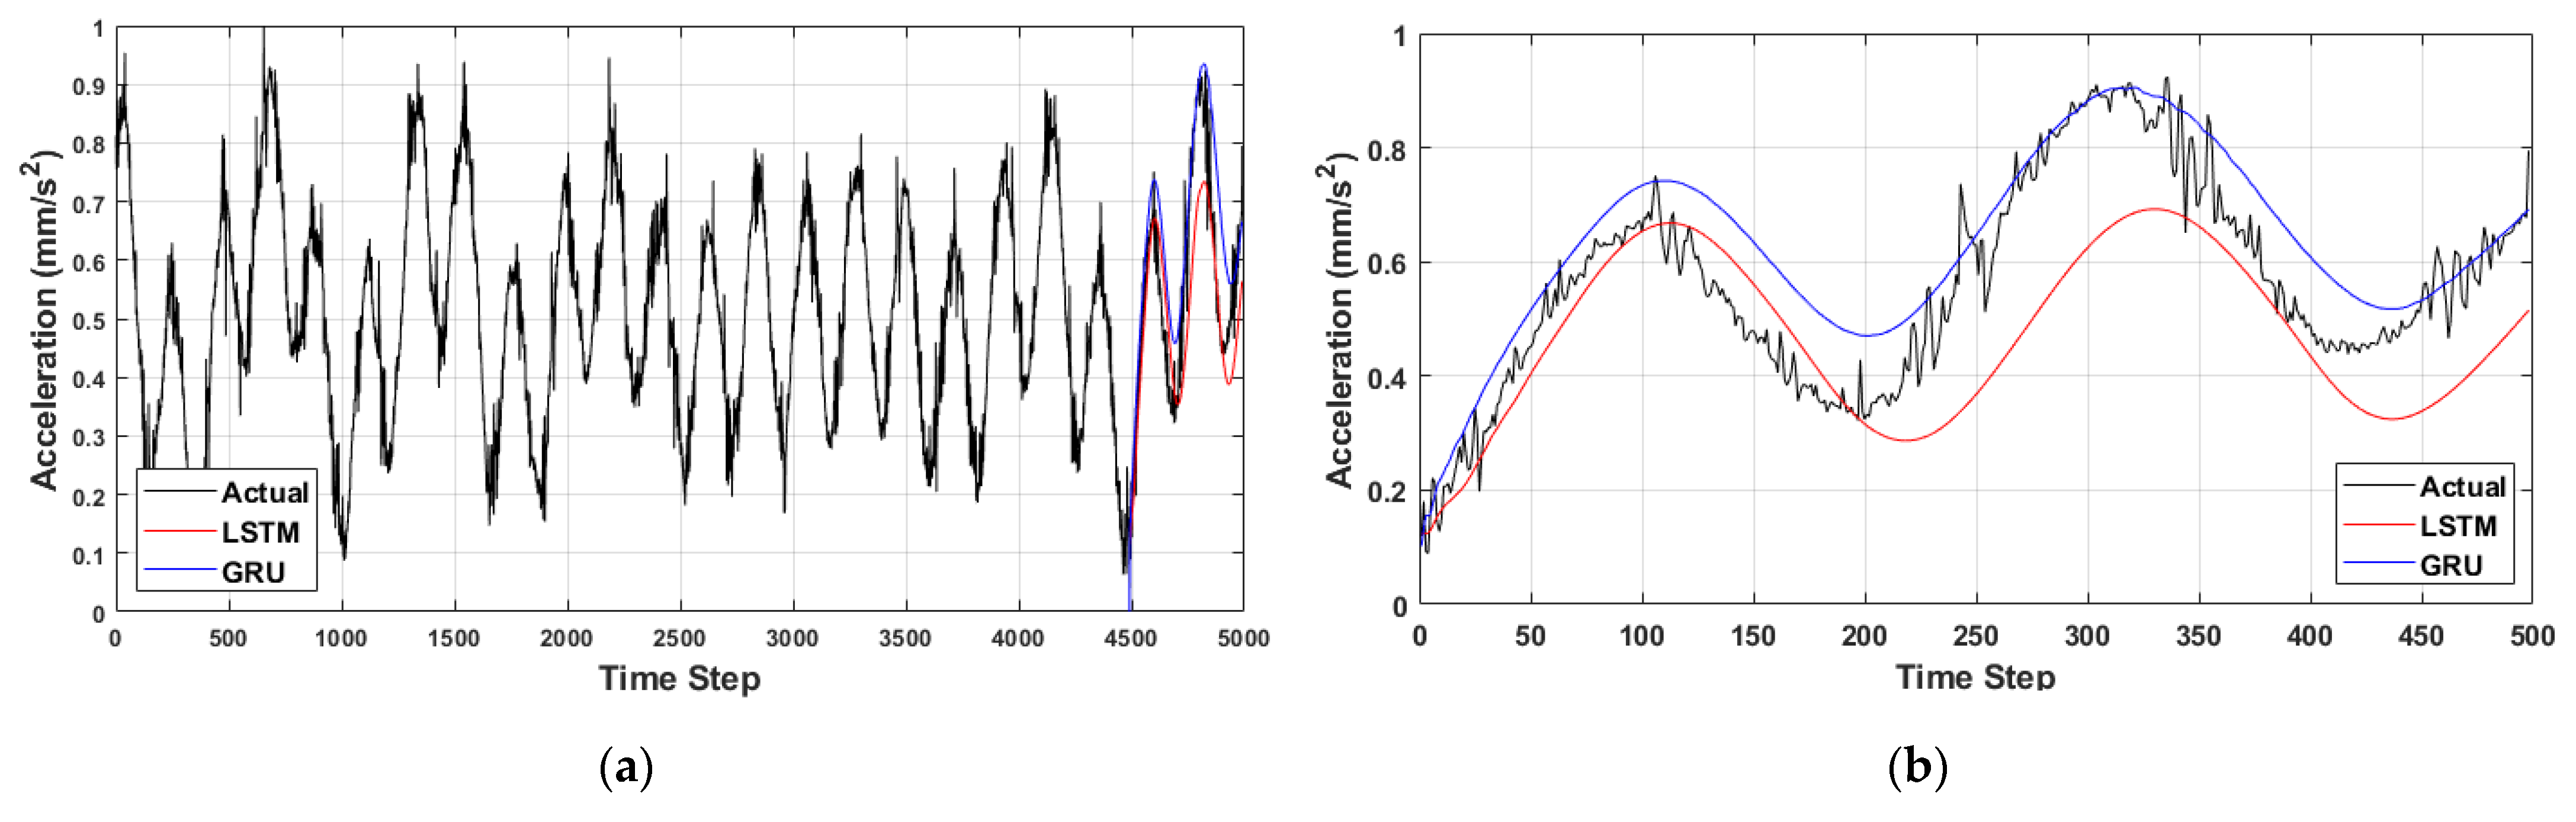
Figure 8a,b show that the vibration of the motor with a curved shaft is more severe and non-uniform than that of a general motor or a low-power motor. As shown in Figure 8b, the vibration of the damaged motor predicted through LSTM and GRU is not as accurate as of the normal motor or low-power motor. However, the RMSE values of the LSTM and GRU are 0.1567 and 0.1462, respectively, for the motor with a bent shaft, and both predicted vibration waveforms similar to the actual vibration values.
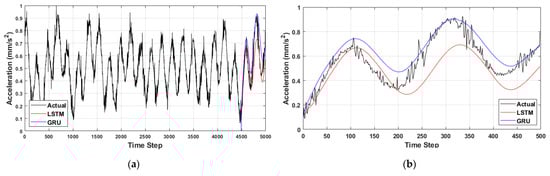
Figure 8.
Predicted vibration waveform of a motor with a bent shaft: (a) actual and predicted vibration waveforms; (b) magnified graph of the predicted vibration waveforms from 4500 to 5000 time steps.
3.2.4. Motor with a Damaged Rotor
This subsection analyzes the predicted vibration from the vibration data of the motor with a damaged rotor.
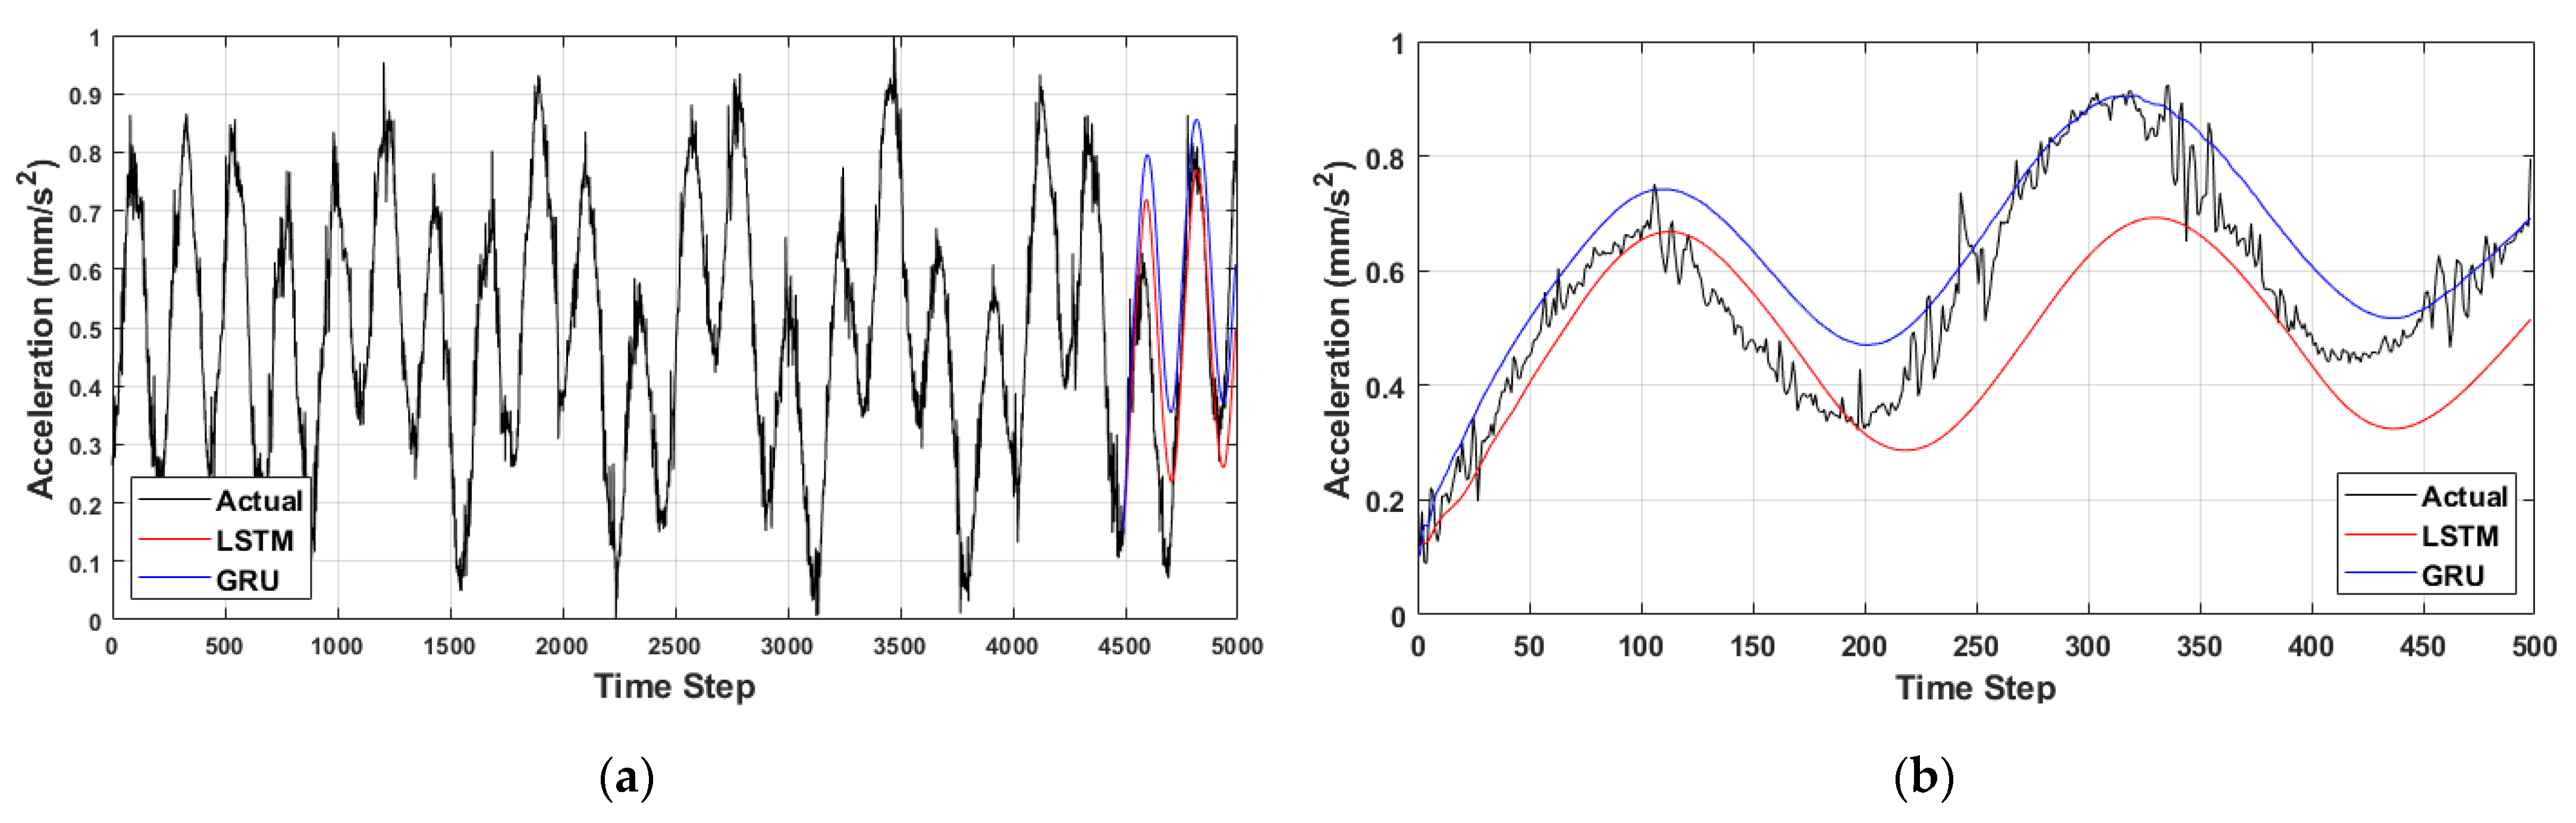
Figure 9a,b show the actual and predicted vibration waveforms of a motor with a damaged rotor. The vibration prediction result of the damaged motor is not as accurate as of the vibration forecasting result of the general motor or low-power motor, as shown in Figure 9a,b, and is similar to the predicted vibration result of the bent motor in Section 3.2.3. The RMSE values predicted through the LSTM and the GRU are 0.1514 and 0.1878, respectively. Compared to the previous simulation results, the RMSE value of the LSTM is lower than the RMSE value of the GRU only when the motor has a damaged rotor. Furthermore, the comparative analysis of the coefficient of determinations, , of four types of motors is described in Section 3.3.
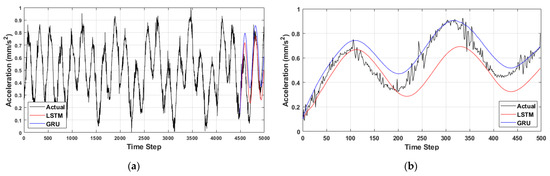
Figure 9.
Predicted vibration waveform of a motor with a damaged rotor: (a) actual and predicted vibration waveforms; (b) magnified graph of the predicted vibration waveforms from 4500 to 5000 time steps.
3.3. Comparison of Prediction Accuracy
In this subsection, the accuracy between the actual and predicted vibrations using LSTM and GRU are visualized in graphs for performance comparisons. In addition, the coefficient of determinations, , between the actual and predicted vibrations through LSTM and GRU are described for the four types of motors.
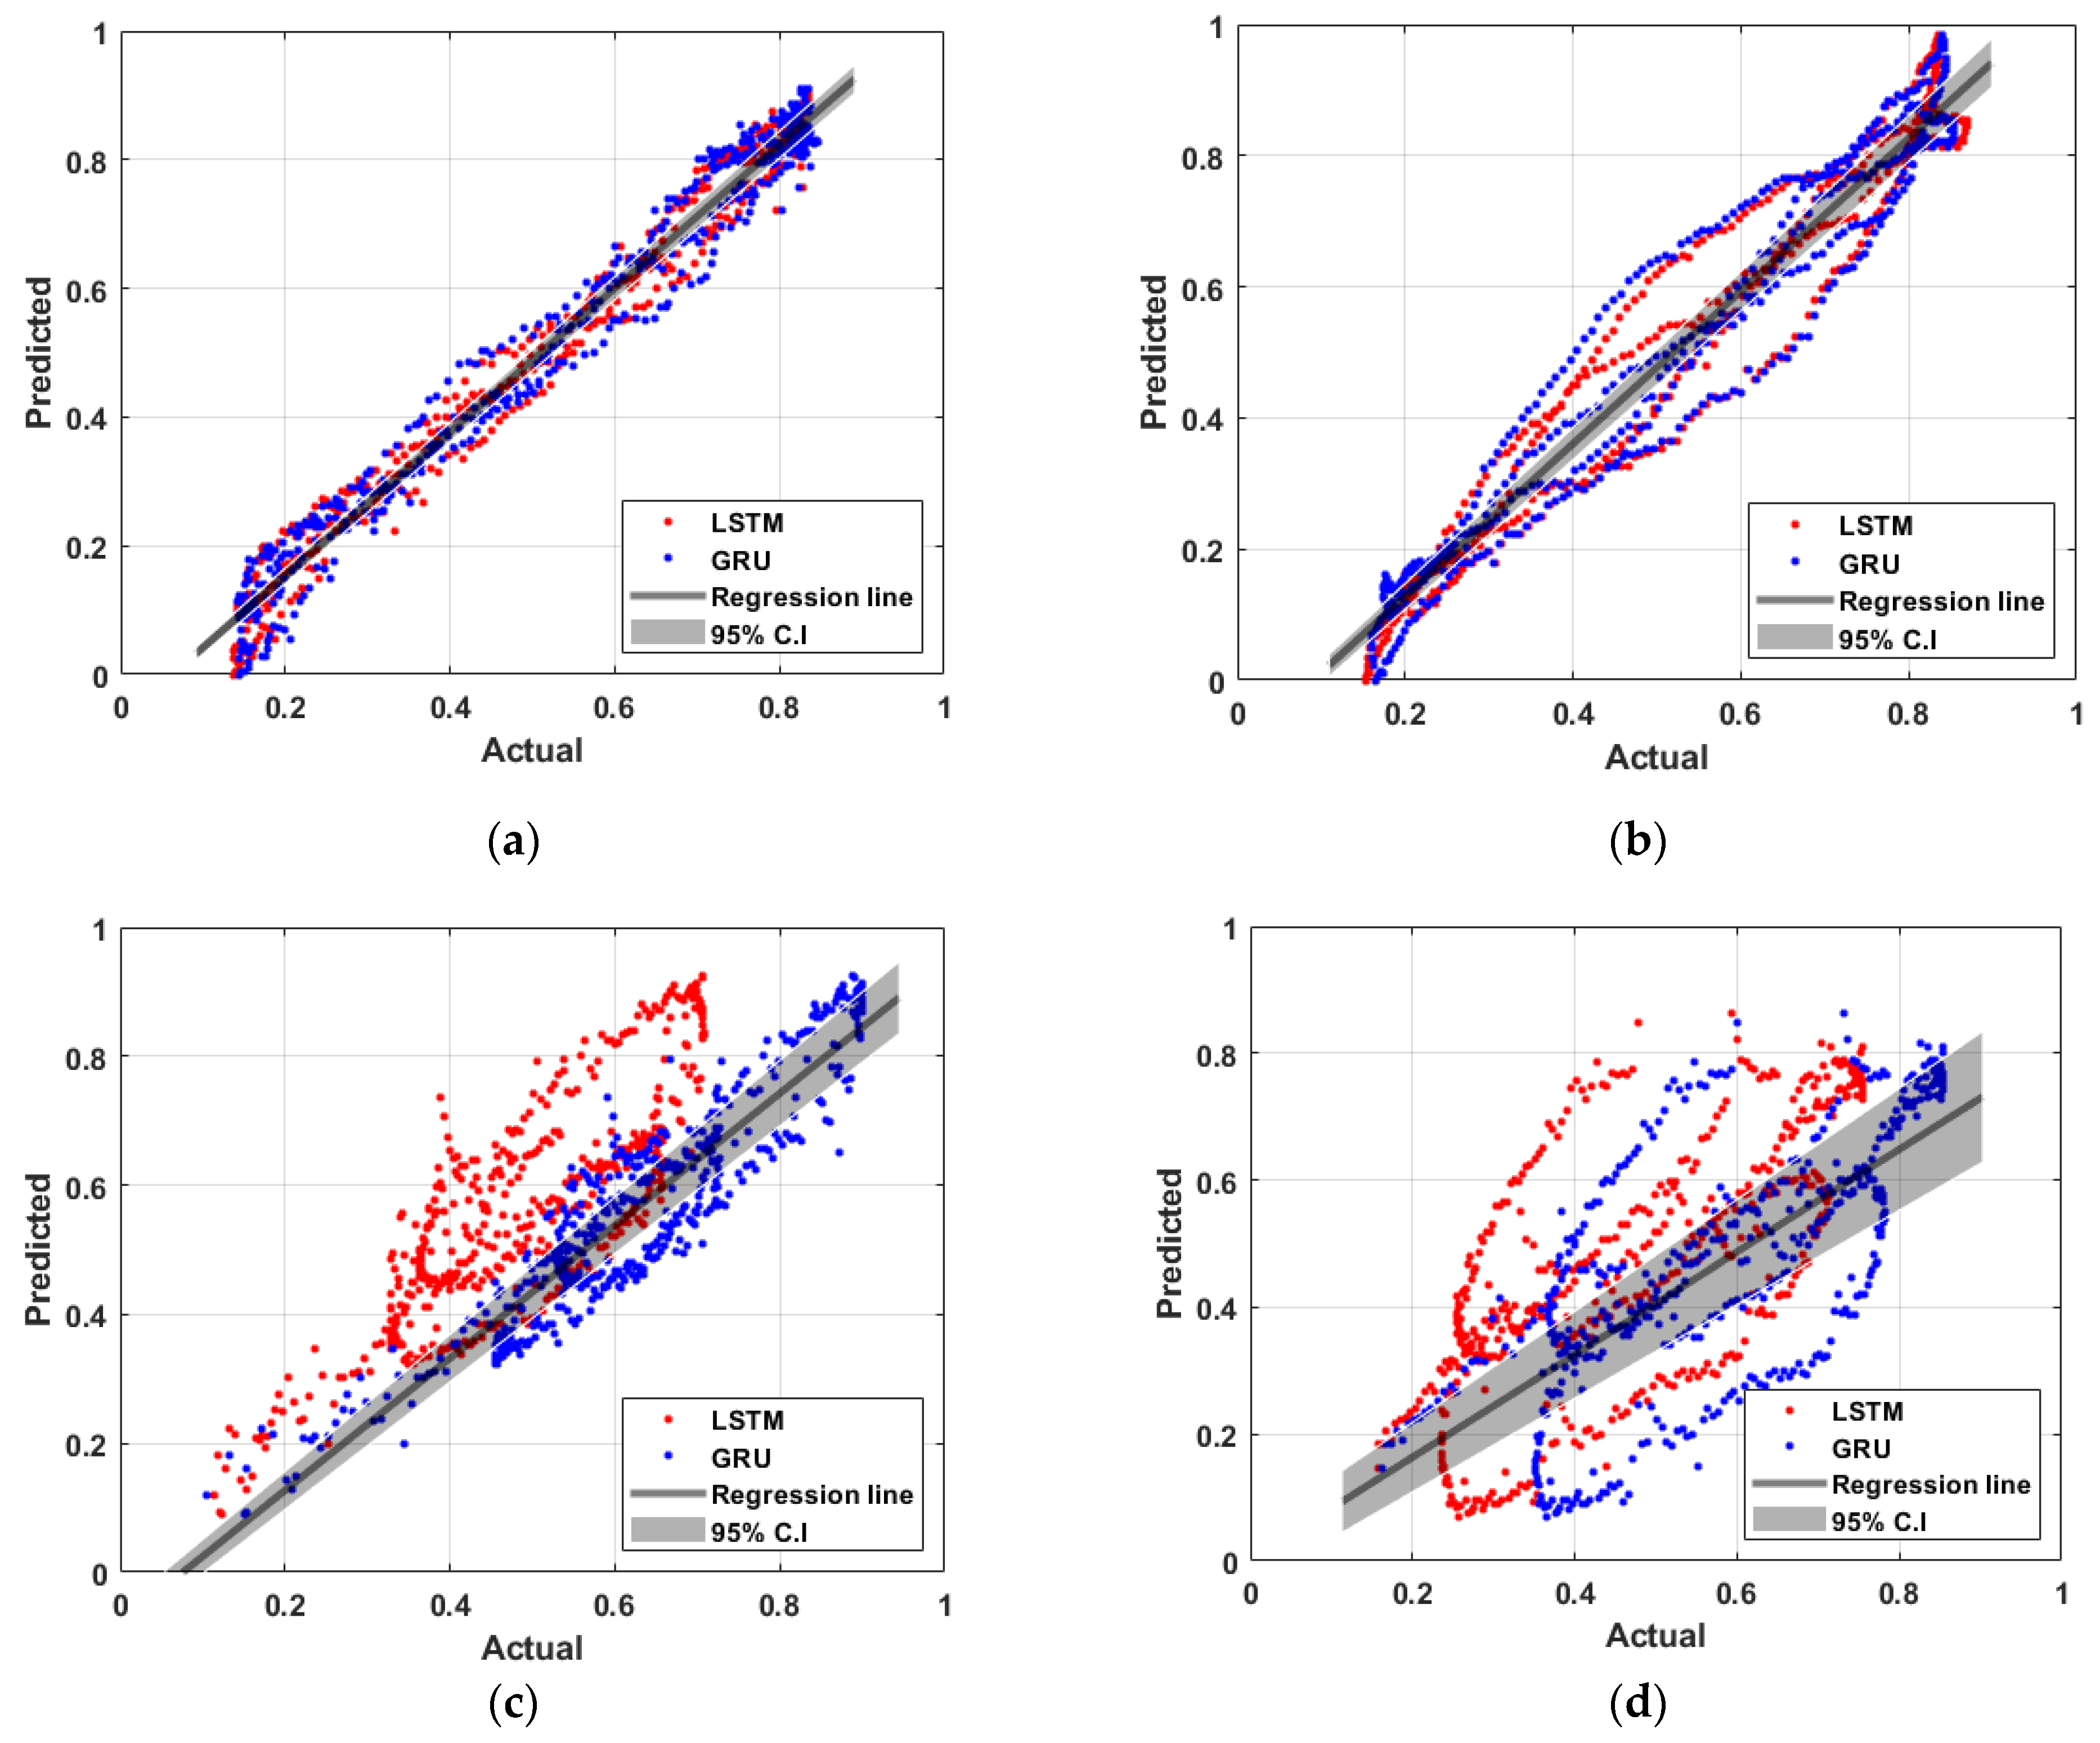
Figure 10 shows the regression curves with confidence intervals (C.I) from the actual and predicted vibrations. The shaded gray regions in Figure 11 show the 95% confidence level of the regression curves. The x- and y-axis of Figure 10 represent the actual vibration value and the predicted vibration value normalized to one, respectively.
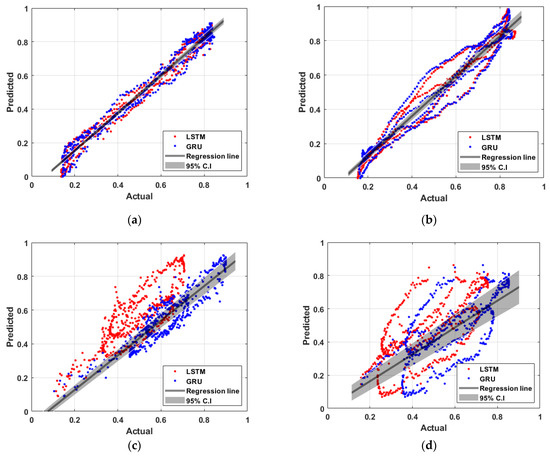
Figure 10.
Regression curves of: (a) a normal motor; (b) a motor with low power; (c) a motor with a bent shaft; (d) a motor with a damaged rotor.
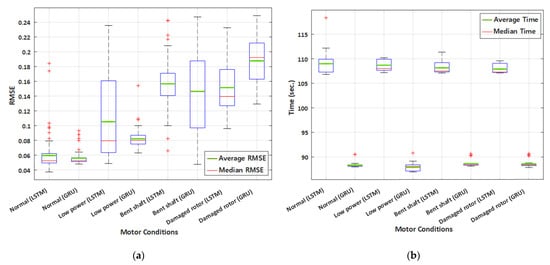
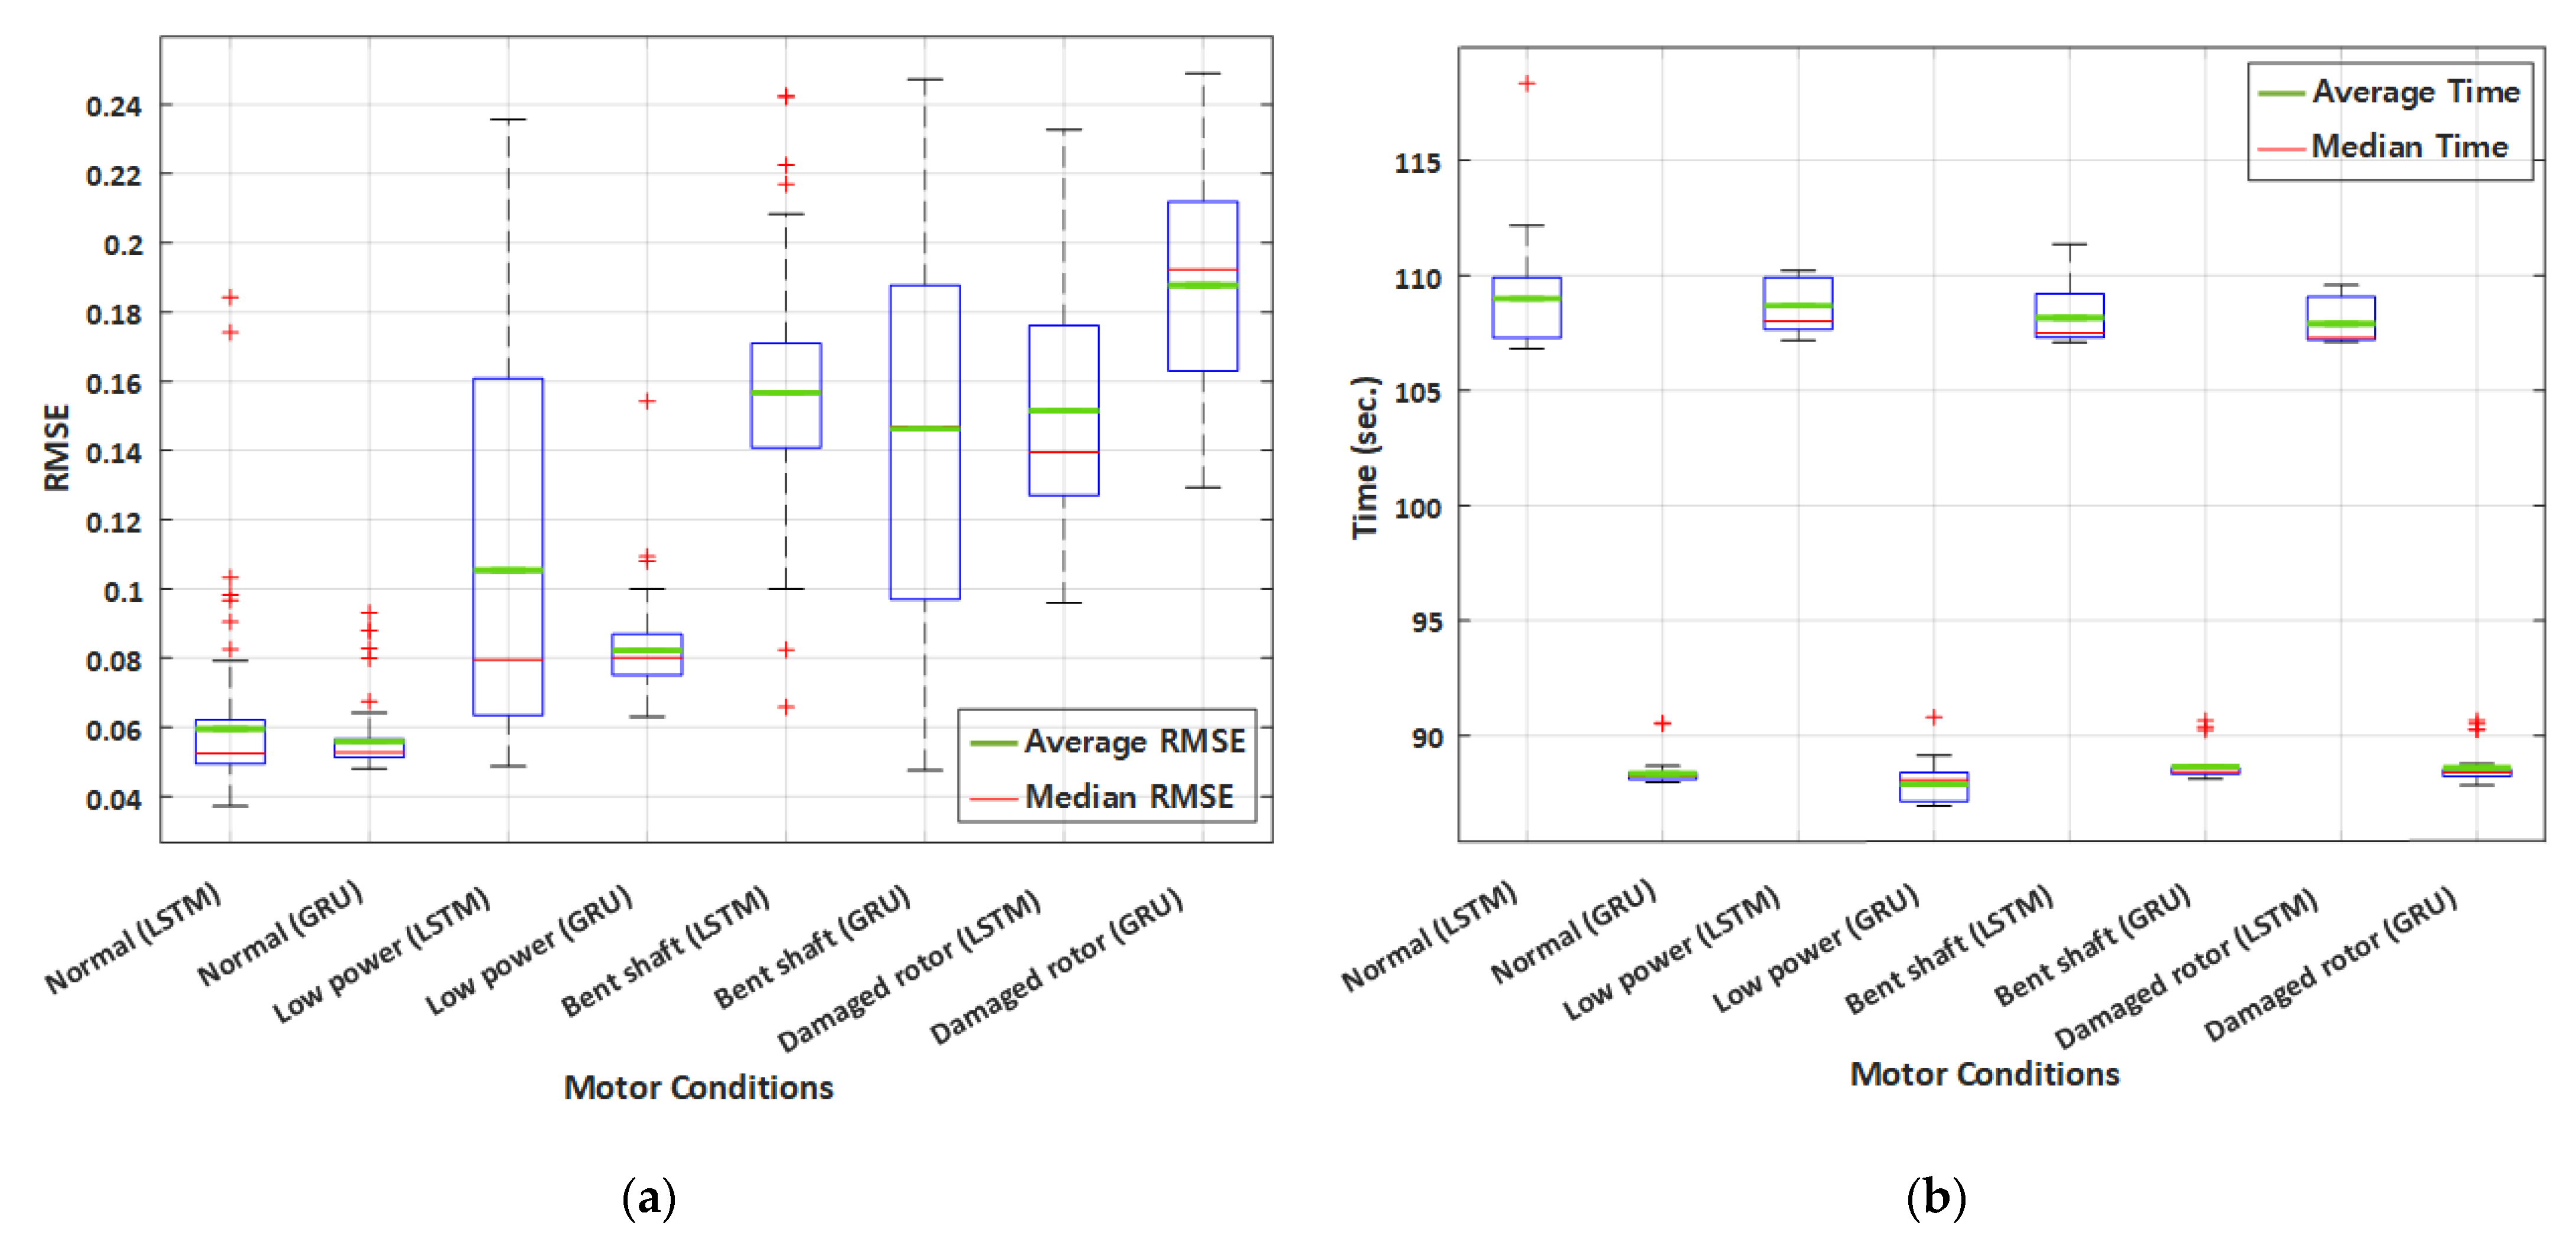
Figure 11.
Box plots of: (a) root mean square error (RMSE); (b) simulation time.
The predicted vibration values using LSTM and GRU are very close to the actual vibration values, as shown in Figure 10a, and all dots are located close to the line. Figure 10a shows that both LSTM and GRU predicted very close to the actual vibration value. Figure 10b shows similar results to Figure 10a, but the graph shows that the accuracy of the vibration values predicted by LSTM and GRU decreases due to its destabilization of the low-powered motor. Figure 10c shows that the vibration value predicted by the GRU is closer to the actual vibration value than the vibration value predicted by LSTM. Figure 10d shows that both LSTM and the GRU predict future vibrations with similar accuracy. Figure 10 shows that the confidence interval range of a normal motor is the narrowest and the value is the highest. However, the C.I range of the motor with a damaged rotor is the widest.
Table 4 shows the values between the actual vibration value and the vibration value predicted using LSTM and GRU.
Table 4.
Comparison of values.
The normal motor showed the highest value and the motor with a damaged rotor had the lowest value for both LSTM and the GRU, as shown in Table 4. These regression curves and values show that it is difficult to predict the future vibrations of abnormal motors due to their irregular vibrations.
3.4. Comparison of RMSE and Simulation Time
In this subsection, RMSE values between the predicted vibrations from LSTM and the GRU are comparatively analyzed to compare the performance of LSTM and GRU.
The red and green solid lines in the box represent the median and the average value of the predicted vibration data, respectively, as shown in Figure 11a,b. The average RMSE values of normal and low-powered motors are lower than those of motors with a bent shaft or a damaged rotor, as shown in Figure 11a. Additionally, when the changes in the power and amplitude of vibration are small, both LSTM and the GRU predict future vibrations more accurately.
Figure 11b shows box plots to compare the simulation time needed to predict the future vibration of the four motors using LSTM and GRU. As shown in Figure 11b, all interquartile ranges of simulation times of the GRU are shorter than LSTM due to their simplified structure. Furthermore, in the simulation of all four types of motors, the GRU’ average simulation speeds are faster than the LSTM’s. The quartile range of all the box plotted GRU is shorter because the internal structure is simpler than in LSTM, as shown in Figure 11b. Correspondingly, the GRU’ average simulation speeds are faster than the LSTM’s average simulation speed in all simulation scenarios.
Table 5 shows the average RMSE value calculated by LSTM and GRU for four types of motors. The difference in Table 5 indicates the difference between the average RMSE of the LSTM and the GRU, and the RMSE values of the GRU are lower than the RMSE values of the LSTM, except for the prediction of the future vibration of the motor with the damaged rotor. In addition, the average value of the difference between the RMSEs of LSTM and GRU is 0.0184, and both LSTM and GRU predict future vibrations very accurately. However, as a result of comparing the RMSE and simulation time, the RMSE values of the predicted values by LSTM and GRU are similar, but GRU increase the time efficiency by an average of 22.79% due to their simper structures compared to LSTM.
Table 5.
Comparison of coefficients of determinations, , of four types of motors.
4. Conclusions
In this study, an approach for forecasting vibration in the time domain is proposed for predicting future vibration waveforms using the vibration data from a drone’s motor. To compare the forecasting performance between LSTM and GRU, LSTM and GRU train 90% of the 5000 vibration data obtained from four types of motor conditions to predict the remaining 10% of future vibrations. The following conclusions are drawn from the simulation results:
- (1)
- In normal vibration, the value between the vibration value predicted using LSTM and GRU is the highest and the value decreases as the motor vibrates irregularly;
- (2)
- GRU showed lower average RMSE values than LSTM in a normal motor, a motor with low power, and a motor with a bent shaft, excluding a motor with a damaged rotor, but the difference is very small;
- (3)
- Both GRU and LSTM accurately predict future vibrations, but GRU predict future vibrations at an average speed of about 22.79% faster than LSTM.
The simulation results such as and RMSE show that both LSTM and GRU have outstanding performance in forecasting future vibration waveforms. However, GRU forecast future vibrations about 22.79% faster than LSTM. The reason for this result is that GRU use a simpler structure than LSTM to predict future vibration waveforms. Meanwhile, it is anticipated that this study can be used to help predict motor-condition management and reduce consequential falling accidents caused by motors abnormalities. Furthermore, this study focused on the study of predicting future vibrations using LSTM and GRU by collecting vibration data in the time domain. For more efficient vibration prediction and vibration abnormality detection in the future, research will be conducted to convert the time series vibration data into the frequency domain using fast Fourier transform (FFT) in order to detect vibration abnormality in both the time domain and frequency domain.
Funding
This research received no external funding.
Data Availability Statement
Not applicable.
Conflicts of Interest
The authors declare no conflict of interest.
References
- Genc, H.; Zu, Y.; Chin, T.-W.; Halpern, M.; Reddi, V.J. Flying IoT: Toward Low-Power Vision in the Sky. IEEE Micro. 2017, 37, 40–51. [Google Scholar] [CrossRef]
- Gupta, L.; Jain, R.; Vaszkun, G. Survey of Important Issues in UAV Communication Networks. IEEE Commun. Surv. Tuts. 2016, 18, 1123–1152. [Google Scholar] [CrossRef] [Green Version]
- Yao, P.; Zhu, Q.; Zhao, R. Gaussian Mixture Model and Self-Organizing Map Neural-Network-Based Coverage for Target Search in Curve-Shape Area. IEEE Trans. Cybern. 2020, 1–13. [Google Scholar] [CrossRef] [PubMed]
- Yao, P.; Xie, Z.; Ren, P. Optimal UAV Route Planning for Coverage Search of Stationary Target in River. IEEE Trans. Control Syst. Technol. 2019, 27, 822–829. [Google Scholar] [CrossRef]
- Agha-mohammadi, A.; Ure, N.K.; How, J.P.; Vian, J. Health Aware Stochastic Planning for Persistent Package Delivery Missions using Quadrotors. In Proceedings of the 2014 IEEE/RSJ International Conference on Intelligent Robots and Systems, Chicago, IL, USA, 14–18 September 2014; pp. 3389–3396. [Google Scholar]
- Yao, P.; Wang, H.; Ji, H. Gaussian Mixture Model and Receding Horizon Control for Multiple UAV Search in Complex Environment. Nonlinear Dyn. 2017, 88, 903–919. [Google Scholar] [CrossRef]
- Stodola, P.; Drozd, J.; Mazal, J.; Hodický, J.; Procházka, D. Cooperative Unmanned Aerial System Reconnaissance in a Complex Urban Environment and Uneven Terrain. Sensors 2019, 19, 3754. [Google Scholar] [CrossRef] [Green Version]
- Guo, Y.; Guo, J.; Liu, C.; Xiong, H.; Chai, L.; He, D. Precision Landing Test and Simulation of the Agricultural UAV on Apron. Sensors 2020, 20, 3369. [Google Scholar] [CrossRef]
- Mazzia, V.; Comba, L.; Khaliq, A.; Chiaberge, M.; Gay, P. UAV and Machine Learning Based Refinement of a Satellite-Driven Vegetation Index for Precision Agriculture. Sensors 2020, 20, 2530. [Google Scholar] [CrossRef]
- Schroth, L. The Drone Market Size 2020–2025: 5 Key Takeaways; Drone Industry Insights UG: Hamburg, Germany, 2020. [Google Scholar]
- Product Safety Team. Drone Safety Status Survey Results; Korea Consumer Agency: Chungbuk Innovation City, Korea, 2017. [Google Scholar]
- Bengio, Y.; Simard, P.; Frasconi, P. Learning Long-term Dependencies with Gradient Descent is Difficult. IEEE Trans. Neural Netw. 1994, 5, 157–166. [Google Scholar] [CrossRef]
- Hochreiter, S.; Schmidhuber, J. Long Short-term Memory. Neural Comput. 1997, 9, 1735–1780. [Google Scholar] [CrossRef]
- Chung, J.; Gülçehre, Ç.; Cho, K.; Bengio, Y. Empirical Evaluation of Gated Recurrent Neural Networks on Sequence Modeling. In Proceedings of the NIPS 2014 Workshop on Deep Learning, Montreal, QC, Canada, 8–13 December 2014. [Google Scholar]
- Guo, D.; Zhong, M.; Ji, H.; Liu, Y.; Yang, R. A Hybrid Feature Model and Deep Learning based Fault Diagnosis for Unmanned Aerial Vehicle Sensors. Neurocomputing 2018, 319, 155–163. [Google Scholar] [CrossRef]
- Xiao, L.; Sun, D.; Liu, Y.; Huang, Y. A Combined Method Based on Expert System and BP Neural Network for UAV Systems Fault Diagnosis. In Proceedings of the 2010 International Conference on Artificial Intelligence and Computational Intelligence, Sanya, China, 23–24 October 2010; pp. 23–24. [Google Scholar]
- Wang, Z.; Qian, H.; Zhang, D.; Wei, Y. Prediction Model Design for Vibration Severity of Rotating Machine Based on Sequence-to-Sequence Neural Network. Math. Probl. Eng. 2019, 2019, 4670982. [Google Scholar] [CrossRef]
- Zhang, X.; Zhao, Z.; Wang, Z.; Wang, X. Fault Detection and Identification Method for Quadcopter Based on Airframe Vibration Signals. Sensors 2021, 21, 581. [Google Scholar] [CrossRef] [PubMed]
- Glowacz, A.; Glowacz, W.; Kozik, J.; Piech, K.; Gutten, M.; Caesarendra, W.; Liu, H.; Brumercik, F.; Irfan, M.; Khan, Z.F. Detection of Deterioration of Three-phase Induction Motor Using Vibration Signals. Meas. Sci. Rev. 2019, 19, 241–249. [Google Scholar] [CrossRef] [Green Version]
- Om, S.-Y.; Park, J.; Kim, Y.-H. Implementation of Abnormality Diagnosis System for Drone Power Unit by Using Vibration Sensor. J. Korean Inst. Inf. Technol. 2020, 18, 69–76. [Google Scholar] [CrossRef]
- Khan, T.; Alekhya, P.; Seshadrinath, J. Incipient Inter-turn Fault Diagnosis in Induction Motors using CNN and LSTM based Methods. In Proceedings of the 2018 IEEE Industry Applications Society Annual Meeting, Portland, OR, USA, 23–27 September 2018; pp. 1–6. [Google Scholar]
- Tian, H.; Ren, D.; Li, K.; Zhao, Z. An Adaptive Update Model based on improved Long Short Term Memory for Online Prediction of Vibration Signal. J. Intell. Manuf. 2020, 32, 37–49. [Google Scholar] [CrossRef]
- Xiao, D.; Huang, Y.; Zhang, X.; Shi, H.; Liu, C.; Li, Y. Fault Diagnosis of Asynchronous Motors Based on LSTM Neural Network. In Proceedings of the 2018 Prognostics and System Health Management Conference, Chongqing, China, 26–28 October 2018; pp. 540–545. [Google Scholar]
- Hong, J.-K.; Lee, Y.-K. LSTM-based Anomal Motor Vibration Detection. In Proceedings of the 21st ACIS International Winter Conference on Software Engineering, Artificial Intelligence, Networking and Parallel/Distributed Computing, Kanazawa, Japan, 20–22 June 2021; pp. 98–99. [Google Scholar]
- ElSaid, A.; Wild, B.; Higgins, J.; Desell, T. Using LSTM Recurrent Neural Networks to Predict Excess Vibration Events in Aircraft Engines. In Proceedings of the 2016 IEEE 12th International Conference on e-Science, Baltimore, MD, USA, 23–27 October 2016; pp. 260–269. [Google Scholar]
- Wang, R.; Feng, Z.; Huang, S.; Fang, X.; Wang, J. Research on Voltage Waveform Fault Detection of Miniature Vibration Motor Based on Improved WP-LSTM. Micromachines 2020, 11, 753. [Google Scholar] [CrossRef]
- Liang, J.; Wang, L.; Wu, J.; Liu, Z.; Yu, G. Prediction of Spindle Rotation Error through Vibration Signal based on Bi-LSTM Classification Network. 2021 IOP Conf. Ser. Mater. Sci. Eng. 2021, 1043, 1–11. [Google Scholar] [CrossRef]
- Yang, Y.; Qin, N.; Huang, D.; Fu, Y. Fault Diagnosis of High-Speed Railway Bogies Based on LSTM. In Proceedings of the 2018 5th International Conference on Information, Cybernetics, and Computational Social Systems, Hangzhou, China, 16–19 August 2018; pp. 393–398. [Google Scholar]
- Xiao, D.; Huang, Y.; Qin, C.; Shi, H.; Li, Y. Fault Diagnosis of Induction Motors Using Recurrence Quantification Analysis and LSTM with Weighted BN. Shock Vib. 2019, 2019, 8325218. [Google Scholar] [CrossRef] [Green Version]
- Zhu, J.; Ma, H.; Ji, L.; Zhuang, J.; Wang, J.; Liu, B. Vibration Trend Prediction of Pumped Storage Units based on VMD and GRU. In Proceedings of the 2020 5th International Conference on Mechanical, Control and Computer Engineering 2020, Harbin, China, 25–27 December 2020; pp. 180–183. [Google Scholar]
- Lee, K.; Kim, J.-K.; Kim, J.; Hur, K.; Kim, H. CNN and GRU Combination Scheme for Bearing Anomaly Detection in Rotating Machinery Health Monitoring. In Proceedings of the 2018 1st IEEE International Conference on Knowledge Innovation and Invention (ICKII), Jeju Island, Korea, 23–27 July 2018; pp. 102–105. [Google Scholar]
- Ma, M.; Mao, Z. Deep Wavelet Sequence-Based Gated Recurrent Units for the Prognosis of Rotating Machinery. Struct. Health Monit. 2021, 4, 1794–1804. [Google Scholar] [CrossRef]
- Zhao, K.; Shao, H. Intelligent Fault Diagnosis of Rolling Bearing Using Adaptive Deep Gated Recurrent Unit. Neural Processing Letters 2020, 51, 1165–1184. [Google Scholar] [CrossRef]
- Zhao, K.; Jiang, H.; Li, X.; Wang, R. An Optimal Deep Sparse Autoencoder with Gated Recurrent Unit for Rolling Bearing Fault Diagnosis. Meas. Sci. Technol. 2019, 31, 015005. [Google Scholar] [CrossRef]
- Li, X.; Li, J.; Qu, Y.; He, D. Gear Pitting Fault Diagnosis Using Integrated CNN and GRU Network with Both Vibration and Acoustic Emission Signals. Appl. Sci. 2019, 9, 768. [Google Scholar] [CrossRef] [Green Version]
- Yuan, M.; Wu, Y.; Lin, L. Fault Diagnosis and Remaining Useful Life Estimation of Aero Engine using LSTM Neural Network. In Proceedings of the 2016 IEEE international conference on aircraft utility systems (AUS), Beijing, China, 10–12 October 2016; pp. 135–140. [Google Scholar]
- Demidova, L.A. Recurrent Neural Networks’ Configurations in the Predictive Maintenance Problems. IOP Conf. Ser. Mater. Sci. Eng. 2020, 714, 012005. [Google Scholar] [CrossRef]
- Naren, R.; Subhashini, J. Comparison of Deep Learning Models for Predictive Maintenance. IOP Conf. Ser. Mater. Sci. Eng. 2020, 912, 022029. [Google Scholar] [CrossRef]
- Chen, B.; Peng, Y.; Gu, B.; Luo, Y.; Liu, D. A Fault Detection Method Based on Enhanced GRU. In Proceedings of the 2021 International Conference on Sensing, Measurement & Data Analytics in the era of Artificial Intelligence (ICSMD), Nanjing, China, 21–23 October 2021; pp. 1–4. [Google Scholar]
- Kingma, D.P.; Ba, J. Adam: A Method for Stochastic Optimization. In Proceedings of the 3rd International Conference for Learning Representations, San Diego, CA, USA, 7–9 May 2015. [Google Scholar]

Publisher’s Note: MDPI stays neutral with regard to jurisdictional claims in published maps and institutional affiliations. |
© 2022 by the author. Licensee MDPI, Basel, Switzerland. This article is an open access article distributed under the terms and conditions of the Creative Commons Attribution (CC BY) license (https://creativecommons.org/licenses/by/4.0/).