Review

A Different Approach for Maximum Power Point Tracking (MPPT) Using Impedance Matching through Non-Isolated DC-DC Converters in Solar Photovoltaic Systems

1
Department of Electrical & Electronics Engineering, Jaipur Campus, Birla Institute of Technology Mesra, Jaipur 302017, India
2
Department of Electrical Engineering, Maulana Azad National Institute of Technology, Bhopal 462003, India
3
Department of Electrical & Electronics Engineering, Trinity Institute of Technology and Research, Bhopal 462021, India
4
Department of Electrical Engineering, Madhav Institute of Technology & Science, Gwalior 474005, India
*
Author to whom correspondence should be addressed.
Electronics 2022, 11(7), 1053; https://doi.org/10.3390/electronics11071053
Submission received: 9 January 2022 / Revised: 24 February 2022 / Accepted: 25 February 2022 / Published: 27 March 2022

Abstract

:
This paper presents a maximum power point tracking (MPPT) algorithm in a solar photovoltaic (SPV) system that requires fewer sensors, is easy to implement, and offers a good tracking efficiency and speed. Among various MPPT algorithms found in literature, the perturb and observe (P&O) algorithm is most popular as it required less complex circuitry and is easy to implement, but it suffers against fast-changing environmental conditions mostly in the case of partial shading conditions and requires two sensors, i.e., voltage and current. This paper presents the one sensor-based method based on the modified converter design which eliminates the effect of partial shading conditions as well as the fast-changing environmental condition. The presented MPPT algorithm was implemented and tested using an FPGA-based NI-sbRIO card interfaced with Labview software.

1. Introduction

In the following decade, energy demand has surged enormously worldwide. This resulted in an arduous challenge of gush in energy demand as a result of overall socio-economic growth [1]. Prominent among prevailing renewables, the photovoltaic cell (solar PV) is on the leading edge [2], but the efficiency of the solar PV structure is not adequate so as to boost the efficiency; it must be driven at a point where we can extort the utmost potential power from it. Current literature reveals that research exertions are being made to boost the output of modules in the context of MPPT. The characteristics of an SPV module are non-linear and its power vs. voltage characteristics indicate that there subsists a solitary point (Pm) at which the module delivers maximum power [3]. The point Pm deviates due to change in temperature and/or insolation [4,5]. Consequently, the mismatch between the source and load characteristics lessens the availability of the utmost potential accessible power transmitted to the load, leading to huge power losses. To minimize power loss, the MPPT algorithm ensures that the impedance of the source will be equal to or near to the load impedance which is done by the DC-DC converter. Classification and comparison of MPPT techniques are also available in the literature [6,7,8]. MPPT techniques in solar photovoltaic systems under uniform insolation [9,10,11] and partially shaded conditions [12,13,14] are also compared in the literature.

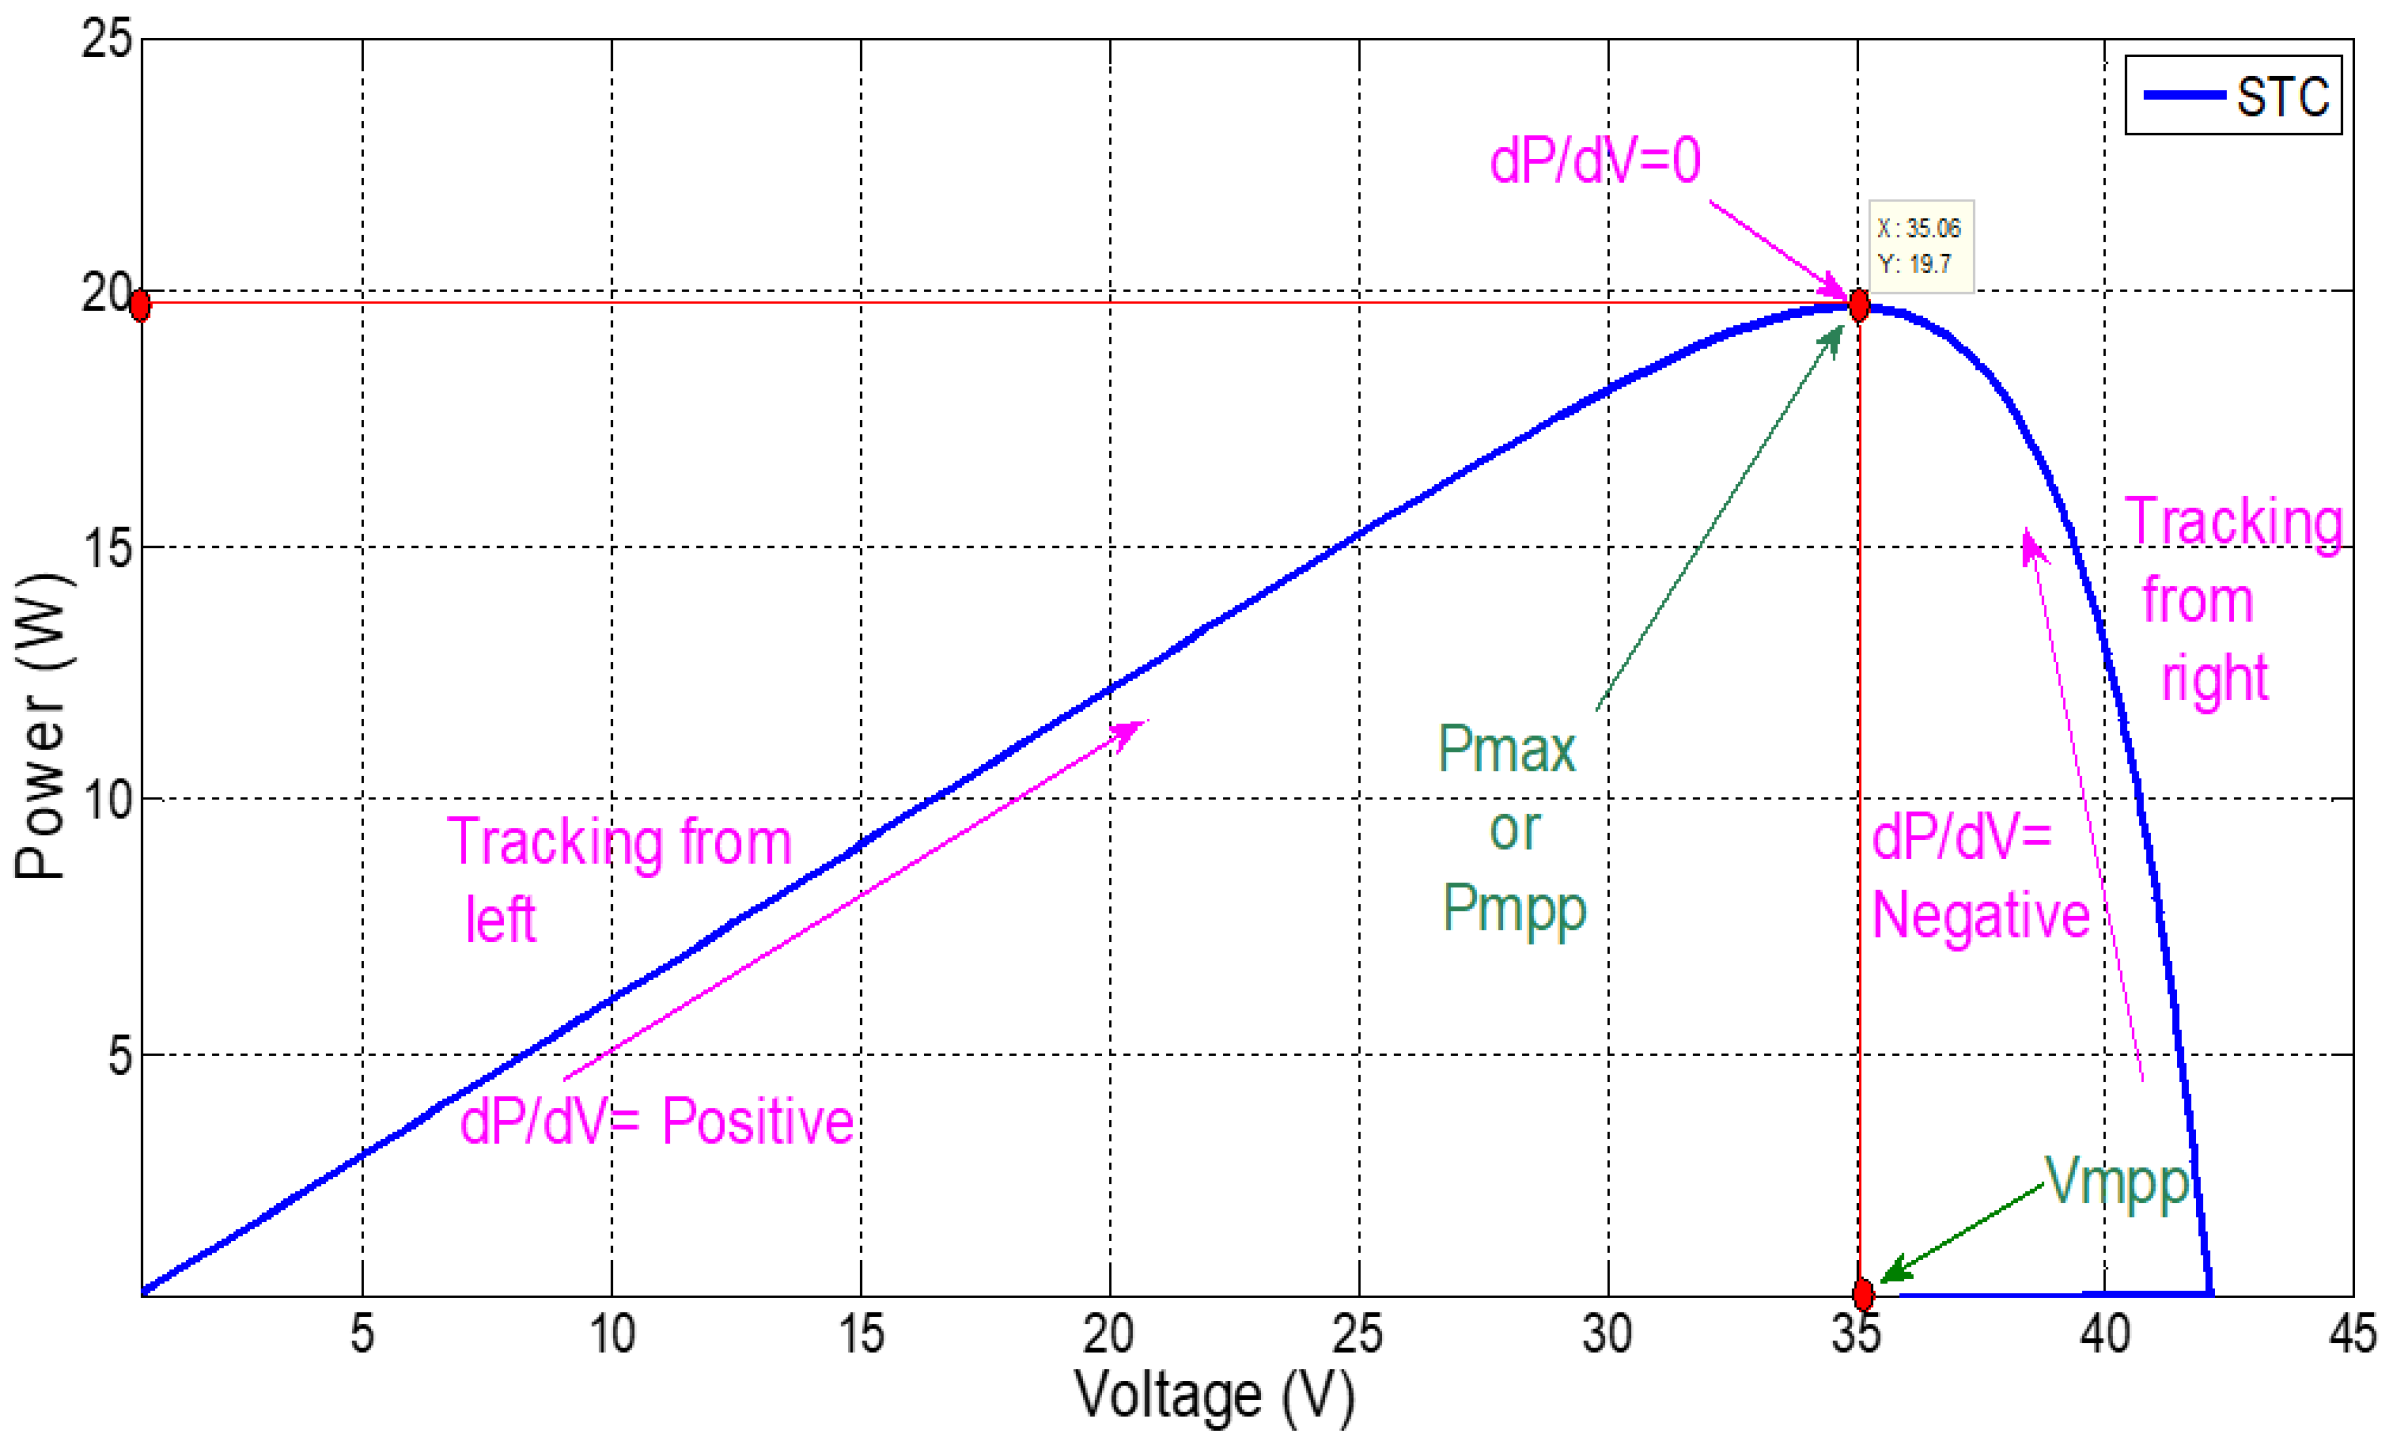
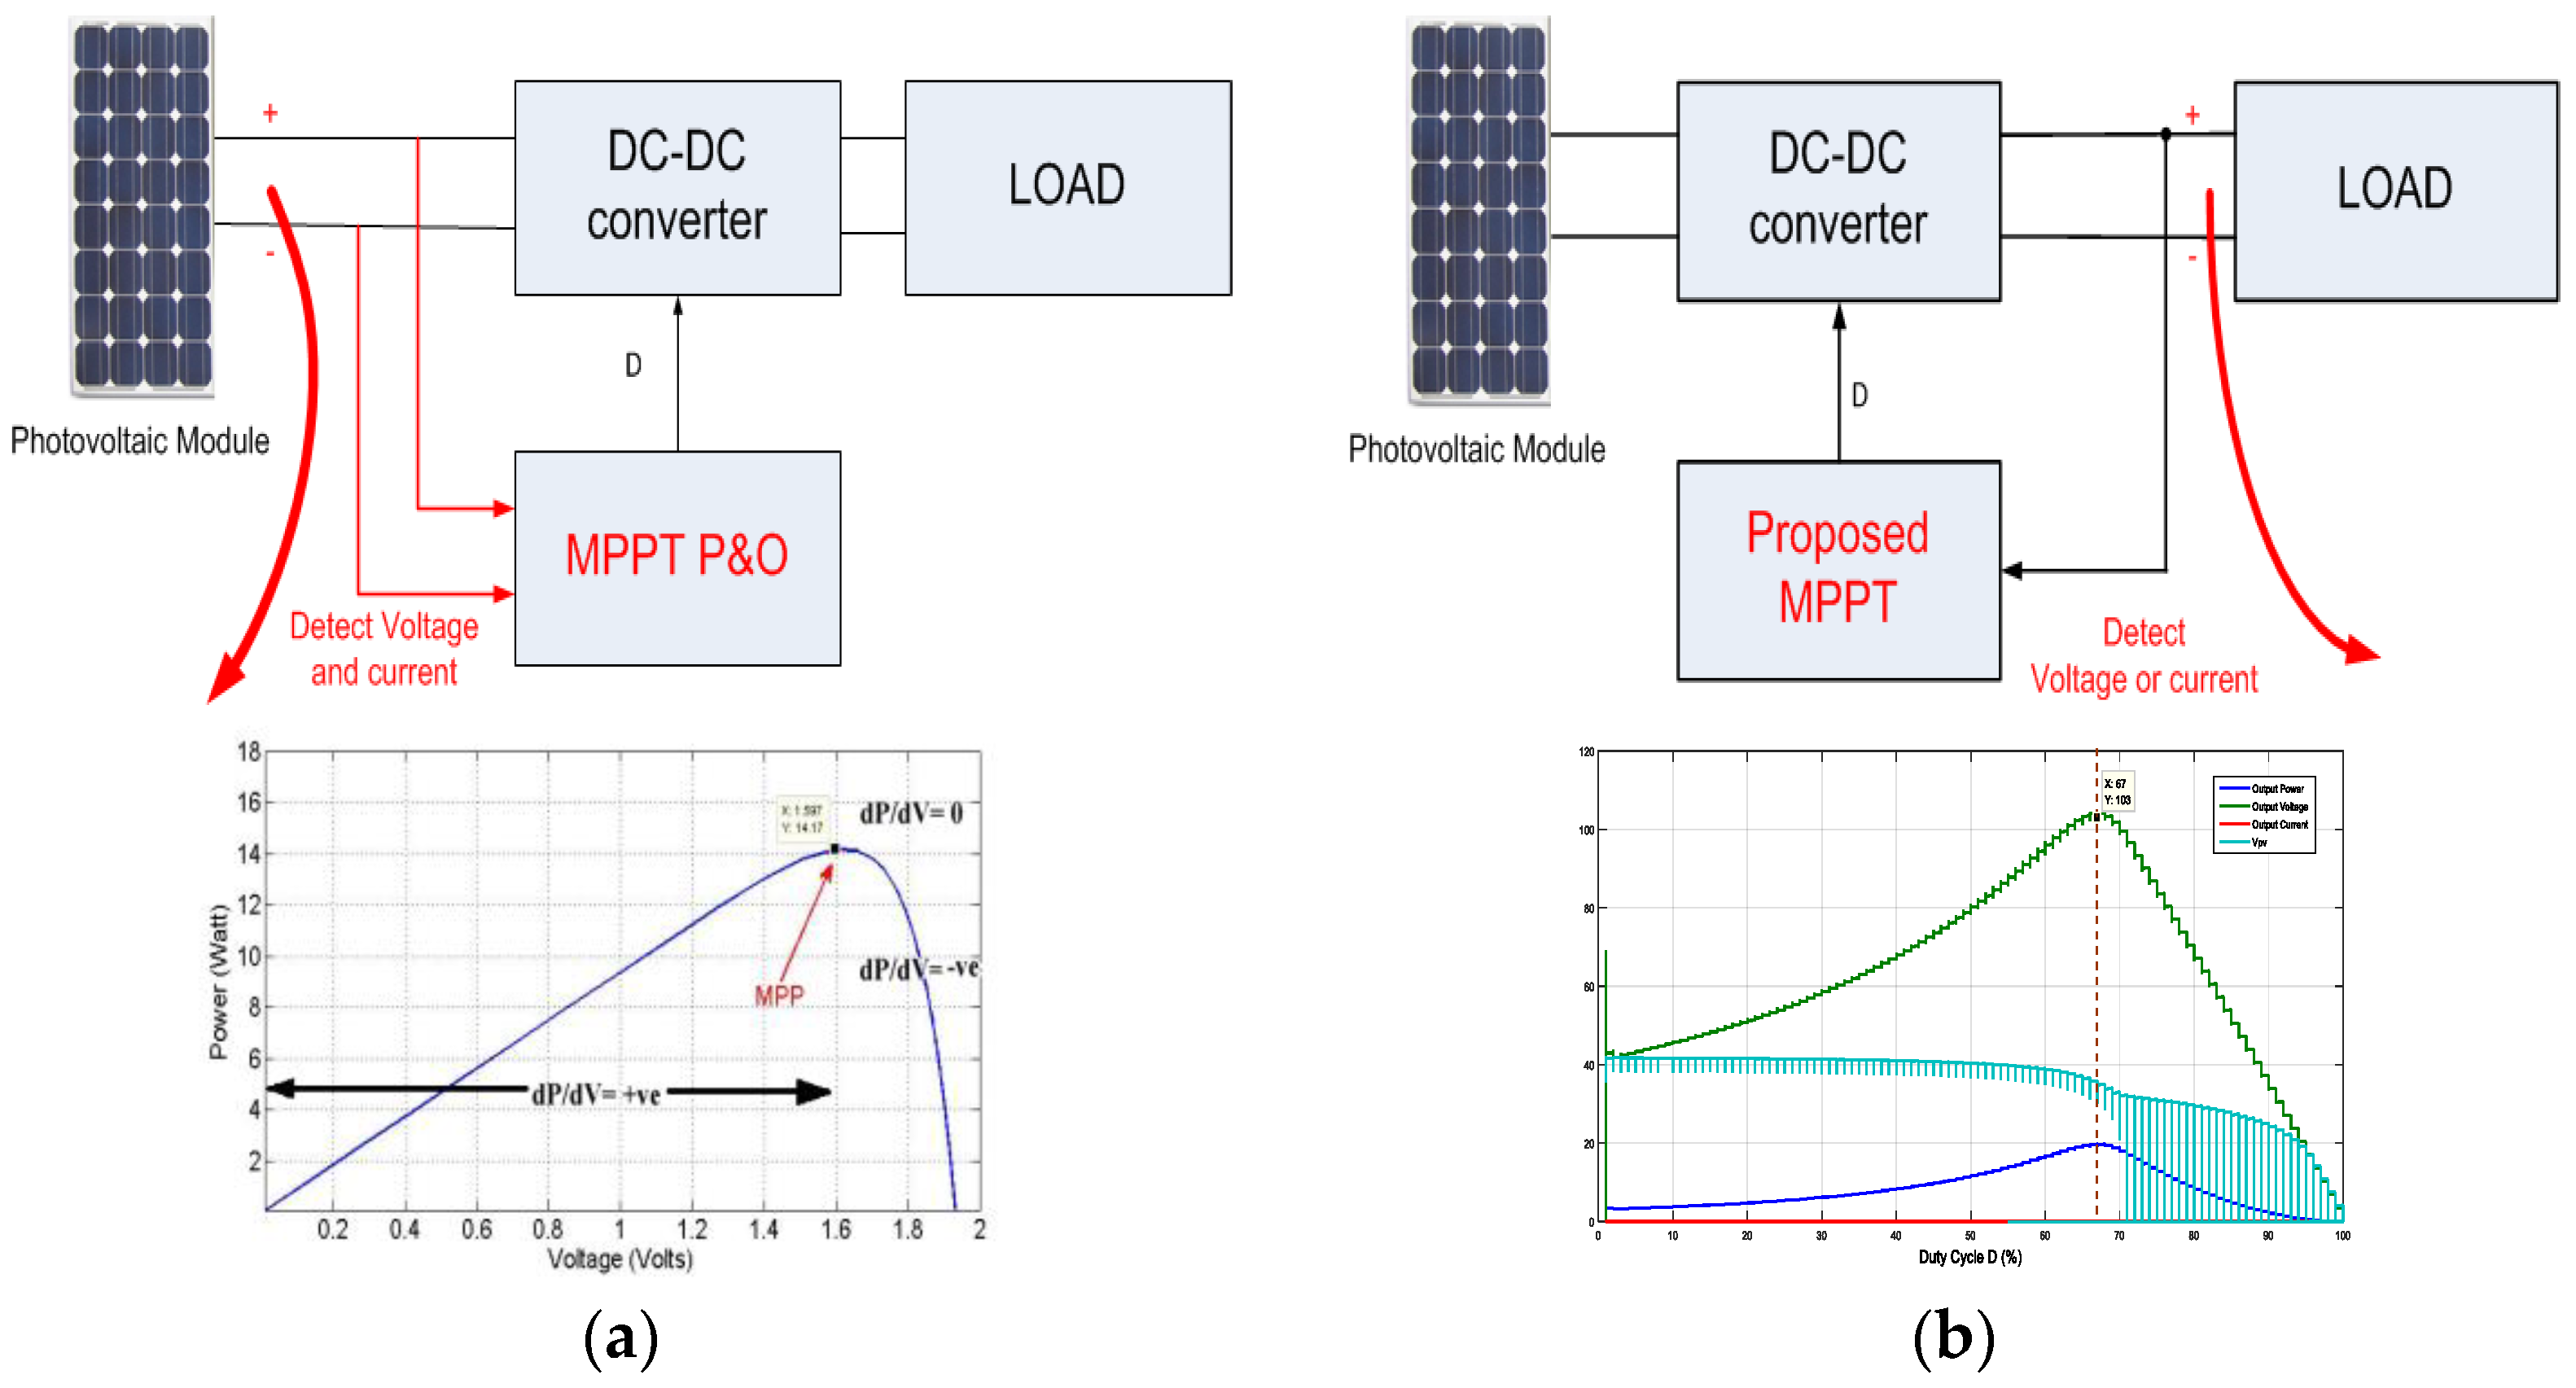
1.1. Operating Strategy of MPPT

The functioning of MPPT has explicated an example for tracking maximum power through the changes in insolation, as depicted in Figure 1a. Figure 1b depicts characteristics of a solar cell for a linear resistive-type load (RL = 10 Ω); it has three maximum power points (MPPs) which are A′, B′, and C′ on three different insolation level. Since the load is linear, the operating points of the cell and the respective terminal voltages are A, B, and C. It is apparent from Figure 1a,b that the power delivered via the solar cell concerning A, B, and C is less than the power available [15].
The MPPT functioning evokes the concept of seizing the terminal voltage corresponding to the MPPs which are A′, B′, and C′ in place of the operating points A, B, and C. To heave the operating point of the solar cell at the MPP, an electronic circuitry recognized as the DC-DC converter was utilized in MPPT [16,17,18].

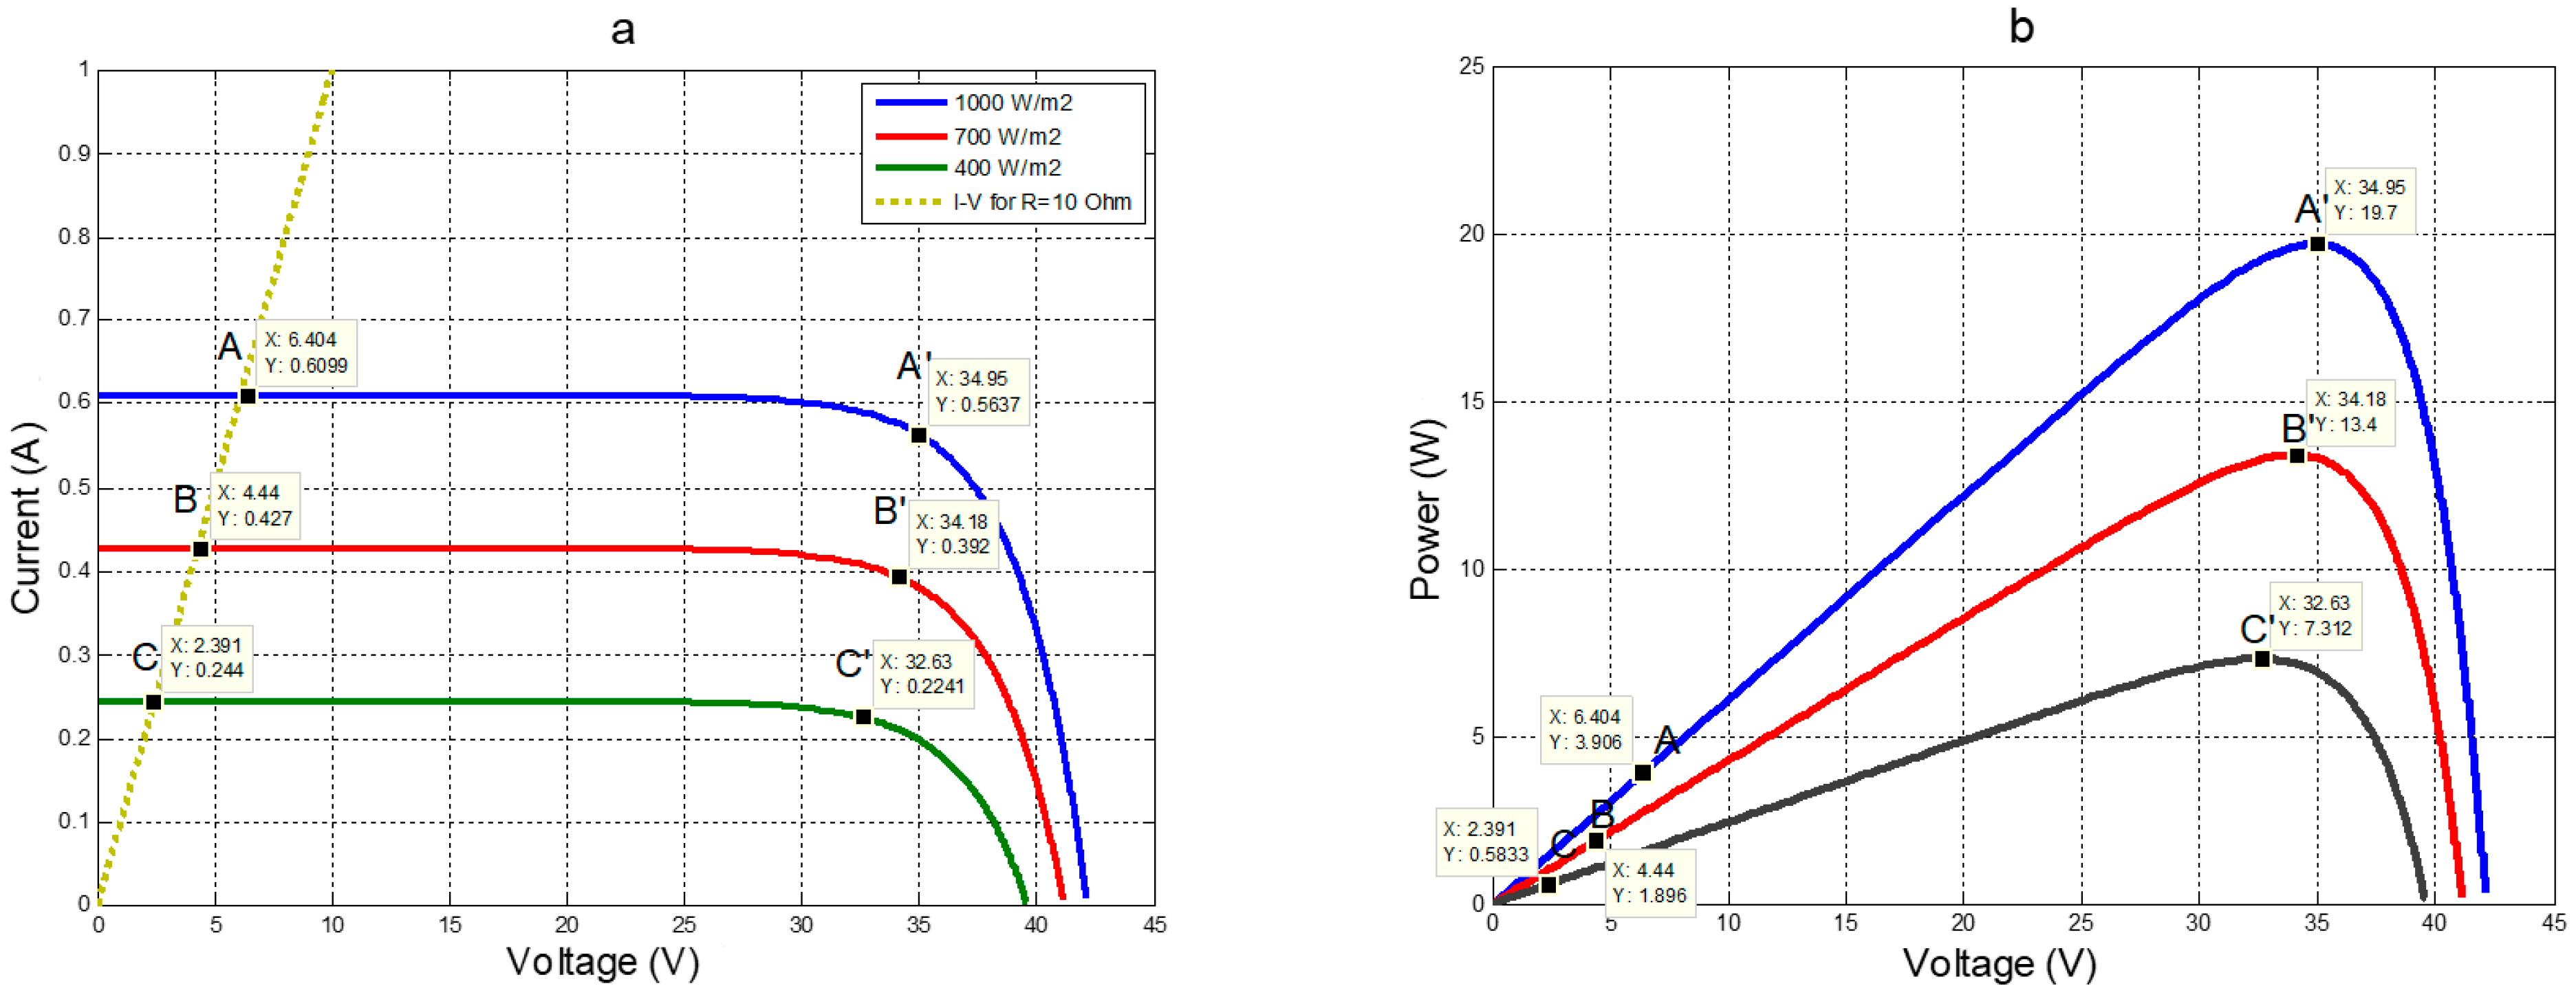
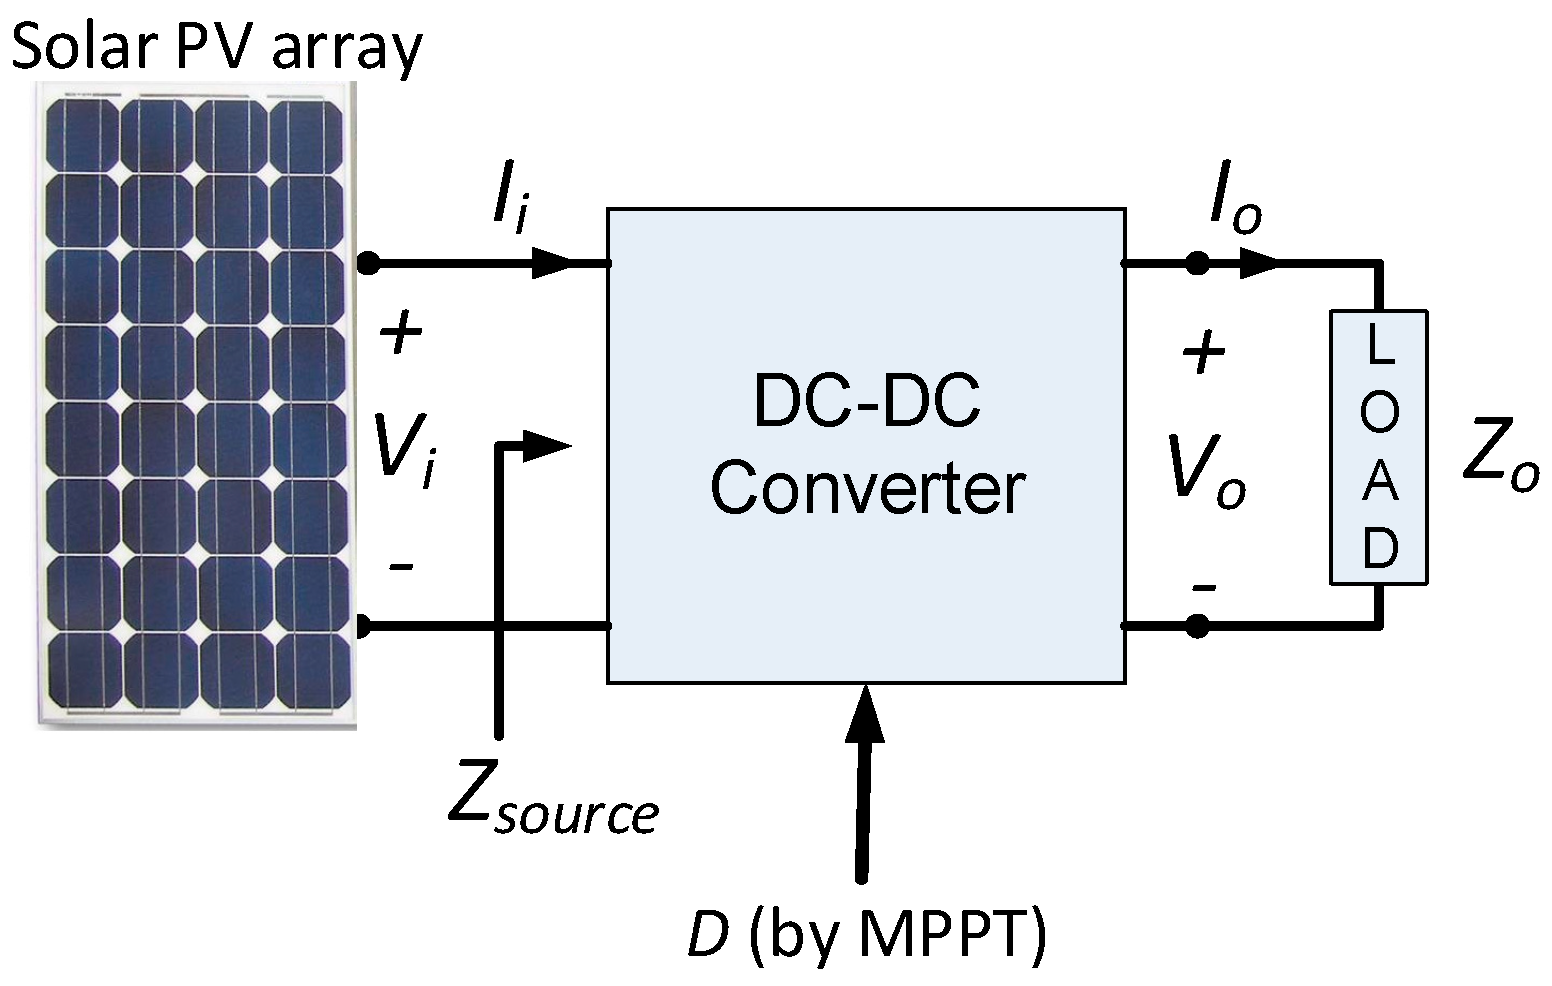
1.2. Impedance Matching by DC-DC Converter in MPPT Operation

In the tracking of MPP, the DC-DC converter is a vital component as the source is capable of delivering the utmost power only corresponding to VMPP or IMPP. Although, in designing a DC-DC converter, it is quite problematic to move the terminal voltage (Vi) or current (Ii) of an SPV module in consequence to a VMPP or IMPP. This paper demonstrates the MPPT algorithms based on various designs of the DC-DC converter [15] in which the impedance as perceived from a solar PV (Zsource) matches the analogous impedance at the MPP (Zmpp = Vmpp/Impp). Figure 2 depicts the block illustration of the general MPPT operation. A comparison of MPPT algorithms and the control of DC-DC converters is presented in [19,20,21,22].
To authenticate the response of the converters, simulations are accomplished in MATLAB’s SIMSCAPE library, which is closer to the practical design. The N-channel MOSFET is utilized for the switching function and it is directed through a voltage-controlled PWM generator. The general operation of MPPT is depicted in Figure 2, wherein the input constraints are sensed and processed by the MPPT controller, thus the duty cycle is set accordingly by the MPPT algorithm. The DC-DC converter works at this duty cycle to deliver the utmost power to the load. More than 31 MPPT techniques have been found in the literature and of these 31 techniques, the perturbation and observation (P&O) or hill climbing is well-liked, with the benefits of ease of realization and involving less complex circuitry.

1.3. P&O/Hill Climbing Technique of MPPT

The P&O technique is one of the well-liked MPPT techniques. The technique is fundamentally an iterative approach. In this technique, the operating point of the SPV module swings around the MPP. The power vs. voltage curve of a solar PV shows that the change in power in regards to voltage (dP/dV) is positive, negative, and zero for the province before the MPP, after the MPP, and at the MPP, respectively [23,24].
This technique is realized by perturbing the duty ratio at regular intervals and swinging around the point dP/dV = 0, i.e., MPP. This operation is explicated in Figure 3 and the methodology is given in Table 1.

2. Proposed MPPT Technique

The proposed MPPT technique is based on a modified converter design [15] as the DC-DC converters are playing a very important role in MPPT. The design of DC-DC converters is an essential part of any MPPT scheme [25,26]. Application of conventional DC-DC buck converters [27,28], boost converters [29,30,31], buck-boost converters [32,33,34], novel converters [35,36], and multilevel inverters [37,38] are also reported in the literature for MPPT operation.
The behavior of DC-DC converters is observed for variation in the duty cycle for the buck, boost, and buck-boost converters in this paper and is explained in the subsequent section.

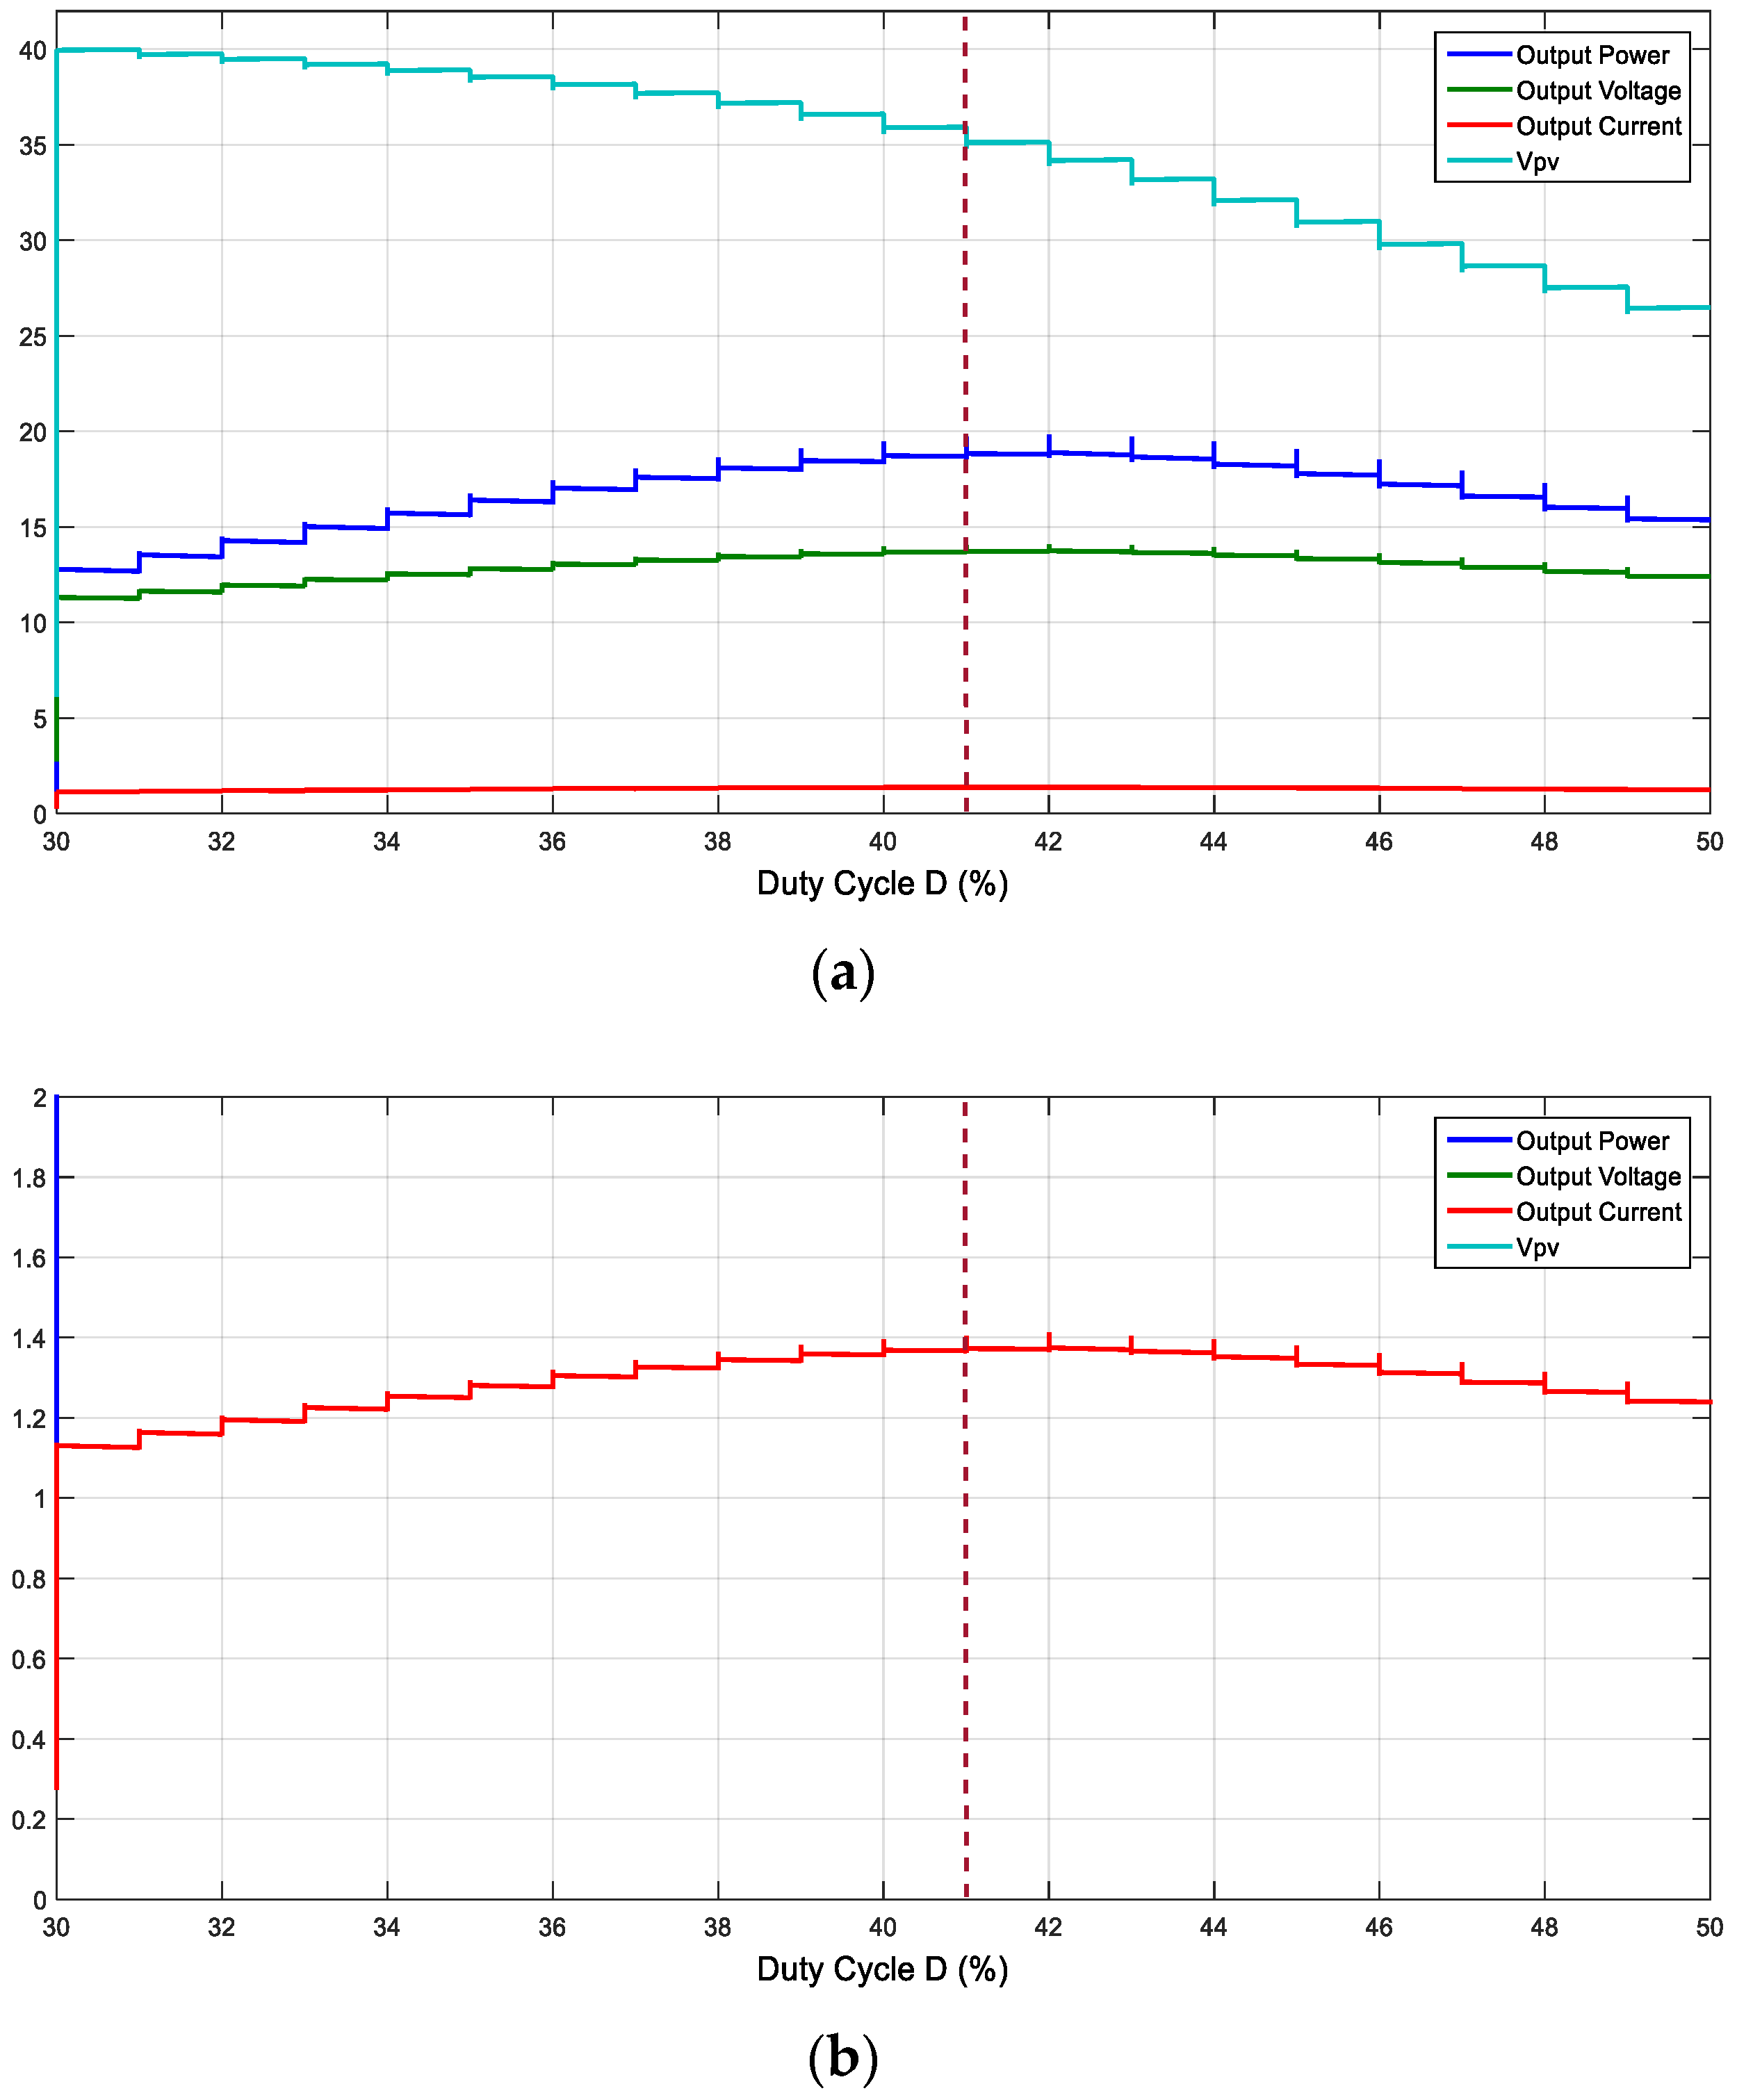
2.1. Boost Converter: Relation between Output Voltage, Output Current, Output Power, and VPV

A graph of the output voltage, output current, output power, and VPV with variation in the duty cycle is presented in Figure 4. It shows that the point of maximum power occurs when the load voltage is at the maximum.
The current is also at the maximum where the power is maximum ay D = 67%, which is not visible in Figure 4a; by zooming in at the Y-axis, it is clear in Figure 4b.

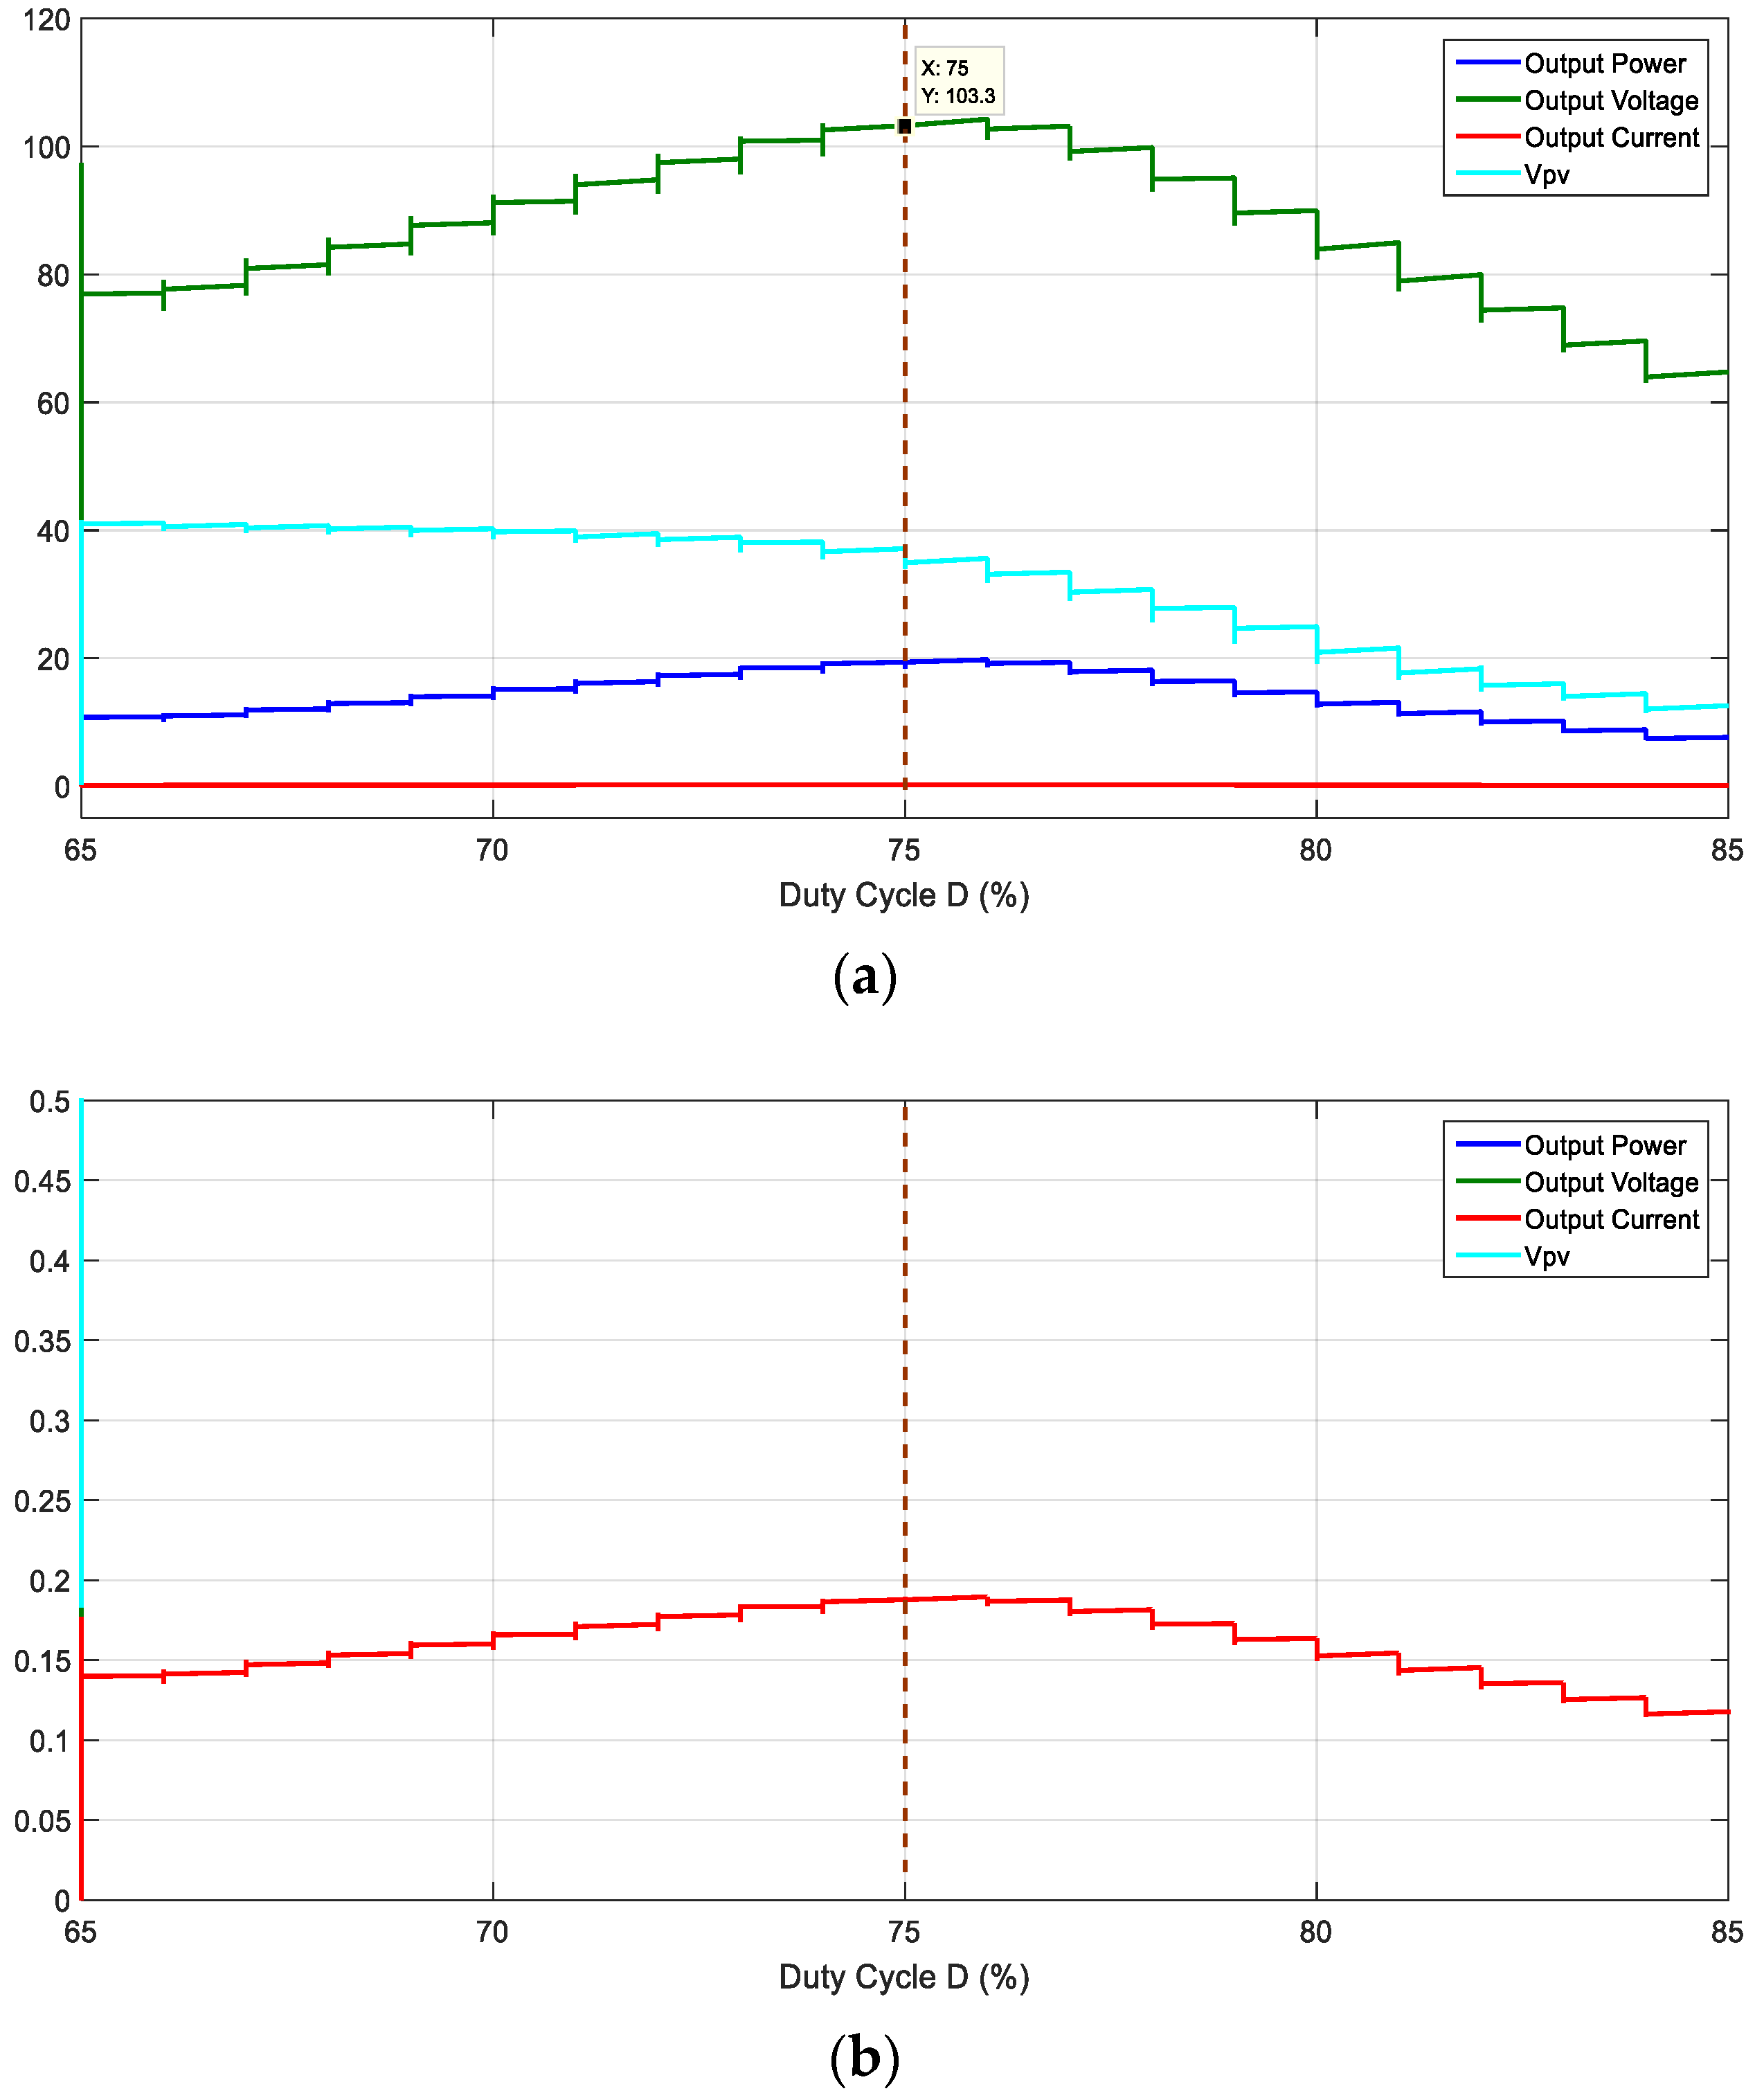
2.2. Buck Converter: Relation between Output Voltage, Output Current, Output Power, and VPV

A graph of the output voltage, output current, output power, and VPV with the duty cycle is presented in Figure 5.
Figure 5 shows that the point of maximum power occurs when the load voltage is at the maximum at duty cycle D = 41% [15].
The current is also at the maximum where the power is maximum ay D = 41%, which is not visible in Figure 5a; by zooming in at the Y-axis, it is clear in Figure 5b.

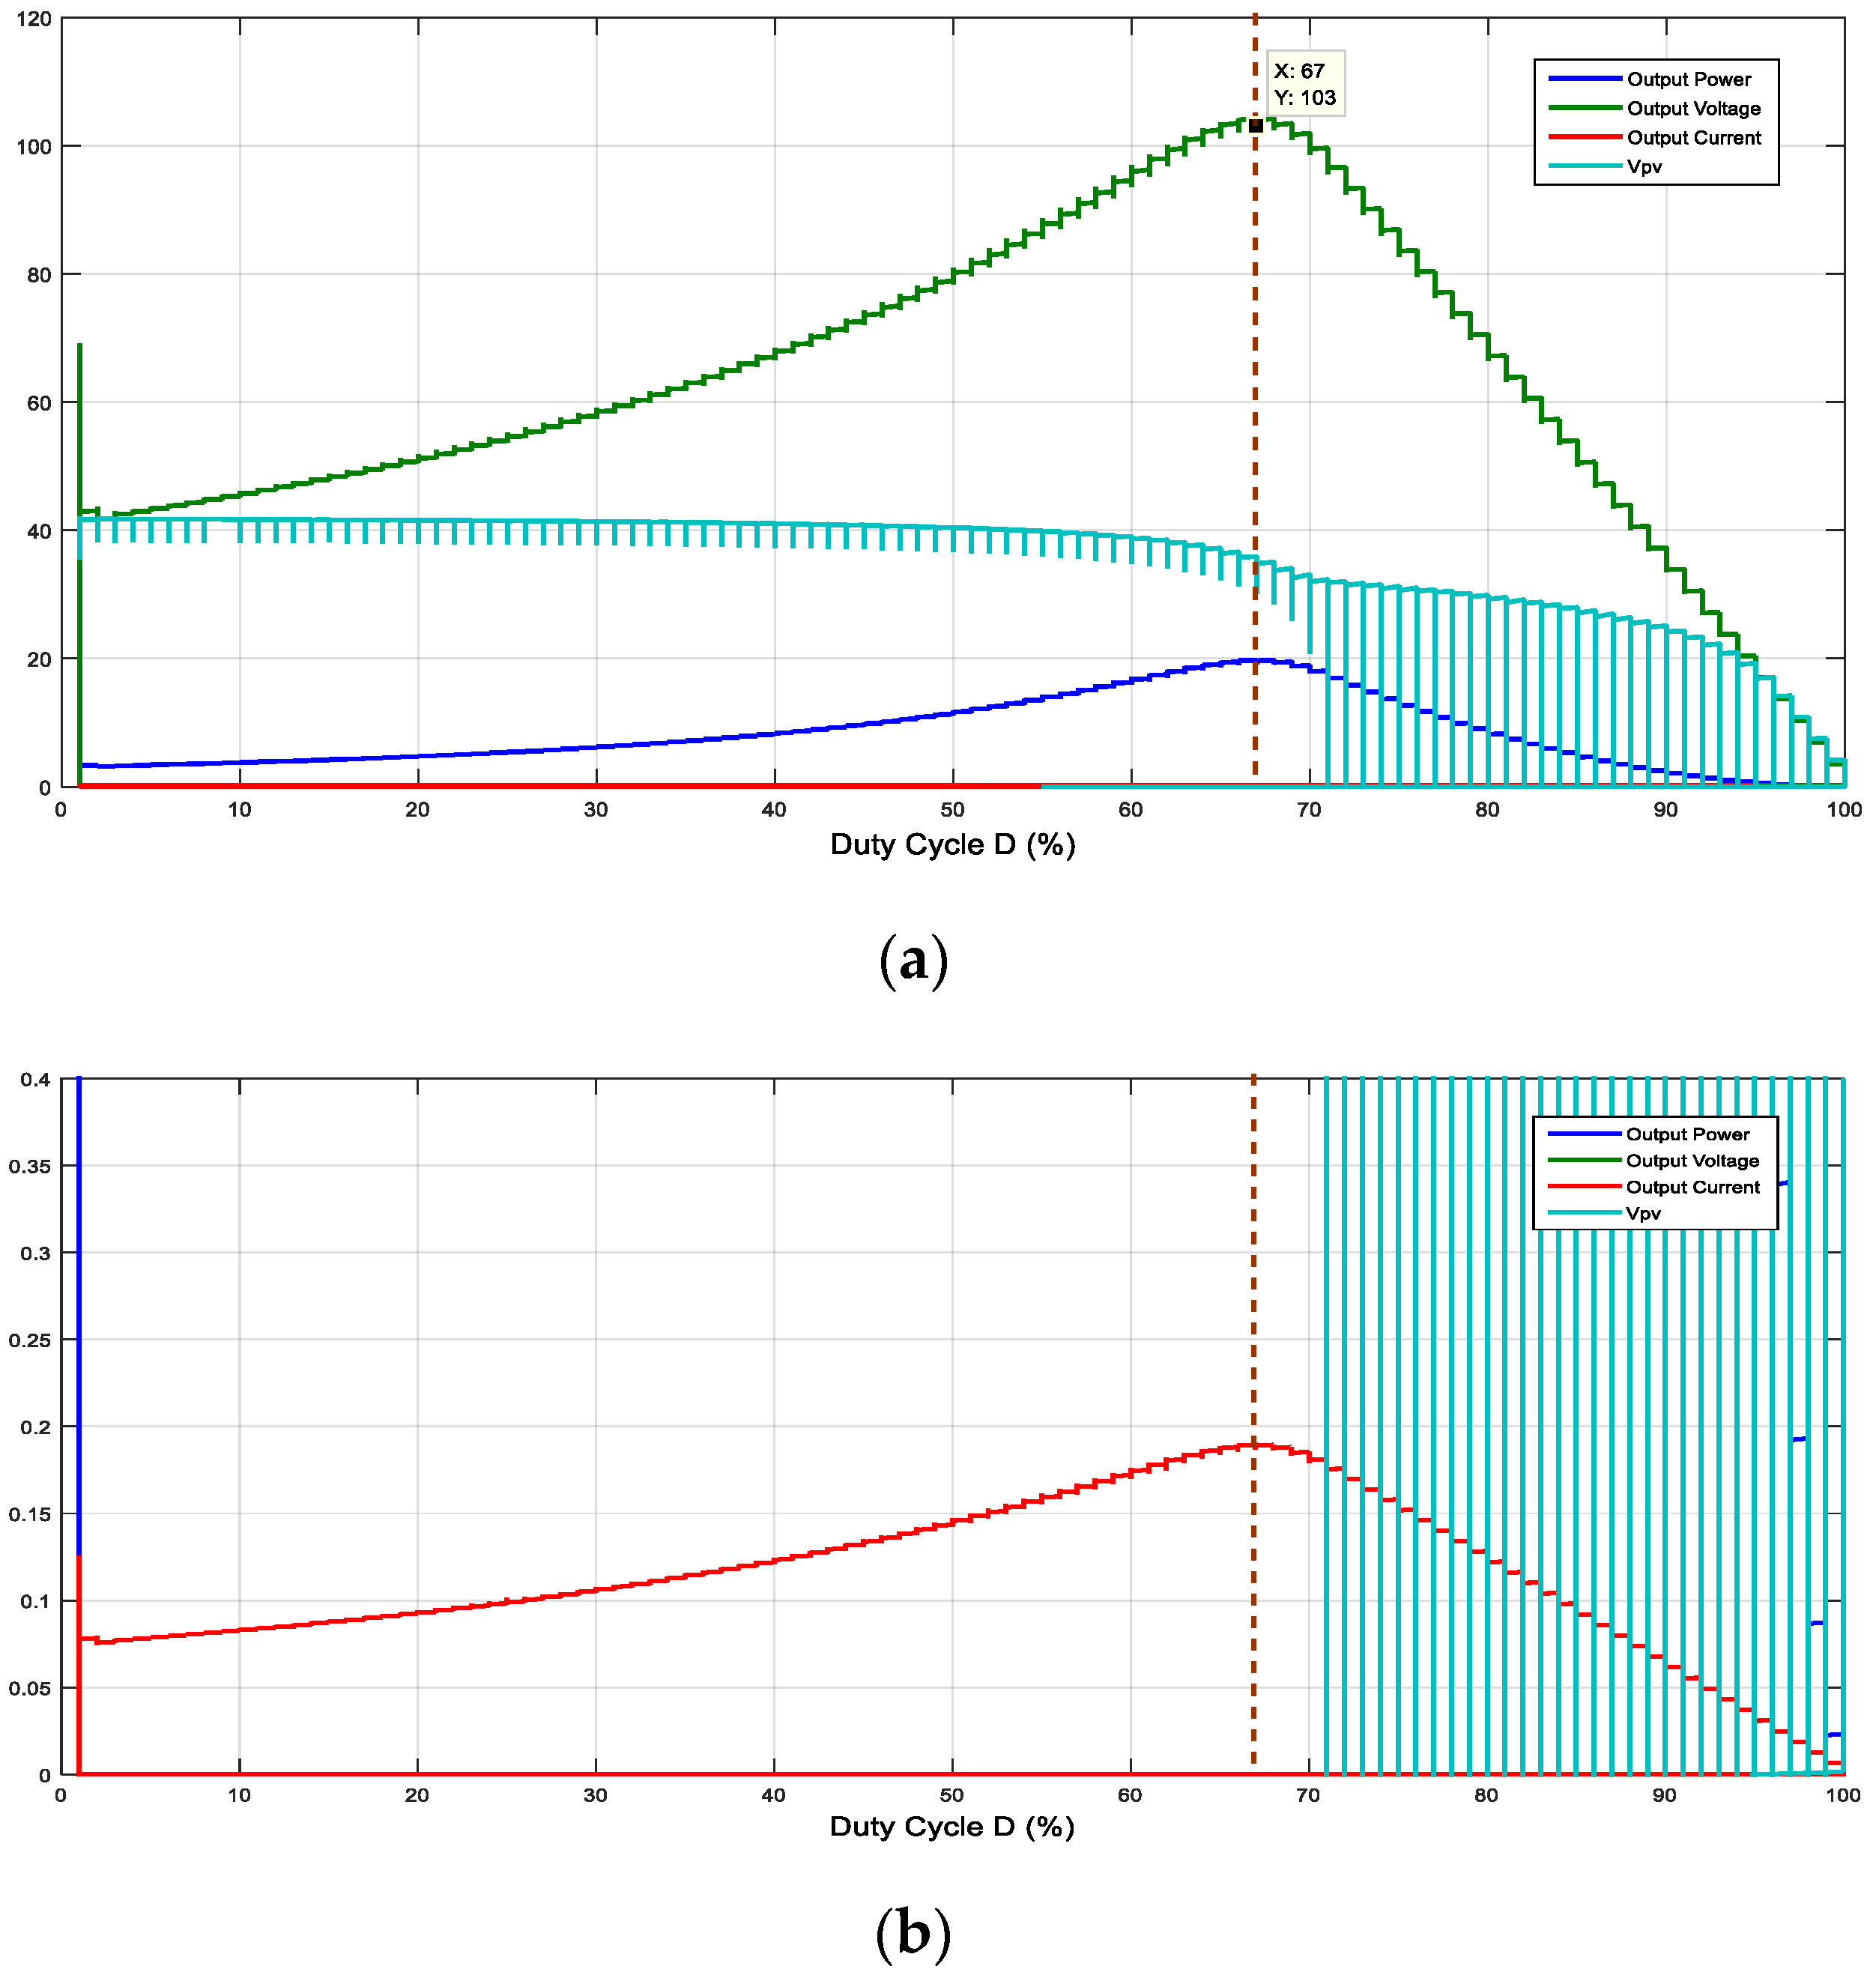
2.3. Buck-Boost Converter: Graph of Output Voltage, Output Current, Output Power, and VPV with the Duty Cycle

A graph of the output voltage, output current, output power, and VPV with the duty cycle is presented in Figure 6. It shows that the point of maximum power occurs when the load voltage is at the maximum at duty cycle D = 75% [15]. The current is also at the maximum where the power is at the maximum at D = 75%, which is not visible in Figure 6a; by zooming in at the Y-axis, it is clear in Figure 6b.

2.4. Operating Principle of Proposed MPPT Technique

The conventional P&O method senses input parameters or PV side parameters, i.e., VPV and IPV, and compares power at different time intervals as well as keeps on oscillating around the maximum power. The maximum power will be transferred to the load when the load side voltage will be at the maximum. An MPPT technique is proposed which maximizes the load voltage in contrast to VPV in conventional P&O and causes maximum power to be delivered to the load, as shown in Figure 7. The calculated duty cycle for standard environmental conditions gives the maximum power at which the load voltage is at the maximum; this duty cycle becomes the maximum duty cycle (Dmax). The minimum duty cycle (Dmin) will be calculated by assuming the minimum set of environmental conditions, such as, for example, an insolation of 50 W/m2 and temperature of 25 °C. Calculation of Dmin and Dmax depends on the location of the solar PV array. In the proposed MPPT technique, the perturbation of the duty cycle is done within the range of Dmin to Dmax to maximize the load voltage; in this way, the proposed method becomes the PV array-dependent method. Nevertheless, the response time to achieve MPP becomes less.
This novel method is applied by perturbing the duty ratio at regular intervals and observing the load voltage, thus oscillating around the point V o V o ( M a x ) , i.e., MPP. The operation is explained in Figure 7 and Table 2.

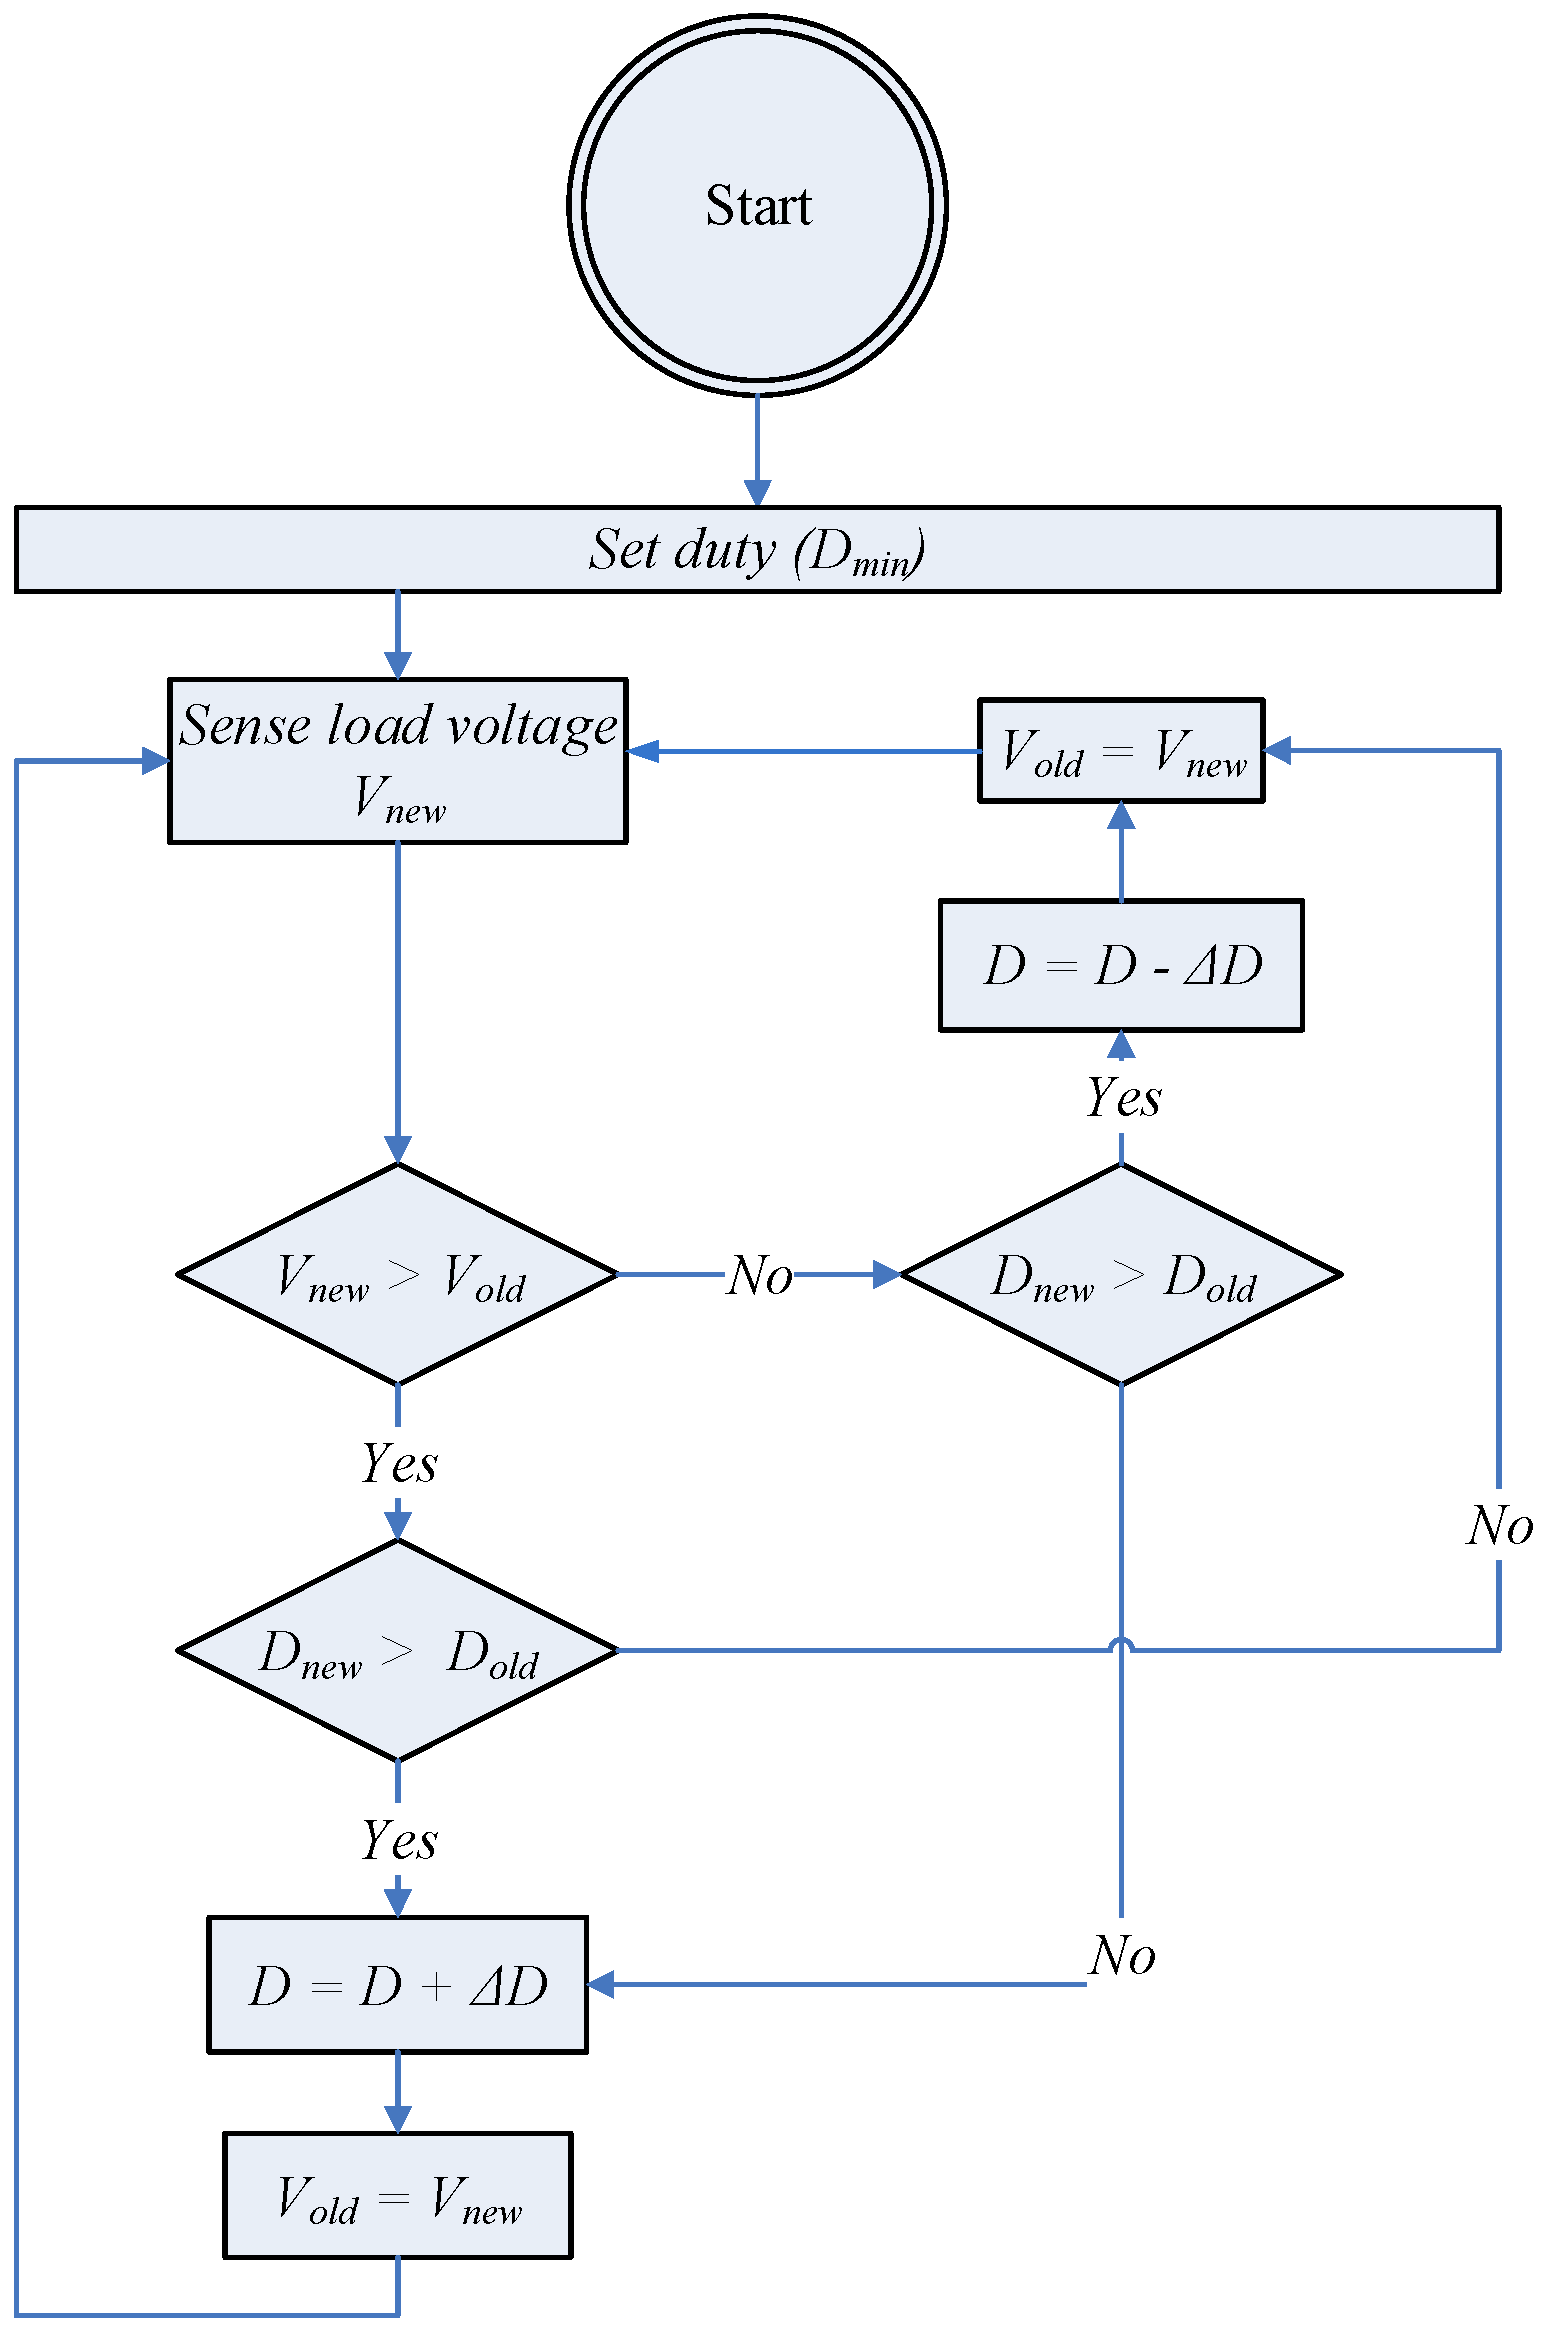
2.5. Flow Chart of Proposed MPPT Algorithm

Figure 8 shows the flow chart of the proposed MPPT method. The method applies the perturbation in the duty cycle within a predetermined range (Dmin to Dmax) to regulate the output voltage of the converter or the load side voltage. The initial conditions are assumed to be zero, which means the previous value of the voltage and duty cycle is zero. The algorithm starts with the minimum value of the duty cycle (Dmin); senses the load voltage, which is is Vnew; and compares it to the previous value of the load voltage (Vold) if Vnew > Vold and Dnew > Dold. Then, the next perturbation is the positive increment of the duty cycle. The MPPT operation follows the methodology presented in Table 2.

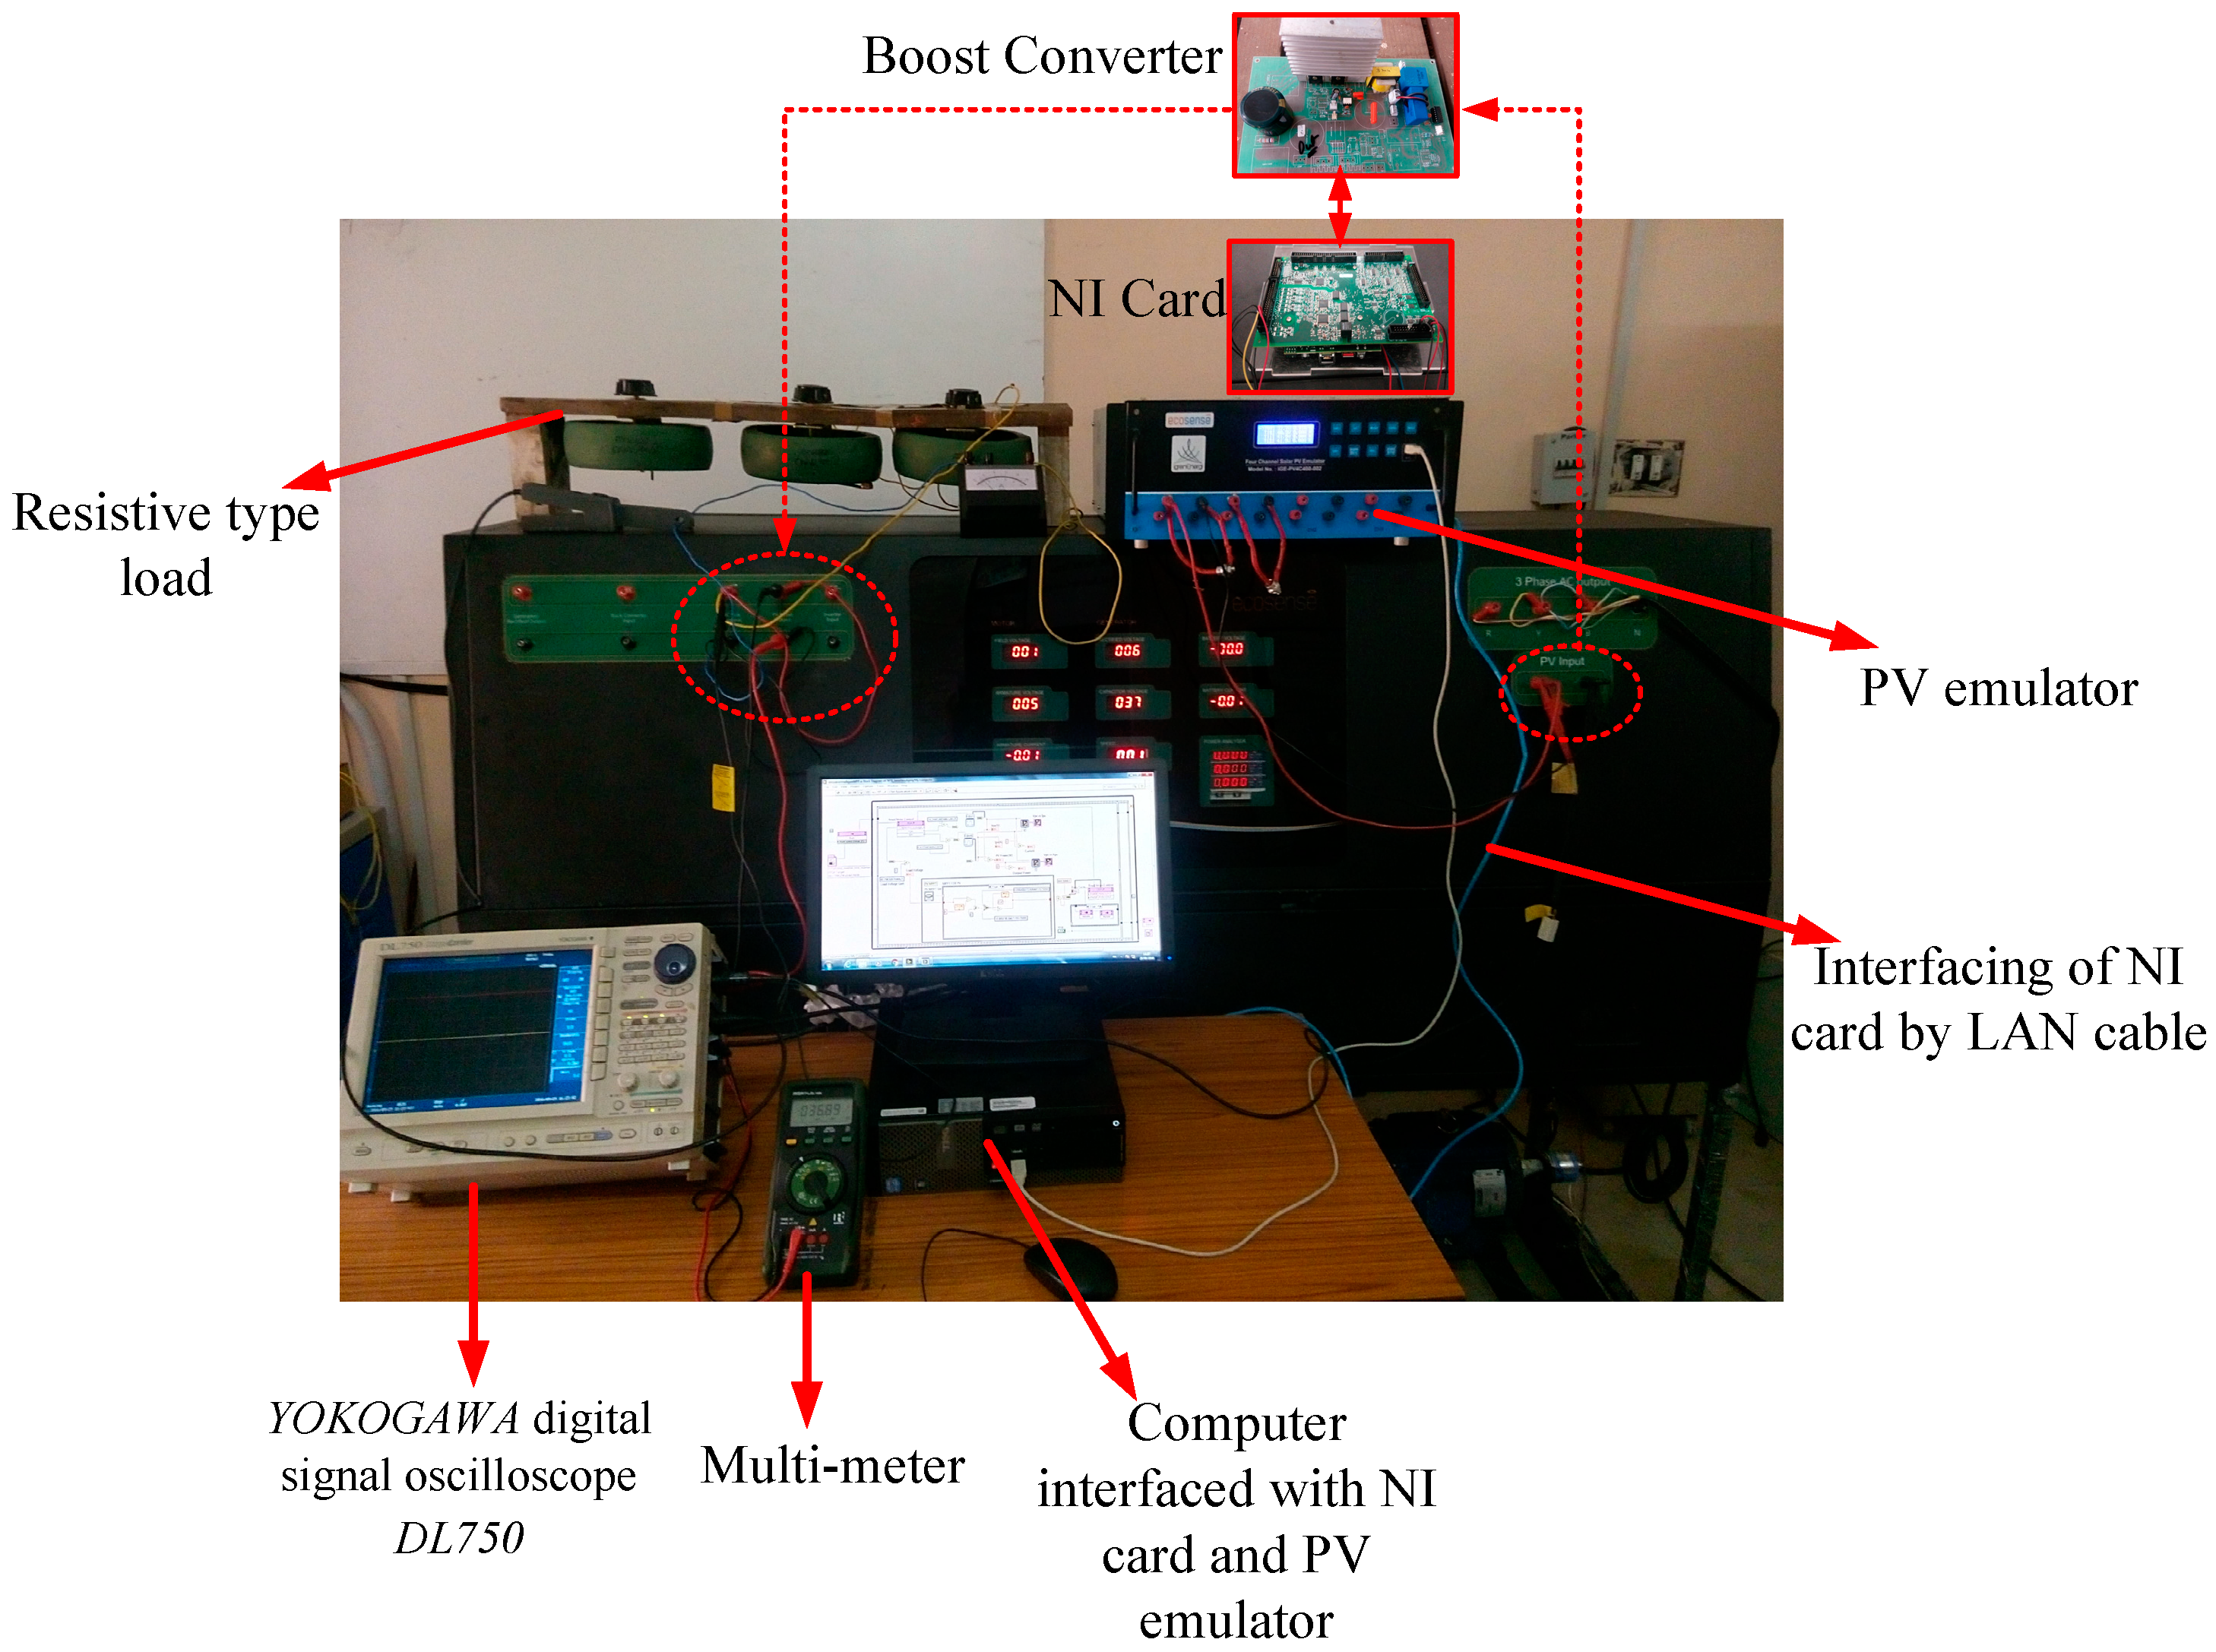
3. Hardware Implementation of Proposed MPPT Method

The proposed scheme of MPPT is developed using a Field-Programmable Gate Array (FPGA)-based NI-sbRIO card interfaced with Labview software. Control signals were generated using Labview, which operates the boost converter to track the maximum power, as shown in Figure 9. The proposed algorithm was tested using a boost converter because the converters with continuous input current (as in the case of the boost converter) are preferable from the PV array point of view.
Figure 9 depicts the block diagram of the proposed MPPT algorithm, in which sensing of the load voltage is done to track MPP as compared to the convention P&O method, which senses the voltage and current of the source-side or PV array side.

3.1. Solar PV Emulator

The solar PV array is emulated by employing a solar PV emulator made by igrenEnergi and ecosense world [39,40], as shown in Figure 10.
The solar PV emulator is a programmable and controlled power supply designed to emulate solar panels. The PV emulator maintains the output corresponding to the I-V characteristic of the panel with a fast transient response to change in load conditions for a given environmental condition. It emulates the output of solar panels from different manufacturers, variations due to the time of the day, the effect of season, and different geographical locations. The PV emulator gives output across its four channels to match the solar panel data selected by the user based on the date and time.
The specification of the array taken for testing is given in Figure 11a, wherein panel (SR-M572175 made by Sunrise Solartech Co. Ltd., Changzhou 21302, China) details including standard temperature and insolation are IMPP = 4.98 A and VMPP = 35.2 V, as shown in Figure 11b. The day selected (10 July 2015) and time (9:00 A.M.) give the operating data IMPP = 1.754 A and VMPP = 32.4 V at insolation 352 W/m2 and temperature 26.05 °C, and the simulation (I-V and P-V characteristic) obtained from the emulator is shown in Figure 12.
The PV array emulation was used for a different time for testing purposes across the emulator’s different channels, as shown in Figure 13. In channel 0 (CH0), the I-V characteristic table or I-V table was downloaded for time 09:00 A.M.; in channel 1 (CH1) for time 10:00 A.M.; in channel 2 (CH2) for time 11 A.M.; and in channel 3 (CH3) for time 08 A.M.
For the time 10:00 A.M., the emulator gave the operating data IMPP = 2.354 A and VMPP = 33.09 V at insolation 472 W/m2 and temperature 26.83 °C, and the simulation (I-V and P-V characteristic) obtained from the emulator is shown in Figure 13. The I-V table was uploaded across channel 1.

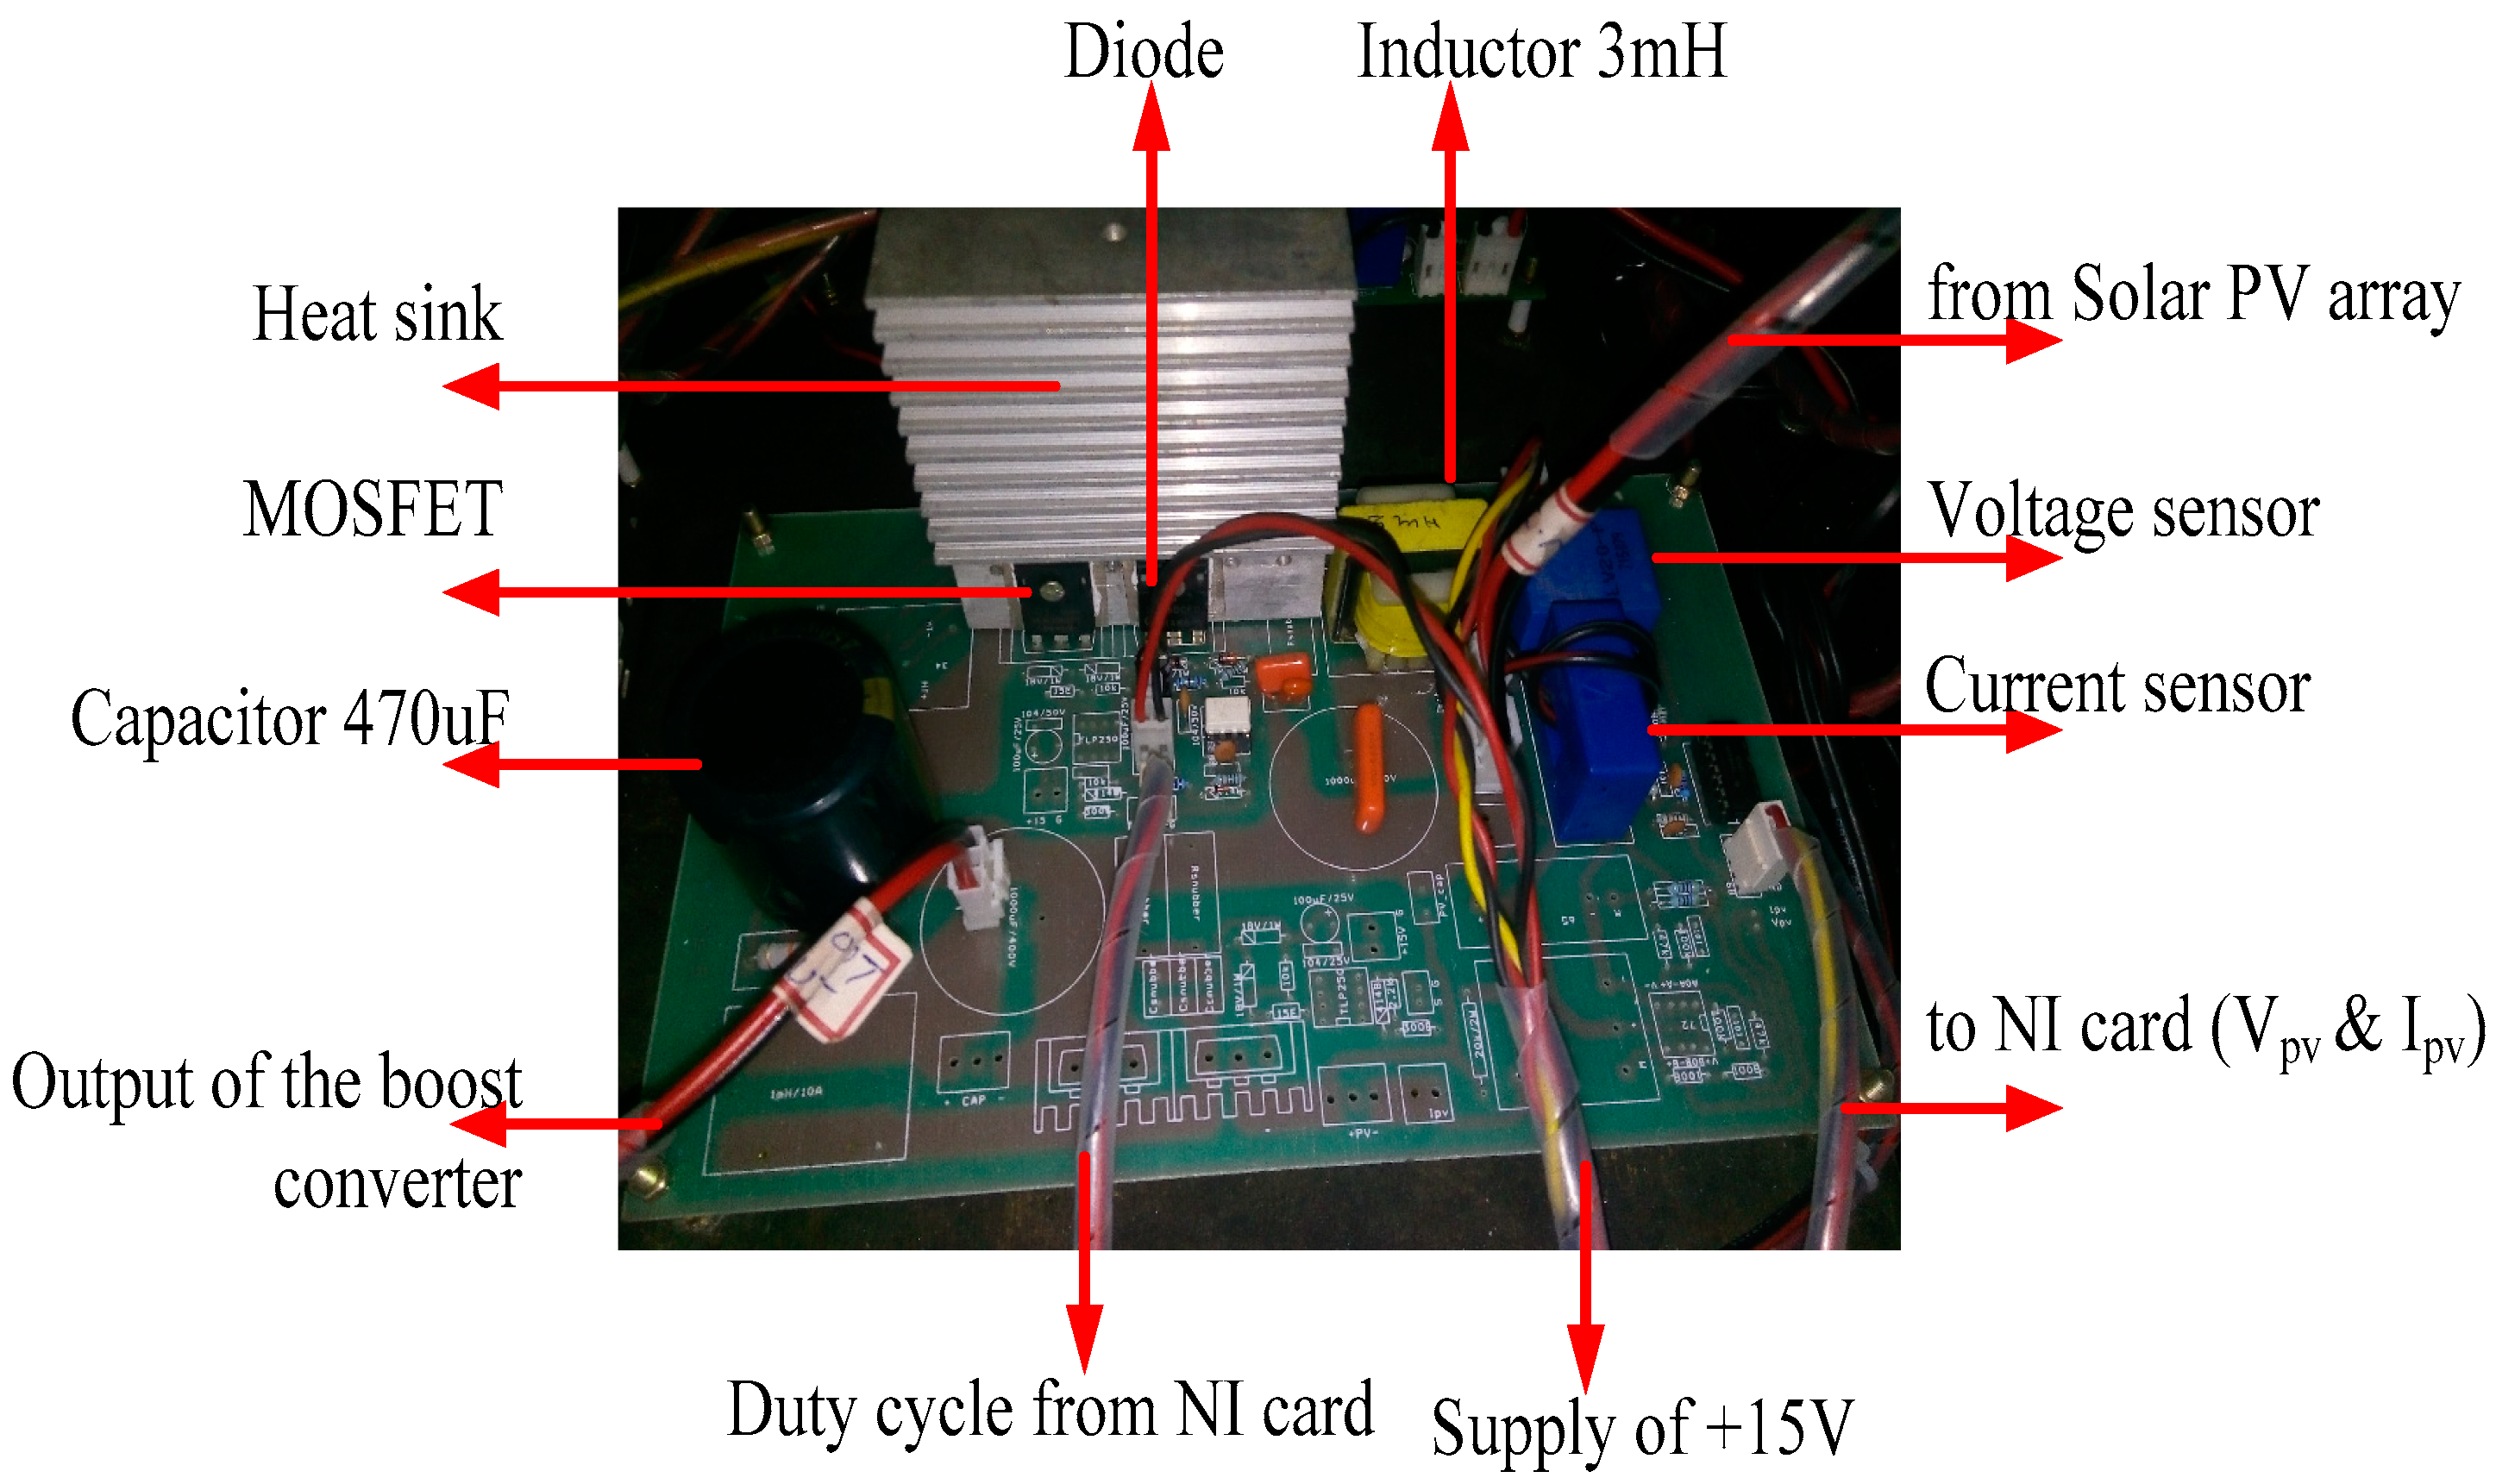
3.2. DC-DC Boost Converter

The DC-DC converter design was presented in [15] and the duty cycle of the boost converter was calculated for the emulated PV array at time 13:00. For time 13:00, the operating data obtained was IMPP = 2.904 A and VMPP = 34.9 V, and ZMPP = 12.04 at the insolation level of 648 W/m2 and temperature 27.11 °C. The I-V table uploaded at channel 3 is shown in Figure 14.
The duty cycle can be calculated as:
D = 1 Z MPP Z o = 1 12.04 40 = 0.4514
The output voltage or load voltage can be calculated as
V o = V i ( 1 D ) = 63   V
and maximum power is calculated as
P m a x = V M P P × I M P P = 34.9 × 2.904 = 101.4   W
The DC-DC boost converter used for the testing is shown in Figure 15. The output of the PV array obtained from the PV emulator was sent to the DC-DC boost converter and controlling of the converter through the duty cycle of the boost converter was done by an FPGA-based NI-sbRIO card.

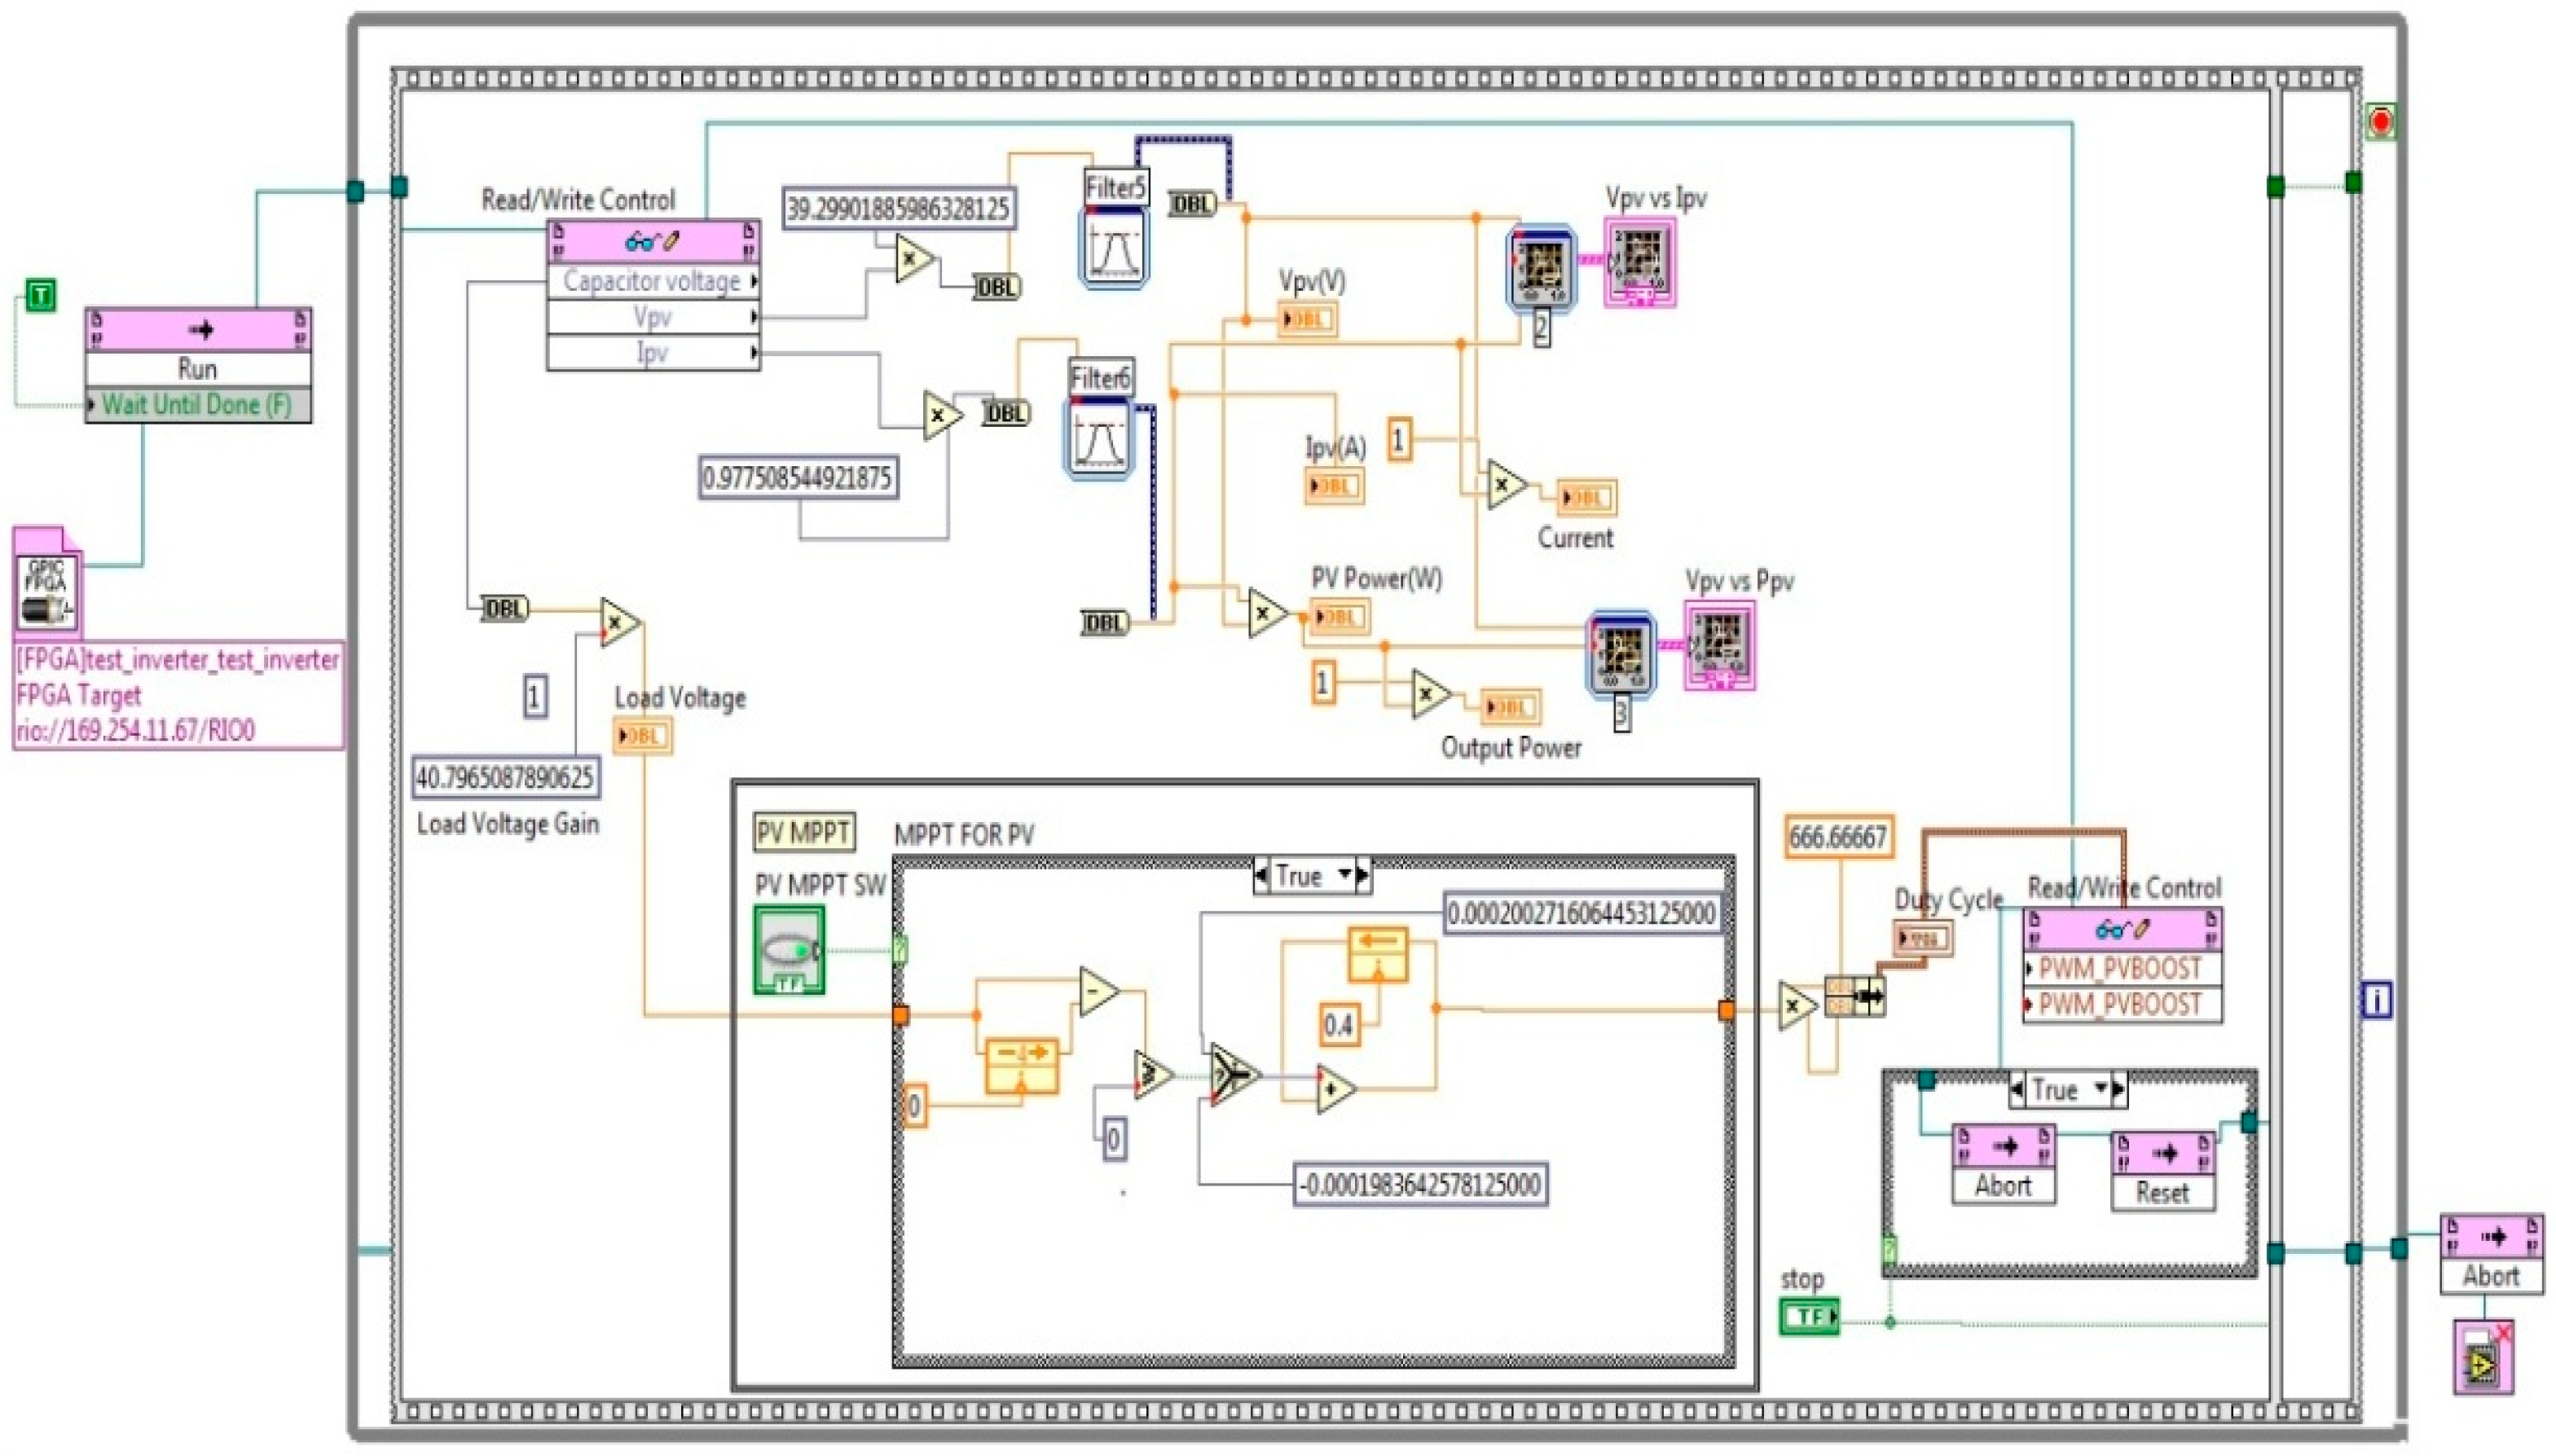
3.3. MPPT Operation by FPGA-Based NI-sbRIO Card Interfaced with LABVIEW

The sbRIO-9606 embedded device [41] was used to perform the MPPT operation of the proposed method. The sbRIO-9606 is an embedded acquisition and control device which integrates a user-reconfigurable FPGA and input–output (I/O) on a single-printed circuit board (PCB) [41]. The connection diagram of the sbRIO-9606 [41] card is shown in Figure 16.
The Labview implementation of the proposed MPPT control is shown in Figure 17. Figure 17 illustrates the Labview schematic used to implement the MPPT algorithm. The MPPT control was achieved by modulating the duty ratio of the DC-DC converter.

3.4. Resistive-Type Load

The linear resistive-type load was considered for testing. Three 600 W, 100 Ω variable rheostats were used in the experimentation. The value of 40 Ω resistance was obtained by these rheostats.
Figure 18 depicts the complete setup of the hardware implementation; the control circuit or MPPT algorithm was developed in Labview software; and to operate the boost converter, the duty cycle was generated by the NI card. A computer was interfaced with the PV emulator through the USB cable and interfacing with the NI card was done through the LAN cable. Results were analyzed through the YOKOGAWA digital signal oscilloscope DL750, whereas the readings were taken through a multi-meter and ammeter.

4. Results and Discussion

Figure 19 shows the front window of the Labview software, whereas Figure 17 shows the back window of the Labview.
The left-hand side top window exhibits the duty cycle modulation and becomes stable at D = 0.45 when its operating point approaches MPP, corresponding to a solar isolation of 648 W/m2 (13:00). The right-hand side top window shows the measured PV array output power across the load. The lower LHS window shows the PV output voltage as 62.5 V, whereas the RHS window displays the inductor current of the boost converter in continuous conduction mode.
The results across the load resistance of 40 Ω were taken on the YOKOGAWA digital signal oscilloscope DL750, as shown in Figure 20.
Channel 1 (CH1) shows the voltage across the load resistance, channel 2 (CH2) shows the current across the load, and channel 3 (CH3) shows the PV array’s terminal voltage (VPV), and the results show that the proposed MPPT technique tracks the maximum power of 100 W.
The selected day (10 July 2015) and time (9:00 A.M.) give the operating data IMPP = 1.754 A and VMPP = 32.4 V at insolation 352 W/m2 and temperature 26.05 °C. Figure 12 gives the I-V and P-V characteristic of the array that indicates that the maximum power is 56.83 W. The proposed algorithm tracks the maximum power, which is shown in Figure 21.
The selected day (10 July 2015) and time (10:00 A.M.) gives the maximum power of 77.89 W, as shown in Figure 13. The proposed algorithm tracks the maximum power and the hardware results are shown in Figure 22.
The proposed MPPT method was further tested for the partial shading condition, wherein two channels of the PV emulator were connected in series (CH1 and CH2), as shown in Figure 23. Two power diodes were used to make the diode mitigation technique and channel 1 gave the PV module characteristic for 10:00 A.M. while channel 2 gave the 11:00 A.M. characteristic, as presented in Figure 23.
In this partial shading condition, the I-V and P-V characteristic obtained is shown in Figure 24, whereas the result obtained is shown in Figure 25, and it is clear in the figure that the maximum power achieved from the array was 129 W. However, the most popular MPPT technique of P&O may stick to the local maximum point of 89.46 W and failed to track MPP.

Comparison of Proposed MPPT Technique with P&O MPPT

In this section, the proposed MPPT method is compared with the most popular MPPT technique, namely the perturb and observe method (P&O)/hill climbing method. Both the methods are based on the perturbation in the duty cycle; however, P&O compares the power and the proposed MPPT compares the load voltage for each perturbation. In this manner, the efficiency of the MPPT method depends on the perturbation size.
a
Perturbation size: The size of the perturbation is inversely proportional to the efficiency. The oscillations around the MPP become larger with a large perturbation size, which causes losses, but the method becomes faster. Oscillation can be minimized by reducing the perturbation step size, which slows down the MPPT.
b
Similar perturbation size: In this work, a comparison of both the methods was done while keeping the perturbation size of the duty cycles the same, that is, 1%, thus the efficiency of both the methods is the same. The proposed method is based on varying duty cycles between Dmin and Dmax, thus reaching MPP faster than the P&O method, hence the overall efficiency of the proposed MPP becomes higher.

5. Conclusions

A single sensor-based maximum power point tracking technique for PV array with a boost converter was employed. Hardware implementation of the proposed method of MPPT was presented in this paper and the technique proposed was tested for different environmental conditions as well as for partial shading conditions, and the results obtained were discussed. The MPPT algorithm was developed and tested using an FPGA-based NI-sbRIO card interfaced with Labview software. Through the results acquired during the simulations and experiments, it is established that the proposed technique is capable of tracking the SPV system under partial shading conditions. In this paper, a comparison of both the proposed and perturb and observe method (P&O)/hill climbing method was done while keeping the perturbation size of the duty cycles same, that is, 1%, thus the efficiency of both the methods are the same. The operation of the proposed MPPT is simple, is faster, can be easily implemented, and requires only one sensor or voltage sensor that reduces the cost of the system.

Author Contributions

Conceptualization, D.V.; methodology, D.V. and S.N.; software, Y.S. and R.A.; validation, D.V. and S.N.; formal analysis, D.V. and S.N.; investigation, D.V. and S.N.; resources, D.V. and S.N.; data curation, D.V. and S.N.; writing—original draft preparation, D.V. and S.N.; writing—review and editing, R.A. and A.K.; visualization, A.K.; supervision, S.N.; All authors have read and agreed to the published version of the manuscript.

Funding

This research received no external funding.

Conflicts of Interest

The authors declare no conflict of interest.

References

  1. Chauhan, A.; Saini, R.P. A review on integrated renewable energy system based power generation for stand-alone applications: Configurations, storage options, sizing methodologies and control. Renew. Sustain. Energy Rev. 2014, 38, 99–120. [Google Scholar] [CrossRef]
  2. Lesourd, J.-B. Solar photovoltaic systems: The economics of a renewable energy resource. Environ. Model. Softw. 2001, 16, 147–156. [Google Scholar] [CrossRef]
  3. Maamar, S.; Salha, O.B. On the causal dynamics between economic growth, renewable energy consumption, CO2 emissions and trade openness, Fresh evidence from BRICS countries. Renew. Sustain. Energy Rev. 2014, 39, 14–23. [Google Scholar]
  4. Mohamed, A.E.; Zhao, Z. MPPT techniques for photovoltaic applications. Renew. Sustain. Energy Rev. 2013, 25, 793–813. [Google Scholar]
  5. Libra, M.; Petrík, T.; Poulek, V.; Tyukhov, I.I.; Kouřím, P. Changes in the Efficiency of Photovoltaic Energy Conversion in Temperature Range with Extreme Limits. IEEE J. Photovolt. 2021, 11, 1479–1484. [Google Scholar] [CrossRef]
  6. Kashif, I.; Salam, Z. A review of maximum power point tracking techniques of PV system for uniform insolation and partial shading condition. Renew. Sustain. Energy Rev. 2013, 19, 475–488. [Google Scholar]
  7. Bidyadhar, S.; Pradhan, R. A comparative study on maximum power point tracking techniques for photovoltaic power systems. IEEE Trans. Sustain. Energy 2013, 4, 89–98. [Google Scholar]
  8. Reisi, R.; Hassan Moradi, M.A.; Jamasb, S. Classification and comparison of maximum power point tracking techniques for photovoltaic system, A review. Renew. Sustain. Energy Rev. 2013, 19, 433–443. [Google Scholar] [CrossRef]
  9. Verma, D.; Nema, S.; Shandilya, A.M.; Dash, S.K. Maximum power point tracking (MPPT) techniques: Recapitulation in solar photovoltaic systems. Renew. Sust. Energy Rev. 2016, 54, 1018–1034. [Google Scholar] [CrossRef]
  10. Dash, S.K.; Verma, D.; Nema, S.; Nema, R.K. Comparative analysis of maximum power point (MPP) tracking techniques for solar PV application using MATLAB Simulink. In Proceedings of the International Conference on Recent Advances and Innovations in Engineering, Jaipur, India, 9–11 May 2014; pp. 1–7. [Google Scholar]
  11. Soubhagya, D.K.; Verma, D.; Nema, S.; Nema, R.K. Shading mitigation techniques: State-of-the-art in photovoltaic applications. Renew. Sustain. Energy Rev. 2017, 78, 369–390. [Google Scholar]
  12. Kumar Dash, S.; Nema, S.; Nema, R.K.; Verma, D. A comprehensive assessment of maximum power point tracking techniques under uniform and non-uniform irradiance and its impact on photovoltaic systems: A review. J. Renew. Sustain. Energy 2015, 7, 063113. [Google Scholar] [CrossRef]
  13. Verma, D.; Nema, S.; Shandilya, A.M.; Dash, S.K. Comprehensive analysis of maximum power point tracking techniques in solar photovoltaic systems under uniform insolation and partial shaded condition. J. Renew. Sustain. Energy 2015, 7, 042701. [Google Scholar] [CrossRef] [Green Version]
  14. Rajput, P.; Malvoni, M.; Manoj Kumar, N.; Sastry, O.S.; Jayakumar, A. Operational Performance and Degradation Influenced Life Cycle Environmental–Economic Metrics of mc-Si, a-Si and HIT Photovoltaic Arrays in Hot Semi-arid Climates. Sustainability 2020, 12, 1075. [Google Scholar] [CrossRef] [Green Version]
  15. Verma, D.; Nema, S.; Shandilya, A.M. A Different Approach to Design Non-Isolated DC–DC Converters for Maximum Power Point Tracking in Solar Photovoltaic Systems. J. Circuits Syst. Comput. 2016, 25, 1630004. [Google Scholar] [CrossRef]
  16. Nebti, K.; Lebied, R. Fuzzy Maximum Power Point Tracking Compared to Sliding Mode Technique for Photovoltaic Systems Based on DC-DC Boost Converter (2021). Electr. Eng. Electromech. 2021, 1, 67–73. [Google Scholar] [CrossRef]
  17. Situmorang, M.; Peranginangin, B. Performance assessment of photovoltaic generator(pvg) power system using maximum power point tracking (mppt) dc to dc boost converter and dc to ac inverter. J. Phys. Conf. Ser. 2020, 1485, 012061. [Google Scholar] [CrossRef]
  18. Zainuri, M.A.A.M.; Azari, E.A.; Ibrahim, A.A.; Ayob, A.; Yusof, Y.; Radzi, M.A.M. Analysis of adaptive perturb and observe-fuzzy logic control maximum power point tracking for photovoltaic boost DC-DC converter. Int. J. Adv. Trends Comput. Sci. Eng. 2019, 8, 201–210. [Google Scholar] [CrossRef]
  19. Shadlu, M.S. Comparison of maximum power point tracking (MPPT) algorithms to control DC-DC converters in photovoltaic systems. Recent Adv. Electr. Electron. Eng. 2019, 12, 355–367. [Google Scholar] [CrossRef]
  20. Zainuri, M.A.A.M.; Radzi, M.A.M.; Rahman, N.F.A. Photovoltaic boost DC/DC converter for power led with adaptive p&o-fuzzy maximum power point tracking. Lect. Notes Electr. Eng. 2019, 547, 245–251. [Google Scholar]
  21. Surya, P.P.; Irawan, D.; Zuhri, M. Review and comparison of DC-DC converters for maximum power point tracking system in standalone photovoltaic (PV) module. In Proceedings of the ICAMIMIA 2017: International Conference on Advanced Mechatronics, Intelligent Manufacture, and Industrial Automation, Surabaya, Indonesia, 12–14 October 2017; pp. 242–247. [Google Scholar]
  22. Sultan, N.S. Design and comparative study of photovoltaic maximum power point tracking converter with DC motor speed control. In Proceedings of the 1st International Scientific Conference of Engineering Sciences—3rd Scientific Conference of Engineering Science; ISCES 2018—Proceedings, Diyala, Iraq, 10–11 January 2018; pp. 74–79. [Google Scholar]
  23. Verma, D.; Nema, S.; Nema, R.K. Implementation of Perturb and Observe Method of Maximum Power Point Tracking in SIMSCAPE/MATLAB. In Proceedings of the IEEE International Conference on Intelligent Sustainable Systems, Palladam, Tamil Nadu, India, 7–8 December 2017. [Google Scholar]
  24. Amarnath, R.K.; Deepak Verma, N. Harmonics Mitigation of P&O MPPT Based Solar Powered Five-Level Diode-Clamped Multilevel Inverter. In Proceedings of the IEEE International Conference on Innovations in Control, Communication and Information System, Greater Noida, India, 12–13 August 2017. [Google Scholar]
  25. Hart, D.W. Power Electronics; Tata McGraw-Hill Education: Noida, India, 2011. [Google Scholar]
  26. Paul, S.; Jacob, K.P.; Jacob, J. Solar photovoltaic system with high gain dc to dc converter and maximum power point tracking controller. J. Green Eng. 2020, 10, 2956–2972. [Google Scholar]
  27. Hauke, B. Basic Calculation of a Buck Converter’s Power Stage; Technical Report, SLVA477; Texas Instruments: Dallas, TX, USA, 2014. [Google Scholar]
  28. Altamimi, A.; Khan, Z.A. A DC-DC buck converter with maximum power point tracking implementation for photovoltaic module application. In Proceedings of the 2017 IEEE Conference on Energy Conversion, CENCON 2017, Kuala Lumpur, Malaysia, 30–31 October 2017; pp. 305–310. [Google Scholar]
  29. Hauke, B. Basic Calculation of a Boost Converter’s Power Stage; Application Report; Texas Instruments: Dallas, TX, USA, 2012. [Google Scholar]
  30. Bulut, K.; Ghaderi, D. Maximum power point tracking by the small-signal-based pi and fuzzy logic controller approaches for a two-stage switched-capacitor dc-dc power boost converter; applicable for photovoltaic utilizations. El-Cezeri J. Sci. Eng. 2020, 7, 1167–1190. [Google Scholar] [CrossRef]
  31. Shaw, P.; Garanayak, P. Analysis, design and implementation of analog circuitry-based maximum power point tracking for photovoltaic boost DC/DC converter. Trans. Inst. Meas. Control 2019, 41, 668–686. [Google Scholar] [CrossRef]
  32. Sahu, P.; Deepak, V.; Savita, N. Physical design and modelling of boost converter for maximum power point tracking in solar PV systems. In Proceedings of the IEEE International Conference on Electrical Power and Energy Systems (ICEPES), Bhopal, India, 14–16 December 2016. [Google Scholar]
  33. Maiti, A.; Mukherjee, K.; Syam, P. Design, modeling and software implementation of a current-perturbed maximum power point tracking control in a DC-DC boost converter for grid-connected solar photovoltaic applications. In Proceedings of the 2016 IEEE 1st International Conference on Control, Measurement and Instrumentation, CMI 2016, Kolkata, India, 8–10 January 2016; pp. 36–41. [Google Scholar]
  34. Green, M. Design Calculations for Buck-Boost Converters; Application Report; Texas Instruments: Dallas, TX, USA, 2012. [Google Scholar]
  35. Banumalar, K.; Lakshmi, R.T.; Manikandan, B.V.; Chandrasekaran, K. A Novel Modified DC/DC/AC Converter for Maximum Power Point Tracking from Photovoltaic System. In EAI/Springer Innovations in Communication and Computing; Springer: Berlin/Heidelberg, Germany, 2021; pp. 463–479. [Google Scholar]
  36. Shanthi, T. Incremental conductance method of maximum power point tracking for photovoltaic array with single switch DC/DC converter. J. Adv. Res. Dyn. Control. Syst. 2017, 9, 1181–1191. [Google Scholar]
  37. Mao, M.; Zhang, L.; Duan, Q.; Chong, B. Multilevel DC-link converter photovoltaic system with modified PSO based on maximum power point tracking. Sol. Energy 2017, 153, 329–342. [Google Scholar] [CrossRef]
  38. Nikhil, K.; Gawre Suresh, K.; Deepak, V. Modeling and Simulation of Solar Photovoltaic System and Interfacing with Neutral Point clamped Multilevel Inverter. In Proceedings of the International Conference in Electrical, Electronics and Computer Science (ICEECS-2014), Chennai, India, 24–25 November 2017; Volume 30. [Google Scholar]
  39. Available online: Ecosenseworld.com (accessed on 9 January 2022).
  40. Available online: http//pvemulator.ecosenseworld.com/pvemulator (accessed on 22 January 2017).
  41. National Instrument Corporation. OEM Operating Instructions and Specifications NI sbRIO-9605/9606. Available online: http//www.ni.com/pdf/manuals/373378a.pdf (accessed on 22 January 2017).
Figure 1. MPP for different insolation on (a) current vs. voltage curve and (b) power vs. voltage curve.
Electronics 11 01053 g001
Figure 2. Block illustration of general MPPT operation [15].
Electronics 11 01053 g002
Figure 3. Power characteristic of SPV in perspective with P&O MPPT [23].
Electronics 11 01053 g003
Figure 4. Boost converter: graph of output current, output power, and VPV with duty cycle.
Electronics 11 01053 g004
Figure 5. Buck converter: graph of output voltage, output current, output power, and VPV with duty cycle.
Electronics 11 01053 g005
Figure 6. Buck-boost converter: graph of output voltage, output current, output power, and VPV with duty cycle.
Electronics 11 01053 g006
Figure 7. Comparison of (a) conventional P&O method with (b) proposed method in terms of sensing parameters.
Electronics 11 01053 g007
Figure 8. Flow chart of proposed MPPT algorithm.
Electronics 11 01053 g008
Figure 9. Block diagram of hardware scheme.
Electronics 11 01053 g009
Figure 10. Solar PV emulator with four channels (CH1 to CH4).
Electronics 11 01053 g010
Figure 11. (a). Specification of the array taken for testing. (b). Specification of the array uploaded in the PV emulator.
Electronics 11 01053 g011
Figure 12. I-V and P-V characteristic of PV array at 09:00 A.M.
Electronics 11 01053 g012
Figure 13. I-V and P-V characteristic of PV array at 10:00 A.M.
Electronics 11 01053 g013
Figure 14. I-V and P-V characteristic of PV array at 13:00.
Electronics 11 01053 g014
Figure 15. DC-DC boost converter.
Electronics 11 01053 g015
Figure 16. NI card: sbRIO-9606 connection diagram.
Electronics 11 01053 g016
Figure 17. Labview block diagram of proposed MPPT technique.
Electronics 11 01053 g017
Figure 18. Complete setup of hardware implementation.
Electronics 11 01053 g018
Figure 19. The front window of Labview.
Electronics 11 01053 g019
Figure 20. Results (for 13:00) obtained by hardware implementation: CH1: voltage across the load resistance (62.5 V); CH2: current across the load (1.6 A); and CH3: solar PV array’s terminal voltage (VPV = 34.9 V).
Electronics 11 01053 g020
Figure 21. Results (for 09:00 A.M.) obtained by hardware implementation: CH1: voltage across the load resistance (44.8 V); CH2: current across the load (1.25 A); and CH3: solar PV array’s terminal voltage (VPV = 31.5 V).
Electronics 11 01053 g021
Figure 22. Results (for 10:00 A.M.) obtained by hardware implementation: CH1: voltage across the load resistance (54.5 V); CH2: current across the load (1.4 A); and CH3: solar PV array’s terminal voltage (VPV = 33 V).
Electronics 11 01053 g022
Figure 23. PV emulator connection for partial shading condition.
Electronics 11 01053 g023
Figure 24. I-V and P-V characteristic of PV array for partial shading condition (CH1 at 10:00 A.M. and CH2 at 11:00 A.M.).
Electronics 11 01053 g024
Figure 25. Results for partial shading condition obtained by hardware implementation: CH1: voltage across the load resistance (67 V); CH2: current across the load (1.9 A); and CH3: solar PV array’s terminal voltage (VPV = 70 V).
Electronics 11 01053 g025
Table 1. Methodology of P&O technique [23].
PerturbationChange in PowerNext Perturbation
(+) Positive (+) Positive(+) Increment in duty ratio ‘D
(+) Positive(−) Negative(−) Decrease in duty ratio ‘D
(−) Negative(+) Positive(−) Decrease in duty ratio ‘D
(−) Negative(−) Negative(+) Increment in duty ratio ‘D
Table 2. Methodology of the proposed method.
PerturbationChange in Load VoltageNext Perturbation
(+) Positive (+) Positive(+) Increment in duty ratio ‘D
(+) Positive(−) Negative(−) Decrease in duty ratio ‘D
(−) Negative(+) Positive(−) Decrease in duty ratio ‘D
(−) Negative(−) Negative(+) Increment in duty ratio ‘D
Publisher’s Note: MDPI stays neutral with regard to jurisdictional claims in published maps and institutional affiliations.

