Article

A Full Investigation of Terahertz Wave Power Transmission in Plasma from Theoretical, Numerical, and Experimental Perspectives

1
School of Marine Science and Technology, Northwestern Polytechnical University, Xi’an 710072, China
2
Electric Power Research Institute of State Grid Shaanxi Electric Power Company, Xi’an 710000, China
3
Hypersonic Velocity Institute, China Aerodynamics Research & Development Center, Mianyang 621000, China
*
Authors to whom correspondence should be addressed.
Electronics 2022, 11(9), 1432; https://doi.org/10.3390/electronics11091432
Submission received: 29 March 2022 / Revised: 20 April 2022 / Accepted: 24 April 2022 / Published: 29 April 2022
(This article belongs to the Collection Millimeter and Terahertz Wireless Communications)

Abstract

:
Radio communication is a vital challenge during vehicle reentry into the Earth’s atmosphere in practice, because the plasma covering the aerospace vehicle can block the communication as the spacecraft reenters the atmosphere. To investigate the potential of the terahertz wave, the transfer function method is first applied to study the wave propagation behavior in plasma, validated by the numerical and the experimental results. The comparison of all three results shows a decent agreement, with the average absolute difference around 1.1 dB for the power loss between the theoretical and numerical results for 100 GHz and 220 GHz and around 0.8 dB for the power loss between the simulation and measurement for 100 GHz and 220 GHz, which shows the validity of the transfer function method and the great potential of the numerical model for future study. Moreover, the results shows the possibility of the application of the THz wave to deal with the blackout problem.

1. Introduction

Communication blackout is a common problem for the hypersonic vehicle traveling in the Earth and Mars atmospheres. This is mainly due to the fact that the electromagnetic (EM) wave would be blocked by the plasma layer around the leading edge of the vehicle, which is inherently the ionized air caused by the shock wave created by the high speed. The appearance of a communication blackout would cause trouble in the telemetry, communication, and guidance of the aircraft; thus, numerous methods have been proposed to tackle such problems [1,2,3,4,5]: the Aerodynamic Shaping Method (ASM) [1], the Coolants Injection Method (CIM) [2], the Static Magnetic Field Method (SMFM) [3], the EM Field Mitigation Method (EMFMM) [4], and the High Frequency Method (HFM) [5]. For ASM, sharply pointed vehicles are designed to make the surrounding plasma as thin as possible. For CIM, remote antenna assemblies mounted in the nose of the fuselage or wing-ends are applied to enhance the communication performance, where a gaseous coolant should be injected to protect the antenna from the heat. Both ASM and CIM aim to reduce the concentration of electrons, but ASM can affect the stability of the spacecraft, while CIM can introduce a difficult challenge to the design because of the storage of the coolant and means of insertion. SMFM and EMFMM utilize magnetic fields or electromagnetic fields to control the plasma density, where a window is created by redistributing the plasma to make the window as thin as possible; however, both methods need the proper assembly of the electrodes and magnets. Clearly, the first four methods, i.e., ASM, CIM, SMFM, and EMFMM, can only mitigate the problem. Worse, some of them could decrease the flexibility of the aircraft and produce a delay in the reconnaissance and reaction.
From a theoretical perspective, it is feasible to promote the communication frequency higher than the cutoff frequency of the plasma to make the wave travel through the plasma covering the aircraft, making the THz frequencies a promising band. The THz wave was originally studied in the area of radio astronomy [6] because of its small attenuation at high altitude. Due to such characteristics, the communication distance could reach far enough for space telemetry and an air–ground link. Recently, more and more studies have been conducted in this area. THz wave propagation performance in discharged plasma was studied in [7] by Tosun et al. in 2009. The frequency of 200 GHz was assigned to the next intersatellite communication band by the International Telecommunication Union (ITU) [8]. The EM propagation performance was simulated [9] and THz wave behavior was numerically studied both in demagnetized plasma [10] and bonded magnetized plasma [11]. However, few papers address the measurement technology to characterize the power transmission behavior. In this paper, the traditional methods generally used in THz measurement are applied to calculate the transmission function with a numerical model built in COMSOL to validate the results. Most importantly, the theoretical results obtained are compared with the available measurement results at both 100 GHz and 220 GHz to determine whether it can be used for further study.
The rest of the paper is organized as follows. In Section 2, the measurement system is introduced in detail. In Section 3, the theoretical and numerical model are discussed in detail, followed by the results comparison in Section 4. In the end, a brief conclusion is drawn.

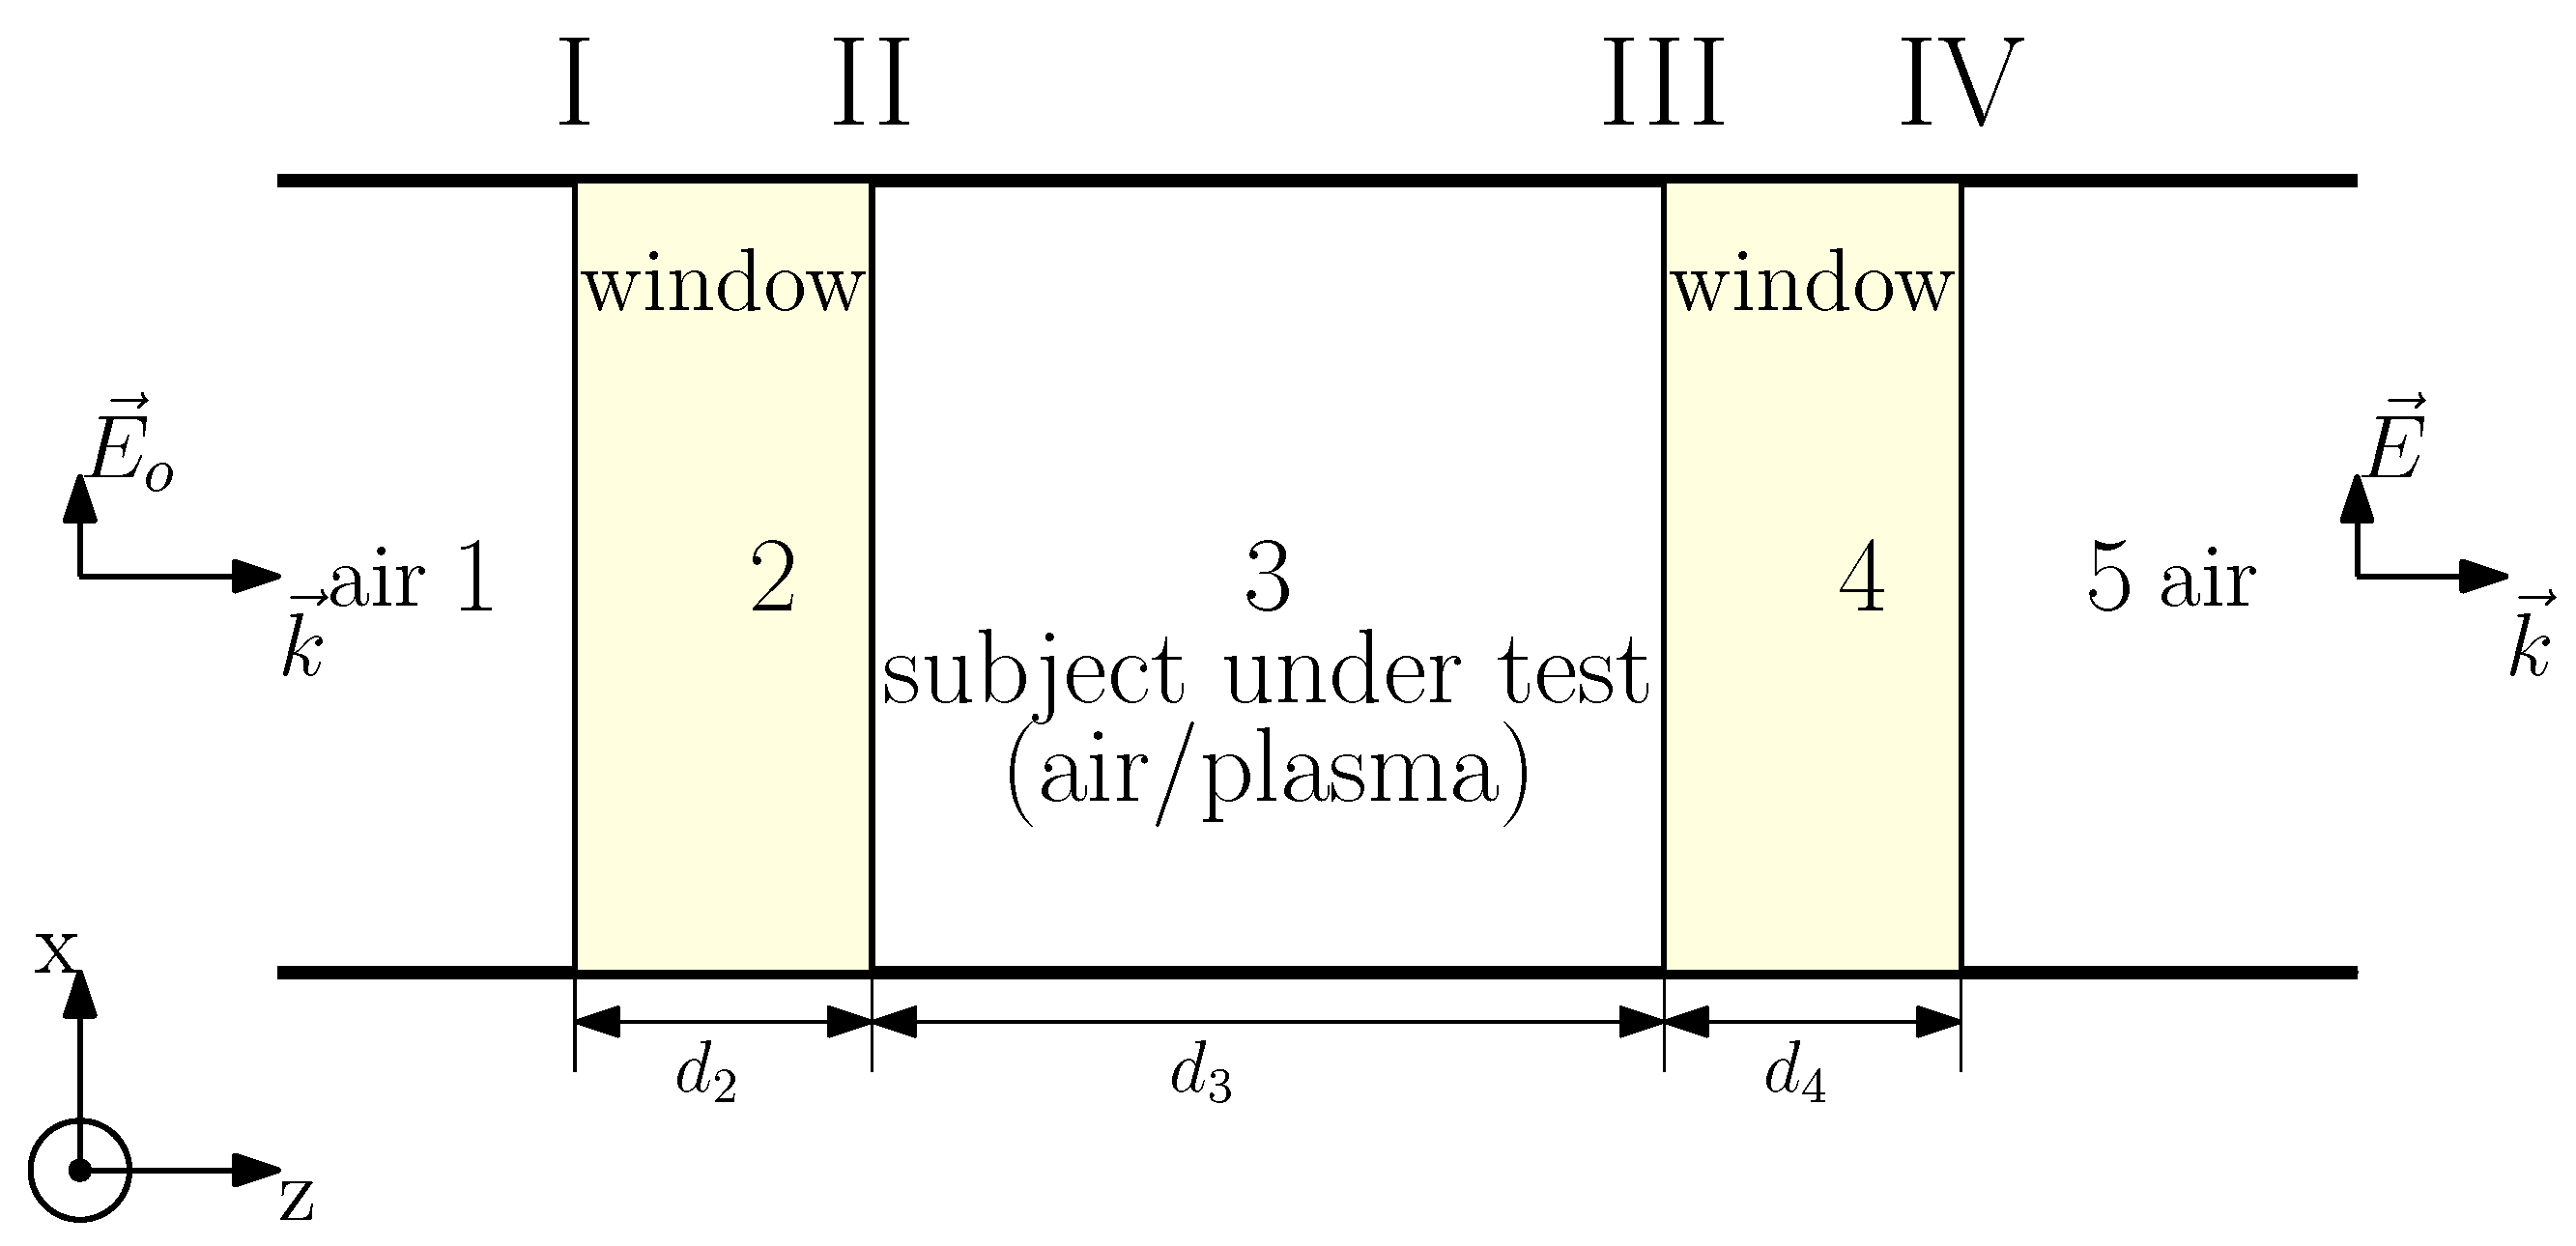
2. Measurement System Description

Due to its scarcity, plasma is often generated in the lab to investigate its performance; a shock tube is a common device, which can effectively produce high speed time-varying plasma, the same as the one produced by a high-velocity aircraft [12,13]. Figure 1 illustrates the schematics of a typical shock tube used for plasma generation and wave transmission measurement. The driver gas in the high pressure test section is usually a mixture of H 2 and O 2 , which would be ignited to produce a shock wave. The generating shock wave would break the diaphragm and ionize the experimental gas in the test section because of the produced high pressure and high temperature brought by the shock wave. Usually, air would be chosen as effective experimental gases in the test section. The ionization probe would be used to obtain the velocity of the wave. At the same time, the pressure sensors deployed in the tube would be used to measure the pressure P of the high-temperature gas, while Langmuir probes are applied to obtain the electron temperature T and density of the plasma gas n e . Then, the collision frequency, v e , can be calculated with the measured pressure P and electron temperature T [10]; both collision frequency v e and electron density n e can be used to produce the relative permittivity of the hot plasma gas [14] with Equation (1).
ϵ r p = 1 ω p 2 ω o 2 + v e 2 j v e ω o ω p 2 ω o 2 + v e 2
where ω o is the working frequency of the wave, while ω p = n e e 2 ϵ o m e is the plasma frequency with n e as the electrons number density, e = 1.602176634 × 10 19 C as the electron charge, and m e = 9.109 × 10 31 kg as the electron mass; v e = 2 π f e , where f e stands for the electron electron–neutron collision frequency.
Table 1 and Table 2 show the corresponding gas parameters under various pressures and temperatures at 100 GHz and 220 GHz, respectively.
The THz wave transmission system, shown in Figure 2 was applied to study the transmission behavior of the THz wave in the plasma. The thickness of the plasma layer d p was 80 mm, and the thickness of the antenna windows d w was 30 mm. The whole system was designed by the Microsystem & Terahertz Research Center of the China Academy of Engineering Physics. During the experiment, the gases of the second area produced by the shock-wave were measured at both 100 GHz and 220 GHz, which are the common transmission windows of the atmosphere.
The measurement process can be summarized as follows [13]:
  • The whole system with the shock-wave tube off-work was measured to obtain the reference S r e f parameters to calibrate the final data where the test area is just air.
  • Then, the S parameters were measured with the shock-wave tube working to produce the plasma gas in the test area, recorded as S p l a s m a .
  • The whole transmission coefficient of the system can be obtained: T C [ d B ] = S 2 1 p l a s m a [ d B ] S 2 1 r e f [ d B ] , with the effects of the antenna windows.
Because the antenna windows are highly transparent to the THz wave, the reflection from them can be neglected. Therefore, the attenuation of the plasma in the tube can be obtained A t t = T C [ d B ] .
It should be mentioned that the plasma was almost homogeneous in the test area especially perpendicular to the wave propagation direction. In addition, the THz antennas were applied to make the test area small enough so that the process could be simplified to the plane wave propagation problem, although the test area was located in the near field of the antenna.

3. Analytical Model and Numerical Model

3.1. Analytical Model

Figure 3 displays a schematic of the interaction of the THz wave with the test area. A TE wave incidence case was studied here, while the same results would also work for the TM wave case. From the figure, it can be easily seen that the whole space was divided into five parts: medium one and five were air; medium two and four were antenna windows; and medium three was where the shock-wave tube was located to produce the plasma as requested. The TE wave traveled along the z axis with the electric field parallel to the x axis. The thickness of each layer can be given as d i ( i = 2 , 3 , 4 ), where d 2 = d 4 = d w and d 3 = d p .
The dielectric constant of the non-magnetized plasma can be obtained by Equation (1) [14] from the measured parameters described in Section 2.
When a perpendicularly incident TE wave travels from one medium to another, some energy would be transmitted while partly reflected. After the transmitted portion moves through the material, the wave would be affected by the propagation in the latter medium.
The Fresnel Equations can be applied to describe the transmission and reflection at the interface [15], on the basis of the material’s complex refractive index, n ˜ = n j κ = ϵ , where n is the real refractive index, while κ represents the extinction coefficient, proportional to the absorption coefficient, κ = α c 2 ω with ω as the angular frequency; ϵ is the dielectric constant of the medium. The Fresnel Equations at the interface between two layers can be written as:
t 21 = 2 n ˜ 1 n ˜ 1 + n ˜ 2
r 21 = n ˜ 2 n ˜ 1 n ˜ 1 + n ˜ 2
where t 21 is the transmission coefficient from area 1 to area 2, and r 21 stands for the reflection in area 1 at the interface.
After the wave travels through the interface into area 2, its propagation along a distance of d from the interface can be described as:
p 2 = e x p ( j n ˜ 2 ω d c )
where c is the speed of light, and ω = 2 π f with f as the working frequency of the wave.
It should be pointed out that the scattering loss was neglected in this model.
According to the measurement process, the following calculation can be performed [16]:
  • In the calibration phase for the reference, area 3 was full of air; thus, the E field at Medium 5 can be obtained:
    E 1 = E o t I 1 p 21 t I I 1 p 31 t I I I 1 p 41 t I V 1
    where E o is the initial amplitude of the E field; t i 1 stands for the transmission coefficient of the interface i = I , I I , I I I , I V , while p i 1 describes the wave propagation in the medium i = 2 , 3 , 4 .
  • After the calibration process, area 3 was filled with the non-magnetized plasma; thus, the E field at Medium 5 can be obtained:
    E 2 = E o t I 2 p 22 t I I 2 p 32 t I I I 2 p 42 t I V 2
    where E o is the initial amplitude of the E field; t i 2 stands for the transmission coefficient of the interface i = I , I I , I I I , I V , while p i 2 describes the wave propagation in the medium i = 2 , 3 , 4 .
  • Finally, the transfer function can be obtained:
    T F = E 2 / E 1 = t I I 2 p 32 t I I I 2 t I I 1 p 31 t I I I 1
    because t I 1 , p 21 , p 41 , and t I V 1 are the same as t I 2 , p 22 , p 42 , and t I V 2 , respectively.
In Equation (7), the transmission coefficient of the interfaces and the propagation coefficient in layer 3 can be written as:
t I I 2 = 2 n ˜ w n ˜ w + n ˜ p
t I I I 2 = 2 n ˜ p n ˜ p + n ˜ w
t I I 1 = 2 n ˜ w n ˜ w + n ˜ o
t I I I 1 = 2 n ˜ o n ˜ o + n ˜ p
p 32 = e x p ( j n ˜ p ω d 3 c )
p 31 = e x p ( j n ˜ o ω d 3 c )
Thus, Equation (7) can be simplified into:
T F = ( n ˜ w + n ˜ o ) 2 ( n ˜ w + n ˜ p ) 2 n ˜ p n ˜ o e x p ( j ( n ˜ p n ˜ o ) w d 3 c )
where, n ˜ o , n ˜ w , and n ˜ p are the refractive index of the air, window, and plasma, respectively; and d 3 is the thickness of layer 3.
The attenuation would be calculated from the results of the transfer function A t t = T F [ d B ] .

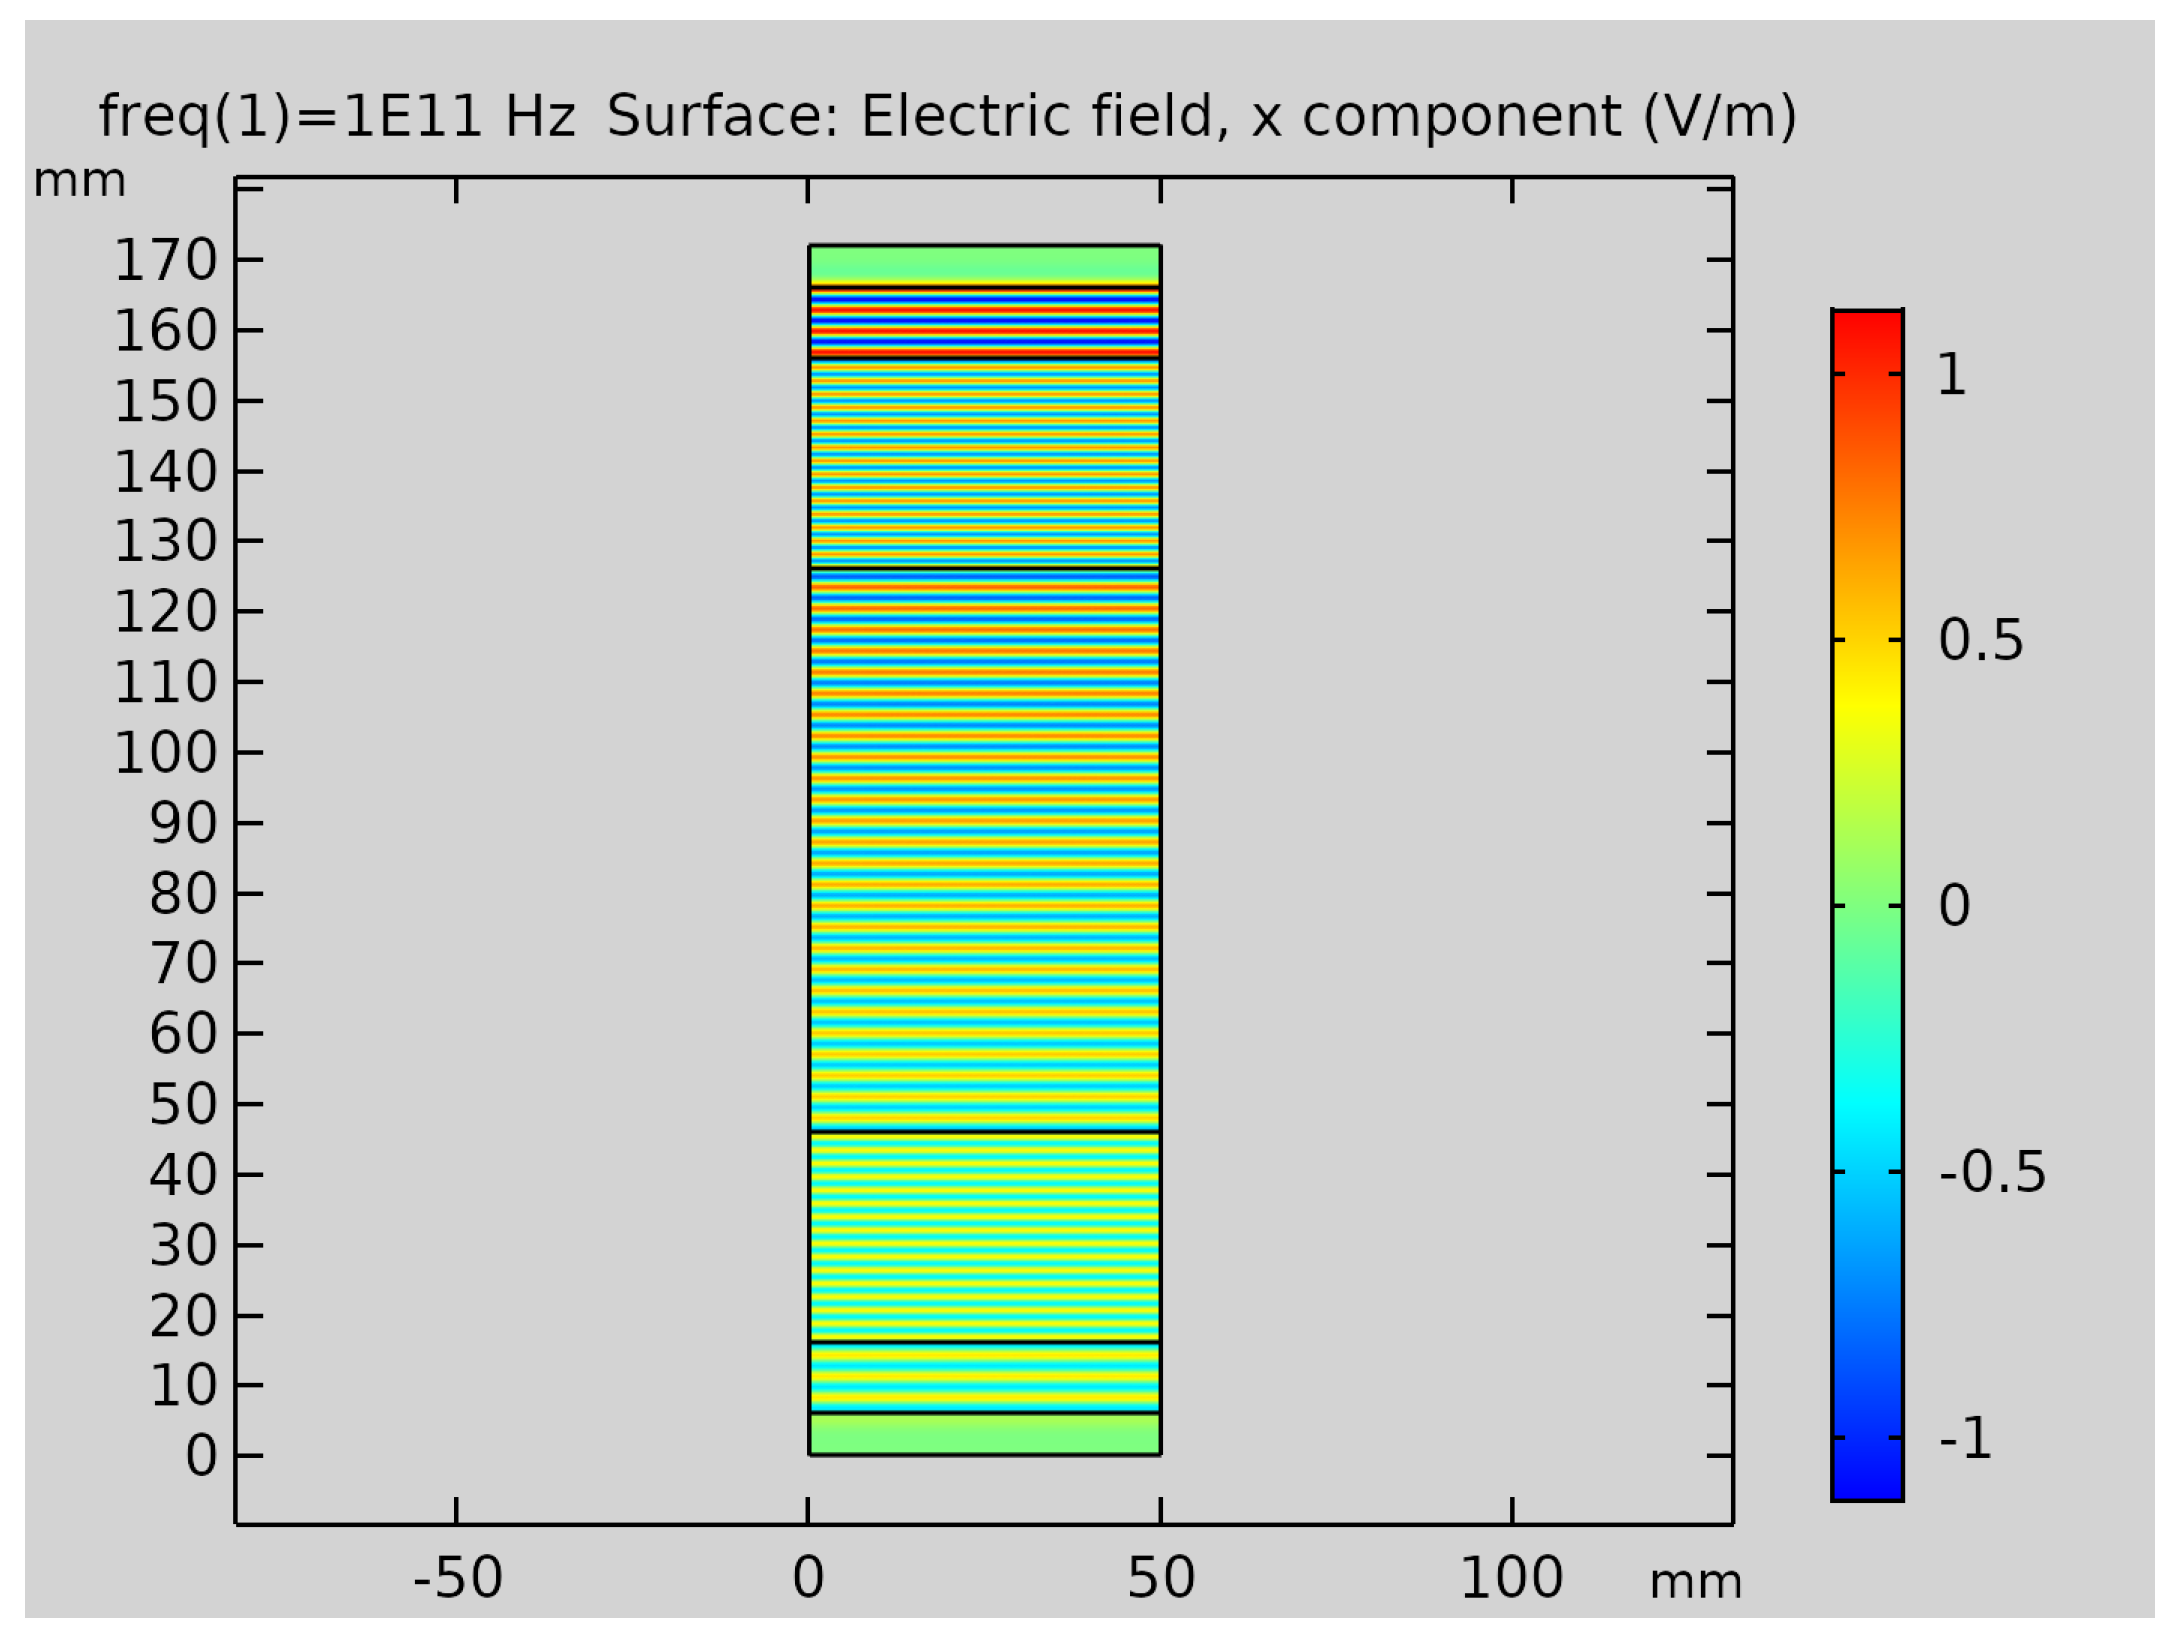
3.2. Numerical Model

Meanwhile, according to the statements in the experiment setup and analytical model, the numerical model shown in Figure 4, was set up in the commonly used commercial software COMSOL to investigate the propagation behaviors of the TE wave traveling through the plasma covered by two windows. The RF Module was applied and Frequency domain analysis was conducted, because the single-frequency THz transmission approach was applied in the measurement. The sweep time was around 40∼100 μ s, which was not suitable for the measurement of high-speed time-varying plasma in shock tube. In the same setup as the analytical model and measurement, there were five areas: air, window, plasma, window, and air, where the air was introduced to model the air gap between the antenna and window in the experiment and also to avoid the boundary effect of the PML. By aligning the dielectric constants to each layer, the whole testing system was modeled, where the related parameters are shown in Table 3.
Because the plasma was homogeneous along the z axis [13], the 2D model, shown in Figure 4 with five dielectric rectangular at the level of m m was built first. From top to bottom, the layers were sequentially assigned as air, window, plasma, window, and air, with the related dielectric parameters assigned. To realize the plane wave propagation, two PML layers were added on the top and bottom, and the periodic conditions were applied to other boundaries. A TE wave was defined in port 1 to investigate the wave propagation where the E-field was pointing to + x to make the wave propagate along the y direction. Two points were aligned near two ports to record the E-field components. As in the experiment, two simulations were conducted to obtain a Transmission Coefficient similar to the measurement:
  • We assigned area 3 as air and ran the simulation to obtain the reference e-field E r e f at port 2;
  • We changed medium 3 to plasma to obtain the E p l a s m a ;
  • The transmission coefficient could then be obtained: T C s i m = E p l a s m a / E r e f .
It should be noticed that two sets of S parameters were recorded as with the experimental analysis to calculate the field attenuation A t t = T C s i m [ d B ] .

4. Results and Discussion

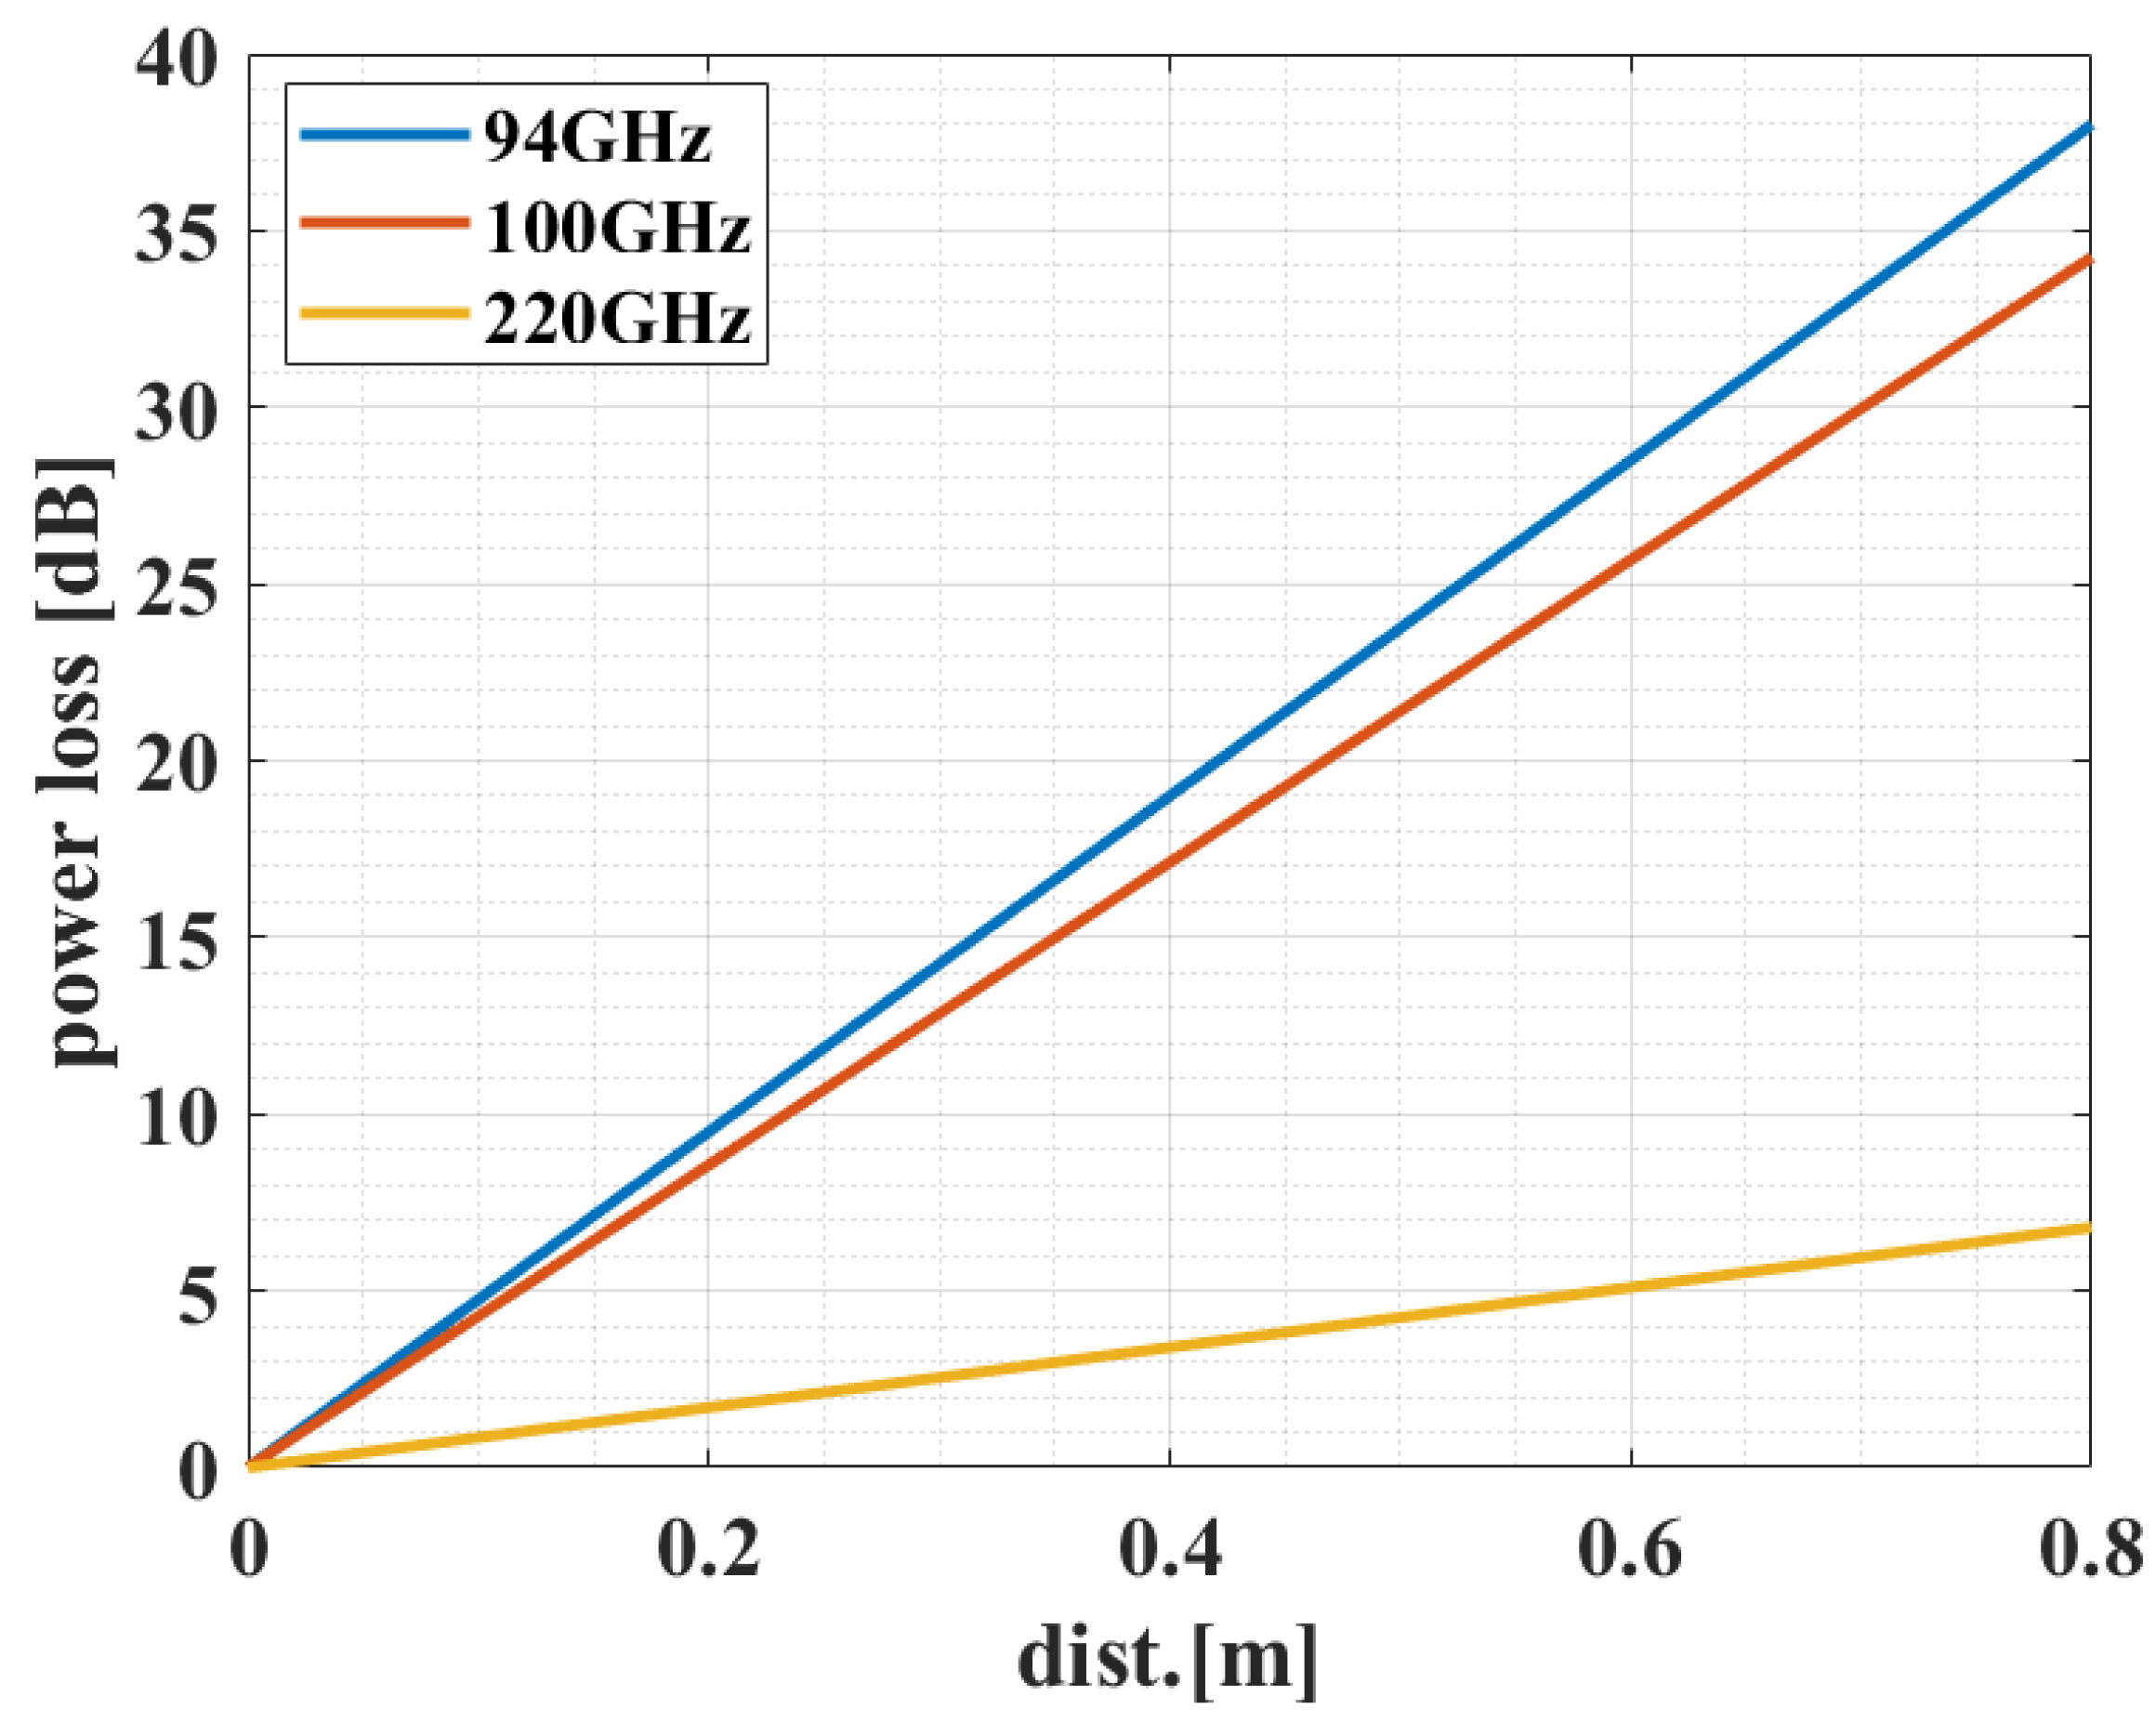
4.1. Comparison of Transmission Attenuation for Theoretical, Numerical, and Measured Results

The comparison of the field attenuation for the theoretical, numerical, and measured results is illustrated in Table 4 and Table 5, respectively. By observing the tables, it can be easily seen that with the increase in the electron density, the attenuation rose. For both frequencies of interest, there were differences between the measured results and the simulated and theoretical ones because of the measurement method of n e and f e , which would lead to the difference of the epsilon to obtain the simulated and theoretical results. However, the simulated and theoretical results match well, validating the transfer method and the simulation model. From the Table 4 and Table 5, we can also see that the two datasets for both 100 GHz and 220 GHz agreed with each other, and, at the same time, we can see that at 220 GHz the attenuation was higher than that at 100 GHz, showing the ability of the THz wave for communication in plasma.

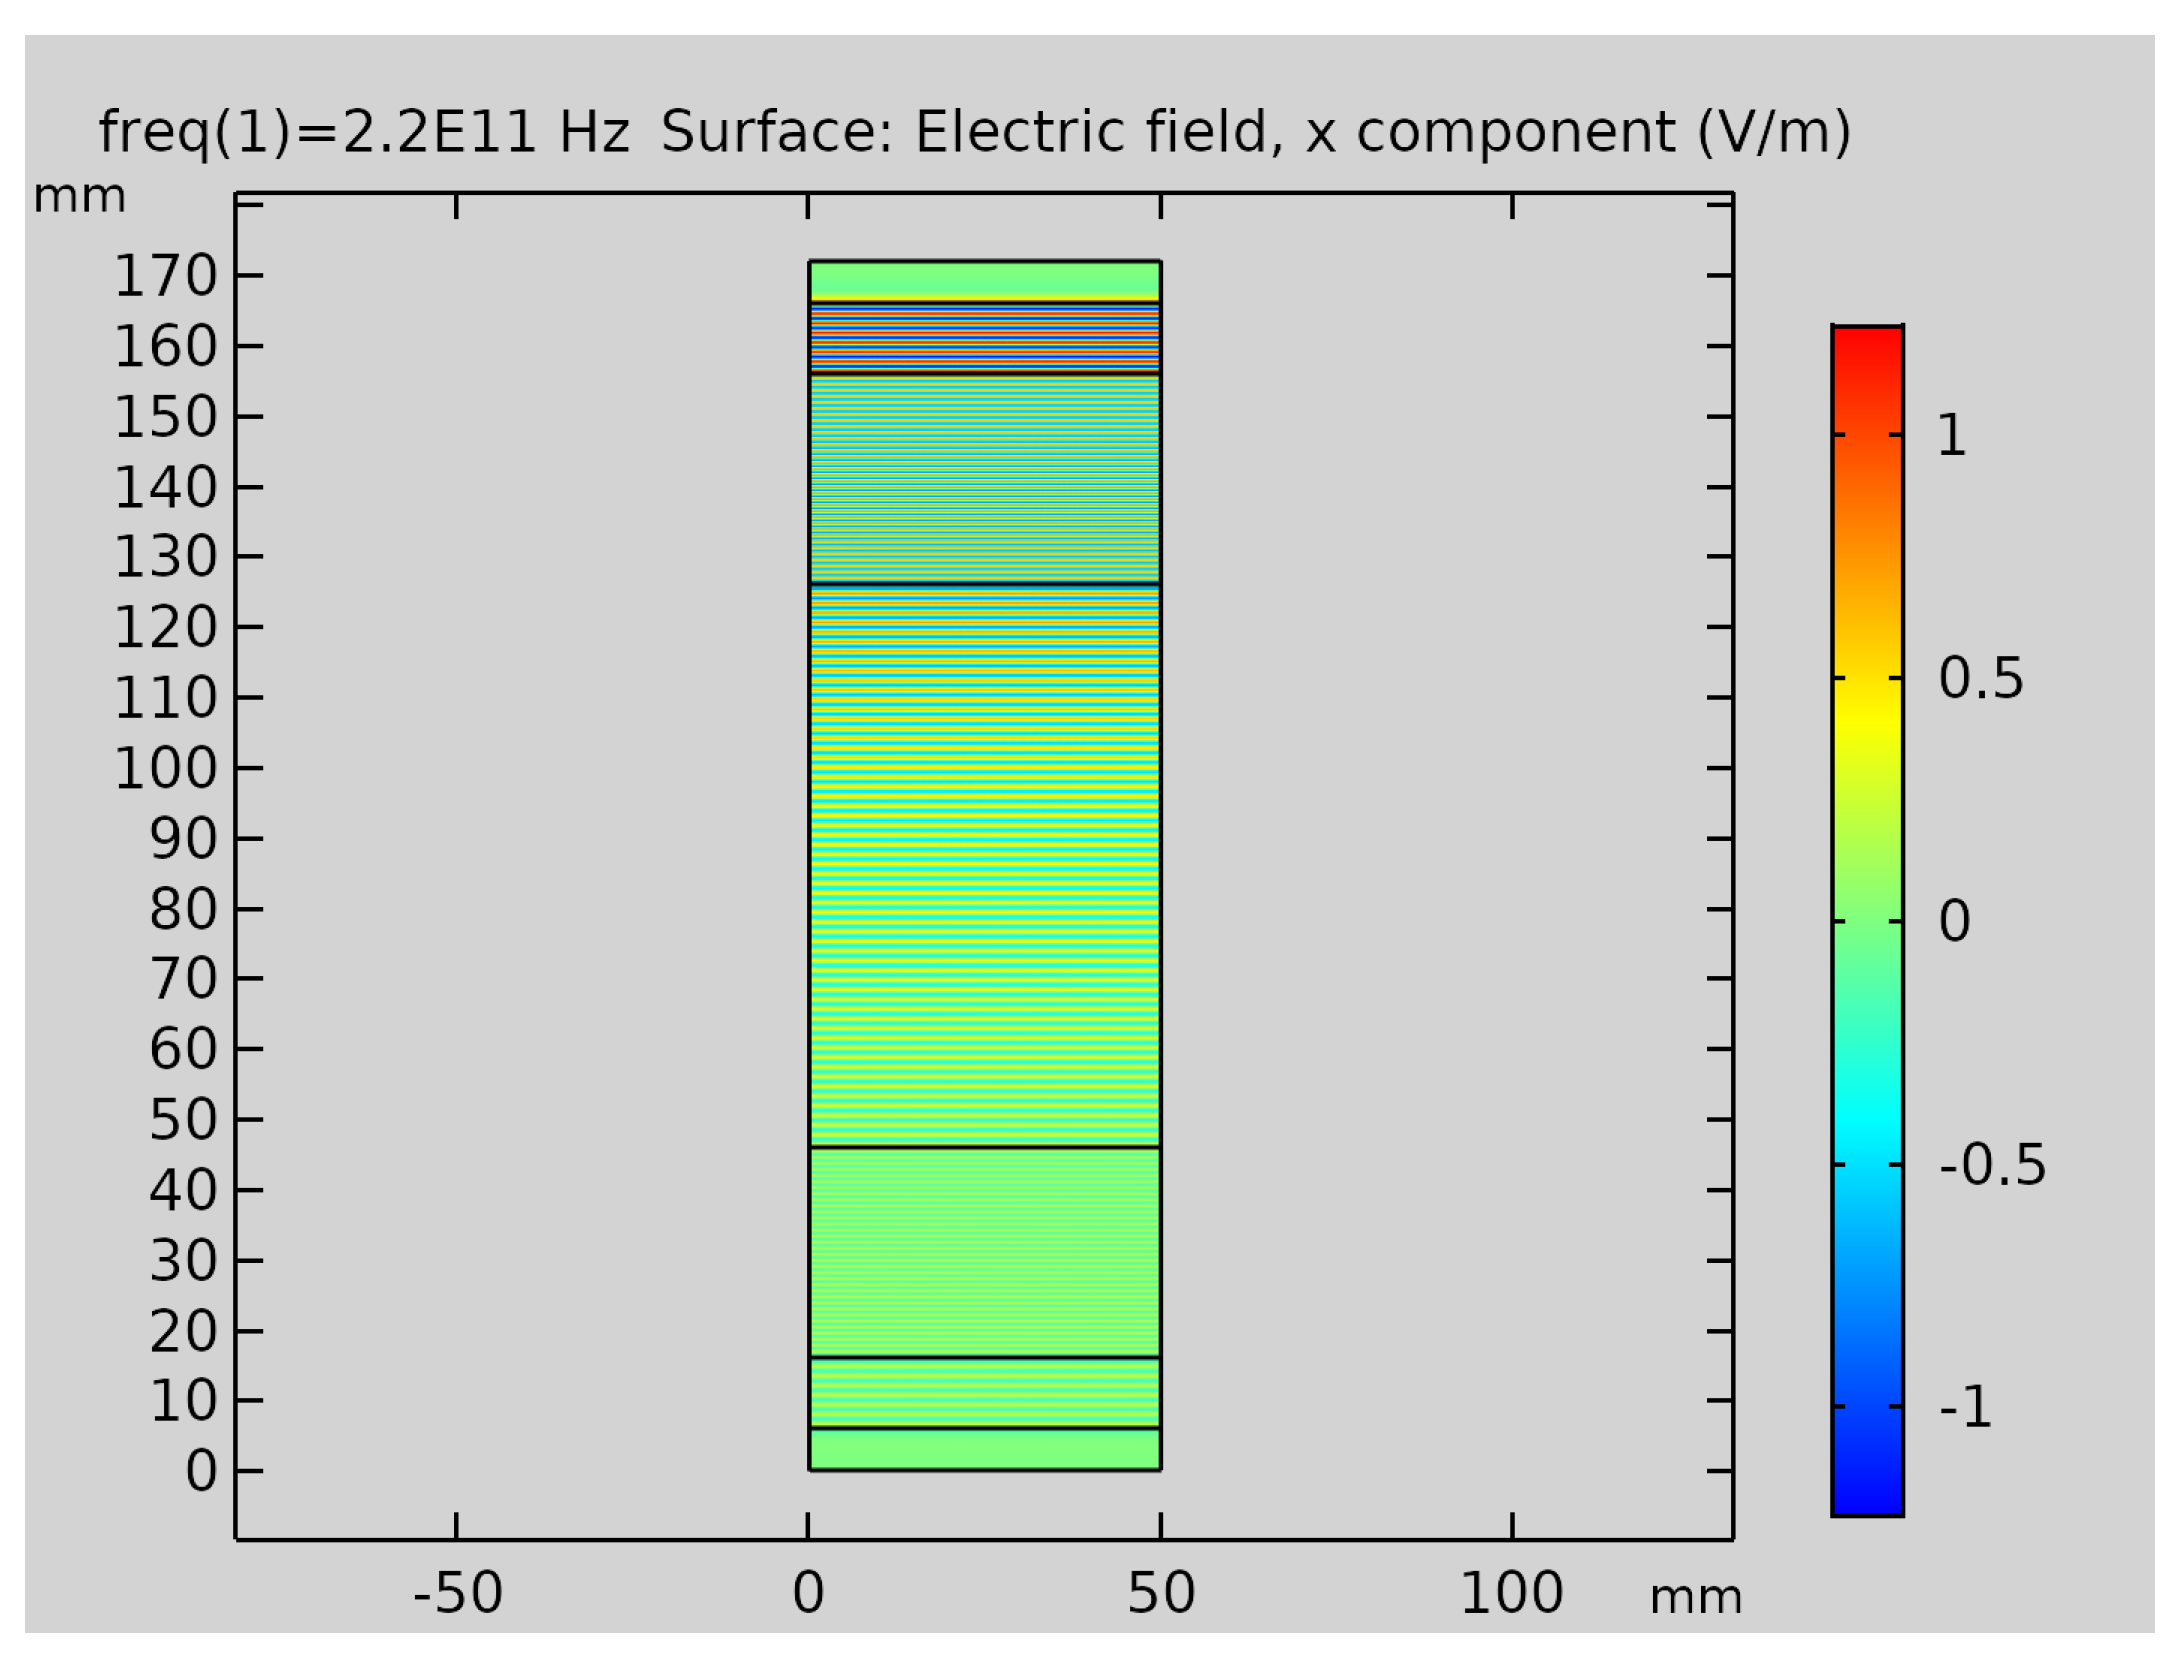
4.2. Field Distribution of the Full Wave Simulation

The full wave simulation results of 100 GHz and 220 GHz are illustrated in Figure 5 and Figure 6. It can be seen that the THz wave can transmit the plasma layer. Moreover, 220 GHz suffers more loss than 100 GHz. To investigate the power attenuation in plasma, suppose n e = 1.6 × 10 18 m 3 , and f e = 4.2 × 10 10 Hz; then, α = ω 0.5 μ 0 ϵ 0 ϵ r p r + ϵ r p r 2 + ϵ r p i 2 . Thus, the relationship of power loss to the transmission distance for different frequencies are shown in Figure 7. These three frequencies (i.e., 94 GHz, 100 GHz, and 220 GHz) are all in the typical THz transmission windows. From the figure, we can see that with the increase in the frequency the attenuation lowers, and, for the THz band, the attenuation is reasonable enough for the wave to travel through. By comparing Figure 5, Figure 6 and Figure 7, it can be easily seen that the wave performs differently in various plasma states.

5. Conclusions

The transfer function method was firstly applied to study the THz wave propagation behavior, validated by the numerical model built in COMSOL, modeling the whole procedure of the experiment. The comparison between the results showed that both the theoretical and numerical method are sufficient for future study, when the experiment cannot capture the whole performance of the THz wave propagation behavior or is difficult to realize. As an initial study on THz wave behavior through plasma, the channel performance was missing in the paper, but it will be our future focus to investigate the feasibility of THz communication between the ground station and the reentering aircraft.

Author Contributions

Conceptualization, K.Y.; methodology, K.Y.; validation, K.Y. and D.P.; formal analysis, K.Y.; investigation, J.W.; data curation, P.M.; writing—original draft preparation, K.Y. and D.P.; writing—review and editing, K.Y. and J.W.; supervision, B.L.; project administration, K.Y.; funding acquisition, K.Y. All authors have read and agreed to the published version of the manuscript.

Funding

This research was partly funded by NFSC grant number 61901386 and by Long-term Funds of Science and Technology on Near-Surface Detection Laboratory grant number TCGZ2020C002.

Conflicts of Interest

The authors declare no conflict of interest.

References

  1. Rybak, J.P.; Churchill, R. Progress in reentry communications. IEEE Trans. Aerosp. Electron. Syst. 1971, 5, 879–894. [Google Scholar] [CrossRef]
  2. Belov, I.; Borovoy, V.Y.; Gorelov, V.; Kireev, A.; Korolev, A.; Stepanov, E. Investigation of remote antenna assembly for radio communication with reentry vehicle. J. Spacecr. Rocket. 2001, 38, 249–256. [Google Scholar] [CrossRef]
  3. Mehra, N.; Singh, R.K.; Bera, S.C. Mitigation of communication blackout during re-entry using static magnetic field. Prog. Electromagn. Res. B 2015, 63, 161–172. [Google Scholar] [CrossRef] [Green Version]
  4. Kim, M.; Keidar, M.; Boyd, I.D. Analysis of an electromagnetic mitigation scheme for reentry telemetry through plasma. J. Spacecr. Rocket. 2008, 45, 1223. [Google Scholar] [CrossRef]
  5. Lin, T.; Sproul, L. Influence of reentry turbulent plasma fluctuation on EM wave propagation. Comput. Fluids 2006, 35, 703–711. [Google Scholar] [CrossRef]
  6. Song, H.J.; Nagatsuma, T. Present and future of terahertz communications. IEEE Trans. Terahertz Sci. Technol. 2011, 1, 256–263. [Google Scholar] [CrossRef]
  7. Tosun, Z.; Akbar, D.; Altan, H. The interaction of terahertz pulses with dc glow discharge plasma. In Proceedings of the 2009 34th International Conference on Infrared, Millimeter, and Terahertz Waves, Busan, Korea, 21–25 September 2009; pp. 1–2. [Google Scholar]
  8. Komerath, N.; Komerath, P. Implications of inter-satellite power beaming using a space power grid. In Proceedings of the Aerospace Conference, 2011 IEEE, Big Sky, MT, USA, 5–12 March 2011; pp. 1–11. [Google Scholar]
  9. Liu, J.F.; Xi, X.L.; Wan, G.B.; Wang, L.L. Simulation of electromagnetic wave propagation through plasma sheath using the moving-window finite-difference time-domain method. IEEE Trans. Plasma Sci. 2011, 39, 852–855. [Google Scholar] [CrossRef]
  10. Yuan, C.X.; Zhou, Z.X.; Zhang, J.W.; Xiang, X.L.; Yue, F.; Sun, H.G. FDTD analysis of terahertz wave propagation in a high-temperature unmagnetized plasma slab. IEEE Trans. Plasma Sci. 2011, 39, 1577–1584. [Google Scholar] [CrossRef]
  11. Yuan, C.; Zhou, Z.; Xiang, X.; Sun, H.; Wang, H.; Xing, M.; Luo, Z. Propagation properties of broadband terahertz pulses through a bounded magnetized thermal plasma. Nucl. Instrum. Methods Phys. Res. Sect. B Beam Interact. Mater. Atoms 2011, 269, 23–29. [Google Scholar] [CrossRef]
  12. Ping, M.; Xuejun, Z.; Anhua, S.; Shaoqing, B.; Zhefeng, Y. Experimental investigation on electromagnetic wave transmission characteristic in the plasma high temperature gas. J. Exp. Fluid Mech. 2010, 24, 51–56. [Google Scholar]
  13. Xiao, L.k.; Tang, P.; Chen, B.; Wan, L.l.; He, Z.y.; Ma, P. The Development and Application of Ka Band Transmission Measurement System for Plasma Diagnosis. J. Ordance Equip. Eng. 2017, 38, 44–50. [Google Scholar]
  14. Gregoire, D.; Santoru, J.; Schumacher, R. Electromagnetic-Wave Propagation in Unmagnetized Plasmas; Technical Report; HUGHES RESEARCH LABS: Malibu, CA, USA, 1992. [Google Scholar]
  15. Jackson, J.D. Classical Electrodynamics; John Wiley & Sons: Hoboken, NJ, USA, 2007. [Google Scholar]
  16. Dorney, T.D.; Baraniuk, R.G.; Mittleman, D.M. Material parameter estimation with terahertz time-domain spectroscopy. JOSA A 2001, 18, 1562–1571. [Google Scholar] [CrossRef] [PubMed] [Green Version]
Figure 1. The schematic of the shock-wave tube system to produce the plasma and THz measurement system.
Electronics 11 01432 g001
Figure 2. The schematic diagram of THz wave transmission attenuation in the plasma measurement system.
Electronics 11 01432 g002
Figure 3. The simplified theoretical model of THz wave transmitting in plasma with windows. The layer order is shown in Arabic numerals, while the interface order is represented by Roman numerals. The refractive index of each layer is n ˜ i .
Electronics 11 01432 g003
Figure 4. Schematics of the numerical model of the THz propagation in the test area.
Electronics 11 01432 g004
Figure 5. Electric distribution at 100 GHz of n e = 1.6 × 10 18 m 3 and f e = 4.3 × 10 10 Hz.
Electronics 11 01432 g005
Figure 6. Electric distribution at 220 GHz of n e = 7.3 × 10 18 m 3 and f e = 1.0 × 10 10 Hz.
Electronics 11 01432 g006
Figure 7. Power loss vs. distance for different frequencies of n e = 1.6 × 10 18 m 3 and f e = 4.2 × 10 10 Hz.
Electronics 11 01432 g007
Table 1. The parameters of the gas in the second area, electron density and collision frequency (with pressure and temperature), at 100 GHz.
P [Pa]T [K] f e [Hz] n e [cm 3 ]
3.82 × 10 4 3046.04.0 × 10 10 5.0 × 10 10
4.67 × 10 4 3314.44.7 × 10 10 3.8 × 10 11
5.93 × 10 4 3692.25.7 × 10 10 9.0 × 10 11
4.48 × 10 4 3973.04.2 × 10 10 1.6 × 10 12
1.06 × 10 5 4046.99.7 × 10 10 6.9 × 10 12
Table 2. The parameters of the gas in the second area, electron density and collision frequency (with pressure and temperature), at 220 GHz.
P [Pa]T [K] f e [Hz] n e [cm 3 ]
9.61 × 10 4 3507.99.4 × 10 10 9.0 × 10 11
1.06 × 10 5 3818.81.0 × 10 11 3.2 × 10 12
1.10 × 10 5 4055.71.0 × 10 11 7.3 × 10 12
1.15 × 10 5 4506.71.0 × 10 11 2.4 × 10 13
Table 3. The dielectric parameters of the air, antenna window, and plasma.
ϵ r ( Air ) ϵ r ( Window ) ϵ r ( Plasma )
12.5Calculated form Equation (1)
Table 4. The comparison of the transmission function at 100 GHz.
n e [m 3 ] f e [Hz] attenuation meas . [dB] attenuation theo . [dB] attenuation sim . [dB]
5.0 × 10 16 4 × 10 10 00.120.1
3.8 × 10 17 4.7 × 10 10 0.440.990.85
9.0 × 10 17 5.7 × 10 10 1.212.632.27
1.6 × 10 18 4.2 × 10 10 2.043.893.36
6.9 × 10189.7 × 101019.1723.620.52
Table 5. The comparison of the transmission function at 220 GHz.
n e [m 3 ] f e [Hz] attenuation meas . [dB] attenuation theo . [dB] attenuation sim . [dB]
9.0 × 10 17 9.4 × 10 10 1.831.010.86
3.2 × 10 18 1.0 × 10 11 4.583.73.22
7.3 × 10 18 1.0 × 10 11 6.748.57.37
2.4 × 10 19 1.0 × 10 11 26.0228.224.52
Publisher’s Note: MDPI stays neutral with regard to jurisdictional claims in published maps and institutional affiliations.

