Article

A CMOS Double-Demodulation Lock-In Amplifier for Stimulated Raman Scattering Signal Detection

by
Shukri Bin Korakkottil Kunhi Mohd
1,
De Xing Lioe
2,
Keita Yasutomi
2,
Keiichiro Kagawa
2,
Mamoru Hashimoto
3 and
Shoji Kawahito
2,*
1
Graduate School of Science and Technology, Shizuoka University 3-5-1 Johoku, Hamamatsu 432-8011, Japan
2
Research Institute of Electronics, Shizuoka University 3-5-1 Johoku, Hamamatsu 432-8011, Japan
3
Faculty of Information Science and Technology, Hokkaido University, Kita 14, Nishi 9, Sapporo 060-0814, Japan
*
Author to whom correspondence should be addressed.
Electronics 2023, 12(1), 4; https://doi.org/10.3390/electronics12010004
Submission received: 17 November 2022 / Revised: 11 December 2022 / Accepted: 12 December 2022 / Published: 20 December 2022
(This article belongs to the Section Circuit and Signal Processing)

Abstract

:
In typical stimulated Raman scattering (SRS) signal extraction, the photodetector and lock-in amplifier are often based on separate platforms, rendering the system cumbersome and non-scalable. This paper proposes an SRS double-demodulation lock-in amplifier implemented with a complementary metal-oxide semiconductor (CMOS) image sensor technology that integrates two-stage 1/f noise and offset reduction circuits with a high-speed lateral electric field modulation (LEFM) photo-demodulator. A weak SRS signal is buried in a large offset with a ratio of 10−4 to 10−6; boosting such signals in a CMOS device requires an extremely high offset and noise reduction capability. The double-modulation two-stage lock-in amplifier demodulates at 40 MHz with a sampling frequency of 20 MHz, can suppress the laser and circuit’s 1/f noise to achieve higher detection sensitivity. A prototype chip fabricated using 0.11 μm CMOS image sensor technology is evaluated. Both simulation and measurement results are presented to verify the functionality and show that the differential readout structure can successfully reject laser common mode components while emphasizing its differences. The measurement results show that the double-modulation lock-in amplifier effectively suppresses the circuit’s 1/f noise by a factor of nearly two decades.

1. Introduction

Optical spectroscopy permits noninvasive monitoring and has found a place for biomedical, materials, and nanotechnology applications [1,2]. Raman method, a subset of optical spectroscopy, has evolved as an effective vibrational imaging tool that uses the interaction of light with a molecule to get an insight into its material characteristics. The Raman process happens spontaneously in conventional Raman spectroscopy, but the signal acquisition is very slow [3]. The more promising enhancement is coherent Raman spectroscopy (CRS), where the signal can be extracted at a higher rate. There are two commonly known techniques in CRS; coherent anti-Stokes Raman scattering (CARS) and stimulated Raman scattering (SRS) [4,5,6,7]. The CARS is suffered from a non-resonant background (NRB) and requires additional procedures during the signal extraction to remove the NRB [8]. The SRS, on the other hand, does not suffer from NRB. Standard SRS spectroscopy employs two synchronized and combined high-frequency laser pulse trains indicated by their angular frequency, the pump (ωp) and the Stokes (ωs) [9]. The SRS occurs when the two laser pulses excite a sample and a Raman shift, defined by ωp − ωs, matches the observed molecule’s vibrational mode, ωr. Consequently, some pump photons are scattered to the Stokes, resulting in pump intensity attenuation, known as stimulated Raman loss (SRL), and Stokes intensity increment, known as stimulated Raman gain (SRG) [10]. In SRS microscopy, either SRL or SRG is utilized to extract the SRS signal.
Several research groups have reported varying approaches for SRS signal extraction [10,11,12,13,14,15,16,17]. However, few are working on the SRS detector development. A balanced detection method has been proposed using a balanced photodiode and a lock-in amplifier [1,15]. Two photodiodes are utilized, one for reference and another with the SRS signal. Since this method uses a commercially available balanced photodiode, it is bulky and usually limited to single-point detection. An on-chip lock-in amplifier employing two external photodiodes has been proposed [11,12]. The combination of solid-state and discrete devices might have several drawbacks, such as large-scale detectors and non-uniformity effects between the photodiodes and circuitry. The integration of the photodetector and the readout circuit into a single platform [16,17] has been demonstrated. However, the single-stage readout circuit implemented has no compensation circuit to overcome the non-ideal effect of CMOS devices, such as offset and 1/f noise (low-frequency noise). These offsets and the low-frequency noise will saturate the readout circuit and hinders boosting the small SRS signal [18]. Although the double-modulation is implemented digitally in [17] to reduce the 1/f noise, the offset in the analog domain still dominates, causing limited integration cycles.
This paper presents a solid-state approach to SRS signal detection using a CMOS double-demodulation lock-in amplifier. The lock-in amplifier consists of a photo-demodulator and a readout circuit to achieve in-pixel double-demodulation. The pinned-photodiode-based photo-demodulator operates at a high frequency of 40 MHz, where the noise of the laser modulated at such a high frequency is limited only by the laser shot noise rather than the intensity noise, which outweighs the shot noise at low frequencies. Double-modulation is utilized to suppress the 1/f noise and offset of the lock-in amplifier, achieving a low noise system suitable for SRS detection. The operating frequency of sampling and integration is 20 MHz. A prototype chip has been implemented in 0.11 µm CMOS image sensor technology, and the effectiveness of the double-demodulation operation is demonstrated. With the form factor of one unit column (one channel) being 50 μm × 575 μm, the design can easily be expanded to multiple channels, for example, 128 channels. The multiple channels arrangement will be useful for the observation of SRS multiplex detection. Compared to the currently available SRS multiplex system, which is bulky, expensive, and has few channels, the solid-state solution paved by the proposed design will certainly overcome those limitations [12,19].
The paper is organized as follows. Section 2 describes the SRS signal detection method using the in-pixel double-demodulation lock-in amplifier. Section 3 provides the details of the double-demodulation lock-in amplifier design. Section 4 discusses the implementation and measurement results, and Section 5 concludes the paper.

2. Method of SRS Signal Detections with an In-Pixel Double Demodulation Lock-In Amplifier

2.1. SRS Principle and the Noise Reduction Mechanism with the In-Pixel Double-Demodulation

Figure 1a shows the principle of lock-in SRS signal detection. The pump and the Stokes pulses are combined temporally and spatially before coherently exciting a sample. One of the lasers, in this case, the Stokes laser, is modulated at fm1 to distinguish the SRS signal using an electro-optic modulator (EOM) or an acousto-optic modulator (AOM) [20,21]. The modulation enables an SRS signal to be extracted using a lock-in technique by filtering out the resulting Stokes and observing the resulting pump. The small SRS signal, ΔIp, which is buried in a large offset with a ratio of 10−4 to 10−6, occurs when the angular frequency difference between the pump laser and the Stokes laser, ωp − ωs, matches the observed molecule’s vibrational mode, ωr.
Figure 1b shows the principle of the proposed lock-in SRS signal detection. The Stokes laser is double-modulated with fm1 and fm2 to implement the capability of 1/f noise reduction in the readout circuits. Since the laser frequency is 80 MHz, the range for modulation frequency fm1 can be 20 MHz–40 MHz. By utilizing a two-stage readout, with a predetermined gain setting of 250 at the first stage, the frequency range of fm2 would be 40 kHz–80 kHz. The circuit operation frequency in the first stage will be half of the frequency of fm1, concerning the time for sampling in the first half of fm1 and integration in the second half.
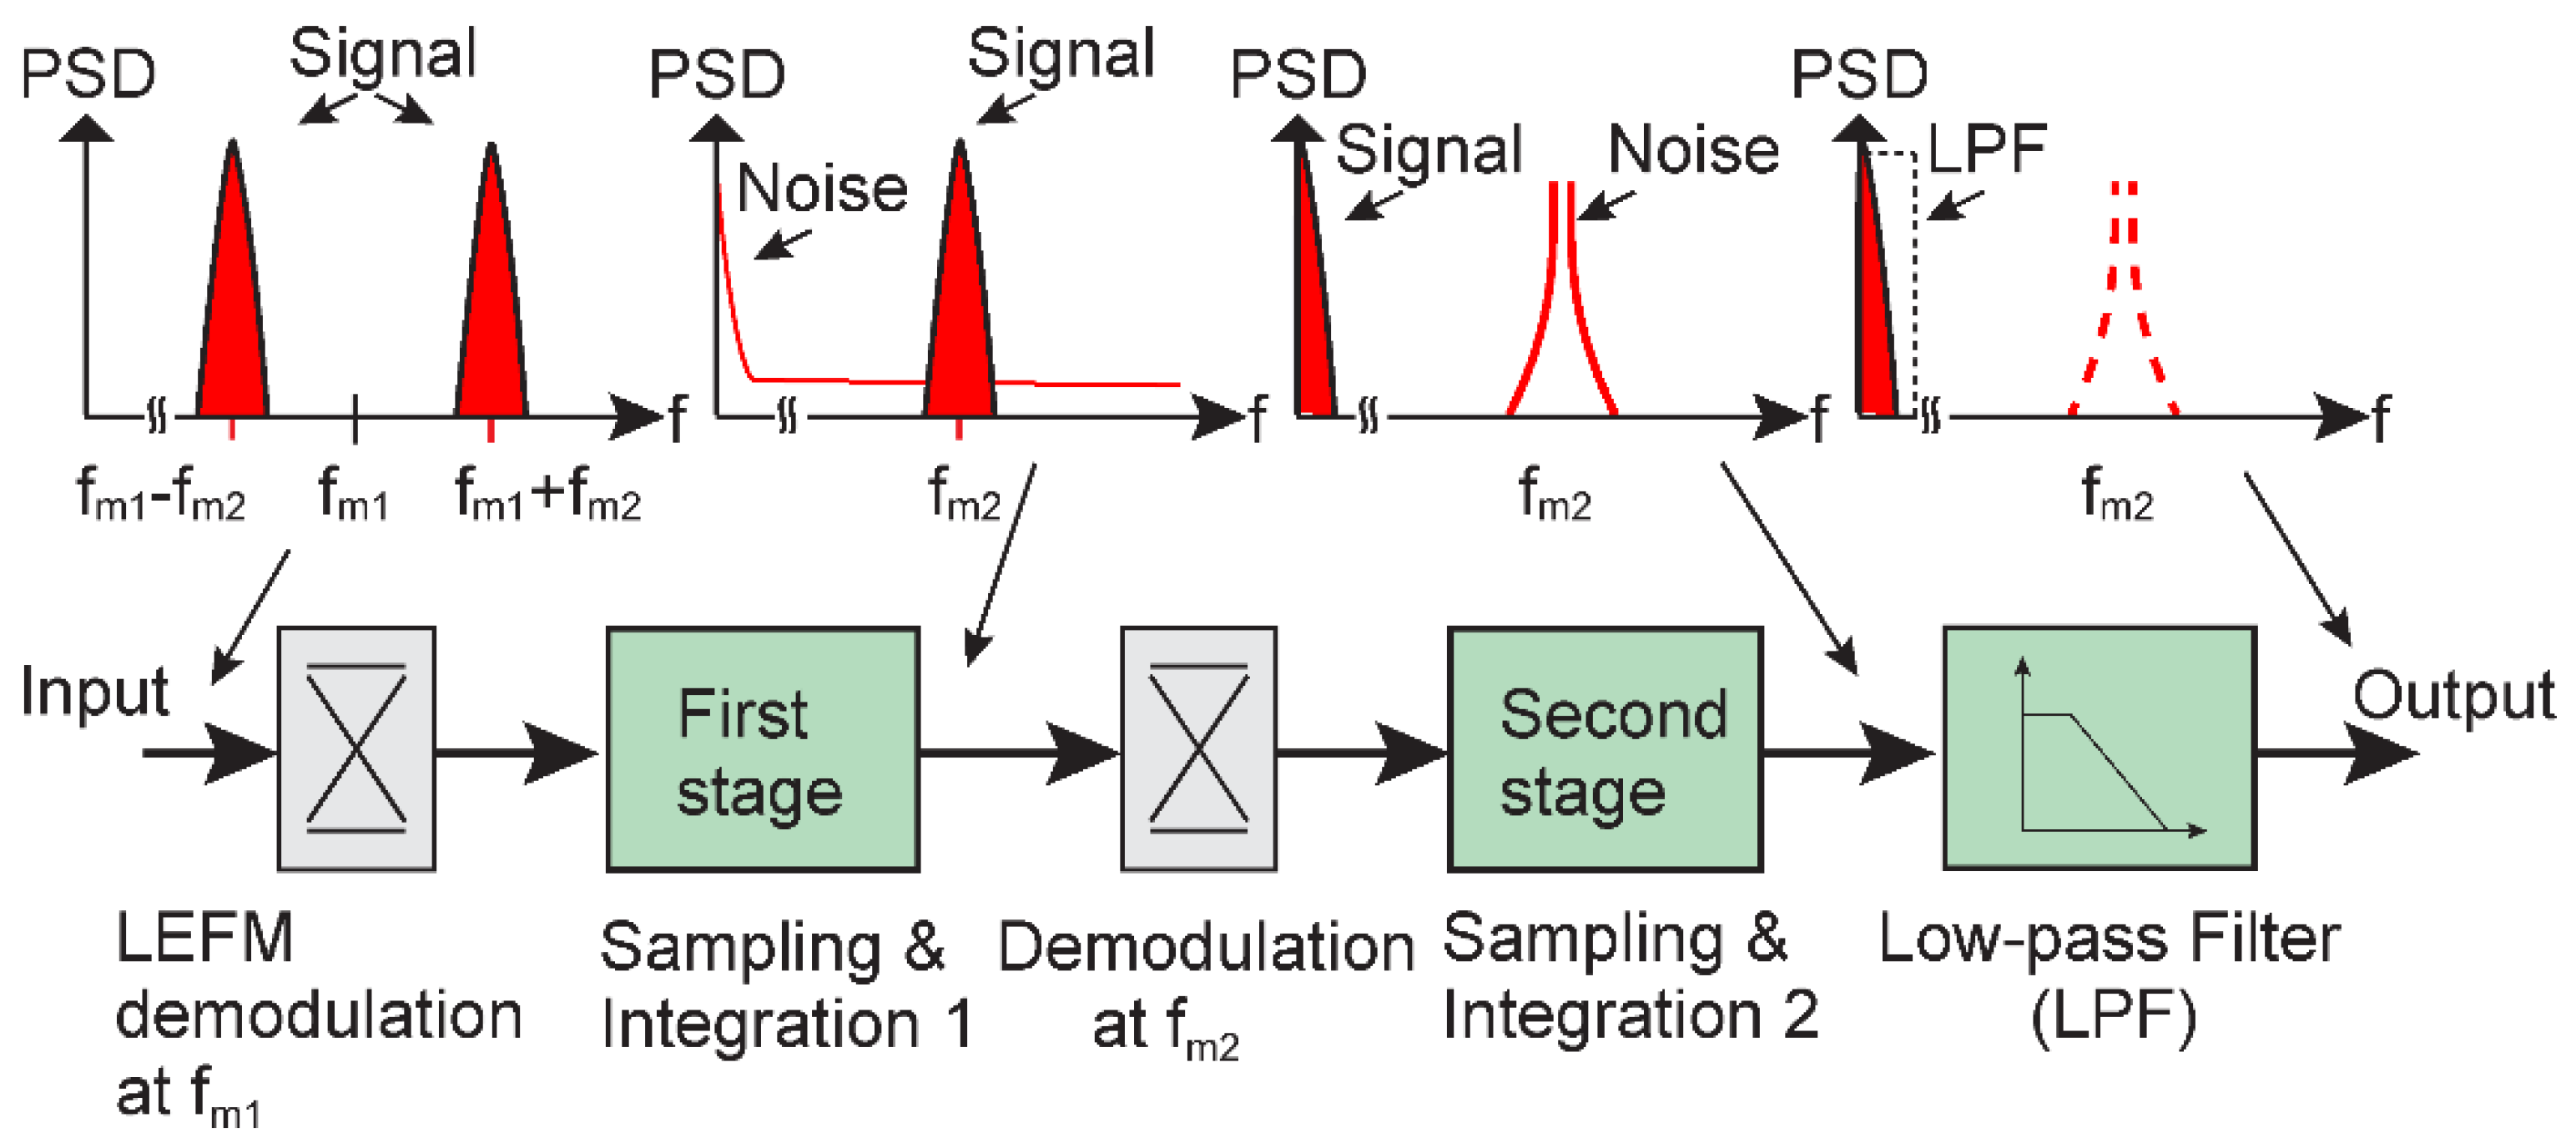
Figure 2 illustrates the noise reduction mechanism using the proposed two-stage amplification circuit to demodulate the double-modulated signal. A commonly known chopping technique is adopted to realize the in-pixel double-demodulation for the proposed circuit [22,23]. The double-modulation applied on the Stokes and transferred to the pump pulses comprises two-frequency components, where the spectrums at the circuit input can be represented by fm1 + fm2 and fm1fm2. Initially, the lateral electric field charge-modulator (LEFM) photo-demodulator demodulates the double-modulated pulse with fm1, and its outputs are sampled for common-mode component subtraction. The difference goes for signal integration. Due to the double-modulation, the output of the first stage is a high-frequency component that comprises an SRS signal at the fm2 band, including the low-frequency circuit noise and offset. The second stage demodulator will further demodulate this first-stage output with fm2, which returns the SRS signal to the baseband. At the same time, low-frequency circuit noise and offset imposed at the first stage are modulated to the fm2 frequency band. The second stage will further amplify the SRS signal. As for the modulated low-frequency noise, a low-pass filter (LPF) is applied digitally to remove the noise.
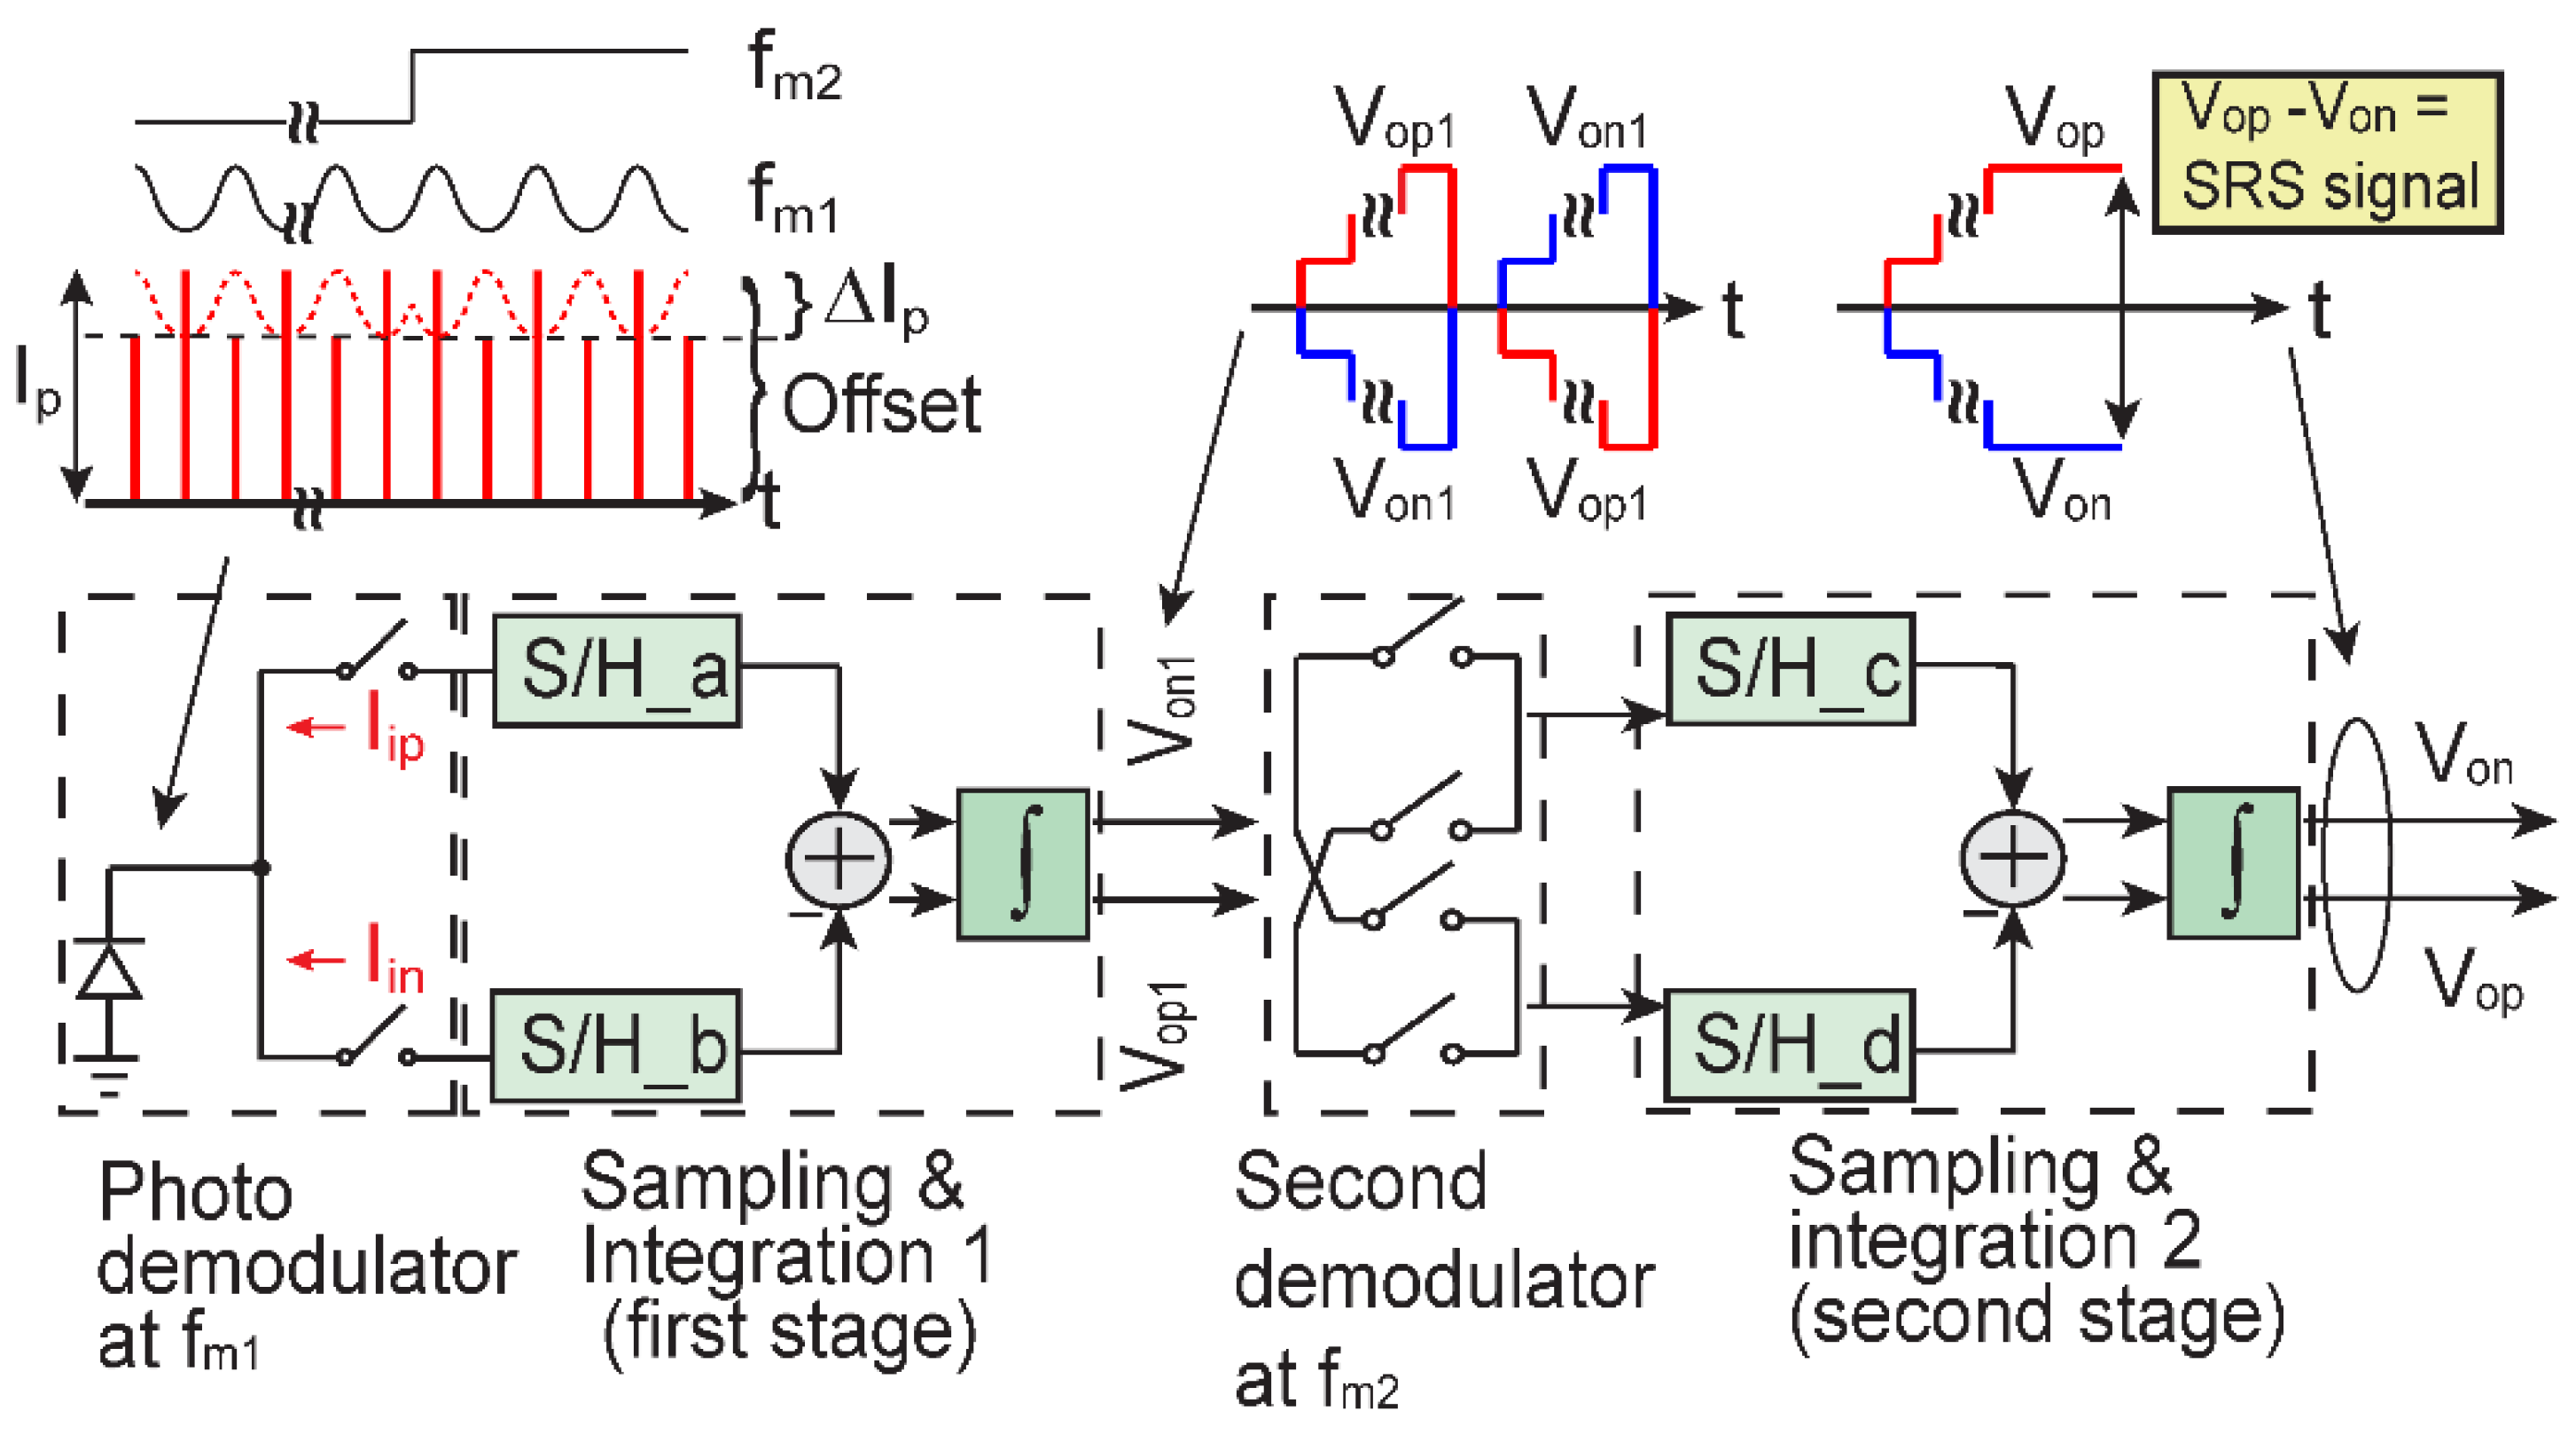
Figure 3 shows the circuit block diagram for the SRS signal extraction with the proposed in-pixel double-demodulation technique. As the Stokes laser is modulated with two modulating signals (fm1 × fm2), the LEFM lock-in photo-demodulator initially detects and demodulates the pump pulse with fm1 by splitting higher and lower-intensity pulses. The sampling and hold (S/H_a and S/H_b) sample the demodulated photocurrent Iip and Iin, where Iip and Iin are photocurrents of the positive and negative half cycles of the modulated light at fm1, respectively. Since the higher-intensity pulses (normal pulses) and lower-intensity pulses (attenuated pulses) generate offset photocurrent Ip and attenuated photocurrent Ip − ΔIp, where ΔIp is a photocurrent due to the SRS signal, the ideal response of the photo-demodulator is expressed as
I i p = I p ,   I i n = 0 for   higher - intensity   pulses I i p = 0 , I i n = I p Δ I p for   lower - intensity   pulses
Since the SRS signal is very small, the sampled charge is transferred to an integrator, temporarily storing it for subsequent iterations that amplify the SRS signal. The double-modulation reverses first stage output polarity for every half-duty cycle of modulation frequency fm2. The differential output of the first stage, Vop1Von1, comprises an amplified signal ΔIp which resides at the fm2 frequency band, a residual circuit offset, and 1/f noise of the first-stage amplifier.
The second demodulator, operating at the frequency fm2, demodulates Vop1Von1 into the baseband. The residual circuit offset and 1/f noise are then modulated to the frequency fm2 band. The second stage will further amplify the SRS signal by the integration while cancelling the large accumulated offset that appears at the output of the first stage. This cancelling of the accumulated offset by alternatively switching the sampling polarity of the first-stage output is done by the demodulator implemented with a cross-coupled switch in front of the second-stage integrator. Finally, the second stage output, VopVon, comprises an amplified SRS signal at the baseband and modulated 1/f noise at the high-frequency band (fm2). The noise can then be suppressed with LPF in the digital domain.

2.2. Operation of LEFM Photo-Demodulator to Extract the SRS Signal

The sub-structure of the LEFM photo-demodulator designed for SRS detection is shown in Figure 4a. A photodetector and charge-modulation gates are implemented on the same device. The photodetector is implemented with a pinned photodiode structure, and the photo-charge modulation is done by lateral electric field control using MOS gates [24]. The photodiode uses three-step n-type doping (n1, n2, n3) for building a lateral drift electric field to allow photo-electrons to be transferred to the modulation gates at the bottom of the structure labelled as the X–X’ plane. The doping density for n3 is the highest, followed by n2 and n1. The three-step doping will increase the lateral electric field across the photodiode, resulting in more efficient charge transfer than the two-step doping. A high and low voltage, 2.6 V and −1.0 V, respectively, are applied to the modulation gates G1 and G2 to control the electric field. Charges obtained from the incident light are transferred by controlling these gates, thus enabling the lock-in detection method [16]. The gate G3 is to drain the unnecessary charges by applying a high voltage of 3.3 V. Figure 4b illustrates the charge flow within the LEFM photo-demodulator when the voltage of gates G1 and G2 is varied as (G1: High, G2: Low) or (G2: High, G1: Low). The gate clock is synchronized with the Stokes modulation signal for the SRS lock-in detection. This configuration effectively demodulates higher-intensity pulses generating the photocurrent Ip and lower-intensity pulses generating the photocurrent Ip − ΔIp into two floating diffusion nodes, FD1 and FD2, respectively. The potential profile in the Y−Y’ direction is shown in Figure 4c, indicating that the charge can be transferred to the modulating gates without a barrier.
The LEFM photo-demodulator lock-in operation starts with intensity modulation of the Stokes laser using frequency fm1. If SRS occurs, the Stokes modulation will imprint the SRL effect, which modulates the pump intensity. The frequency fm1 is then used to demodulate the pump. In addition to the ability of small signal detection in large offset and shot noise, another advantage of the lock-in method is that the high-frequency setting (>1 MHz) for fm1 distinguishes the SRS signal from the laser intensity fluctuation noise [25,26].

3. Design of Double-Demodulation Lock-In Amplifier

3.1. Large Area Photo-Detector and LEFM Photo-Demodulator Design

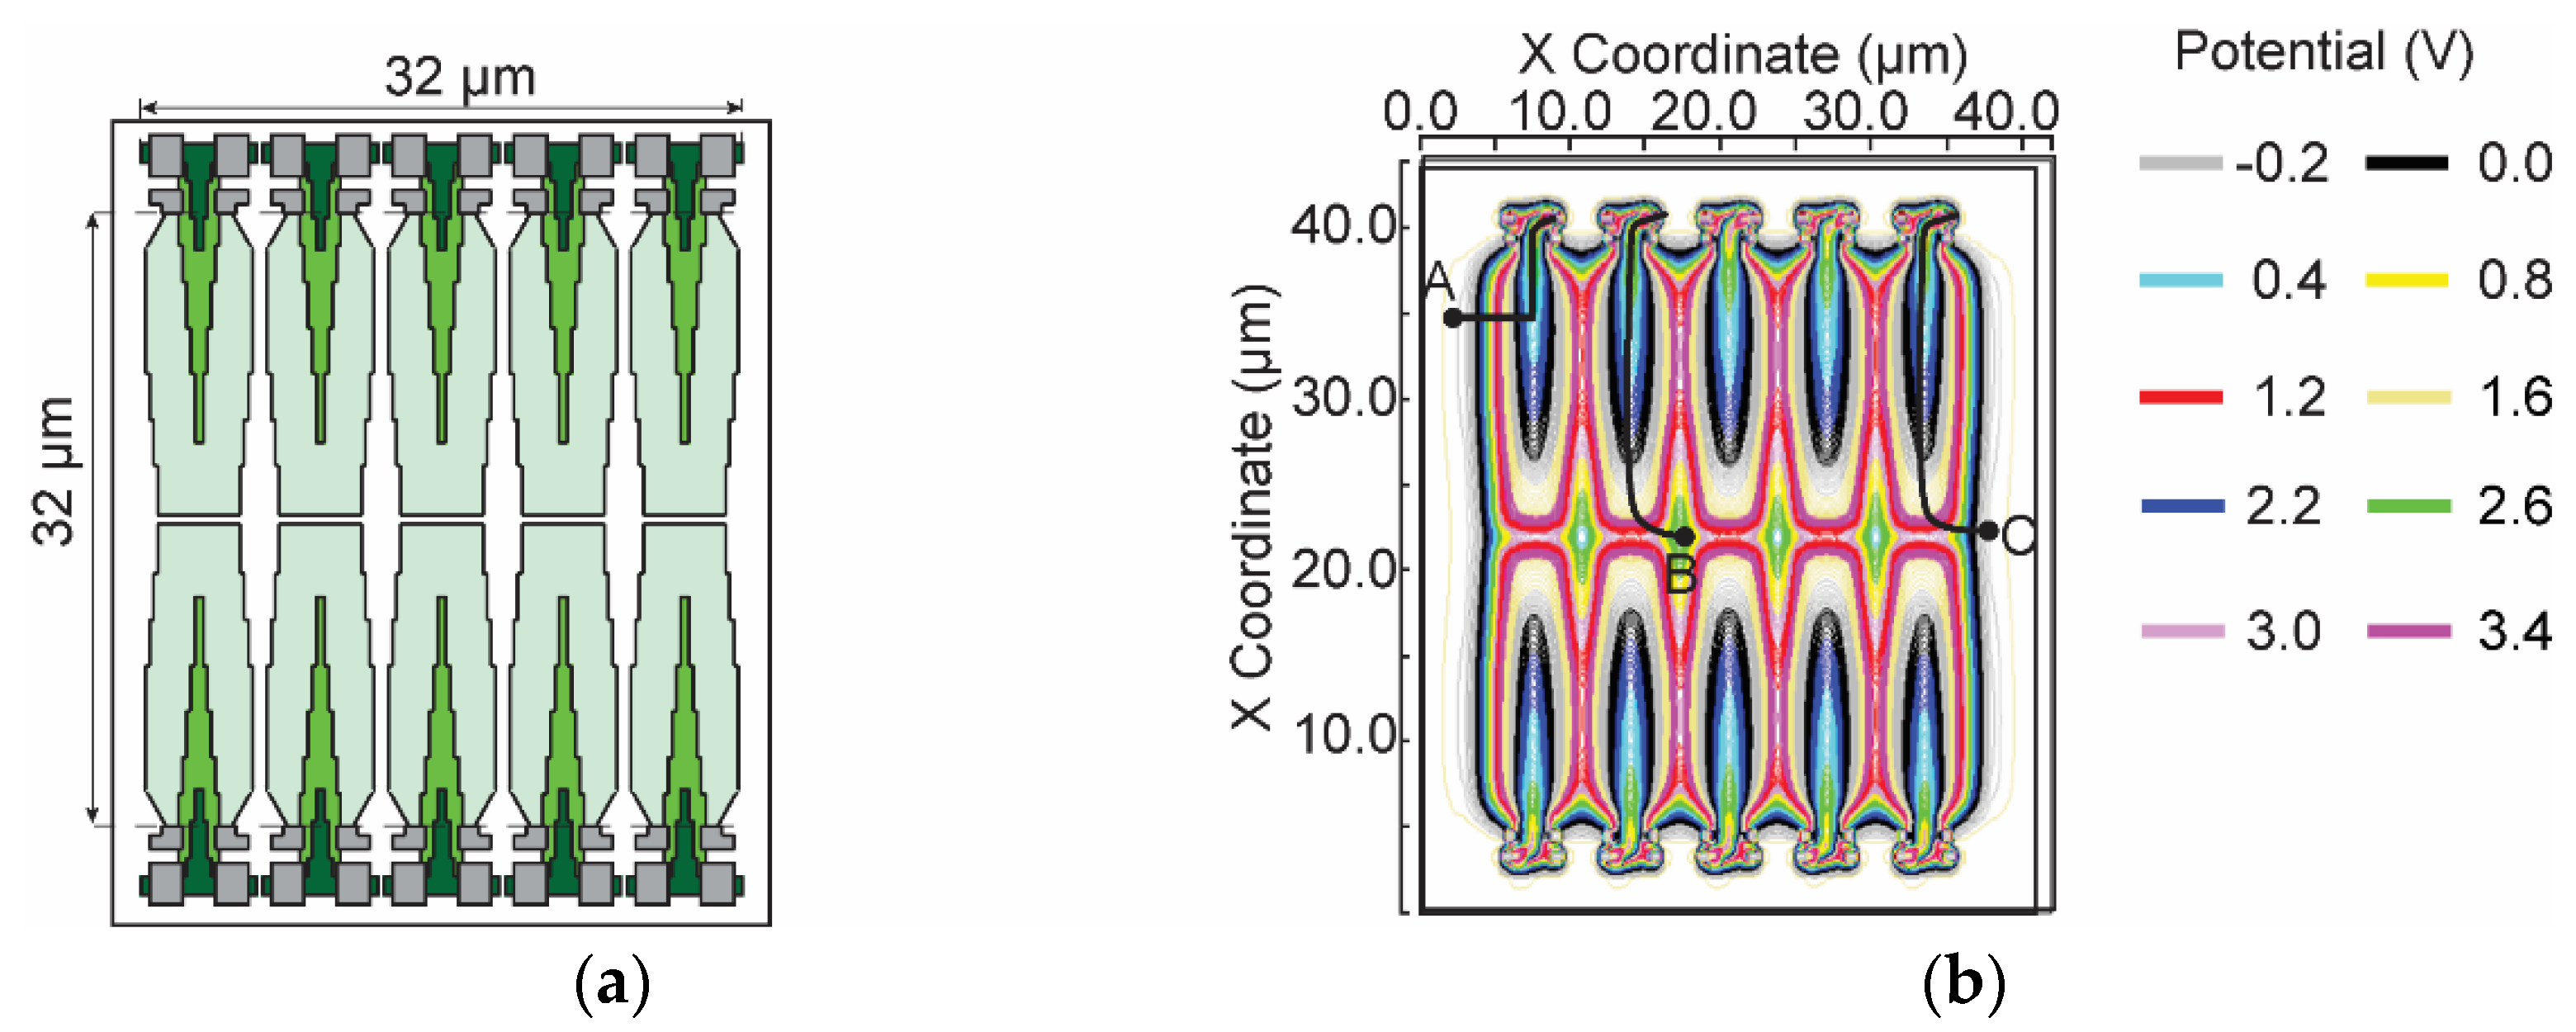
The single sub-structure of the LEFM photo-demodulator shown in Figure 4a converts the detected modulated light to a photocurrent and demodulates it. For implementing the lock-in amplifier chip using CMOS image sensor technology, ten units of the sub-structure are combined to create a large area detector, as shown in Figure 5b, to ensure the sufficiency of charge transfer speed as the detected pump pulse needs to be demodulated at a high frequency. The charge path is indicated by a solid black line, representing the charge movements from points A, B, and C to reach the gates. Table 1 shows the charge transfer time simulation results based on the SPECTRA device simulator. The color scheme scale in the simulation diagram represents potential in voltage. Since the pump pulses run at 80 MHz, the transfer time for each initial location must be less than 12.5 ns.
As shown in Table 1, the longest path for charge transfer requires only 2.97 ns, and is thus sufficient for SRS detection.

3.2. Circuit Implementation of the SRS Signal Lock-In Amplifier

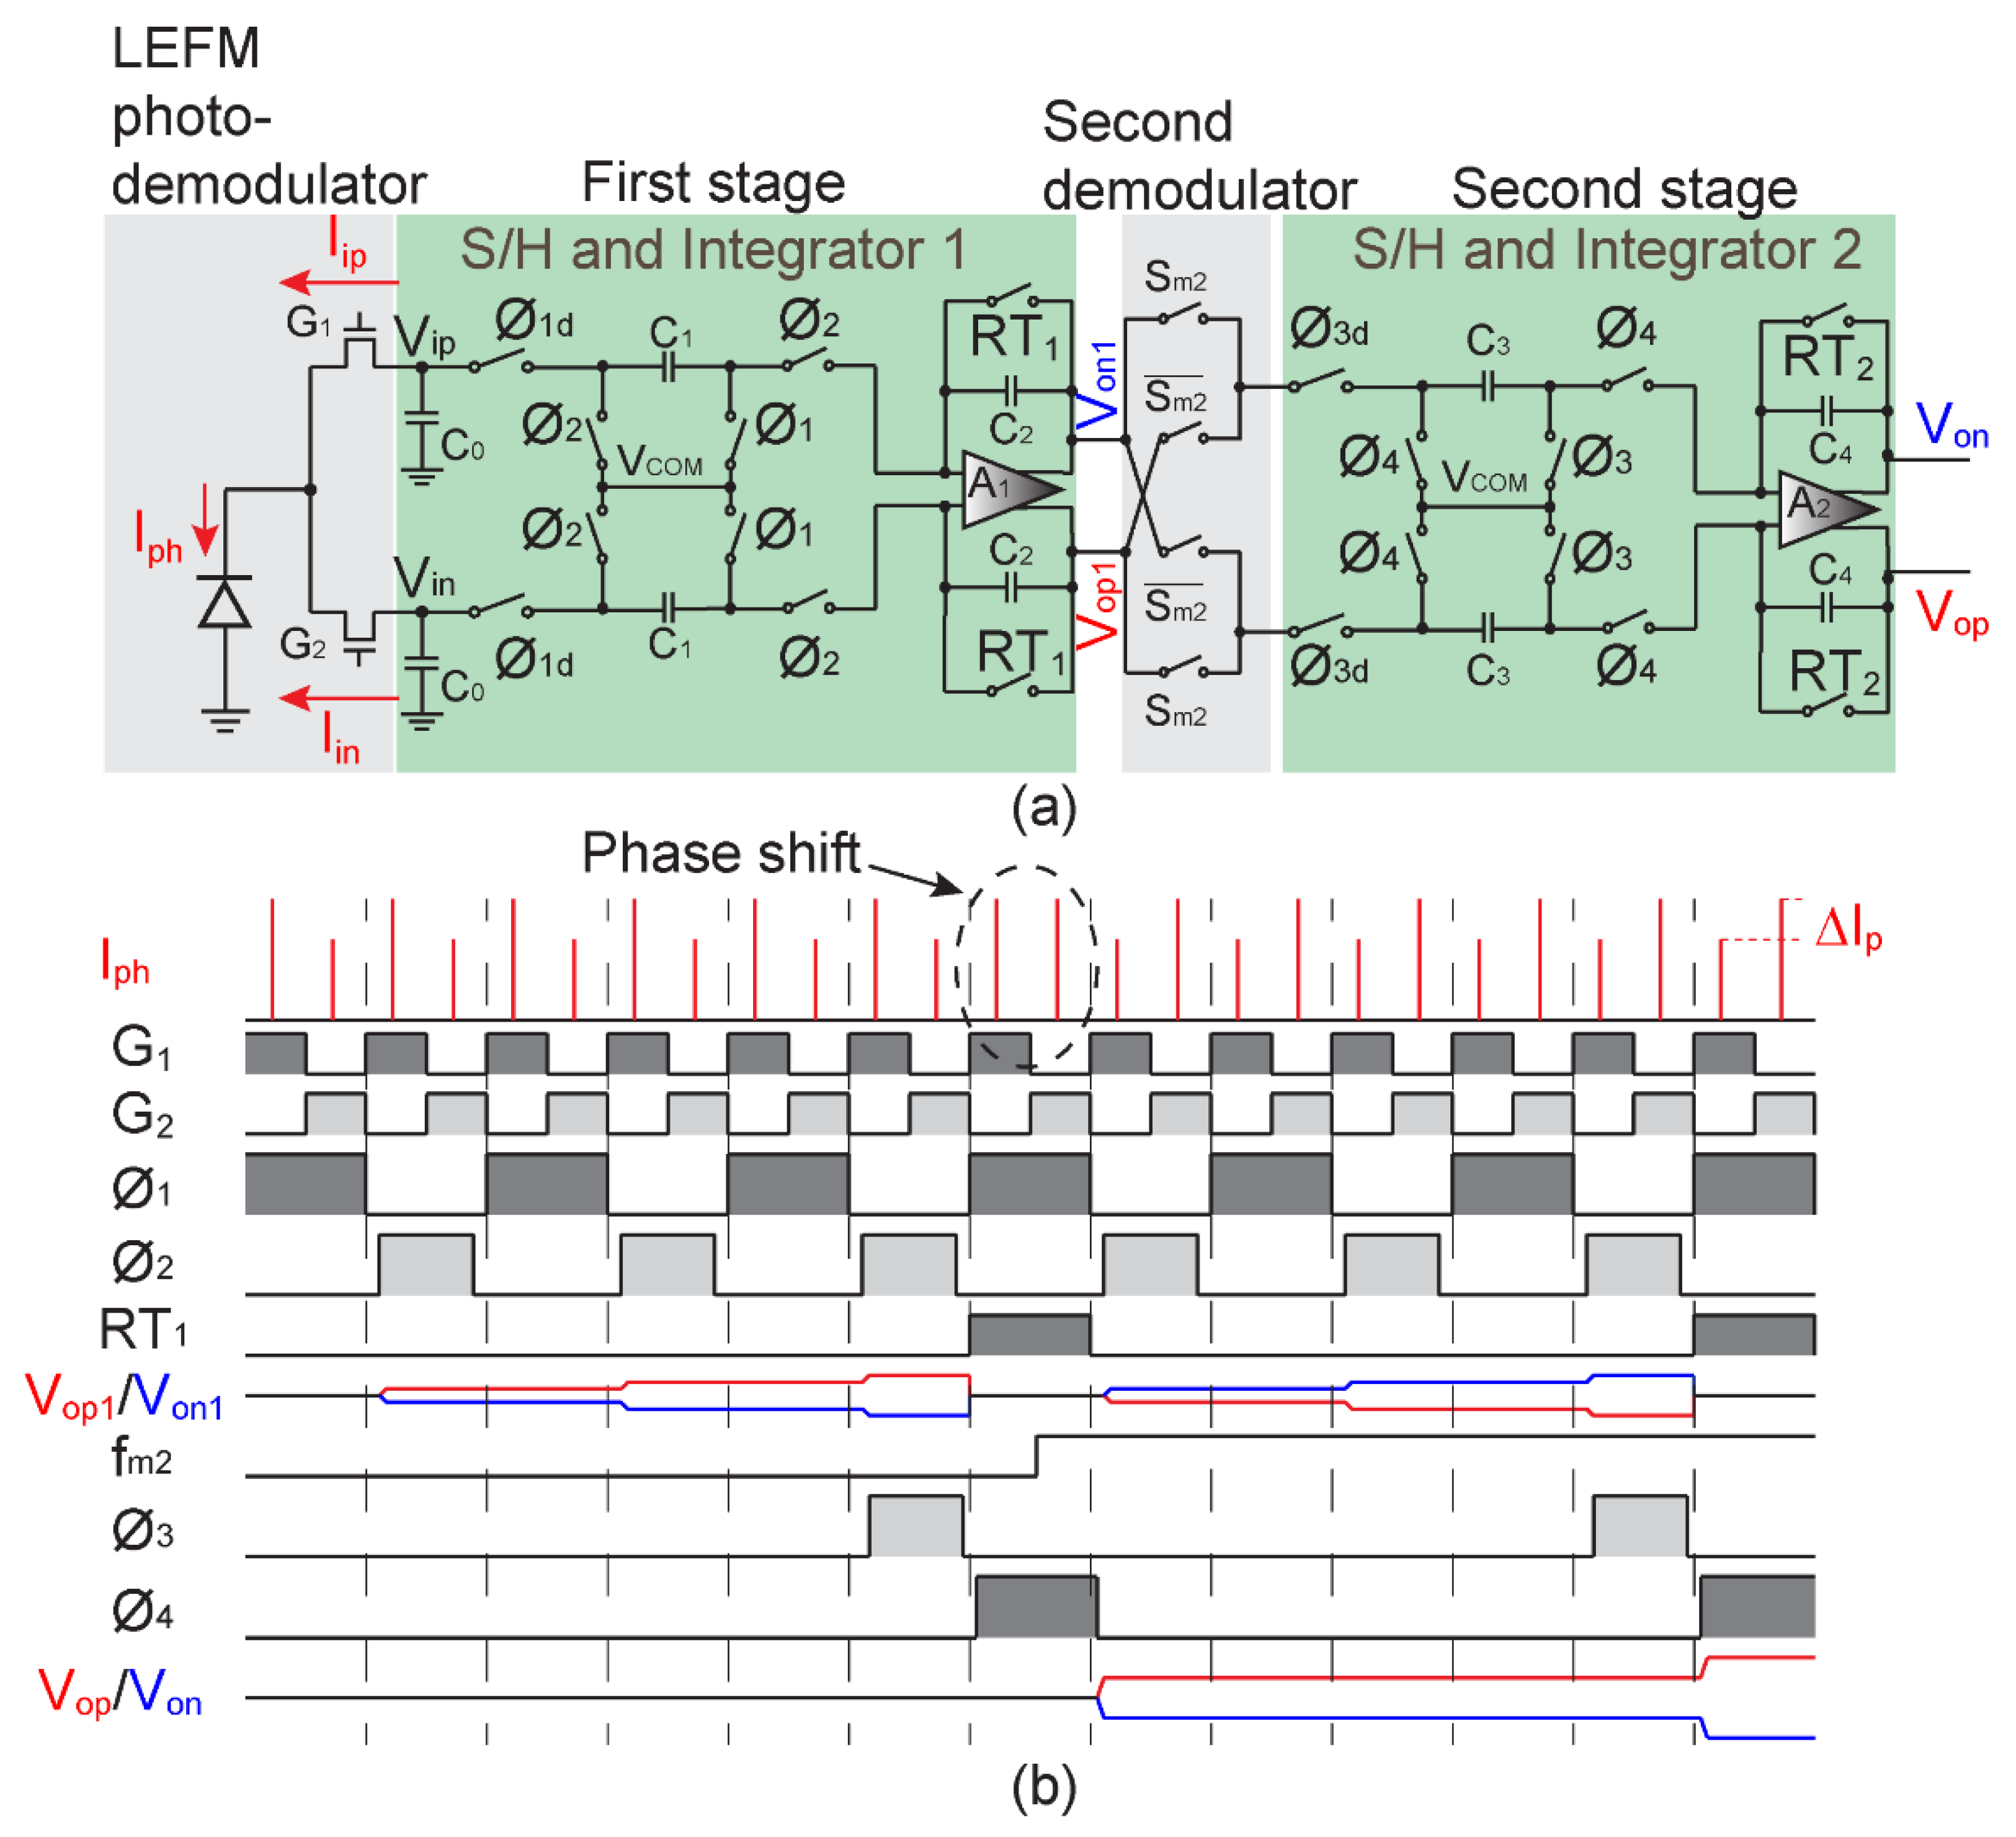
The circuit implementation of the SRS signal lock-in amplifier with in-pixel double demodulation is shown in Figure 6. Two-stage switched-capacitor integration circuits using a fully-differential configuration are employed, as schematically shown in Figure 6a. The operation timing diagram is shown in Figure 6b. The modulated photocurrent generated in the photodiode is demodulated by G1 and G2. Then at the output of the LEFM photo-demodulator, the averaged currents ( I i p ¯ , I i n ¯ ) in one cycle of the modulation frequency fm1 is ideally I p ¯ and I p ¯ Δ I p ¯ , respectively, where I p ¯ and Δ I p ¯ are the averaged amount of offset photocurrent and SRS signal photocurrent, respectively. The timing signal for G1 and G2 are synchronized with the first modulating frequency, fm1, which is used to modulate the Stokes laser. These G1 and G2 signals are appropriately aligned with the laser phase. Appropriate gate timing settings will ensure that maximum laser light is captured.
At the first-stage integrator, the two capacitors of C1 temporarily sample and store charges due to I p ¯ and I p ¯ Δ I p ¯ , while the switches controlled by Ø1 are activated. The delayed Ø1, which is Ø1d, is used at the input-side switches for reducing charge injection error [27]. While the switches controlled by Ø2 are activated, the stored charges in C1 are transferred to C2 for integration. Because of the fully-differential configuration of the switched-capacitor integrator, the common offset charge components due to I p ¯ is cancelled out at the first-stage integrator outputs, if the switched-capacitor integrator is ideally working. Then the differential outputs, Vop1 and Von1 of the first-stage integrator, have an incremental voltage signal of Δ I p ¯ /(fm1C2) in one cycle of fm1. To intensify the signal, this cycle is repeated for N1 times, and then the signal component appears at the first-stage integrator output is expressed as
V o p 1 V o n 1 = N 1 Δ I p ¯ f m 1 C 2 ,
and the signal component is intensified by the gain of N1. After reaching a sufficient amplitude with sufficient integration cycles, the second stage samples the output of the first stage, and the reset switch RT1 is turned on, for resetting the charges in C2 of the first stage. The sampling frequency in the first stage is half the demodulating frequency fm1. During the signal integration, i.e., when Ø2 are activated, sampling is not performed, resulting in the loss of half of the signals.
In the real implementation, the offset photocurrent is not perfectly cancelled in the first stage because of many factors of analog imperfections such as mismatch in capacitors, clock skews, and charge transfer time deviations of switches. The residual offset component is accumulated during the integration cycles of the first-stage integrator and may saturate the integrator output and will limit the gain (N1). In the second-stage integrator together with the second demodulator, the residual offset component is cancelled but the signal component is further amplified. To do this, the second demodulator made of the cross-coupled transmission gate demodulates the first integrator output at the frequency fm2 before entering it into the second-stage integrator. The second demodulator’s clock signal is synchronized with the second modulation of the Stokes laser at the same frequency of fm2, modulating the phase of the Stokes laser every cycle of fm2. Accordingly, in the first half of the modulation cycle of fm2, the gating clocks G1 and G2 in the first demodulator (LEFM photo-demodulator) are used to demodulate higher and lower-intensity light, respectively, and because of the double modulation, this configuration is reversed in the second half of fm2, where G1 and G2 demodulate lower and higher-intensity light, respectively. The operation of the second-stage integrator or the clocking of Ø3, Ø3d, Ø4, and RT2 are similar to that of Ø1, Ø1d, Ø2, and RT1 in the first stage. To further intensify the signal, the integration cycle is repeated for N2 times, and then the signal component appears at the second-stage integrator output is expressed as
V o p V o n = C 3 C 4 N 1 N 2 Δ I p ¯ f m 1 C 2 .
Using the double-demodulation two-stage lock-in amplification, the SRS signal component is amplified by the large gain of N1 × N2 while cancelling the offset component. The double-modulation technique can also effectively reduce the low-frequency noise due to laser power fluctuation by the first modulation (fm1), and the low-frequency noise (1/f noise) of the first-stage integrator by the second modulation (fm2).
As shown in Figure 6a, fully-differential switched-capacitor integrators, which offer superior rejection of common-mode components, are utilized for both stages. The CMOS opamps used for both stages are the fully-differential folded cascode amplifier, but the design parameters are different between the two stages for meeting the response-time requirement at each stage [28]. The first stage employs a larger capacitor than the second to sample the large-intensity current pulse in a short time. Therefore, the amplifier in the first stage is designed to have a larger biasing current than the second to meet this settling requirement. Considering the laser pulse is running at 80 MHz, the predetermined setting for the first stage amplifier A1 runs at 20 MHz with a large capacitor for C1 and C2, which both are 1.25 pF. In contrast, the second stage amplifier A2 runs at 80 kHz with a smaller capacitor for C3 and C4, both at 200 fF. Taking these factors, the delivered bias current for both amplifiers A1 and A2 are determined and designed to be 100 µA and 20 µA, respectively. Both amplifiers use switched-capacitor type common-mode feedback (SC-CMFB) topology. Among the advantages of SC-CMFB are no influence on the amplifier input and output ranges, good linearity, and no additional poles imposed on the amplifier performance [29]. As for the CMOS switches, based on A1 and A2 operating frequencies, the CMOS switches are designed to exhibit at most 750 Ω resistance during the ‘ON’ state.

3.3. Circuit Simulation Results

The operation of the SRS signal lock-in amplifier shown in Figure 6a is verified through simulation using a method shown in Figure 7. The output of the LEFM photo-demodulator is modelled using pulse current sources IsimP and IsimN. The double-modulation effect on the photocurrents is modelled by shifting the phase of the current sources IsimP and IsimN to be 180° for every cycle. All other timing operations for the readout circuit are the same as in Figure 6b. To model the measurement system, IsimP and IsimN levels seen by the circuit are varied through delay adjustment of the readout circuit timing across the IsimP and IsimN pulses. The delay adjustment shown in Figure 7 would vary the currents sampled for Vip and Vin. Hypothetically at the beginning, the input current IsimN is leading while IsimP is trailing, indicating that IsimNIsimP produces one side polarity.
Then, once the delay reaches the C−C’ phase, IsimP is leading, and IsimN is trailing, indicating IsimPIsimN, changing the polarity’s side.
A simulation result of the delay adjustment is shown in Figure 8. The result shows a differential voltage output (VopVon) of the lock-in amplifier observed when the delay of the pulse current sources is varied. Initially, the result is negative when the delay adjustment exhibits IsimNIsimP. As the delay progresses, the dominant current changes, where IsimNIsimP; thus, output polarity is reversed. This finding shows that the circuit can produce a differential output proportional to the difference between IsimN and IsimP. As IsimN becomes larger than IsimP, the differential output increases in negative polarity, shown from points A to B. Points B to C show that nothing changes even if a more significant current difference is applied, indicating that saturation is reached. Points C to D suggest that the difference between IsimN and IsimP decreases and approaches zero. The polarity changes after point D, indicating that the adjustment has reached the C−C’ phase shown in Figure 7. Points D, E, F, and G repeat similar behavior but in different polarities. Points A, D, and G are where both currents Iip and Iin are at the same value; therefore, no differential voltage output is produced. The simulation result shows that the difference between two light intensities can be extracted, indicating the designed lock-in amplifier can be applied to SRS signal extraction.
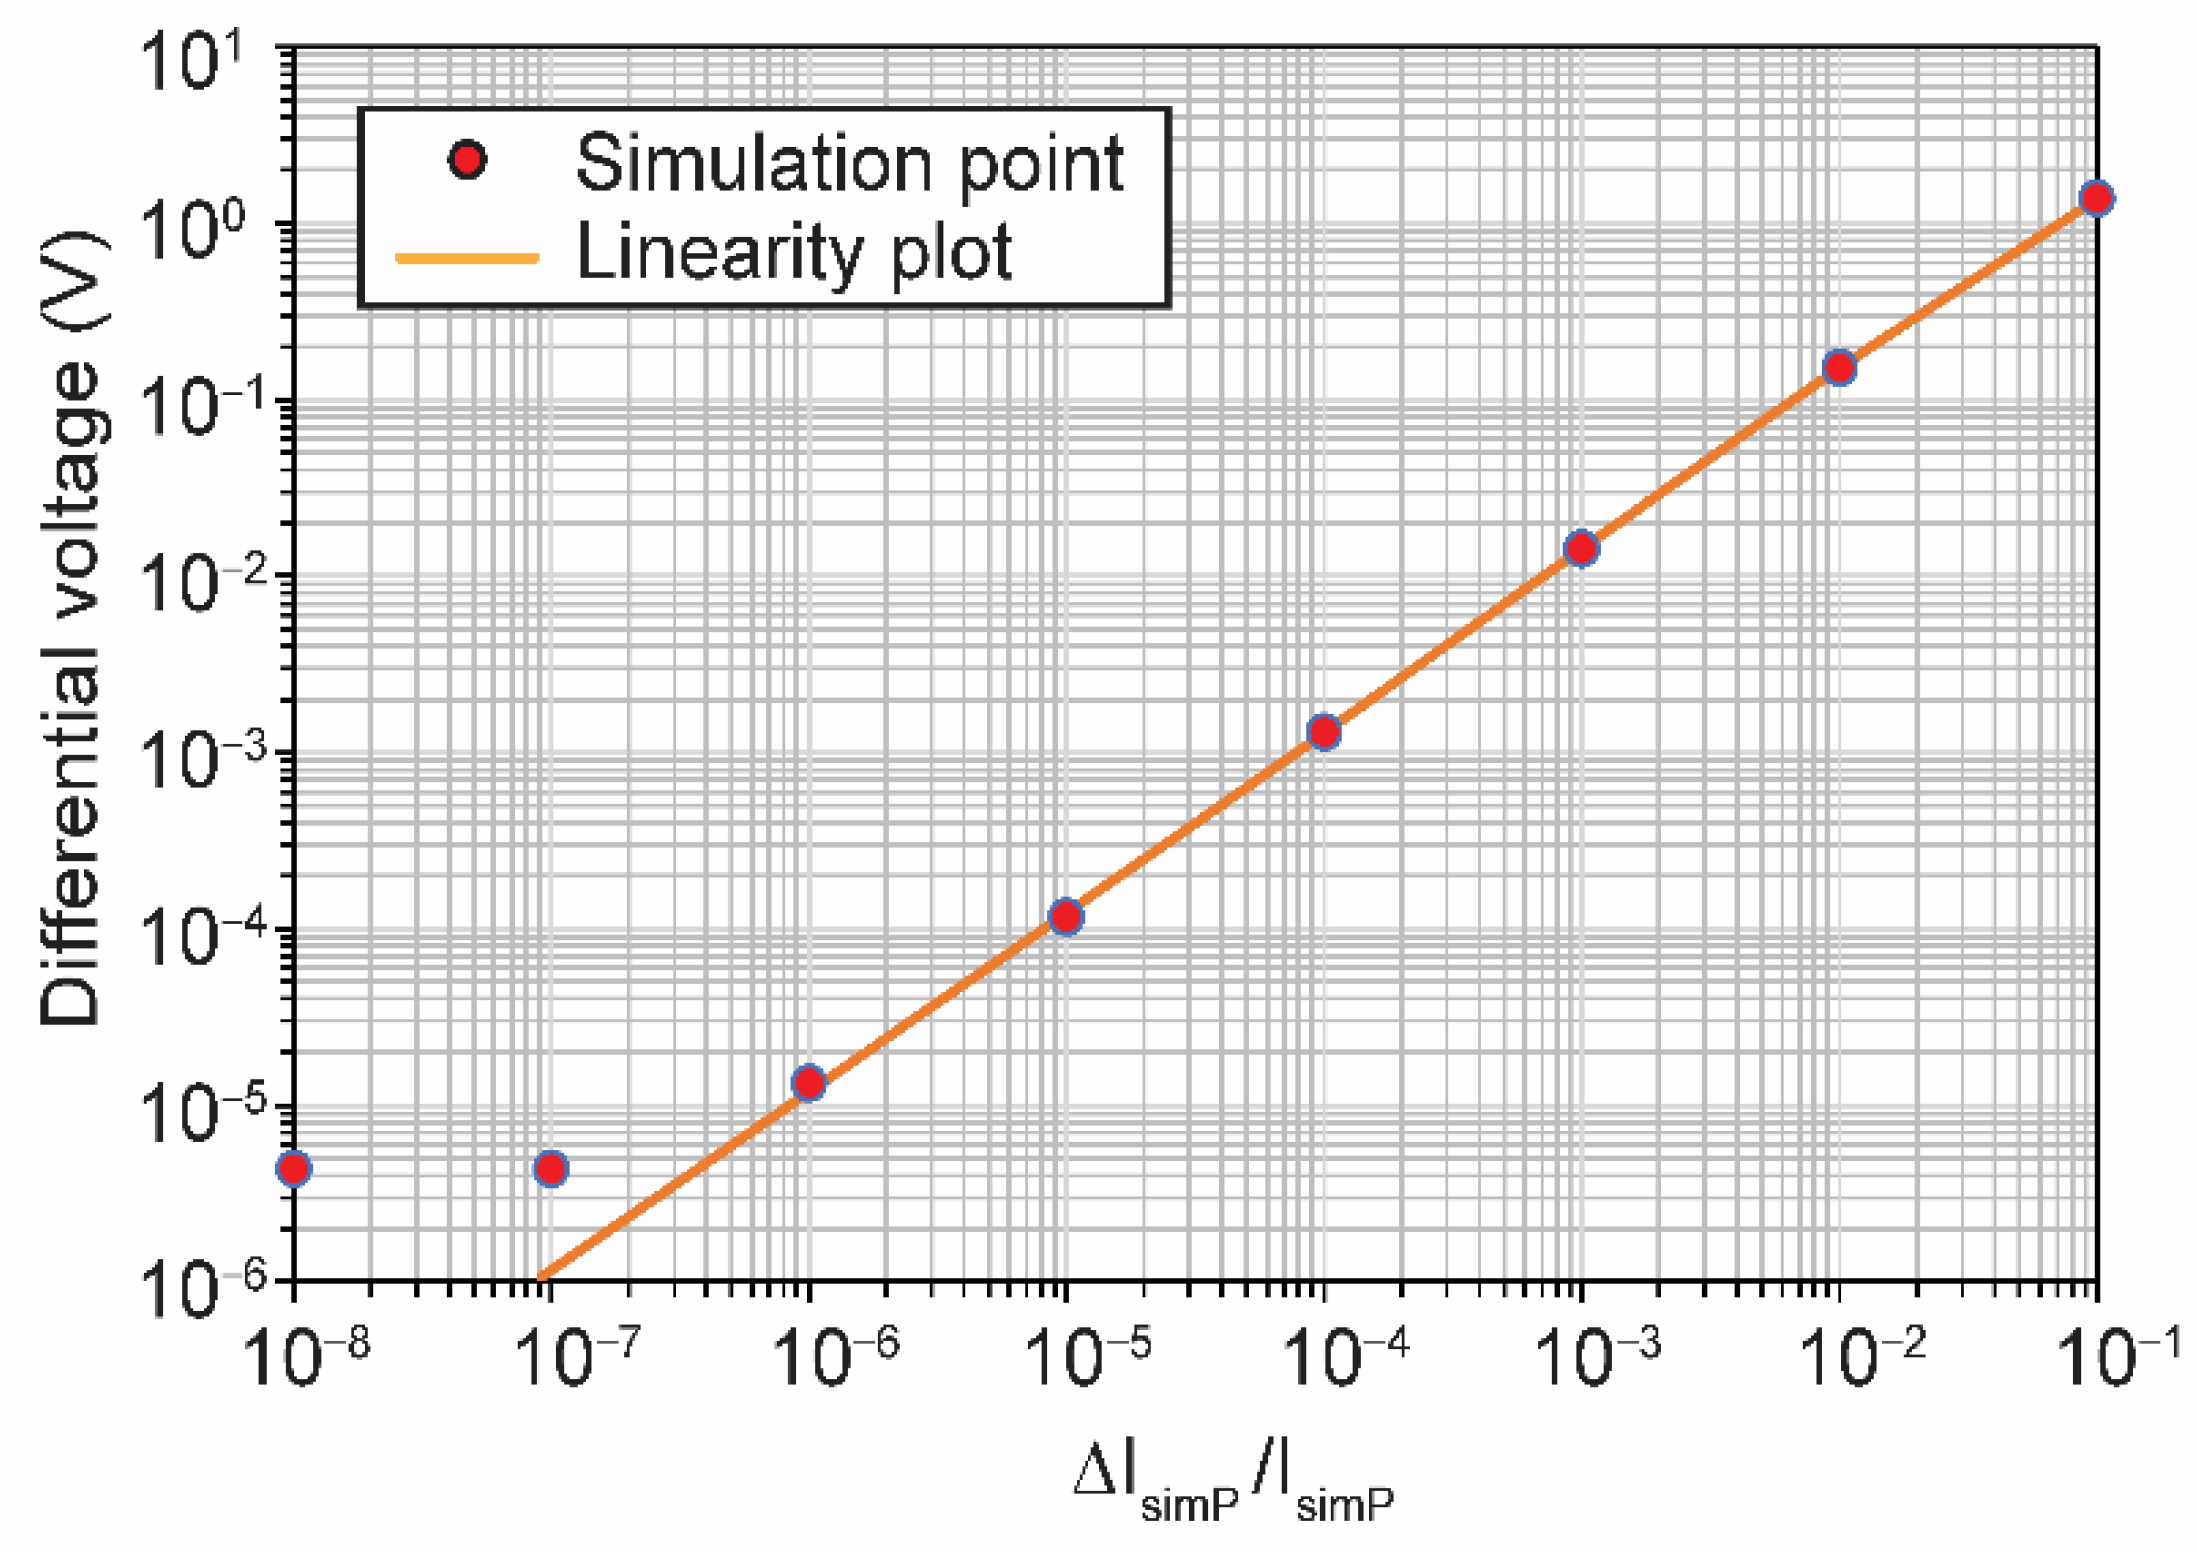
Figure 9 depicts the simulated linearity of the signal ratio to show the effectiveness of detecting a small signal in a large offset. The ratio of ΔIsimP/IsimP is set by varying the IsimP while keeping IsimN constant.
The simulated linearity shows linear response even at the ratio of 10−6, which is a typical lower limit of the SRS signal detection. The limiting factor of non-linear response around 10−6 is that the residual noise, particularly from the second stage, starts to dominate.

4. Measurement Results and Discussion

4.1. Implemented Lock-In Amplifier Chip and Measurement Setup

A prototype chip of the SRS signal lock-in amplifier is implemented using a 0.11 µm CMOS image sensor process technology. The block diagram and photomicrograph of the chip are shown in Figure 10a,c, respectively. The packaged chip is mounted on a printed circuit board (PCB) for characterization as shown in Figure 10b. In this design, ten pixels are arranged as a line array. One unit pixel comprises a LEFM photo-demodulator and a two-stage circuit. Each pixel is connected to the pixel driver and line sample and hold circuit to form a column. The size for each column is 50 μm × 575 μm. The chip size is 1.4 mm × 5 mm. The pixel driver drives the LEFM photo demodulator by regulating the clock amplitude to 2.6 V and −1.0 V for the ‘HIGH’ and ‘LOW’ states, respectively. The line sample/hold circuit temporarily stores each column’s output before reading out serially, as all ten columns operate simultaneously. The serial readout is controlled using a line scanner. The analog output goes through a buffer before connecting with external circuitry to avoid losses due to output loading. External clock signals drive the chip through the clock buffer and level shifter block.
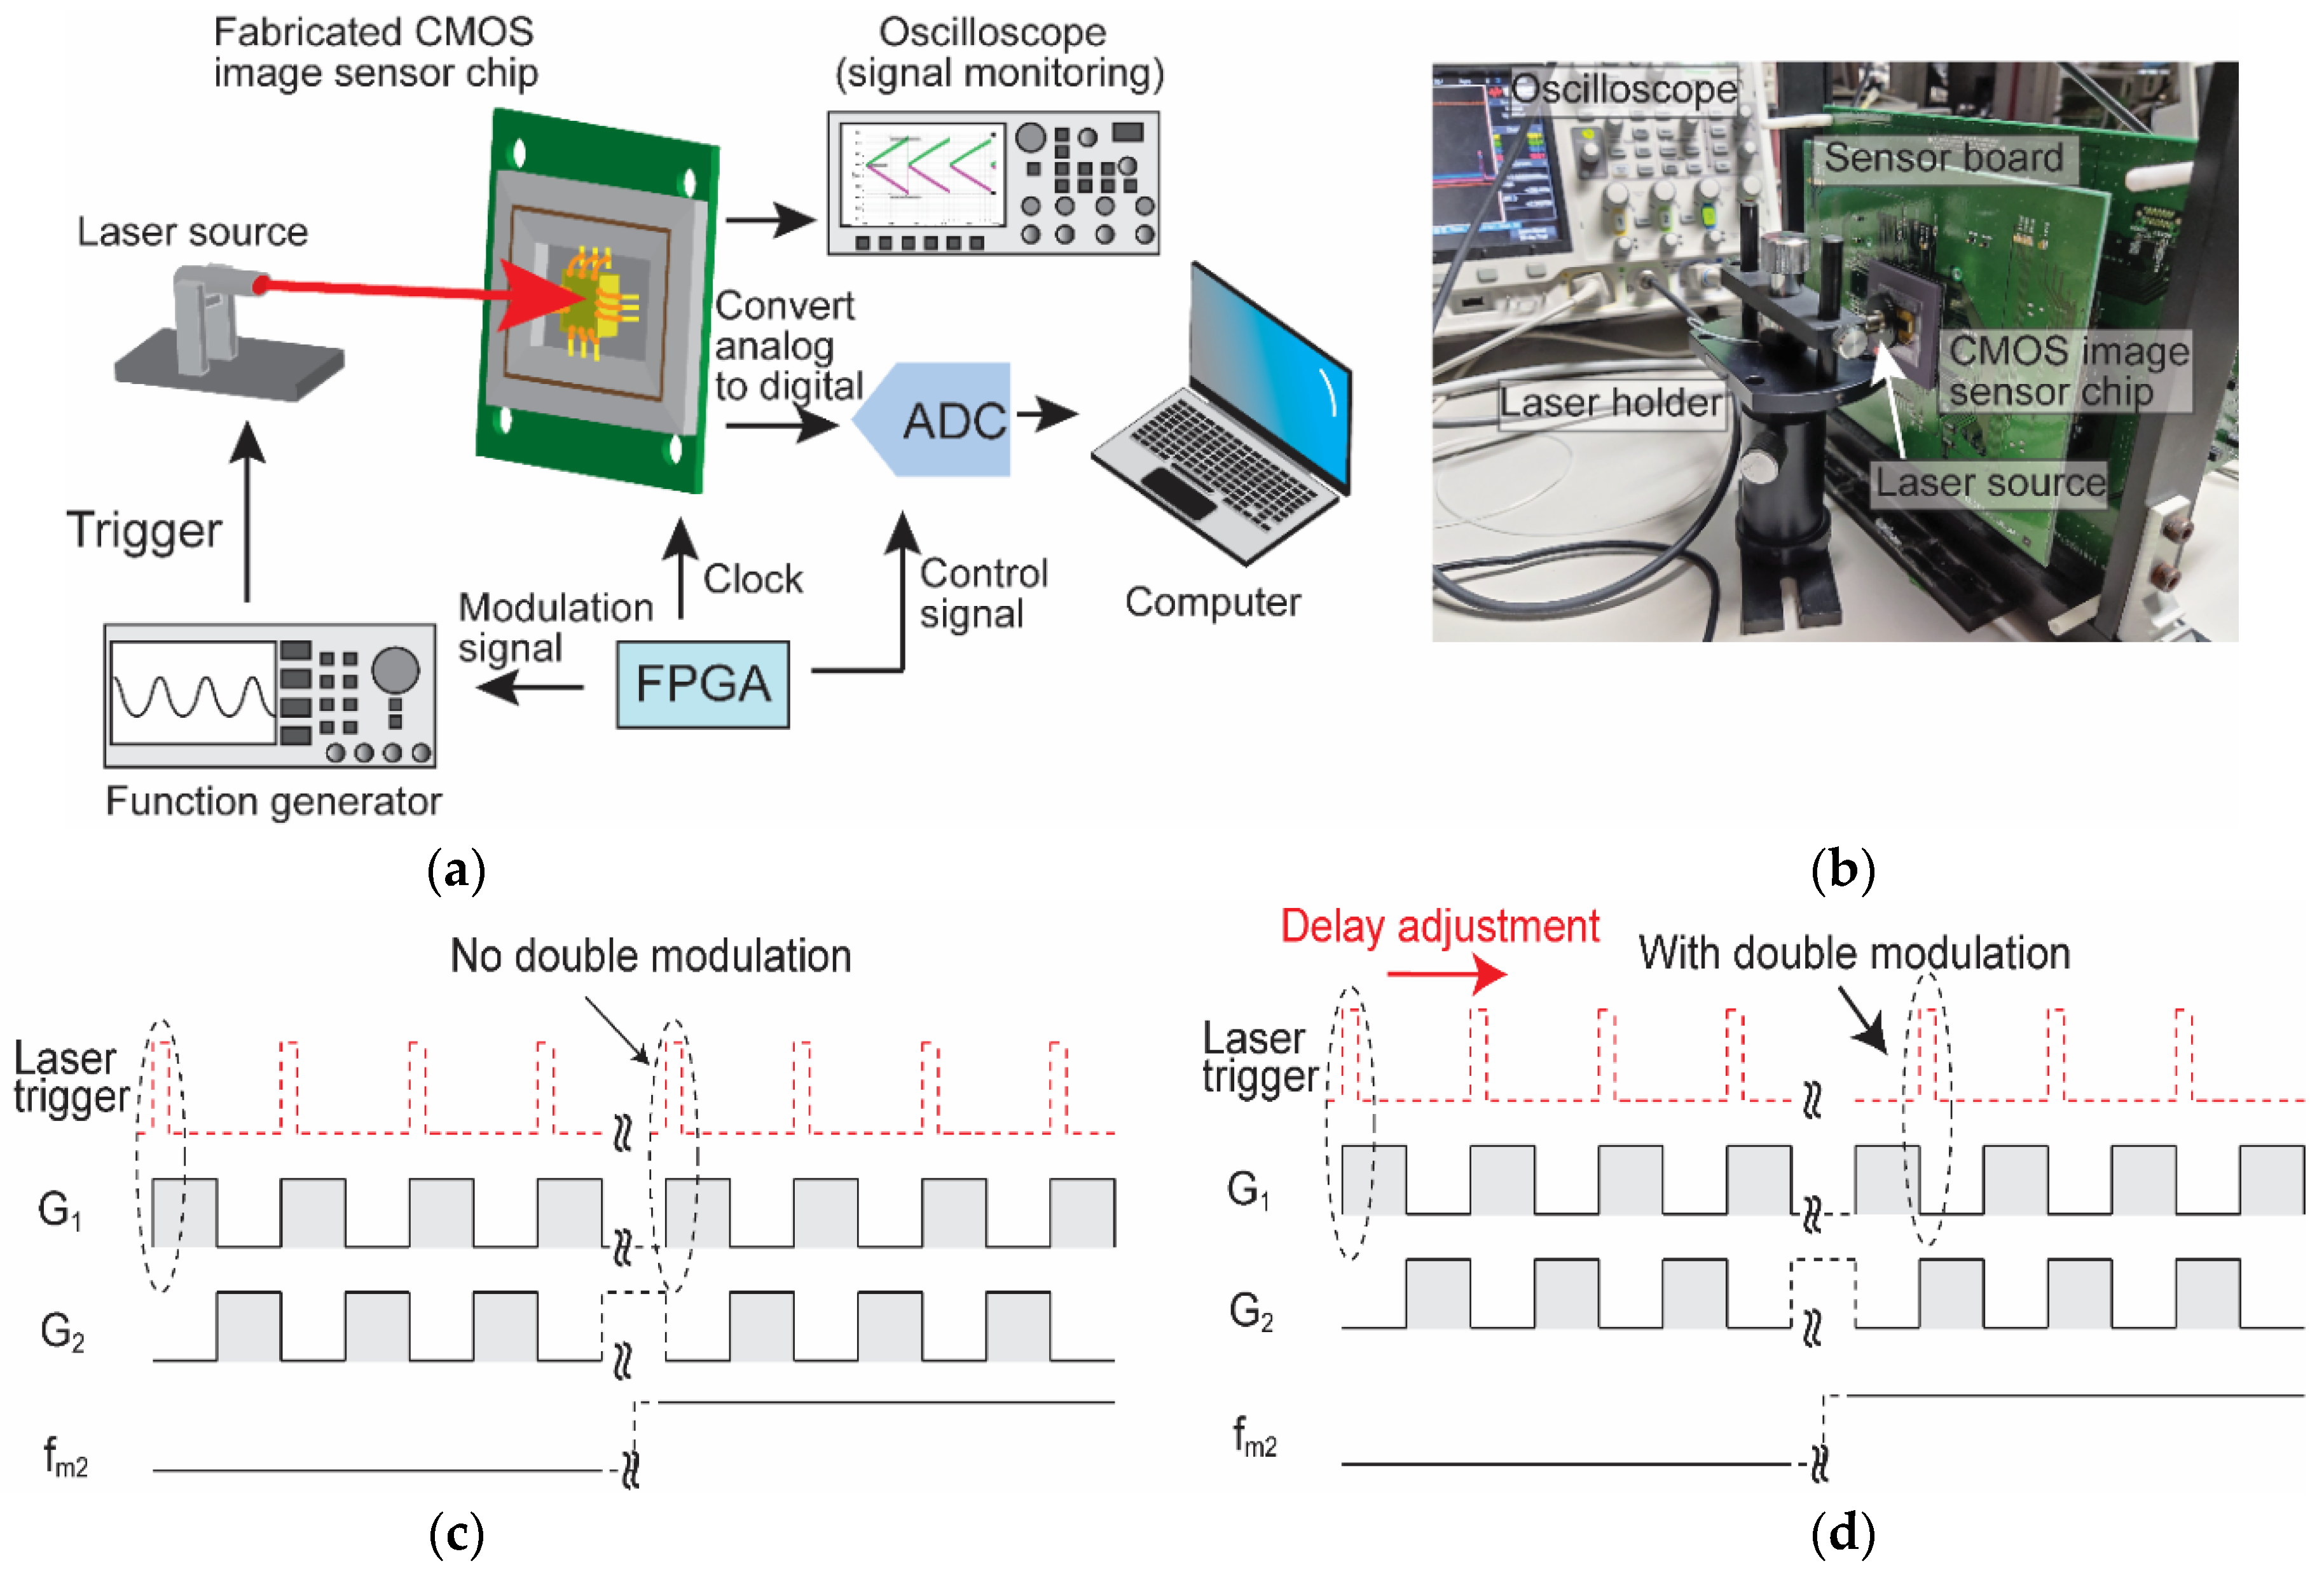
Figure 11a shows the measurement setup to characterize the prototype chip. A laser diode (LDB-100, Tama Electric Inc, Hamamatsu, Japan) of 850 nm wavelength is used in this measurement to emulate the pump pulse. A function generator drives the laser by providing a trigger signal; one trigger produces one pulse. A field programmable gate array (FPGA) is used as an external clock driver that controls all the digital clock signals driving the chip, including an analog-to-digital converter (ADC). The FPGA also drives the function generator with a modulation signal to double-modulate the laser pulse with fm1 × fm2. An oscilloscope is used for analog signal monitoring. Digital data from the ADC is transferred to a computer using a camera link for further processing. A photograph image during the measurement is shown briefly in Figure 11b. The laser holder helps to hold the laser source in position and direct the illumination to the pixel. The sensor PCB houses the developed chip, ADC, FPGA, and other external circuitry essential for operation, such as a power regulator, voltage, and current reference circuitries.
A timing diagram for the laser trigger concerning the gate control signal (G1 and G2) is shown in Figure 11c,d. During an SRS measurement, G1 and G2 are supposed to demodulate the higher and lower-intensity pulses, Iip and Iin, respectively, as depicted in Figure 6b. However, only one laser source is used in the characterization setup proposed in Figure 11a. Therefore, the strategy to create a photocurrent imbalance between Iip and Iin is presented in Figure 11c, which only triggers the laser during the control signal for G1 or G2 is high. In Figure 11c, the timing diagram shows that the laser trigger is aligned with the control signal for G1. Figure 11d shows the trigger signal when the double modulation is imposed, where the phase is shifted corresponding to the state of modulation signal fm2.

4.2. Characterization

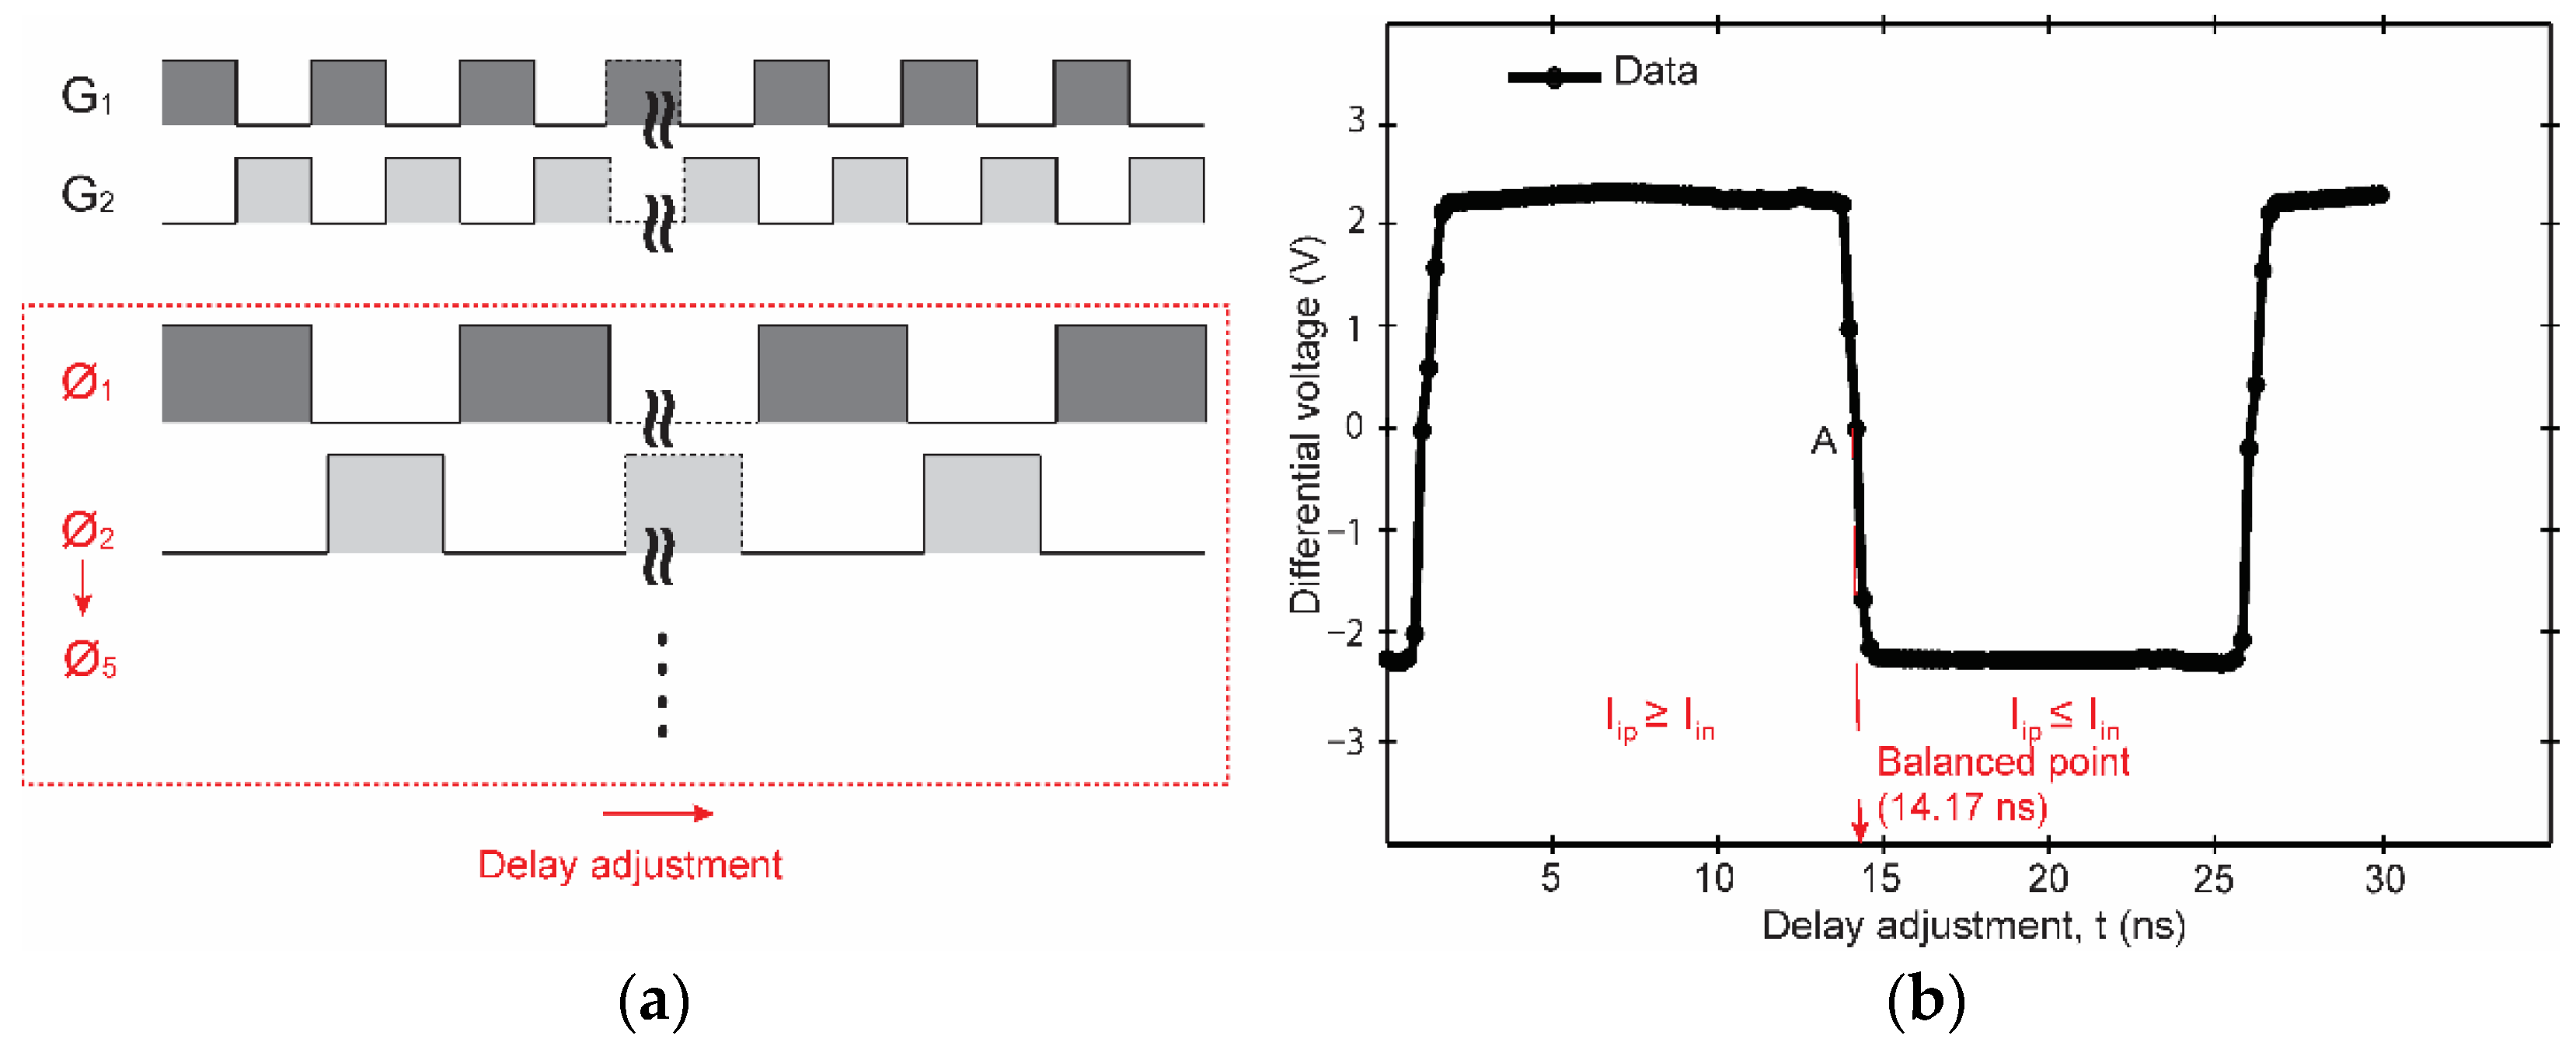
The lock-in amplifier circuit with the photo-demodulator’s parasitics and environment light may cause the differential output to occur even without laser illumination. The delay adjustment across gate clocks leads to a point where the level of currents sampled will be balanced; thus, zero or minimal differential output can be obtained. The calibration is performed to determine the correct delay point for sampling and integration and to minimize the output when the signal to be detected does not exist. The configuration for this calibration is shown in Figure 12a. The gates G1 and G2 modulate the photocurrent generated from environmental light, which acts as a DC offset. Figure 12b shows the differential output as the delay is adjusted, obtaining similar behavior to the simulation result in Figure 8. The currents are balanced at point A, where the delay at this point is 14.17 ns. The subsequent measurements will be based on this delay point for the circuit operation.
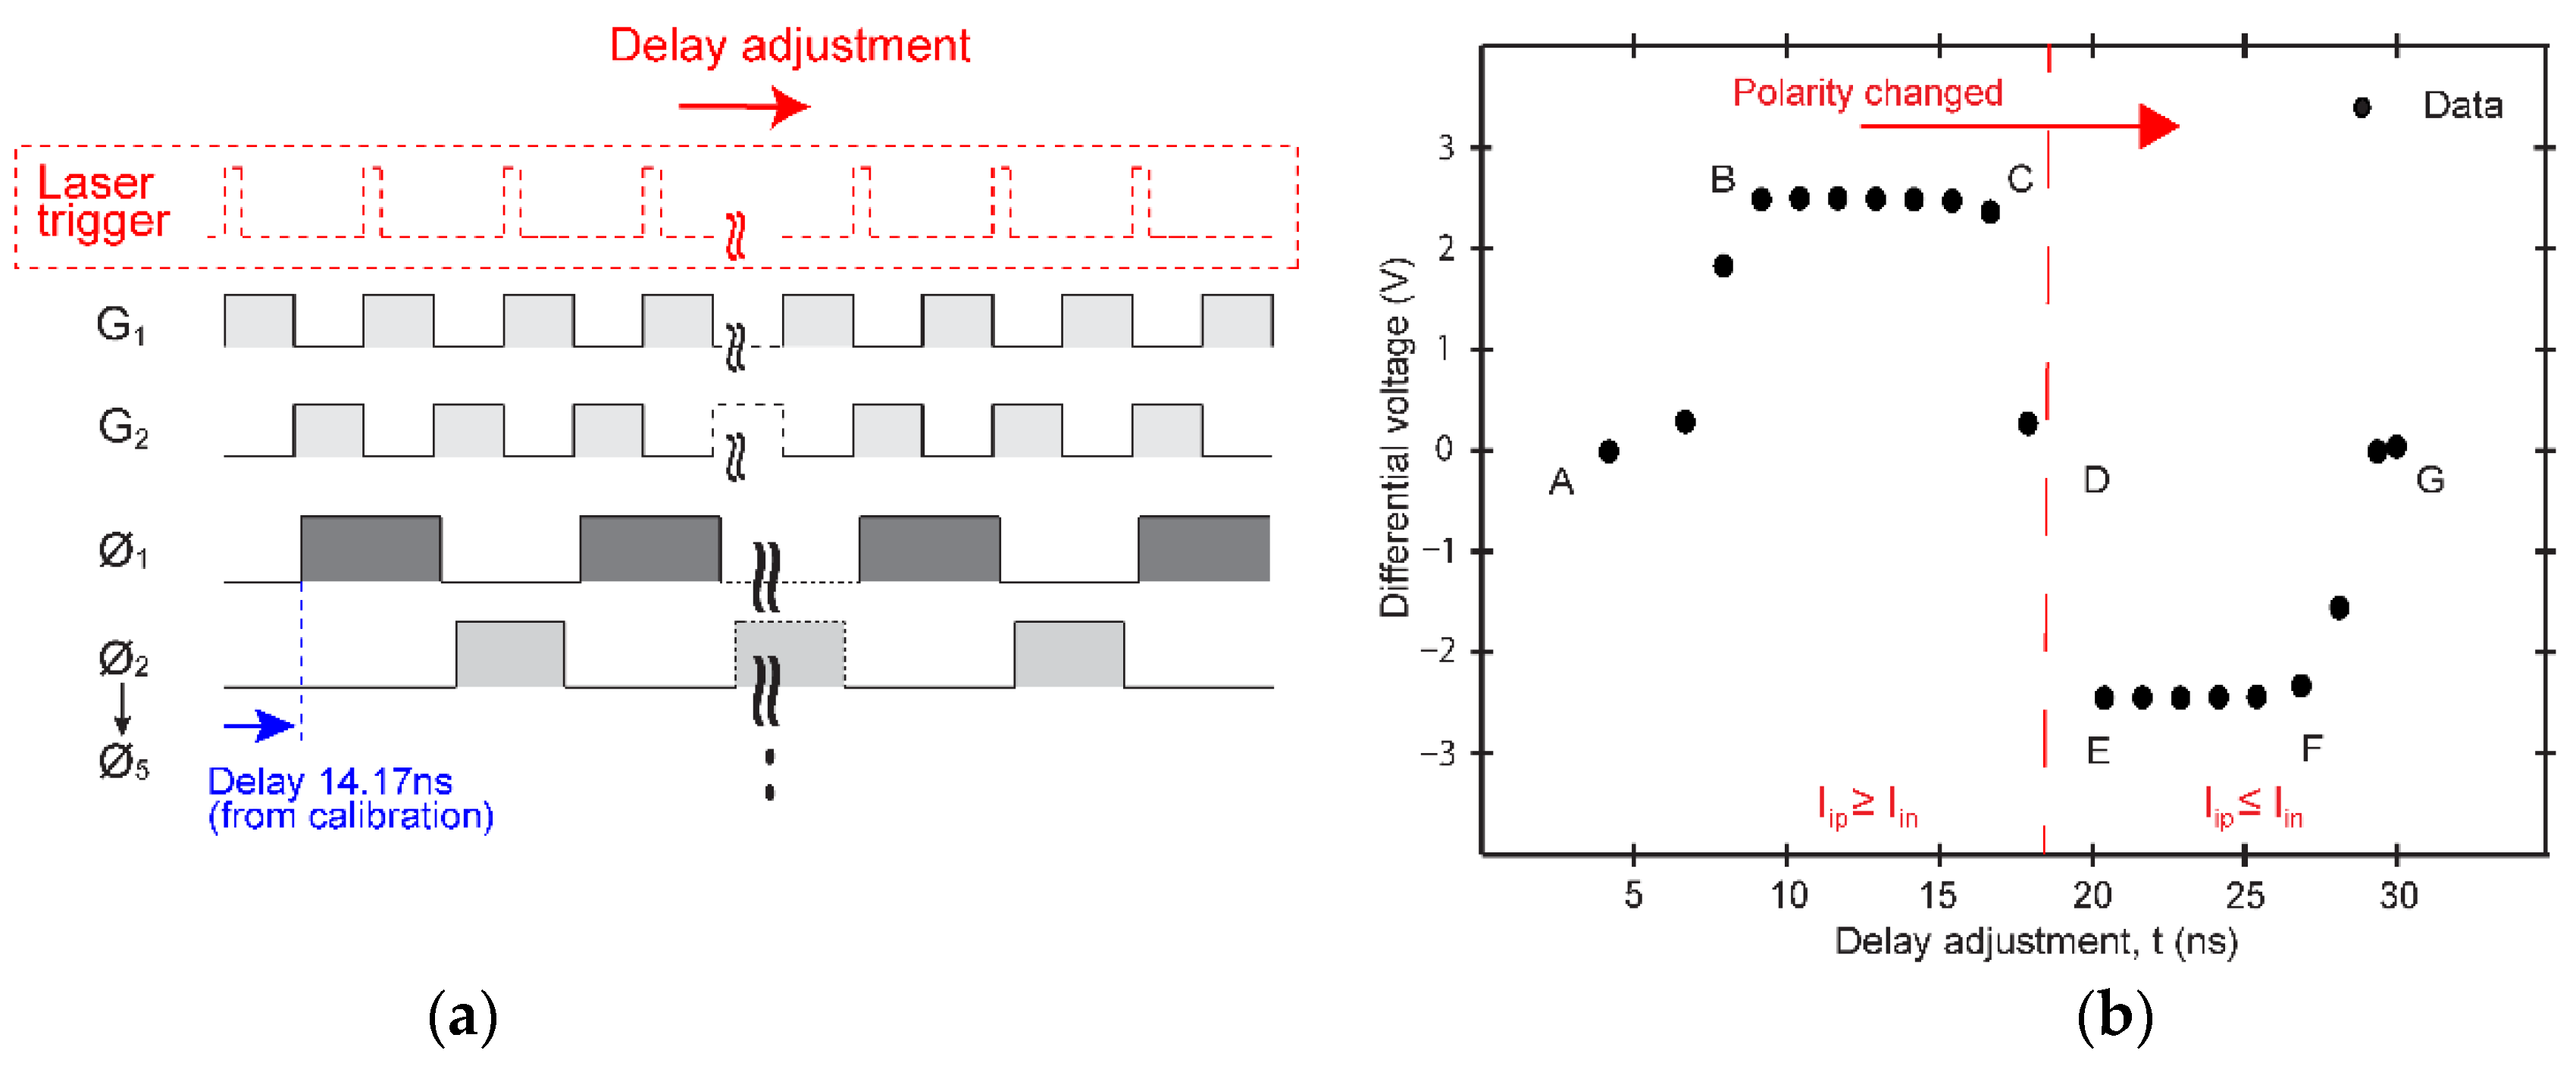
Figure 13 shows the measurement results using a laser source. All the circuit timing operations are delayed by 14.17 ns with G1 and G2, as shown in Figure 13a. As shown in Figure 13b, the differential voltage output increases with the delay adjustment between points A and B, indicating IipIin. The differential voltage output is saturated at about 2.9 V between points B and C. The output decreases between points C and D, indicating the response to the decrease of the difference between Iip and Iin. Finally, the polarity is reversed as IipIin, and similar behavior from A to D is observed between the points D to G. This experiment resembles the output produced in SRS measurement when the Ip (the higher intensity light) is illuminated during one gate is turned on and the Ip − ΔIp (the lower intensity light) when the other gate is turned on. The output is reversed in polarity when the position of Ip and Ip − ΔIp is reversed. This result validates the circuit functionality by producing an output that changes with the laser delay adjustment, which essentially creates an imbalance of currents at the input of the first-stage integrator circuit.
Figure 14 demonstrates the ability of the in-pixel double-modulation to reduce the 1/f noise of the lock-in amplifier. For comparison, Figure 14a shows the noise measurement result when the double-modulation technique is not applied. The 1/f noise is observed at a lower frequency, as highlighted with the red line. Figure 14b is the result when the double modulation is applied, showing the effectiveness of the double-modulation technique where 1/f noise of the first-stage integrator is suppressed. The data is obtained based on a fast Fourier transform (FFT) of five thousand samples, showing that the double modulation can effectively suppress low-frequency noise components, contributing to a better signal-to-noise ratio (SNR) detection of small SRS signal when the implemented chip is used for a real application in SRS signal measurement.
Compared to the single-stage implementation that requires off-chip processing to remove offset components and 1/f noise, this work offers an on-chip solution by performing in-pixel double-demodulation [16,17]. In addition, a two-stage circuit provides more gain, essential in boosting the weak SRS signal. In terms of form factor, an ASIC solution of four channels has been proposed [12]. However, external discreet photodiodes were used, which increased the overall size and made it difficult to expand. The fully-integrated solid-state solution developed in this work combines a detector and readout circuit with the size of 50 μm × 575 μm per channel. Currently, ten channels are implemented; however, the number of channels can be easily expanded to suit the SRS multiplex system.

5. Conclusions

This paper presents a double-demodulation lock-in amplifier for SRS application. The chip prototype integrates the LEFM photo-demodulator with a readout circuit based on the CMOS image sensor platform. A two-stage integrator-based double-demodulation achieves analog-domain high-gain amplification while suppressing the offset and 1/f noise of the laser and the front-end readout circuits. The implemented large-area LEFM photo-demodulator is proven its efficiency for high-frequency charge transfer with smaller than three ns of charge-transfer time, which are sufficient for responding laser pulses running at 80 MHz. The design double-demodulation lock-in amplifier successfully works at 20 MHz. An experiment of the sampling phase adjustment for offset minimization and sensitivity maximization is successfully carried out. The comparison of the noise measurements between the two cases of with and without double modulation clearly shows the effectiveness of double-modulation lock-in amplifier for reducing the 1/f noise of the SRS signal readout circuits. The preliminary experiments using the prototype chip suggest possible SRS detection with good SNR attributed to a reduction in 1/f noise and offset, leading to higher SRS signal amplification.

Author Contributions

Conceptualization, S.B.K.K.M., D.X.L. and S.K.; image sensor design, S.B.K.K.M., D.X.L., K.Y., K.K. and S.K.; experiments and data analysis S.B.K.K.M. and D.X.L.; manuscript preparation, S.B.K.K.M., D.X.L. and S.K.; supervision, M.H. and S.K. All authors have read and agreed to the published version of the manuscript.

Funding

This work was supported by the Grant-in_Aid for Scientific Research (S) through the Ministry of Education, Culture, Sports, Science, and Technology (MEXT) under Grant 18H05240.

Data Availability Statement

Not applicable.

Acknowledgments

This work was also supported by VLSI Design and Education Center (VDEC), the University of Tokyo in collaboration with Cadence Design Systems, Inc. and Mentor Graphics, Inc.

Conflicts of Interest

The authors declare no conflict of interest.

References

  1. Riek, C.; Kocher, C.; Zirak, P.; Kölbl, C.; Fimpel, P.; Leitenstorfer, A.; Zumbusch, A.; Brida, D. Stimulated Raman Scattering Microscopy by Nyquist Modulation of a Two-Branch Ultrafast Fiber Source. Opt. Lett. 2016, 41, 3731. [Google Scholar] [CrossRef] [PubMed] [Green Version]
  2. Yamato, N.; Niioka, H.; Miyake, J.; Hashimoto, M. Improvement of Nerve Imaging Speed with Coherent Anti-Stokes Raman Scattering Rigid Endoscope Using Deep-Learning Noise Reduction. Sci. Rep. 2020, 10, 15212. [Google Scholar] [CrossRef] [PubMed]
  3. Zada, L.; Fokker, B.; Leslie, H.A.; Vethaak, A.D.; de Boer, J.F.; Ariese, F. Stimulated Raman Scattering Simulation for Imaging Optimization. J. Eur. Opt. Soc. Rapid Publ. 2021, 17, 10. [Google Scholar] [CrossRef]
  4. Ogawa, H.; Hashimoto, M. Avoidance of Four-Wave Mixing in Optical Fiber Bundle for Coherent Anti-Stokes Raman Scattering Endomicroscopy. Opt. Lett. 2021, 46, 3356. [Google Scholar] [CrossRef] [PubMed]
  5. Ozeki, Y.; Dake, F.; Kajiyama, S.; Fukui, K.; Itoh, K. Analysis and Experimental Assessment of the Sensitivity of Stimulated Raman Scattering Microscopy. Opt. Express 2009, 17, 3651. [Google Scholar] [CrossRef]
  6. Freudiger, C.W.; Min, W.; Saar, B.G.; Lu, S.; Holtom, G.R.; He, C.; Tsai, J.C.; Kang, J.X.; Xie, X.S. Label-Free Biomedical Imaging with High Sensitivity by Stimulated Raman Scattering Microscopy. Science 2008, 322, 1857–1861. [Google Scholar] [CrossRef] [Green Version]
  7. Nandakumar, P.; Kovalev, A.; Volkmer, A. Vibrational Imaging Based on Stimulated Raman Scattering Microscopy. New J. Phys. 2009, 11, 033026. [Google Scholar] [CrossRef]
  8. Valensise, C.M.; Giuseppi, A.; Vernuccio, F.; de La Cadena, A.; Cerullo, G.; Polli, D. Removing Non-Resonant Background from CARS Spectra via Deep Learning. APL Photonics 2020, 5, 061305. [Google Scholar] [CrossRef]
  9. Ozeki, Y.; Asai, T.; Shou, J.; Yoshimi, H. Multicolor Stimulated Raman Scattering Microscopy with Fast Wavelength-Tunable Yb Fiber Laser. IEEE J. Sel. Top. Quantum Electron. 2019, 25, 7100211. [Google Scholar] [CrossRef]
  10. Réhault, J.; Crisafi, F.; Kumar, V.; Ciardi, G.; Marangoni, M.; Cerullo, G.; Polli, D. Broadband Stimulated Raman Scattering with Fourier-Transform Detection. Opt. Express 2015, 23, 25235. [Google Scholar] [CrossRef]
  11. Ragni, A.; Sciortino, G.; Sampietro, M.; Ferrari, G.; Polli, D. Multi-Channel Lock-in Based Differential Front-End for Broadband Raman Spectroscopy. Integration 2019, 67, 44–49. [Google Scholar] [CrossRef] [Green Version]
  12. Sciortino, G.; Ragni, A.; de La Cadena, A.; Sampietro, M.; Cerullo, G.; Polli, D.; Ferrari, G. Four-Channel Differential Lock-in Amplifiers with Autobalancing Network for Stimulated Raman Spectroscopy. IEEE J. Solid-State Circuits 2021, 56, 1859–1870. [Google Scholar] [CrossRef]
  13. Wang, Z.; Zheng, W.; Huang, Z. Lock-in-Detection-Free Line-Scan Stimulated Raman Scattering Microscopy for near Video-Rate Raman Imaging. Opt. Lett. 2016, 41, 3960. [Google Scholar] [CrossRef] [PubMed]
  14. Mars, K.; Lioe, D.X.; Kawahito, S.; Yasutomi, K.; Kagawa, K.; Yamada, T.; Hashimoto, M. Label-Free Biomedical Imaging Using High-Speed Lock-in Pixel Sensor for Stimulated Raman Scattering. Sensors 2017, 17, 2581. [Google Scholar] [CrossRef] [PubMed] [Green Version]
  15. Gambetta, A.; Kumar, V.; Grancini, G.; Polli, D.; Ramponi, R.; Cerullo, G.; Marangoni, M. Fiber-Format Stimulated-Raman-Scattering Microscopy from a Single Laser Oscillator. Opt. Lett. 2010, 35, 226. [Google Scholar] [CrossRef]
  16. Lioe, D.X.; Mars, K.; Takasawa, T.; Yasutomi, K.; Kagawa, K.; Hashimoto, M.; Kawahito, S. A CMOS Image Sensor Using High-Speed Lock-in Pixels for Stimulated Raman Scattering. In Proceedings of the SPIE 9720, High-Speed Biomedical Imaging and Spectroscopy: Toward Big Data Instrumentation and Management, San Francisco, CA, USA, 7 March 2016; Tsia, K.K., Goda, K., Eds.; Volume 9720, p. 97200J. [Google Scholar]
  17. Lioe, D.X.; Mars, K.; Kawahito, S.; Yasutomi, K.; Kagawa, K.; Yamada, T.; Hashimoto, M. A Stimulated Raman Scattering CMOS Pixel Using a High-Speed Charge Modulator and Lock-in Amplifier. Sensors 2016, 16, 532. [Google Scholar] [CrossRef] [Green Version]
  18. Witte, J.F.; Makinwa, K.A.A.; Huijsing, J.H. A CMOS Chopper Offset-Stabilized Opamp. IEEE J. Solid-State Circuits 2007, 42, 1529–1535. [Google Scholar] [CrossRef]
  19. Seto, K.; Okuda, Y.; Tokunaga, E.; Kobayashi, T. Development of a Multiplex Stimulated Raman Microscope for Spectral Imaging through Multi-Channel Lock-in Detection. Rev. Sci. Instrum. 2013, 84, 083705. [Google Scholar] [CrossRef] [Green Version]
  20. Li, Y.; Shen, B.; Li, S.; Zhao, Y.; Qu, J.; Liu, L. Review of Stimulated Raman Scattering Microscopy Techniques and Applications in the Biosciences. Adv. Biol. 2021, 5, 2000184. [Google Scholar] [CrossRef]
  21. Bae, K.; Zheng, W.; Huang, Z. Spatial Light-Modulated Stimulated Raman Scattering (SLM-SRS) Microscopy for Rapid Multiplexed Vibrational Imaging. Theranostics 2020, 10, 312–322. [Google Scholar] [CrossRef]
  22. Jainwal, K.; Anand, C.; Sarkar, M. 1/f Noise Reduction Using In-Pixel Chopping in CMOS Image Sensors. IEEE Solid State Circuits Lett. 2018, 1, 146–149. [Google Scholar] [CrossRef]
  23. Pham, X.T.; Vu, T.K.; Nguyen, T.D.; Pham-Nguyen, L. A 1.2-ΜW 41-DB Ripple Attenuation Chopper Amplifier Using Auto-Zero Offset Cancelation Loop for Area-Efficient Biopotential Sensing. Electronics 2022, 11, 1149. [Google Scholar] [CrossRef]
  24. Kawahito, S.; Baek, G.; Li, Z.; Han, S.M.; Seo, M.W. CMOS Lock-in Pixel Image Sensors with Lateral Electric Field Control for Time-Resolved Imaging. Int. Image Sens. Workshop 2013, 2, 3–5. [Google Scholar]
  25. Ozeki, Y.; Kitagawa, Y.; Sumimura, K.; Nishizawa, N.; Umemura, W.; Kajiyama, S.; Fukui, K.; Itoh, K. Stimulated Raman Scattering Microscope with Shot Noise Limited Sensitivity Using Subharmonically Synchronized Laser Pulses. Opt. Express 2010, 18, 13708. [Google Scholar] [CrossRef] [PubMed]
  26. Hu, F.; Shi, L.; Min, W. Biological Imaging of Chemical Bonds by Stimulated Raman Scattering Microscopy. Nat. Methods 2019, 16, 830–842. [Google Scholar] [CrossRef] [PubMed]
  27. Razavi, B. Design of Analog CMOS Integrated Circuits, 1st ed.; McGraw-Hill, Inc.: New York, NY, USA, 2001; ISBN 0072380322. [Google Scholar]
  28. Quinn, P.J.; Van Roermund, A.H. Switched-Capacitor Techniques for High-Accuracy Filter and ADC Design; Springer: Dordrecht, The Netherlands, 2007; ISBN 978-1-4020-6257-5. [Google Scholar]
  29. Choksi, O.; Carley, L.R. Analysis of Switched-Capacitor Common-Mode Feedback Circuit. IEEE Trans. Circuits Syst. II Analog. Digit. Signal Process. 2003, 50, 906–917. [Google Scholar] [CrossRef]
Figure 1. Principle of lock-in SRS signal detection: (a) Single-modulation and (b) Double-modulation.
Electronics 12 00004 g001
Figure 2. Overall noise reduction process through the in-pixel double-demodulation.
Electronics 12 00004 g002
Figure 3. Circuit block diagram for the SRS signal extraction with in-pixel double-modulation.
Electronics 12 00004 g003
Figure 4. Three-step ion implantations LEFM photo-demodulator: (a) The structure of LEFM photo-demodulator, (b) Potential profile of the photo-electrons transfer mechanism in the LEFM photo-demodulator at X−X’ direction, and (c) Potential profile at Y−Y’ direction.
Electronics 12 00004 g004
Figure 5. LEFM photo-demodulator. (a) Large area implementation with the combination of ten sub-structure LEFM photo-demodulator. (b) Simulation of photo-charges time transfer from three locations (A, B, and C) to evaluate charge transfer speed for large area LEFM photo-demodulator.
Electronics 12 00004 g005
Figure 6. Schematic design of the SRS signal lock-in amplifier: (a) Schematic diagram. (b) A timing diagram for the circuit operation.
Electronics 12 00004 g006
Figure 7. Diagram for the simulation technique to verify the circuit functionality.
Electronics 12 00004 g007
Figure 8. Simulation result of the differential output of the lock-in amplifier observed when the delay for sampling and integration is adjusted across the pulse current. Points A to B, B to C and C to D indicate the increasing difference between the two currents with IsimNIsimP, the largest difference between two currents with IsimNIsimP, and the decreasing difference between the two currents with IsimNIsimP, respectively. Points D, E, F, and G repeat similar behavior, but in different polarities for case, the two currents are IsimNIsimP.
Electronics 12 00004 g008
Figure 9. Simulated linearity plot for SRS signal detection.
Electronics 12 00004 g009
Figure 10. (a) System block diagram of the proposed SRS chip architecture. (b) Photo of the chip mounted on PCB. (c) Photomicrograph of the fabricated SRS chip.
Electronics 12 00004 g010
Figure 11. (a) The measurement setup for SRS chip evaluation. (b) The photograph of the chip on the sensor PCB is illuminated with a laser for chip evaluation. (c) A timing diagram to show the laser trigger is aligned to either G1 or G2 clock signals (aligned to the G1 clock signal in this case). (d) Measurement timing diagram with double-modulation used on the laser trigger.
Electronics 12 00004 g011
Figure 12. Gate clock timing calibration. (a) Timing configuration for the calibration. (b) Result of the timing calibration curve that determines the delay (balanced point) by observing the minimum differential voltage proportional to the current difference at the circuit input.
Electronics 12 00004 g012
Figure 13. (a) Timing configuration for the SRS chip evaluation with a laser source. (b) The measurement result obtained for the SRS chip across laser delay adjustment.
Electronics 12 00004 g013
Figure 14. Comparison of noise measurement: (a) No double-modulation is applied and (b) the double-modulation is used.
Electronics 12 00004 g014
Table 1. Photo-charges transfer time simulations for the large area LEFM photo-demodulator.
Initial LocationTransfer Time (ns)
A0.92
B2.03
C2.97
Disclaimer/Publisher’s Note: The statements, opinions and data contained in all publications are solely those of the individual author(s) and contributor(s) and not of MDPI and/or the editor(s). MDPI and/or the editor(s) disclaim responsibility for any injury to people or property resulting from any ideas, methods, instructions or products referred to in the content.