Abstract
The present study introduces the heterogeneous quasi-continuous spiking cortical model (HQC-SCM) method as a novel approach for neutron and gamma-ray pulse shape discrimination. The method utilizes specific neural responses to extract features in the falling edge and delayed fluorescence parts of radiation pulse signals. In addition, the study investigates the contributions of HQC-SCM’s parameters to its discrimination performance, leading to the development of an automatic parameter selection strategy. As HQC-SCM is a chaotic system, a genetic algorithm-based parameter optimization method was proposed to locate local optima of HQC-SCM’s parameter solutions efficiently and robustly in just a few iterations of evolution. The experimental results of this study demonstrate that the HQC-SCM method outperforms traditional and state-of-the-art pulse shape discrimination algorithms, including falling edge percentage slope, zero crossing, charge comparison, frequency gradient analysis, pulse-coupled neural network, and ladder gradient methods. The outstanding discrimination performance of HQC-SCM enables plastic scintillators to compete with liquid and crystal scintillators’ neutron and gamma-ray pulse shape discrimination ability. Additionally, the HQC-SCM method outperforms other methods when dealing with noisy radiation pulse signals. Therefore, it is an effective and robust approach that can be applied in radiation detection systems across various fields.
1. Introduction
As a fundamental component of the nucleus, the neutron has played a critical role in many scientific disciplines and modern industries. Instances include boron neutron capture therapy [1], particle and nuclear physics [2], astronomy [3,4], meteorology [5], and atomic reactors [6,7]. These neutron-related fields all require advanced neutron detection technology. Among the available options, 3He-based and scintillator-based neutron detectors are the two most widely used types of neutron monitoring setups. With the depletion of 3He reserves [8,9], scintillator-based neutron detectors have become increasingly important in all neutron-related fields. However, a significant challenge in using scintillator-based neutron detectors is that they are also sensitive to gamma-ray photons, which are inevitably generated in the interaction between neutrons and their surrounding environment. This dual sensitivity can result in the miscounting of neutrons, as detectors simultaneously record both neutrons and gamma rays. To address this issue, the pulse shape discrimination (PSD) technique has been developed [10]. PSD makes use of the subtle differences in the interaction of neutrons and gamma-ray photons with the sensitive volume of a detector, enabling the discrimination of neutrons and gamma rays based on their radiation pulse signal shapes.
Typical neutron and gamma-ray pulse signals (n- PSs) are shown in Figure 1a [11]. It can be observed that these two types of pulses exhibit a similar rising edge in the time frame of 50–60 ns. However, in the falling edge region of 70–120 ns, they exhibit a significant difference in their decay rate. Additionally, the slight amplitude variation in the 130–170 ns interval is a unique feature of the neutron pulse signal, known as delayed fluorescence. Consequently, to distinguish between n- PSs, PSD algorithms are designed to detect differences between n- PSs in the falling edge and delayed fluorescence parts, calculating a discrimination factor for each radiation pulse signal. Subsequently, these results are used to create a histogram of discrimination factors. This histogram generally displays two groups that follow Gaussian distributions, representing the radiation pulse signal counts of neutrons and gamma-ray photons, respectively. The effectiveness of the PSD is determined by the distance between the two Gaussian distributions and the smallness of the variance of each Gaussian distribution.
Figure 1.
Typical radiation pulse signals and feature extraction results. (a) Neutron and gamma-ray pulse signals. (b) Feature extraction results of n- PSs by PCNN. (c) Feature extraction results of n- PSs by QC-SCM.
Over the past few decades, numerous PSD methods have been developed. One of the earliest PSD methods is the zero crossing (ZC) method [12,13], which uses differential-integral filters to determine the decay rate of radiation pulse signals. This method is simple to implement and has low computational complexity, but it disregards the differences between n- PSs in the delayed fluorescence part, and it is highly sensitive to noise. This leads to poor discrimination performance and even unreliable results when the pulse signals are not pre-processed to remove noise. Another widely used PSD method is the charge comparison (CC) method [14]. This method calculates the ratio of the charge integrals of the falling edge part and the entire pulse signal to discriminate n- PSs. The CC method takes into account differences in both the falling edge and delayed fluorescence parts, resulting in better performance compared to the ZC method. Despite its satisfactory discrimination performance for most scientific and industrial applications using high-quality liquid scintillators, the unsatisfactory performance of the CC and ZC methods on more affordable plastic scintillators has led researchers to develop algorithms with better discrimination capabilities, such as those based on frequency domain analysis [15,16] and feature extractions [17,18].
In 2021, Liu et al. introduced a PSD method based on a pulse-coupled neural network (PCNN) [19]. This method involves using PCNN to extract features from the original pulse signals, which are then used to generate an ignition map for each pulse signal. The resulting ignition maps magnify the differences between n- PSs, leading to exceptional discrimination performance. This method considers information in both falling edge and delayed fluorescence parts, and is highly anti-noised due to the inherent noise resistant characteristic of PCNN [20]. In the following year, Liu et al. proposed the ladder gradient (LG) method [21], which utilizes a quasi-continuous spiking cortical model (QC-SCM) to extract pulse signal features in a more effective manner than PCNN. Additionally, the ladder gradient method employs a new calculation strategy for the discrimination factor, which reduces the computational burden. Research has demonstrated the robustness of third-generation neural network-based PSD methods, such as PCNN and LG. However, while PCNN-based models have the advantage of not requiring pre-training, they do need to determine the parameters that control the neural response characteristics. These parameters are often chosen through researcher experience or extensive experimentation and remain constant throughout the feature extraction process. This can negatively impact analysis performance because the characteristics of pulse signals in the falling edge and delayed fluorescence parts are inherently different due to varying nuclear reaction processes.
To address this issue, this study proposes a heterogeneous QC-SCM (HQC-SCM) for PSD. Unlike previous PSD methods that are based on PCNN and LG, this method is designed to overcome the limitations associated with the fixed parameters that determine neural response characteristics in PCNN-based models. The HQC-SCM method utilizes a different neuron response for each pulse signal feature, resulting in better signal analysis performance. Additionally, the method incorporates an automatic parameter selection strategy based on the genetic algorithm (GA), making it a parameter-free algorithm. Experiments were conducted to compare the discrimination performance of the proposed HQC-SCM method with other established PSD methodologies. Results of these experiments showed that the HQC-SCM method provides not only superior discrimination performance but also exhibits strong noise-resistant properties.
The present study is organized as follows: Section 2 elaborates on the methodologies of the HQC-SCM PSD method. Section 3 introduces the GA-based automatic parameter selection method and evaluation criteria used to assess the performance of PSD methods. Section 4 presents the detailed structure of the experiments and the corresponding results. Finally, the conclusion of this work is summarized in Section 5.
2. Methodologies
2.1. Pulse-Coupled Neural Network
PCNN is a further advanced neural network [22] from the cortical model of Eckhorn [23]. It was derived from the research on interactions between cell assemblies in a cat’s primary visual cortex. Differing from second-generation neural networks such as AlphaGo [24], PCNN is a third-generation neural network, meaning its neurons’ activities are more biologically plausible. In contrast to most neural network models that require a cumbersome training process, PCNN operates without a pre-training phase and processes information in a manner similar to an animal’s visual cortex [25]. The network’s neural response characteristics are determined by several manual parameters. The mathematical expressions of PCNN are as follows:
where, and represent the feedback input and link input of a neuron at position , respectively; represents the internal activity or membrane potential of the neuron; represents the dynamic threshold; is the output of a neuron, which is determined by the spike generation condition; represents the iteration count; the constant decay coefficients for the feedback input and link input are represented by and , respectively, while the constant weighting coefficients are represented by and ; the weight matrixes and control the connection between a central neuron at and its neighboring neurons at ; the external input fed to the PCNN is represented by ; represents the weighting factor that controls the relationship between feedback and link inputs; and the constant decay coefficient and constant weighting coefficient of the dynamic threshold are represented by and , respectively.
In the PSD application, the PCNN is utilized to extract distinctive features from n- PSs. As illustrated in Figure 1a,b, the PCNN amplifies the differences in the signal shapes between neutron and gamma-ray photons, resulting in a clear distinction between the falling edge and delayed fluorescence parts of the pulse signals. This feature extraction process plays a crucial role in enabling the calculation of high-quality discrimination factors, which are used to differentiate between neutrons and gamma rays.
2.2. Heterogeneous QC-SCM
QC-SCM was proposed by Liu et al. as a means to enhance feature extraction from n- PSs [21]. While the SCM model, from which QC-SCM was derived, improved computational accuracy by simplifying parameters from the PCNN, both SCM and PCNN process signals in discrete time steps, limiting the resolution of neuron firing and their overall information processing capabilities. In contrast, the QC-SCM process signal with continuous characteristics allows for better resolution of neuron firing and improved analysis of minor structures. The feature extraction performance of QC-SCM is demonstrated in Figure 1c. Although the differences between n- PSs are well captured by PCNN (as shown in Figure 1b), the ignition times are prone to fluctuation due to noise in pulse signals. However, the ignition times of QC-SCM remain relatively stable across the falling edge and delayed fluorescence parts of the signal, owing to its improved anti-noise property, which is enabled by its continuous time step characteristic. The mathematical formulas of QC-SCM are defined as follows,
where the membrane potential of a neuron located at is represented by ; the continuous time characteristic of the QC-SCM is determined by the parameter , which has a value range between 0 and 1; the closer the value of is to 0, the closer the QC-SCM becomes to a continuous time system; the neural activities are determined by manually selected coefficients, represented by , , and ; and the rest of the symbols retain the same meaning as in the mathematical expressions of PCNN.
There are three manual parameters that control the behavior of neurons in the QC-SCM. These parameters are typically selected based on the experience of the researcher or through extensive experiments, and they remain constant during the entire feature extraction process of a pulse signal. However, it is important to note that pulse signals being processed in the n- PSD application can have multiple features within a single pulse shape. As such, the differences between n- PSs are often exhibited in two main parts: the decay speed of the falling edge and the presence of delayed fluorescence. Utilizing a fixed neural response characteristic to process these inherently different features can result in a decrease in the performance of the QC-SCM. Consequently, a heterogeneous QC-SCM (HQC-SCM) is proposed in this study to solve this conflict between fixed neural characteristics and varying feature types, and its discrimination scheme is demonstrated in Figure 2.
Figure 2.
Discrimination scheme of HQC-SCM. First, the radiation pulse signals are segmented based on their feature types. The segmented signals are then directed to QC-SCM A and QC-SCM B, which are specifically designed for analyzing the falling edge and delayed fluorescence parts of pulse signals, respectively. Afterward, the ignition map of QC-SCM A and QC-SCM B is combined and further calculate the discrimination factor. Finally, a histogram of discrimination factors is drawn, based on which neutron and gamma-ray discrimination is made possible, and the Figure of Merit ()-value is computed.
As shown in Figure 2, radiation pulse signals of neutrons and gamma rays are first separated into two parts based on their feature characteristics. The first part extends from the beginning of a radiation pulse to the end of the falling edge, while the second part commences from the end of the falling edge and continues until the end of the pulse signal. Subsequently, the separated pulse signal parts are processed by two distinct QC-SCM models, each with unique neural response characteristics. These two QC-SCM models are specifically tailored to extract the features of the falling edge and delayed fluorescence parts, resulting in ignition maps of the separated pulse signals that present the differences between n- PSs the most. The ignition maps generated by QC-SCM A and QC-SCM B are then combined to form a composite ignition result for each n- PS. Finally, discrimination factors are calculated by integrating portions of the ignition maps that correspond to the falling edge and delayed fluorescence parts. Each n- PS is assigned a discrimination factor; hence a histogram of discrimination factors that represent all n- PSs can be drawn. In this histogram, the counts of gamma-ray photons and neutrons exhibit two separate Gaussian distributions, indicating the successful discrimination of the two particle types.
The feature extraction performance of the HQC-SCM is demonstrated through the ignition condition of n- PSs and the histograms of discrimination factors, as presented in Figure 3. As shown in Figure 3a, the ignition count of the two particles exhibits clear differences in the falling edge and delayed fluorescence parts, ranging from approximately 60 ns to 150 ns. The neutron’s ignition count decreases at a slower rate than that of the gamma-ray and remains at a higher value due to its characteristic delayed fluorescence effect. The two Gaussian distributions are significantly separated, indicating an exceptional PSD performance, as shown in Figure 3d.
Figure 3.
Feature extraction and pulse shape discrimination performance. Feature extraction results of (a) HQC-SCM, (b) QC-SCM A, and (c) QC-SCM B. Histograms of discrimination factors calculated by (d) HQC-SCM, (e) QC-SCM A, and (f) QC-SCM B.
The ignition results of the entire pulse signal processed by the QC-SCM A and QC-SCM B in the HQC-SCM model are presented in Figure 3b and Figure 3c, respectively. For an optimal ignition result, the ignition maps of the neutron and gamma-ray should be well-differentiated. The parameters of QC-SCM A are determined to specifically extract features from the falling edge part, allowing it to differentiate between neutrons and gamma rays from approximately 60 ns to 120 ns, as shown in Figure 3b. However, the ignition count of QC-SCM A ranging from 130 to 170 ns does not show a clear distinction between neutrons and gamma-rays as the neural response characteristics of QC-SCM A can only analyze features in the falling edge and perform poorly on the task of processing features in the delayed fluorescence. The histogram of discrimination factors generated using QC-SCM A, as shown in Figure 3e, exhibits poor discrimination performance with distorted and non-separated Gaussian distributions.
Furthermore, the parameters of QC-SCM B are determined so that its neural responses can best extract the differences in the delayed fluorescence part of n- PSs. The ignition results of QC-SCM B are similar to those of the HQC-SCM, as shown in Figure 3c, due to the requirements for extracting features from the highly noisy delayed fluorescence part. With its ability to extract features from this part, QC-SCM B generally exhibits a satisfactory performance with the feature extraction task of the falling edge part. However, using QC-SCM B to process the entire signal still results in inferior performance compared to the HQC-SCM, as shown in Figure 3f. The histogram from QC-SCM B has larger variances of Gaussian distributions and a narrower gap between the two Gaussian groups compared to the result of the HQC-SCM.
In conclusion, neither QC-SCM A nor QC-SCM B alone can achieve excellent feature extraction results and n- discrimination performance. Only when the HQC-SCM is used, specific neural response tuning can be performed for the characteristics of both features to produce outstanding PSD performance.
3. Parameter Selection Strategy
The HQC-SCM model demonstrates excellent performance in the feature extraction of n- PSs. However, it requires the use of two different neural models, which significantly increases the number of manual parameters. Typically, the parameters of PCNN-derived models are selected based on the experience of the researchers, making it a challenging and time-consuming task to determine the parameters for a broad range of applications. Determining parameters based on neural response characteristics for different types of features is even more complex and goes beyond the scope of individual experience. Consequently, this study proposes a genetic algorithm-based method for automatic parameter determination. This strategy tunes the neural response characteristics of the neural network models in the HQC-SCM, allowing each QC-SCM to precisely analyze and extract the assigned pulse signal features.
3.1. Genetic Algorithm
GA is an optimization algorithm that takes inspiration from natural selection and evolution in biological systems [26]. Its main objective is to find the optimal solution to a problem by iteratively generating new candidate solutions, evaluating their based on a given objective function, and selectively breeding them to produce offspring for the next generation. In GA, each solution corresponds to a chromosome that includes multiple genes generated through the binary encoding of parameters. These parameters determine the performance of a solution for the problem. By using the crossover and mutation process on these genes, the genetic algorithm emulates the natural selection process by gradually improving the of the population of candidate solutions over multiple generations.
Mutation and crossover are the two essential operations in GA. Specifically, mutation involves randomly changing a gene in a chromosome to create a new candidate solution. This operation is performed to introduce diversity in the population of candidate solutions and to prevent the algorithm from getting stuck in local optima. In the mutation, a random gene in a chromosome is selected, and its value is randomly changed. The mutation rate determines the frequency of the mutation operation, and it typically ranges from 0.4 to 0.8 [27]. Crossover, on the other hand, involves combining two parent chromosomes to produce an offspring chromosome. This operation is performed to recombine the good features of two parent solutions and create a new candidate solution different from its parents. In the crossover, two parent chromosomes are randomly selected, and a crossover point is chosen. The genes before the crossover point from one parent are combined with the genes after the crossover point from the other parent to form the offspring chromosome. The crossover rate determines the frequency of the crossover operation, typically ranging from 0.6 to 0.9 [27]. Both mutation and crossover are combined to create a new generation of candidate solutions. These processes are repeated until a new population of offspring solutions is created. Then, these solutions are evaluated based on a given objective function, and the best solutions are selected to form the next generation of candidate solutions. The processes mentioned above continue until a satisfactory solution is found or a termination criterion is met.
3.2. Evaluation Criteria
An objective function is required to calculate the fitness of solutions generated by GA’s iteration of evolution, evaluating the performance of each solution with regard to the PSD of neutrons and gamma rays. In order to define this objective function and compare performance between different PSD algorithms, serval evaluation criteria are introduced in this section.
3.2.1. Figure of Merit
The Figure of Merit () is a commonly used metric to evaluate the ability of a system to distinguish between neutrons and gamma rays [28]. To calculate , a histogram of discrimination factors is first generated, with two groups corresponding to gamma-ray and neutron counts. A Gaussian fitting function is then applied to both groups to create a fitting curve, which is used to determine the distance, , between the two groups and the full width at half maximum (FWHM) of each group. is then computed using the following formula:
where, and represent the FWHM of the neutron group and gamma-ray group, respectively. A large distance, , and small values of and indicate good discrimination performance. Consequently, a higher value indicates a better discrimination performance.
3.2.2. Davies-Bouldin Index
The Davies-Bouldin index () is a commonly used metric for evaluating clustering algorithms’ performance in machine learning and data analysis [29]. Davies et al. introduced this index in 1979 as a way of measuring both the separation between the clusters and the compactness of each cluster. The can be used to evaluate clustering algorithms in both multi-class and two-class classification problems. In a two-class classification problem, the Davies-Bouldin index is defined as follows,
where, and are the average intra-cluster distances of clusters and , respectively; and represents the distance between the cluster centers, which is often measured as the Euclidean distance between their centroids.
The intra-cluster distances, and , are calculated as the average distance between each point in a clusCnd the centroid of that cluster. The formula for calculating the intra-cluster distance of a cluster can be written as follows,
where is the number of points in the cluster; is the -th point in the cluster; is the centroid of the cluster ; and is the distance between point and centroid . The measures the similarity between two clusters by comparing the ratio of the sum of the intra-cluster distances to the distance between the two cluster centers. A lower Davies-Bouldin index indicates better clustering performance, as it means that the clusters are more separated and less overlapping. Conversely, a higher Davies-Bouldin index indicates poorer clustering performance, with clusters that are less well-separated and more overlapping. In this study, the was calculated by a two-class classification of k-means on radiation pulse signals’ discrimination factors.
3.3. Parameter-Free HQC-SCM
Before implementing any optimization algorithms for HQC-SCM’s PSD performance, it is essential to explore the influence of its parameters. Figure 4 illustrates that out of the six parameters of HQC-SCM, five are set to fixed values, while the remaining one is changed within a range determined by experience to evaluate the influence of each parameter on the algorithm performance. and conditions when parameters of QC-SCM A and QC-SCM B are changed are presented in Figure 4a–c and Figure 4d–f, respectively. It should be noted that the change of and can be sudden and impulsive when one parameter is evenly changed without any clear optimization direction. This suggests that HQC-SCM is a chaotic system in which parameters are closely coupled and lack a discernible pattern to follow. As a result, traditional optimization algorithms like gradient descent may not function correctly in such a chaotic system. Instead, using stochastic searching based on a population of solutions is a potential solution for this challenging optimization problem.
Figure 4.
Behavior of HQC-SCM parameters and feature extraction performance. The and trends are shown when QC-SCM A’s (a) parameter , (b) parameter , and (c) parameter ; and QC-SCM B’s (d) parameter , (e) parameter , and (f) parameter are changed. The HQC-SCM exhibits sudden and impulsive changes in the and the when a parameter is changed uniformly without any clear optimization direction. This characteristic behavior implies that HQC-SCM behaves like a chaotic system, wherein its parameters are closely interdependent and lack any discernible pattern to follow.
To optimize HQC-SCM’s parameters and achieve a parameter-free HQC-SCM, genetic algorithms (GA) are utilized. All six parameters of HQC-SCM are encoded into genes using binary encoding, forming a solution. The initial population is generated randomly based on the initial solution, which uses the QC-SCM parameter settings described in [21] for both QC-SCM A and QC-SCM B. The initial solution undergoes mutation and crossover processes, in which genes are stochastically changed by randomly tuning corresponding binary arrays. After each iteration of evolution, the of each solution is calculated using the objective function defined as:
where represents the Figure of Merit, which is a commonly used objective evaluation criterion in PSD applications, and is the Davies-Bouldin index, which is used to regularize the fitness function. requires a double Gaussian fitting process, which can be unstable and produce unreliable results when the histogram of discrimination factors does not exhibit Gaussian distributions. Therefore, prevents the fitness function from fluctuating abruptly by presenting the two-class classification performance of discrimination factors, which helps determine the performance of a solution when Gaussian distributions do not properly fit its discrimination factors.
The global optima of HQC-SCM are challenging to find; multiple local optima exist for each parameter within narrow ranges, as presented in Figure 4. The performance of HQC-SCM is acceptable when parameters are chosen within the local optima. Although the performance is acceptable, minor changes in the parameters can cause the method to fall out of its local optima, making it challenging to determine the evolution direction of solutions between iterations. Therefore, a high mutation and crossover rate are recommended, and GA is used in a way that is closer to stochastic searching than to gradient descent of evolution direction, which is more effective and efficient in finding a good solution for HQC-SCM. The parameter-free HQC-SCM initializes the first population with 50 solutions and optimizes these solutions throughout iterations of evolution, using the mutation and crossover rates of 0.9.
Figure 5 illustrates the averaged performance of 1000 populations evolved through the GA settings mentioned previously. Each population evolved independently, and the best five solutions in every population’s each iteration were selected and averaged to draw the graph. The figure presents the mean, max, and median values of , , and , respectively. These values were first calculated after the random initialization of the population. Hence, the values at iteration 0 show the performance of the initial population without any mutation and crossover process. The error bar of the mean value was drawn using the standard deviation of the 1000-times evolution’s best five solutions.
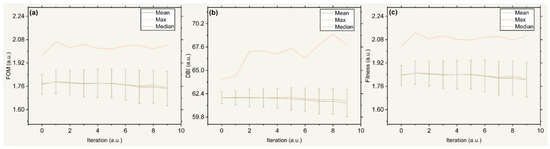
Figure 5.
Performance of HQC-SCM in multiple iterations of evolution. (a) Statistical results of the . (b) Statistical results of the . (c) Statistical results of the .
As shown in Figure 5, all statistical values of performance remain relatively stable throughout iterations, with a slightly decreasing tendency. Generally, the best performance is achieved in the first iteration and does not improve any further. This indicates that GA can find out most local optima of parameter settings in only a few volution times. When these local optima were found, further mutation and crossover processes forced individual solutions already set at local optima to fall out of it, resulting in a decrease in the population’s general performance. Meanwhile, this decrease is compensated by the stochastic search results of other solutions that fall in the local optima because GA can find optima very quickly, which leads to the final outcome of generally stable performance of generations.
In conclusion, HQC-SCM is a chaotic system with a non-predictable relationship between its parameter settings and PSD performance. Traditional optimization methods are unsuitable for this kind of system, while GA is good at solving this optimization problem with stochastic searching. A GA evolution strategy close to random searching rather than gradient descent of is used because the global optima of HQC-SCM are nearly impossible to find, and its local optima are enough to realize robust PSD applications. With an initialization of 50 populations and high mutation and crossover rates, GA can find serval good solutions for HQC-SCM’s parameters. This parameter determination method is effective, easy to realize, and not computationally cumbersome.
4. Experiment
4.1. Experimental Setups and Parameter Settings
In this study, a 241Am-Be isotope neutron source with an average energy of 4.5 MeV was utilized to generate a superposed field of neutrons and gamma-ray photons. The n- PSs of this superposed field were collected using an EJ299-33 plastic scintillator and a digital oscilloscope (TPS2000B) with a 1 GS/s sampling rate, 8 bits of vertical resolution, and 200 MHz bandwidth. To ensure reliable data collection, the trigger threshold was set at 500 mV, which corresponds to an energy of approximately 1.6 MeVee, where MeVee is defined in [19]. The pulse duration of 280 ns was carefully chosen to meet the Shannon criteria and avoid any corruption of the information within the signals [30]. All experiments were performed on a Windows 11 platform with an AMD 5900X CPU.
In order to evaluate the robustness and efficiency of the HQC-SCM method, four traditional and two state-of-the-art discrimination methods were utilized to compare with the HQC-SCM, including falling edge percentage slope (FEPS) [31,32], zero-crossing (ZC) [12,13], charge comparison (CC) [33], frequency gradient analysis (FGA) [15], pulse-coupled neural network (PCNN) [19], and ladder gradient methods [21]. The parameters of these discrimination methods are set at optimized values presented in [21]. The parameters of HQC-SCM are determined by the GA-based parameter selection strategy, from which the best solution in iteration one is used as the optimal parameters. In the following experiments, all methods but ZC process raw radiation pulse signals directly. The Fourier filter is utilized to denoise the n- PSs for the ZC method because this method cannot discriminate noisy signals.
4.2. PSD Performance of HQC-SCM
The present study investigated the discrimination performance of various methods on plastic scintillators’ n- PSs. The histograms of discrimination factors for each method are shown in Figure 6. Among the traditional methods, FEPS and FGA showed the poorest discrimination performance, with of 0.80 and 0.95, respectively. As indicated by the histograms in Figure 6a,b, these methods failed to separate neutron and gamma-ray groups, resulting in hundreds of n- PSs that could not be categorized as either neutron or gamma-ray. The ZC method’s value was 1.01, slightly better than that of FEPS and FGA, as shown in Figure 6c. However, the ZC method’s small number of bins resulted in a discrete distribution of its neutron and gamma-ray groups, posing difficulties in Gaussian fitting these groups.
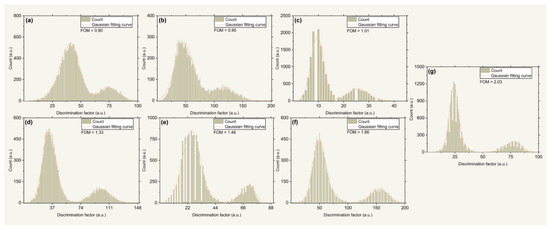
Figure 6.
Discrimination performance of (a) FEPS, (b) FGA, (c) ZC, (d) CC, (e) LG, (f) PCNN, and (g) HQC-SCM.
On the other hand, CC, one of the most commonly used traditional discrimination methods, exhibited much better performance than the previous methods, with a value of 1.33. The neutron and gamma-ray groups of CC were shown to exhibit undistorted Gaussian distributions and separated from each other with a low count between them (Figure 6d). Furthermore, two recently proposed discrimination algorithms, LG and PCNN, presented better performance than all the traditional methods. Their values were 1.48 and 1.66, respectively (Figure 6e and Figure 6f). These methods displayed small variances of their Gaussian distribution groups and a clear gap between neutron and gamma-ray groups.
Finally, the performance of HQC-SCM is presented in Figure 6g. Its neutron and gamma-ray groups showed accurate Gaussian distributions with low variances. A wide range with approximately zero counts existed between these two groups, making no pulse signal indeterminate. The value of HQC-SCM was 2.03, 52.6% higher than that of CC and 22.2% higher than that of PCNN. A over two typically means that no pulse signal would be misidentified due to the discrimination algorithm, as no overlapping pulse counts exist between two Gaussian probability distributions. This discrimination performance boost enables plastic scintillators’ n- PSs discrimination ability to compete with that of liquid and crystal scintillators.
In conclusion, the feature extraction ability of PCNN-derived models enables HQC-SCM significantly outperforms traditional PSD algorithms. Meanwhile, specific neural responses for different features allow HQC-SCM to show superior performance to PCNN.
4.3. Anti-Noise Performance of HQC-SCM
All electronic systems are influenced by random noise, and radiation detection systems make no exception. To evaluate the anti-noise capabilities of HQC-SCM, experiments were conducted under different noise levels. These experiments involved adding random noise, following Gaussian distributions with variances ranging from 0.01 to 0.025, to raw radiation pulse signals. Discrimination processes were independently performed one hundred times for each discrimination method under each noise level to obtain the average performance of each method under different noise conditions. Figure 7 presents the and failure count of discrimination methods. The failure count refers to the number of times a discrimination method fails to generate a histogram that can be fitted by Gaussian distribution. If a method’s failure count exceeds 10 under a noise level, it is considered unreliable in that noise condition. The discrimination results of HQC-SCM were compared with other methods in the field.
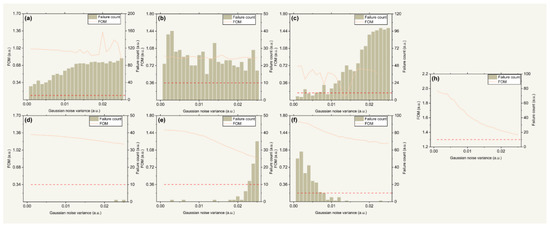
Figure 7.
Noise resistance performance of (a) ZC, (b) FGA, (c) FEPS, (d) CC, (e) LG, (f) PCNN, and (h) HQC-SCM. The left side Y-axis denotes the value, and the right side Y-axis denotes the failure count.
As depicted in Figure 7a, the ZC method exhibits the poorest discrimination performance when raw n- PSs are contaminated by random noise. This method is highly sensitive to noise, and it cannot properly function without preprocessing by de-noise filters. Consequently, when extra random noise is added to the raw signals, ZC fails to generate usable histograms under all noise levels. Similar performance can be observed in the FGA method, as shown in Figure 7b. Although its failure counts are generally smaller than that of ZC, they exceed 10 in all noise conditions. Furthermore, the anti-noise performance of FEPS is also poor, as presented in Figure 7c. Its failure count is below 10 at the beginning, but it quickly exceeds 10 and surges to almost a hundred as the noise level goes from 0.01 to 0.025. Therefore, ZC, FGA, and FEPS methods are not suitable for high noise conditions. In industrial and scientific applications, de-noise filters are required for these methods to achieve reliable discrimination performance.
On the other hand, CC exhibits impressive performance under all noise conditions, with slowly decreasing from approximately 1.35–1.2 and no failure counts until the last two noise levels, presented in Figure 7d. Moreover, LG generally outperforms CC when the external noise level is not too high, as shown in Figure 7e. Its first stabilizes at 1.45 and begins to drop when the noise level exceeds 0.01. It finally ends at roughly 1.1 of and has unreliable discrimination performance in the last three noise conditions. This behavior of LG comes from its noise-resistant characteristics of QC-SCM and low feature summarization ability of ladder gradient calculation. The former makes LG immune from noise’s impact to a certain level, and the latter leads to the decrease and, finally, unreliable discrimination when external noise gets too high.
Subsequently, PCNN shows abnormal performance compared to the aforementioned methods, as presented in Figure 7f. Its failure count exceeds 10 at several low noise levels while remaining around zero when external noise is high. This phenomenon arises from the parameter settings of PCNN. The current parameters were selected to process signals with high random noise. Unlike HQC-SCM, PCNN has only one set of parameters that determine a unique neural response. This neural response cannot cope with low noise conditions when it is tuned for high noise scenarios. The of PCNN is around 1.4 at most noise levels, which is much better than traditional methods and LG.
Finally, HQC-SCM came out with outstanding discrimination performance, as shown in Figure 7h. It displays no failure count at any noise levels, and its value ranges from approximately 2.0–1.4 throughout all noise conditions. This exceptional performance is due to the heterogeneous structures and automatic parameter selection strategy utilized by HQC-SCM. The heterogeneous neural response allows HQC-SCM to fully utilize the features in the falling edge and delayed fluorescence parts. Meanwhile, the GA-based parameter determination enables HQC-SCM to adapt its parameters to various noise conditions and perform well even in the presence of exceptionally high noise.
5. Conclusions
In this study, the HQC-SCM method was proposed for neutron and gamma-ray pulse shape discrimination. The method utilizes specific neural responses for different features inside radiation pulse signals, fully extracting features present in the falling edge and delayed fluorescence parts. Subsequently, the contributions of HQC-SCM’s parameters to its discrimination performance were studied to find an automatic parameter selection strategy for HQC-SCM. Since the HQC-SCM is a chaotic system that cannot be optimized by traditional algorithms like gradient descent, a GA-based parameter optimization method was proposed. Experiments were conducted to evaluate the performance of this optimization method in finding the local optima of HQC-SCM’s parameter solutions. It was found that GA can optimize solutions in a way closer to stochastic searching, which is suitable for local optima searching of a chaotic system like HQC-SCM. This GA-based optimization method is efficient and robust, locating local optima in just a few iterations of evolution.
Additionally, this study conducted experiments to evaluate the performance of the HQC-SCM method in discriminating n- PSs from a superposed field of neutrons and gamma-ray photons generated by a 241Am-Be isotope neutron source. Experimental results show that the HQC-SCM method outperformed traditional and state-of-the-art PSD algorithms such as FEPS, FGA, ZC, CC, LG, and PCNN. The value of HQC-SCM was 2.03, 52.6% higher than that of CC and 22.2% higher than that of PCNN. The performance boost provided by HQC-SCM enables plastic scintillators’ n- pulse shape discrimination ability to compete with that of liquid and crystal scintillators. Moreover, the authors evaluate the anti-noise capability of HQC-SCM, and the results show that it outperforms other methods when dealing with noisy radiation pulse signals. Therefore, the HQC-SCM method is an effective and robust approach for discriminating neutron and gamma-ray signals. It can be applied in radiation detection systems for various fields, such as nuclear power plants, environmental monitoring, and medical radiation imaging.
In future studies, the HQC-SCM method will be implemented on a computation unit with analog circuits to achieve real-time discrimination performance. This analog chips-based HQC-SCM PSD method will be further integrated into radiation detection systems to meet industrial and scientific fields’ advanced neutron detection requirements.
Author Contributions
Study conception and design were performed by R.L., H.L., B.Y. and B.G.; Material preparation, data collection and analysis were performed by R.L., H.L., Z.Y. and S.L. The first draft of the manuscript was written by H.L. All authors have read and agreed to the published version of the manuscript.
Funding
This research received no external funding.
Data Availability Statement
The data presented in this study are openly available in Zenodo at [10.5281/zenodo.7754572 accessed on 1 March 2023], reference number [34].
Acknowledgments
The authors thank Peng Li from the Engineering & Technical College of Chengdu University of Technology for valuable discussions and technical support.
Conflicts of Interest
The authors declare no conflict of interest.
References
- Dymova, M.A.; Taskaev, S.Y.; Richter, V.A.; Kuligina, E.V. Boron neutron capture therapy: Current status and future perspectives. Cancer Commun. 2020, 40, 406–421. [Google Scholar] [CrossRef] [PubMed]
- Abel, C.; Afach, S.; Ayres, N.J.; Baker, C.A.; Ban, G.; Bison, G.; Bodek, K.; Bondar, V.; Burghoff, M.; Chanel, E.; et al. Measurement of the Permanent Electric Dipole Moment of the Neutron. Phys. Rev. Lett. 2020, 124, 081803. [Google Scholar] [CrossRef] [PubMed]
- Potekhin, A.Y.; Zyuzin, D.A.; Yakovlev, D.G.; Beznogov, M.V.; Shibanov, Y.A. Thermal luminosities of cooling neutron stars. Mon. Not. R. Astron. Soc. 2020, 496, 5052–5071. [Google Scholar] [CrossRef]
- Burgio, G.F.; Schulze, H.J.; Vidaña, I.; Wei, J.B. Neutron stars and the nuclear equation of state. Prog. Part. Nucl. Phys. 2021, 120, 103879. [Google Scholar] [CrossRef]
- Yanchukovsky, V.; Kuz’menko, V. Method of automatic correction of neutron monitor data for precipitation in the form of snow in real time. Sol.-Terr. Phys. 2021, 7, 114–120. [Google Scholar] [CrossRef]
- Galashev, A.Y. Processing of fast neutron reactor fuel by electrorefining: Thematic overview. Int. J. Energy Res. 2021, 45, 11459–11478. [Google Scholar] [CrossRef]
- Corazza, C.; Rosseel, K.; Leysen, W.; Gladinez, K.; Marino, A.; Lim, J.; Aerts, A. Optical fibre void fraction detection for liquid metal fast neutron reactors. Exp. Therm. Fluid Sci. 2020, 113, 109865. [Google Scholar] [CrossRef]
- Verkhovniy, A.I.; Bondarenko, V.L.; Kutsko, A.G.; Tokarev, S.A.; Chirkov, A.Y.; Kupriyanov, M.Y.; Ustyugova, T.G. Sources for Helium-3 Isotope Extraction and Prospects of its Development. Chem. Pet. Eng. 2022, 57, 940–951. [Google Scholar] [CrossRef]
- Kouzes, R.T.; Ely, J.H.; Erikson, L.E.; Kernan, W.J.; Lintereur, A.T.; Siciliano, E.R.; Stephens, D.L.; Stromswold, D.C.; Van Ginhoven, R.M.; Woodring, M.L. Neutron detection alternatives to 3He for national security applications. Nucl. Instrum. Methods Phys. Res. Sect. A Accel. Spectrometers Detect. Assoc. Equip. 2010, 623, 1035–1045. [Google Scholar] [CrossRef]
- Roush, M.L.; Wilson, M.A.; Hornyak, W.F. Pulse shape discrimination. Nucl. Instrum. Methods 1964, 31, 112–124. [Google Scholar] [CrossRef]
- Zuo, Z.; Liu, H.; Yan, Y.; Liu, B.; Zhang, S. Adaptability of n–γ discrimination and filtering methods based on plastic scintillation. Nucl. Sci. Tech. 2021, 32, 28. [Google Scholar] [CrossRef]
- Sperr, P.; Spieler, H.; Maier, M.R.; Evers, D. A simple pulse-shape discrimination circuit. Nucl. Instrum. Methods 1974, 116, 55–59. [Google Scholar] [CrossRef]
- Pai, S.; Piel, W.F.; Fossan, D.B.; Maier, M.R. A versatile electronic pulse-shape discriminator. Nucl. Instrum. Methods Phys. Res. Sect. A Accel. Spectrometers Detect. Assoc. Equip. 1989, 278, 749–754. [Google Scholar] [CrossRef]
- Wolski, D.; Moszyński, M.; Ludziejewski, T.; Johnson, A.; Klamra, W.; Skeppstedt, Ö. Comparison of n-γ discrimination by zero-crossing and digital charge comparison methods. Nucl. Instrum. Methods Phys. Res. Sect. A Accel. Spectrometers Detect. Assoc. Equip. 1995, 360, 584–592. [Google Scholar] [CrossRef]
- Liu, G.; Joyce, M.J.; Ma, X.; Aspinall, M.D. A Digital Method for the Discrimination of Neutrons and γ Rays With Organic Scintillation Detectors Using Frequency Gradient Analysis. IEEE Trans. Nucl. Sci. 2010, 57, 1682–1691. [Google Scholar] [CrossRef]
- Hammad, M.E.; Kasban, H.; Fikry, R.M.; Dessouky, M.I.; Zahran, O.; Elaraby, S.M.S.; El-Samie, F.E.A. Digital pulse processing algorithm for neutron and gamma rays discrimination. Analog. Integr. Circuits Signal Process. 2019, 101, 475–487. [Google Scholar] [CrossRef]
- Arahmane, H.; Mahmoudi, A.; Hamzaoui, E.M.; Ben Maissa, Y.; Cherkaoui El Moursli, R. Neutron-gamma discrimination based on support vector machine combined to nonnegative matrix factorization and continuous wavelet transform. Measurement 2020, 149, 106958. [Google Scholar] [CrossRef]
- Liu, M.; Liu, B.; Zuo, Z.; Wang, L.; Zan, G.; Tuo, X. Toward a fractal spectrum approach for neutron and gamma pulse shape discrimination. Chin. Phys. C 2016, 40, 066201. [Google Scholar] [CrossRef]
- Liu, H.; Cheng, Y.; Zuo, Z.; Sun, T.; Wang, K. Discrimination of neutrons and gamma rays in plastic scintillator based on pulse-coupled neural network. Nucl. Sci. Tech. 2021, 32, 82. [Google Scholar] [CrossRef]
- Liu, H.; Zuo, Z.; Li, P.; Liu, B.; Chang, L.; Yan, Y. Anti-noise performance of the pulse coupled neural network applied in discrimination of neutron and gamma-ray. Nucl. Sci. Tech. 2022, 33, 75. [Google Scholar] [CrossRef]
- Liu, H.; Liu, M.; Xiao, Y.; Li, P.; Zuo, Z.; Zhan, Y. Discrimination of neutron and gamma ray using the ladder gradient method and analysis of filter adaptability. Nucl. Sci. Tech. 2022, 33, 159. [Google Scholar] [CrossRef]
- Johnson, J.L. Pulse-coupled neural nets: Translation, rotation, scale, distortion, and intensity signal invariance for images. Appl. Opt. 1994, 33, 6239–6253. [Google Scholar] [CrossRef] [PubMed]
- Eckhorn, R.; Reitboeck, H.J.; Arndt, M.; Dicke, P. Feature Linking via Synchronization among Distributed Assemblies: Simulations of Results from Cat Visual Cortex. Neural Comput. 1990, 2, 293–307. [Google Scholar] [CrossRef]
- Silver, D.; Schrittwieser, J.; Simonyan, K.; Antonoglou, I.; Huang, A.; Guez, A.; Hubert, T.; Baker, L.; Lai, M.; Bolton, A.; et al. Mastering the game of Go without human knowledge. Nature 2017, 550, 354–359. [Google Scholar] [CrossRef]
- Liu, H.; Liu, M.; Li, D.; Zheng, W.; Yin, L.; Wang, R. Recent Advances in Pulse-Coupled Neural Networks with Applications in Image Processing. Electronics 2022, 11, 3264. [Google Scholar] [CrossRef]
- De Jong, K. Learning with genetic algorithms: An overview. Mach. Learn. 1988, 3, 121–138. [Google Scholar] [CrossRef]
- Mirjalili, S. Genetic Algorithm. In Evolutionary Algorithms and Neural Networks: Theory and Applications; Mirjalili, S., Ed.; Springer International Publishing: Cham, Switzerland, 2019; pp. 43–55. [Google Scholar]
- Winyard, R.A.; Lutkin, J.E.; McBeth, G.W. Pulse shape discrimination in inorganic and organic scintillators. I. Nucl. Instrum. Methods 1971, 95, 141–153. [Google Scholar] [CrossRef]
- Davies, D.L.; Bouldin, D.W. A Cluster Separation Measure. IEEE Trans. Pattern Anal. Mach. Intell. 1979, PAMI-1, 224–227. [Google Scholar] [CrossRef]
- Iwanowska-Hanke, J.; Moszynski, M.; Swiderski, L.; Sibczynski, P.; Szczesniak, T.; Krakowski, T.; Schotanus, P. Comparative study of large samples (2″ × 2″) plastic scintillators and EJ309 liquid with pulse shape discrimination (PSD) capabilities. J. Instrum. 2014, 9, P06014. [Google Scholar] [CrossRef]
- Zuo, Z.; Xiao, Y.; Liu, Z.; Liu, B.; Yan, Y. Discrimination of neutrons and gamma-rays in plastic scintillator based on falling-edge percentage slope method. Nucl. Instrum. Methods Phys. Res. Sect. A Accel. Spectrometers Detect. Assoc. Equip. 2021, 1010, 165483. [Google Scholar] [CrossRef]
- Lotfi, Y.; Moussavi-Zarandi, S.A.; Ghal-Eh, N.; Bayat, E. Optimization of pulse processing parameters for digital neutron-gamma discrimination. Radiat. Phys. Chem. 2019, 164, 108346. [Google Scholar] [CrossRef]
- Hawkes, N.P.; Gamage, K.A.A.; Taylor, G.C. Digital approaches to field neutron spectrometry. Radiat. Meas. 2010, 45, 1305–1308. [Google Scholar] [CrossRef]
- Liu, R.; Li, P.; Liu, H. Dataset for Neutron and Gamma-Ray Pulse Shape Discrimination: Radiation Pulse Signals and Discrimination Methodologies [Data Set]; Zenodo: Prévessin-Moëns, France, 2023. [Google Scholar] [CrossRef]


Disclaimer/Publisher’s Note: The statements, opinions and data contained in all publications are solely those of the individual author(s) and contributor(s) and not of MDPI and/or the editor(s). MDPI and/or the editor(s) disclaim responsibility for any injury to people or property resulting from any ideas, methods, instructions or products referred to in the content. |
© 2023 by the authors. Licensee MDPI, Basel, Switzerland. This article is an open access article distributed under the terms and conditions of the Creative Commons Attribution (CC BY) license (https://creativecommons.org/licenses/by/4.0/).