Article

Analysis and Suppression of High-Frequency Resonance for Offshore Wind Power Grid-Connected Converter Considering Cable Capacitance Effect

1
State Key Laboratory of Operation and Control of Renewable Energy & Storage Systems, China Electric Power Research Institute, Beijing 100192, China
2
School of Electronic Information and Electrical Engineering, Shanghai Jiao Tong University, Shanghai 200240, China
*
Author to whom correspondence should be addressed.
Electronics 2023, 12(12), 2638; https://doi.org/10.3390/electronics12122638
Submission received: 12 May 2023 / Revised: 5 June 2023 / Accepted: 8 June 2023 / Published: 12 June 2023

Abstract

:
Large-scale offshore wind farms have become the development trend in wind power generation. Long submarine cables are used to collect electrical energy in the collection networks of offshore wind farms. However, the distributed capacitance of cables cannot be ignored, which makes the impedance of the collection network complex and changeable. It is common to encounter high-frequency harmonic resonance (HFHR) problems when cables interact with wind turbine generators (WTGs). The HFHR may threaten the safe and stable operation of wind turbines. In order to solve this problem, firstly, the impedance of a collection network was constructed. Furthermore, the wind farm collection network was divided into the equivalent wind turbine subsystem (EWTS) and the remaining equivalent wind farm subsystem (REWFS). Then, the mechanism of HFHR was revealed based on the impedance stability analysis method. The effects of cable parameters, the number of connected WTG, and the grid impedance on the HFHR of the interconnected system were also analyzed. Finally, the hybrid damping control method, combining active damping control (ADC) and passive damping control (PDC), was proposed to suppress the resonance. A simulation and experiment were performed to verify the effectiveness of the analysis results and proposed control method.

1. Introduction

In recent years, offshore wind power has developed rapidly. The wind turbine generators (WTGs) of offshore wind farms are always connected through submarine cables, and the power of the wind farm is transmitted to the grid through long-distance submarine cables in either high-voltage DC or high-voltage AC. As the distributed capacitance of cable line cannot be ignored [1], the risk of the high-frequency resonance (HFR) problem increases, which seriously threatens the safe and stable operation of wind farms [2]. The grid-connected current of the wind turbine inevitably contains low-order harmonics and high-order harmonics. When the frequency of the harmonic current is consistent with the resonant frequency of the wind farm, it often causes harmonic oscillation problems.
The impedance interaction between a DFIG-based wind farm and long cables is inevitable, which may produce HFR in the wind farm [3]. Reference [4] also points out that, in the case of long-distance cable transmission, high-frequency resonance occurs, creating the relationship between the resonance peak and system control parameters. In reference [5], it is pointed out that the interaction between the offshore wind farm and the converter causes harmonic resonance in interconnected submarine cables.
The above studies focus on the high-frequency resonance caused by the interaction between the wind farm and the power grid; however, they do not involve the high-frequency resonance inside the wind farm collection network. The impact of low-frequency resonance in the voltage stability of offshore HVDC converters is analyzed and discussed in reference [6]; an impedance-based representation was used to identify the resonances. In reference [7], the distribution of the wideband resonance bands is disclosed, their classifications are discussed, and the coordinated damping method is proposed to damp these wideband resonances. Reference [8] studies the interaction of the internal impedance of a large-scale distributed generation system, analyzes the distribution law of the resonance band, and expounds the generation mechanism of harmonic oscillation in a wide frequency range. Reference [9] points out that there is high-frequency oscillation caused by energy interaction in the internal collector system of the wind farm, resulting in serious overvoltage and equipment insulation damage, but the capacitance effect of the cable was not considered in their analysis of high-frequency resonance. Reference [10] discusses the influence of the grid-side converter control of offshore wind turbine units on the internal harmonic resonance of a wind farm. It is necessary to further determine the relationship between the number of WTGs, cable length, and harmonic resonance.
At present, there are three main methods to study harmonic resonance characteristics: the eigenvalue analysis method based on state variables [11], the frequency domain analysis method based on the impedance model [12], the and mode resonance method [13,14]. The eigenvalue analysis method based on state variables needs to model all the physical and control dynamic models used in the system [15]. However, the wind farm system has too many state variables, the order of establishing the model is very high, and the amount of calculation is complex, so it is not suitable for the analysis of complex systems. The frequency domain analysis method based on the impedance model divides the system into two equivalent impedances: source and network. A Nyquist criterion is used to analyze the stability of the interconnected system in the complex plane. It is convenient and easy to expand for complex system modeling. It is widely used to analyze the harmonic oscillation problem in new energy access to the power grid. The mode resonance method can quantitatively evaluate the internal harmonic propagation and resonance amplification of the studied system [16,17]. Effectively analyzing the sensitive parameters of the system reveals the participation of the different influence regions and different network parameters of harmonic resonance. However, the derived system harmonic admittance matrix is limited by the topology of the studied system. In reference [18], the offshore wind farm is divided into the equivalent wind turbine subsystem and the remaining equivalent wind farm subsystem; then, the impedance model is built to analyze the resonance frequency; however, the damping method is not discussed. The variation in the cable resistance may occur in practical situations due to temperature changes and insulation conditions which can help suppress the amplitude of the HFR [19]. A medium-voltage (MV) LC-filtered active damper is proposed and applied on buses with the largest participation factors, and the active dampers are controlled to adaptively damp resonances at up to several kHz by emulating virtual resistances at detected resonance frequencies [20]. For the DFIG-based offshore wind farm with a VSC-HVDC system, the resonances are mainly determined by array cables and cable-connected grid components, while the equivalent impedance of the HVDC converter including its filters and coupling transformer does not contribute much to the dominating resonances [21]. The passive harmonic filter can effectively reduce the overall impedance of the offshore wind farm system which has a high filtering rate and filtering efficiency and can achieve a good filtering effect [22].
In this paper, the frequency domain analysis method based on the impedance model is built to study the high-frequency resonance of the wind farm collector grid. This paper is organized as follows. Firstly, the impedance model of a wind turbine and cable line is established, the impedance network of the power grid is constructed, and the mechanism of high-frequency resonance is analyzed. Then, the variation law of high-frequency resonance frequency of the power grid of the wind farm with cable parameters, the number of chain circuits in the field, the number of wind turbine units, and the power grid impedance are studied, and the risk of high-frequency resonance in the power grid of the wind farm is evaluated. In the next section, a hybrid damping control method, combining active damping control (ADC) and passive damping control (PDC), is proposed to suppress the resonance. Finally, the correctness of the theoretical analysis and proposed method are verified using hardware in the loop (HIL) based on RT-LAB. The overall conclusion can be summarized in the following:
(1)
A precise port impedance model of a wind power converter and grid impedance, considering the capacitance of the cable line, was built to reveal the mechanism of high-frequency resonance using the impedance analysis method.
(2)
The law of high-frequency resonance of wind farms to line length, number of wind turbines, and grid impedance were analyzed considering the capacitance of collecting line cables; then, a simplified formula is presented which can be used to calculate and evaluate the high-frequency resonance of wind farms.
(3)
We designed a hybrid control strategy combining ADC and PDC to suppress the wideband harmonic resonance of wind turbines.
The following is the organization of this paper. Section 2 shows the method we used to build the impedance model of the wind farm network considering cable capacitance. Section 3 analyzes the high-frequency resonance mechanism of the wind farm collector grid. Section 4 presents the high-frequency resonance suppression method for the wind power grid-connected converter (GCC) that includes the passive damping and active damping methods. The experiment is described in Section 5 to indicate the effectiveness of the method. Finally, Section 6 presents the conclusion.

2. Impedance Model of Wind Farm Network Considering Cable Capacitance

The topology of the studied offshore wind farm is shown in Figure 1; it mainly includes a WTG, 35 kV centralized power grid, station step-up transformer, and 220 kV transmission submarine cable. The wind turbine is composed of a wind turbine, generator, converter, and generator end transformer. The converter adopts the traditional two-level topology, and the grid-side converter adopts an LC filter. The wind turbines are connected by 35 kV submarine cables to form several feeders, which are connected to the 35 kV convergence bus. After boosting, they are sent out for grid connection through 220 kV AC cables.

2.1. Impedance Model of Single Wind Turbine

The offshore wind turbine is connected to the 35 kV collector network through the generator end transformer. The generator end transformer is purely inductive. The LC filter of the grid-side converter and the generator end transformer can be equivalent to LCL filter. On the premise that the DC bus voltage remains constant, the generator-side converter can be simplified as a controlled power source [23,24], and only the impedance interaction between the grid-side converter and the power grid can be considered. It should be noted that the frequency band of high-frequency resonance studied in this paper is above the natural resonance frequency of the LCL filter of the wind power converter, and the control bandwidth of the voltage outer loop and power outer loop is generally lower than 100 Hz [25]. Therefore, this paper only considers the current inner loop and the phase-locked loop for the impedance modeling of GCC.
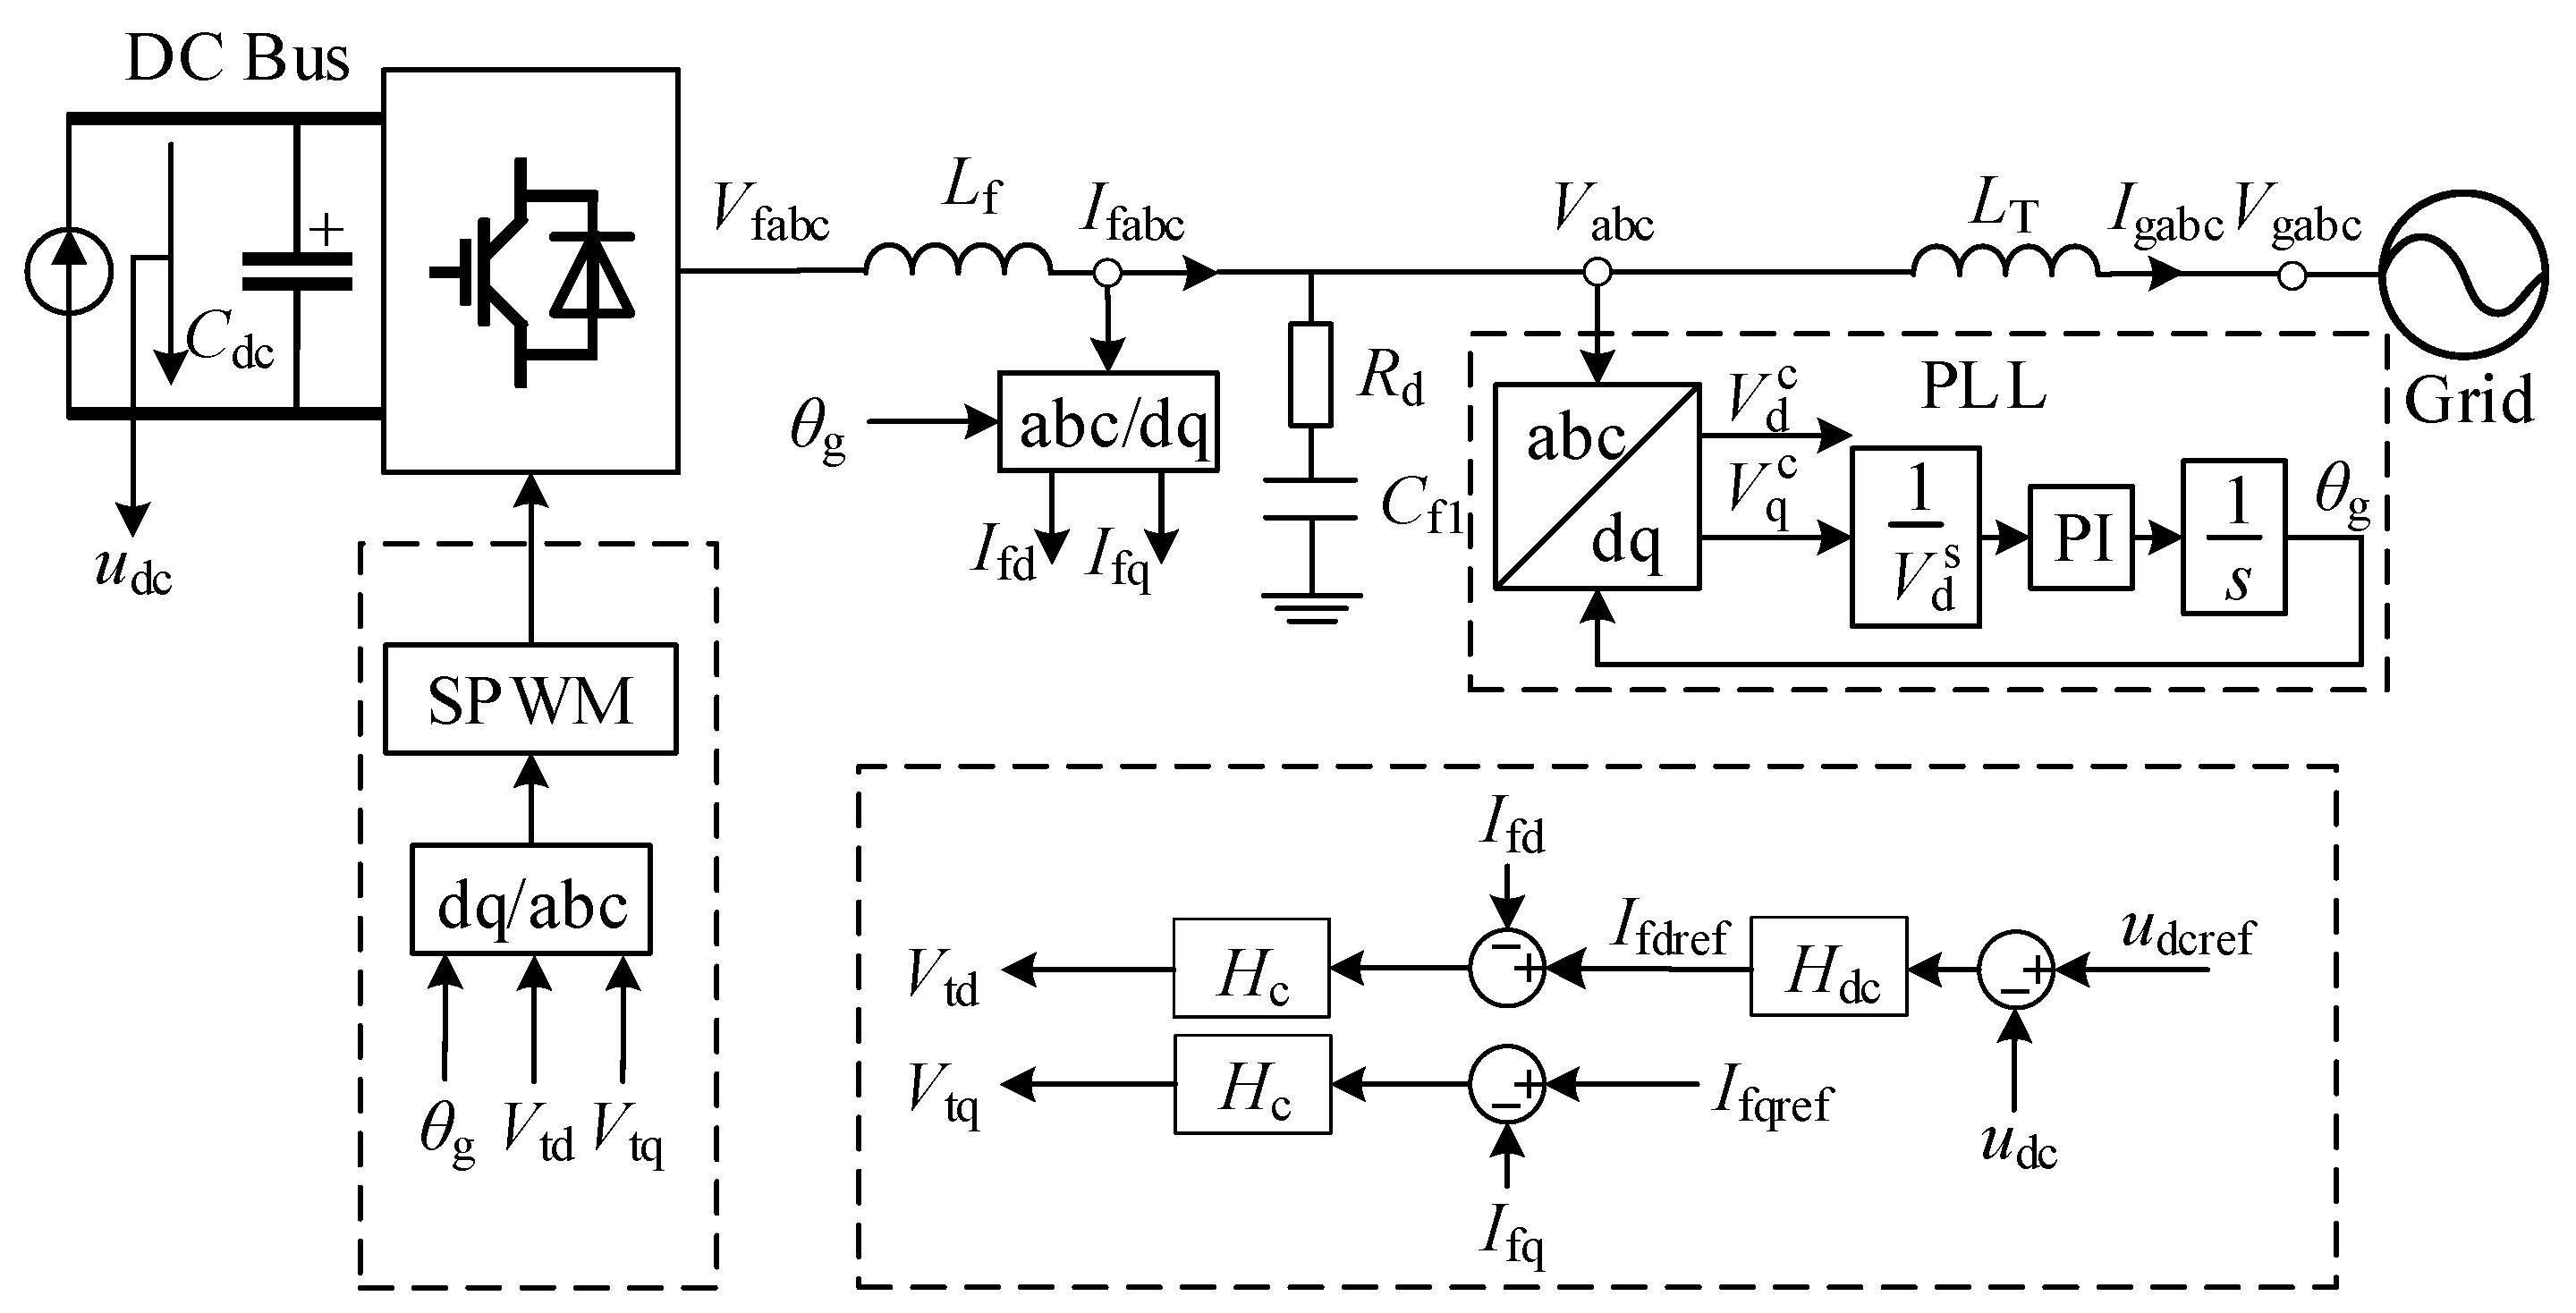
Figure 2 shows the typical control block diagram of GCC, in which Lf and Cf1 are the filter inductance and filter capacitor of the converter, respectively; Rd is the damping resistance; Vfabc and Ifabc are the output voltage and current of the converter, respectively; Vabc is the point of common coupling (PCC) voltage; Vgabc and Igabc are the port voltage and current of 690 V side, respectively; Cdc is the DC capacitance; udc is the DC bus voltage; and the subscript dq represents the variable in the dq coordinate system.
In Figure 2, phase lock loop (PLL) is used to obtain the phase information of the PCC voltage. When there is voltage disturbance in the PCC, two rotating coordinate systems appear in the system. One is called the system dq rotating coordinate, which is represented by superscript s. The other is called the controller dq rotation coordinate, which is represented by superscript c.
The relationship of the voltage or current physical signal in two coordinate systems is detailed in the following expression:
X d c X q c = cos Δ θ sin Δ θ sin Δ θ cos Δ θ X d s X q s
where X d s and X q s are the physical signals in the system dq rotating coordinate; X d c and X q c are the physical signals in the controller dq rotating coordinate; and ∆θ is the phase difference between the two coordinate systems.
The transfer function of PLL is detailed in the following expression [18]:
G pll = 1 V d s K ppll s + K ipll s 2 + K ppll s + K ipll
where V d s is the d-axis component of Vabc in the system dq rotating coordinate and Kppll and Kipll are the proportional and integral parameters of PLL, respectively.
The expression of phase difference between the two coordinate systems can be expressed as follows [18]:
Δ θ = G pll Δ v q s
where Δ v q s is the small-signal component of V q s and V q s is the q-axis component of Vabc in the system dq rotating coordinate. In the subsequent discussion, adding ‘Δ’ before the signal represents the small-signal physical quantity of the signal.
The transformation formula from the system dq rotating coordinate to the controller dq rotating coordinate for the small disturbance component Δx of any physical signal can be expressed as follows:
Δ x d c Δ x q c = [ Δ x d s Δ x q s ] + [ 0 X q s G pll 0 X d s G pll ] [ Δ v d s Δ v q s ]
Considering the time delay in the actual control system, the expression of the current loop can be obtained as follows:
v fd c v fq c = H d H c i fdref i fd c i fqref i fq c
where Hc is the transfer function of the PI regulator for the current loop; Hd is the transfer function of the delay loop; v fd c and v fq c are the d-axis and q-axis components of Vfabc in the controller dq rotating coordinate; i fd c and i fq c are the d-axis and q-axis components of Ifabc in the controller dq rotating coordinate; and i fdref and i fqref are the d-axis and q-axis reference components of Ifabc in the controller dq rotating coordinate.
The expression of Hc and Hdelay can be expressed as:
H c = K pi + K ii s H d = e s T d
where Kpi and Kii are the corresponding proportional and integral parameters and Td is the delay time constant.
We linearize Equation (5) and substitute into Equation (4) to obtain:
H d H c Δ i fdref Δ i fqref H d H c Δ i fd s Δ i fq s H d H c G I p l l Δ v d s Δ v q s = Δ v fd s Δ v fq s + G V p l l Δ v d s Δ v q s
where Δ i fd s and Δ i fq s are the d-axis and q-axis small-signal components of Ifabc in the system dq rotating coordinate; Δ v fd s and Δ v fq s are the d-axis and q-axis small-signal components of Vfabc in the system dq rotating coordinate; Δ i fdref is the small signal of i fdref ; and Δ i fqref is the small signal of i fqref .
In Equation (7), the matrices GIpll and GVpll can be expressed as:
G I p l l = 0 I q s G pll 0 I d s G pll , G V p l l = 0 V q s G pll 0 V d s G pll
where I d s and I q s are the d-axis and q-axis components of Iabc in the system dq rotating coordinate, respectively.
Considering that the current in Figure 2 flows into the power grid, the following expression can be obtained:
A Δ i gd s Δ i gq s = B Δ v gd s Δ v gq s
where Δ i gd s and Δ i gq s are the d-axis and q-axis small-signal components of Igabc in the system dq rotating coordinate, and Δ v gd s and Δ v gq s are the d-axis and q-axis small-signal components of Vgabc in the system dq rotating coordinate.
The detailed expressions of matrices A and B are:
A = H d H c I + Z d q f + ( I + H d H c G I p l l + G V p l l + H d H c Z d q c + Z d q f Z d q c ) Z d q T B = I + H d H c G I p l l + G V p l l + H d H c Z d q c + Z d q f Z d q c
where I stands for a 2 × 2 identity matrix.
The matrices Zdqf, ZdqT, and Zdqc can be expressed as:
Z d q f = s L f ω L f ω L f s L f , Z d q T = s L T ω L T ω L T s L T , Z d q c = s C f s R d C f + 1 ω C f ω R d C f + 1 ω C f ω R d C f + 1 s C f s R d C f + 1
Therefore, the analytical expression of the output impedance of WTG is:
Z d q = B 1 A
The output impedance of the WTG is a multi-input multi-output (MIMO) mathematical model in the dq coordinate system. It needs to be transformed into a single-input single-output (SISO) model in an abc coordinate system. According to reference [26], the MIMO impedance Zpn(s) in the abc coordinate system is:
Z p n ( s ) = Z pp ( s ) Z pn ( s ) Z np ( s ) Z nn ( s ) = 1 2 1 j 1 j Z d q ( s ) 1 1 j j
Further, the calculation formulas of the SISO positive-sequence impedance Zp(s) and negative-sequence impedance Zn(s) in the abc coordinate system can be obtained as follows:
Z p ( s ) = det [ Z p n ( s j ω ) ] Z nn ( s j ω ) Z n ( s ) = det [ Z p n ( s + j ω ) ] Z nn ( s + j ω )
Based on the parameters shown in Table 1, the simulation model of WTG was built in MATLAB/Simulink, and the positive sequence impedance of WTG was obtained using an impedance sweep analysis, which is shown in Figure 3.
In Figure 3, the blue curve represents the theoretical impedance and the red circle represents the measured impedance of WTG. It can be seen that the two impedance waves are highly consistent with each other, so Equation (14) can be used to characterize the impedance characteristics of WTG. It also can be seen from Figure 3 that the impedance of WTG is negative resistance inductance below 50 Hz. Between 50 Hz and 200 Hz, the impedance of the grid-side converter shows negative resistance capacitance characteristics. Between 200 Hz and 900 Hz, the impedance of the grid-side converter shows positive resistance capacitance characteristics. Above 900 Hz, the impedance of the grid-side converter is mainly positive resistance inductance. Among them, the impedance of the grid-side converter drops sharply at 900 Hz, and its value is 10−(30/20) = 0.0316. The main reason is that this is the natural resonant frequency of the converter LCL filter.

2.2. Impedance Model of Cable Line

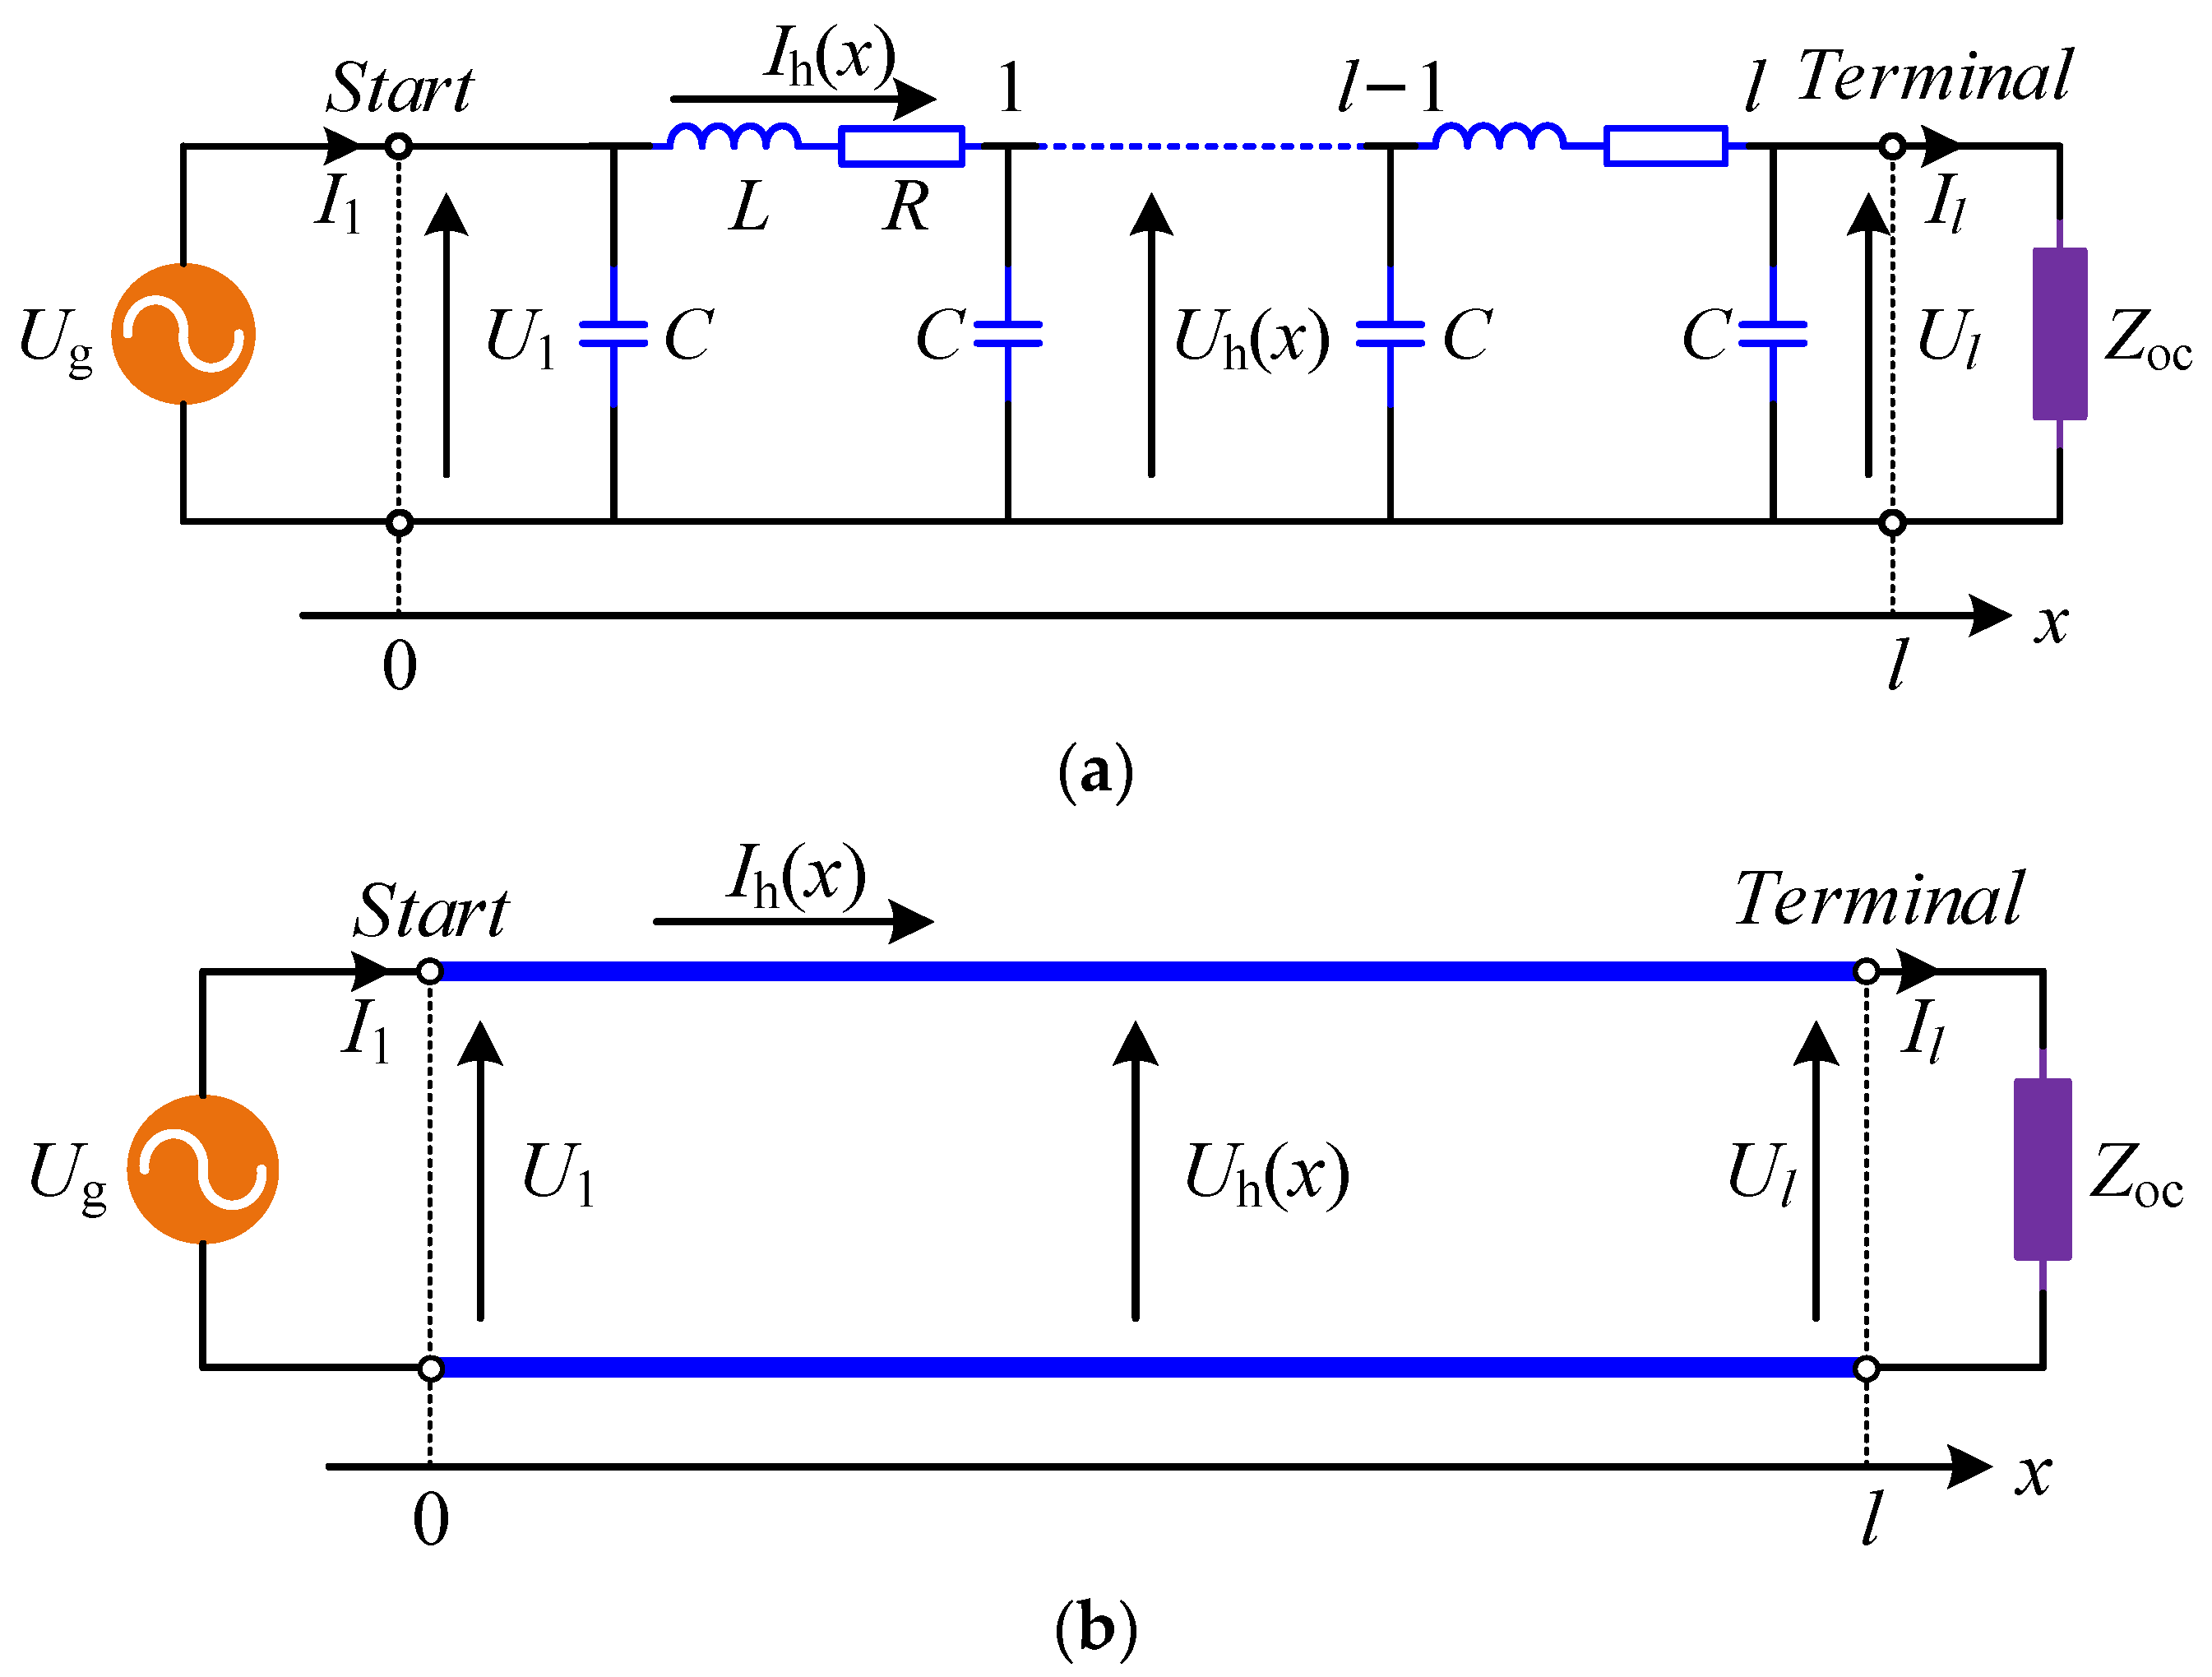
The model of the cable transmission line is shown in Figure 4, where l represents the length of the transmission line, Ug is the grid voltage source, and Uh(x) and Ih(x) are the voltage and current at a distance of xkm from the voltage source, respectively. Zoc is the load connected to the end of the transmission line. For wind power converter systems, the load can be understood as the converter, where Zoc is the output impedance of the GCC. The lumped parameter model shown in Figure 4a is commonly used for simulating and building experimental platforms; the distribution parameter model shown in Figure 4b is used for the impedance modeling and impedance analysis of the transmission line.
According to the theory of uniform transmission lines, the impedance of the transmission line can be obtained as:
Z cable = Z C tanh ( γ l )
where ZC is the characteristic impedance of the transmission line, γ is the propagation constant, and l is the length of the transmission line.
Considering lossless transmission lines, the expression of ZC and γ is:
Z C = R + j ω L j ω C γ = ( R + j ω L ) ( G + j ω C )
where R is the resistance of the transmission lines, L is the inductance of the transmission lines, G is the conductivity of the transmission lines, C is the capacitance of the transmission lines, and ω is the angular frequency.
Considering that the high-frequency resonance problem studied in this paper focuses on the 35 kV collector grid inside the wind farm, in order to simplify the problem to be studied, after ignoring the influence of the 220 kV cable impedance, the expression of the grid-side impedance model can be obtained as follows:
Z geq = ( s L g + s L GT ) / K 2 2
where Zgeq is the equivalent impedance of the power grid; Lg is the grid inductance; LGT is the equivalent inductance of the 220 kV/35 kV transformer; and K2 is the transformation ratio of the 220 kV/35 kV transformer.
By converting the impedance of the power grid, cables, and transformers to the grid connection port of the wind power converter, the expression of the impedance of the grid connection point of the wind power converter can be obtained as:
Z g = 1 K 1 2 s L TC + Z geq Z C + tanh ( γ l ) Z C 2 Z geq tanh ( γ l ) + Z C
where Zg is the equivalent impedance of the power grid for the converter; LTC is the equivalent impedance inductance of the 35 kV/0.69 kV transformer; and K1 is the transformation ratio of the 35 kV/0.69 kV transformer.
The accurate frequency domain modeling of the cable line is the basis for studying the high-frequency resonance of the wind farm collector grid. The cable model relying on frequency variation can reproduce the impedance characteristics of cable, but it consumes a lot of computing resources.
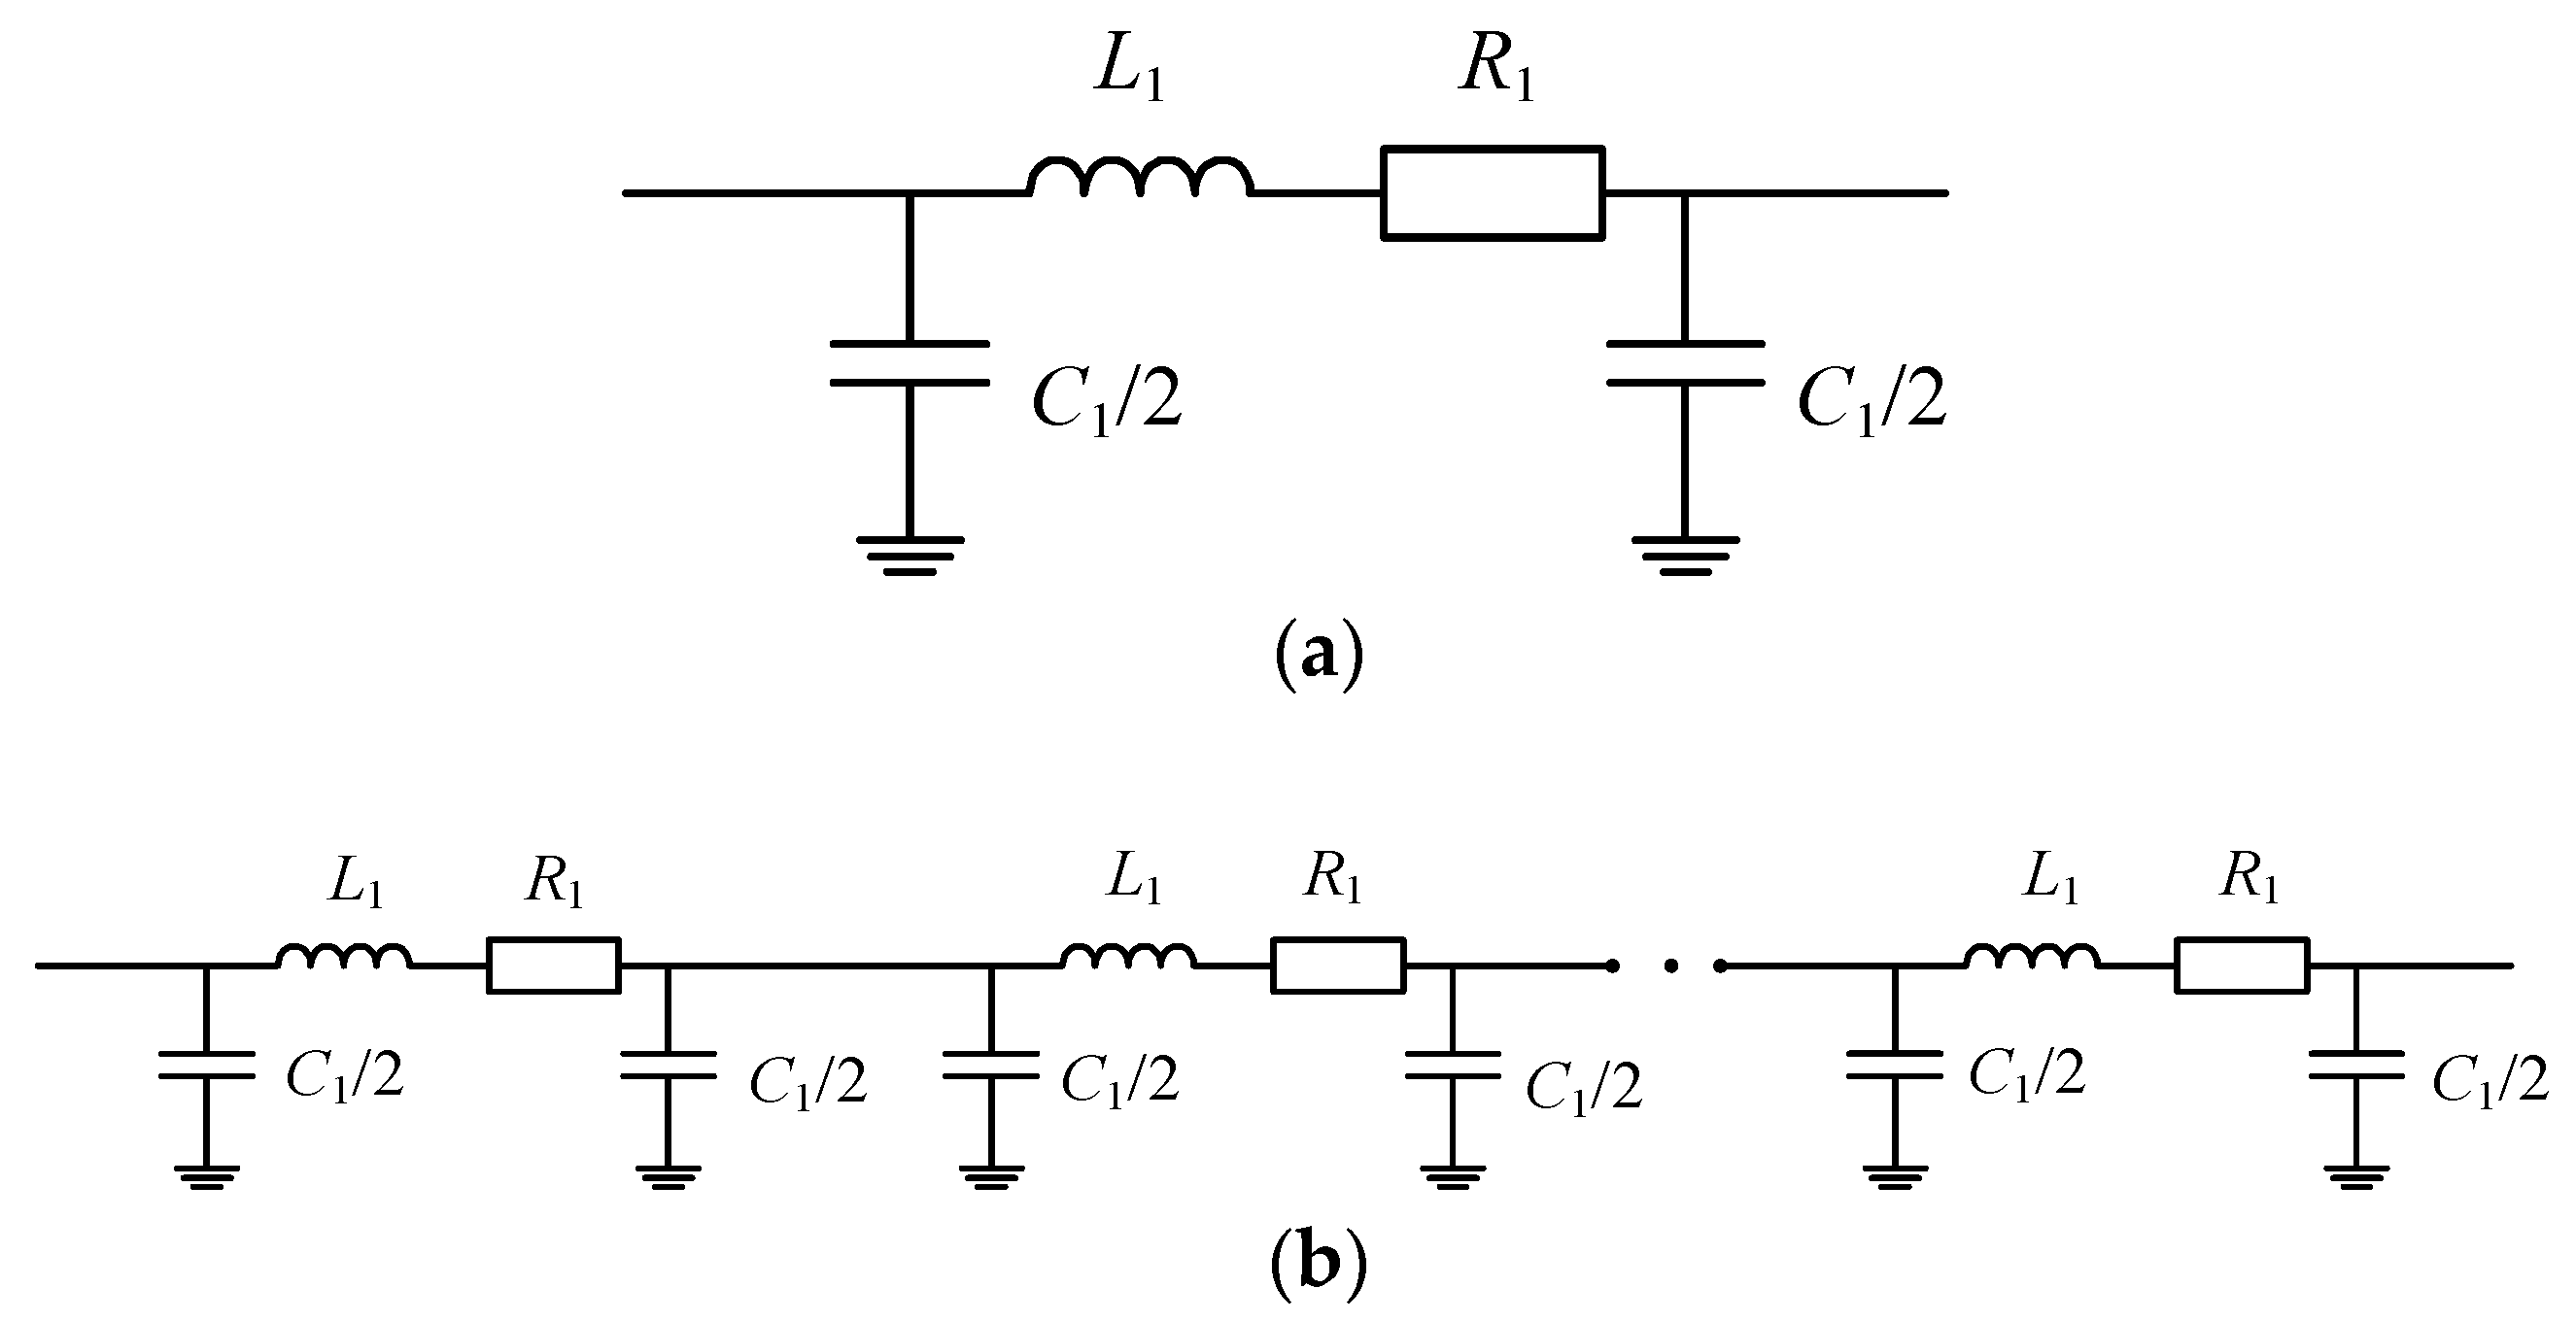
In this paper, multiple π-type equivalent circuits in series are used to simplify the modeling of the cable line. As shown in Figure 5a, a single π-type equivalent circuit is composed of series-connected resistance R1, inductance L1, and grounding capacitance C1.
The parameter calculation of the π-type equivalent circuit is shown as follows:
R 1 = l s i n g l e R 0 L 1 = l s i n g l e L 0 C 1 = l s i n g l e C 0
where R0, L0, and C0 are the resistance, inductance, and capacitance per unit length of cable line, respectively. lsingle is the length of a single π-type equivalent circuit.
In order to obtain the impedance of multiple π-type equivalent circuits in series, as shown in Figure 5b, first, it is necessary to calculate the equivalent impedance of a single π-type unit as:
Y unit _ 1 = 1 s L 1 + R 1 + s C 1 2 Z unit _ 1 = 1 Y unit _ 1
Further, the equivalent impedance with n π-type elements in series can be obtained as follows:
Y unit _ n = 1 s L 1 + R 1 + 1 Y unit _ n - 1 + s C 1 2 + s C 1 2 Z unit _ n = 1 Y unit _ n
Considering that the length of connecting cables between the WTGs of offshore wind farms is mostly within 10 km, we used 1 km, 2 km, 4 km, and 8 km as the lengths of a single π circuit to simulate an 8 km long submarine cable, and compared and analyzed the impedance with the accurate cable model [7]. The cable parameters are shown in Table 2.
As can be seen in Figure 6, the cable transmission line has a natural resonance frequency. Below the natural resonance frequency, the cable transmission line shows inductance characteristics; above the natural resonant frequency, the cable transmission line shows capacitive characteristics. In addition, with the increase in the number of π-type equivalent circuit units used, the accuracy requirements can be met when more than four π-type units are used. Therefore, in order to balance the contradiction between the complexity of the simulation calculation and the accuracy of the reflecting cable impedance characteristics, 1 km was selected as the length of a single π-type equivalent circuit unit for integer kilometers of submarine cable. For the submarine cable of non-integer kilometers, it can be regarded as composed of an integer multiple of 1 km submarine cable and a section of submarine cable less than 1 km, so as to accurately reflect the real characteristics of submarine cables.

2.3. Impedance Modeling of Wind Farm

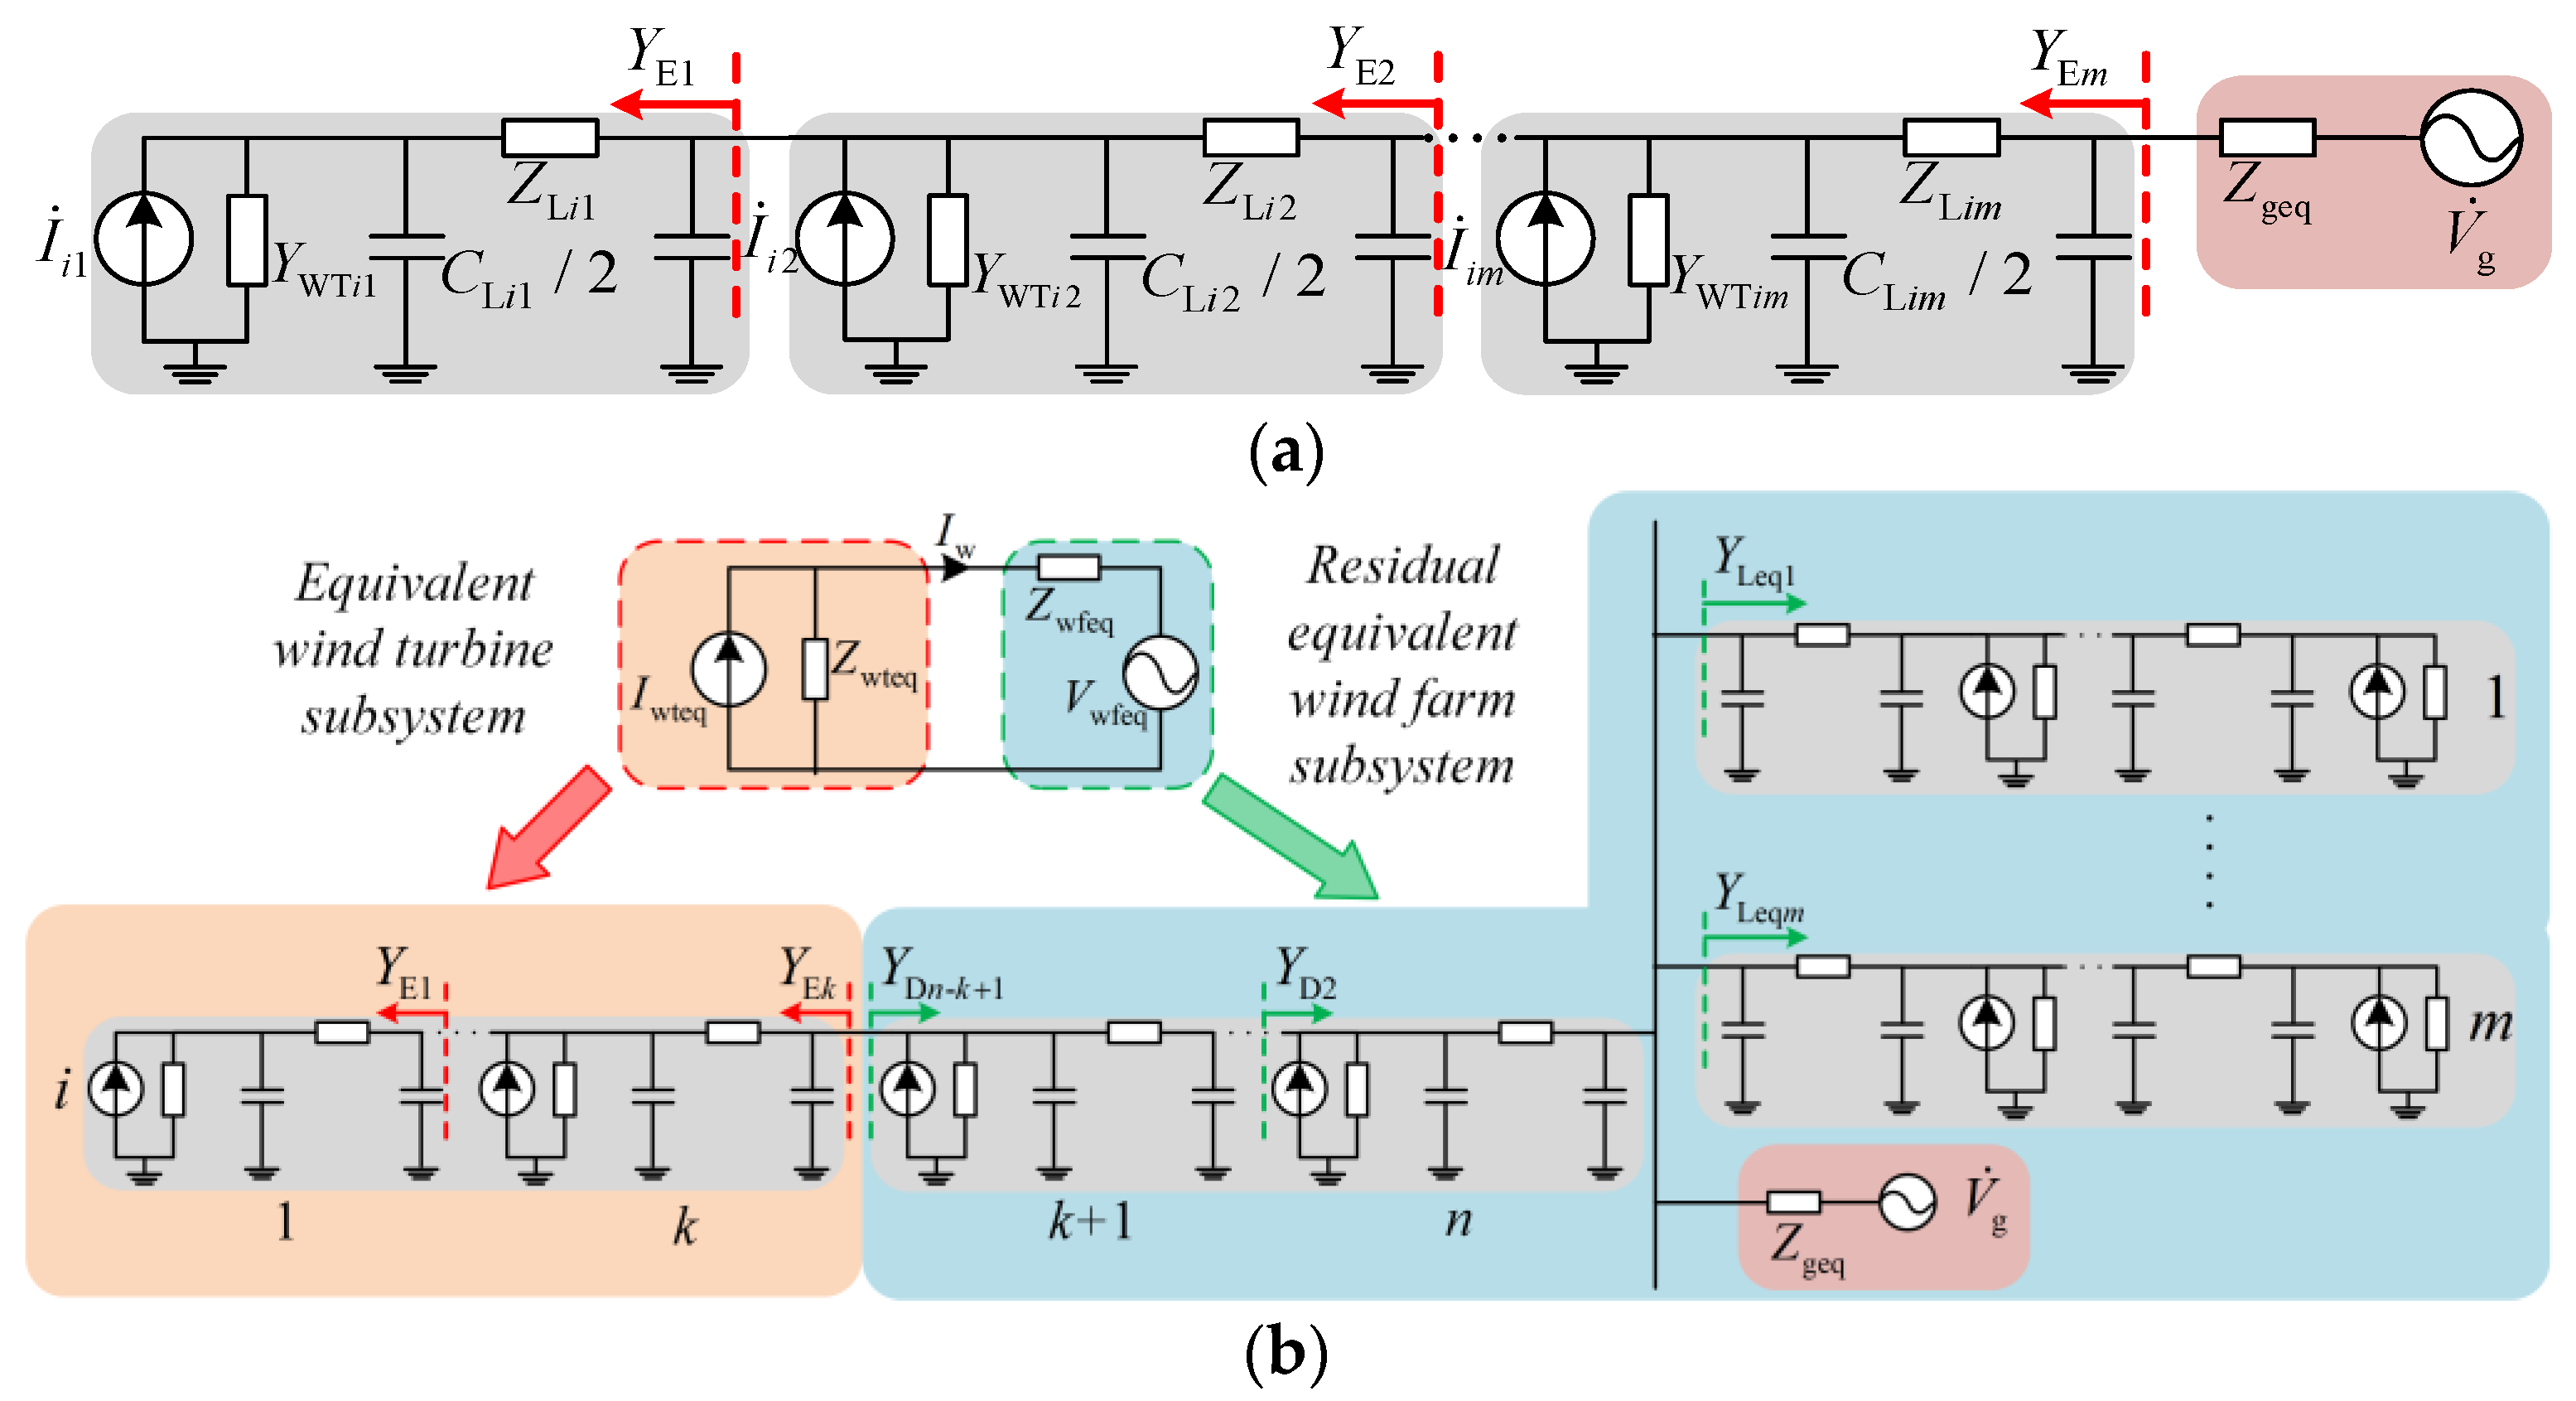
In order to study the impedance interaction of the wind farm collector grid, the small-signal equivalent circuit of a wind farm, according to the impedance stability theory [20], is shown in Figure 7. The equivalent modeling of the studied wind farm was divided into two subsystems, which are called equivalent wind turbine subsystem (EWTS) and remaining equivalent wind farm subsystem (REWFS). The action point of the interconnected system can be selected as any position of the wind farm. The equivalent wind turbine unit subsystem was modeled using a Norton equivalent circuit and represented by the controlled current source Iwteq and equivalent impedance Zwteq. The residual equivalent wind field subsystem was modeled using a Thevenin equivalent circuit. Uwfeq represents the controlled voltage source and Zwfeq represents the equivalent impedance. It should be stated that the impedance values in the following calculation formulas were converted to a 35 kV voltage level.

2.3.1. Equivalent Impedance of Single Feeder

Firstly, the equivalent impedance expression of a single feeder was derived. Figure 7a shows the equivalent impedance diagram of the i-th feeder. Converting the impedance of the wind turbine to a 35 kV voltage level, we obtain:
Y WT = 1 / ( K 1 2 Z p )
where YWT represents the output admittance of the wind turbine.
The equivalent admittance of a single feeder port including one WTG set was calculated by circuit theory, and the expression is:
Y E 1 = ( ( Y W T i 1 + s C L i 1 2 ) 1 + Z L i 1 ) 1 + s C L i 1 2
By analogy, it can be obtained that the equivalent admittance YEm of a single feeder port including m WTG is:
Y E m = [ ( Y E m - 1 + Y W T i m + s C L i m 2 ) 1 + Z L i m ] 1 + s C L i m 2
where YWTim represents the output admittance of the m-th WTG on the i-th feeder, and CLim and ZLim represent the capacitance and impedance of the π-type equivalent circuit of the m-th WTG on the i-th feeder.
Thus, the equivalent impedance of a single feeder can be obtained as:
Z Leq = 1 Y Leq = 1 Y E m
where ZLeq and YLeq represent the equivalent impedance and equivalent admittance of a single feeder, respectively.

2.3.2. Equivalent Impedance of Multiple Feeders

In order to analyze the high-frequency resonance problem at any position in the complex wind farm system, as shown in Figure 1, the wind farm was divided into an equivalent wind turbine group subsystem and a remaining equivalent wind farm subsystem by taking the k-th wind turbine of the i-th feeder as the dividing point, as shown in Figure 7b. Similarly, the calculation method of the residual equivalent wind field subsystem impedance can be obtained using the iterative method:
Y D 1 = Z geq 1 + Y Leq 1 + + Y Leq i 1 + Y Leq i + 1 + + Y Leq m Y D 2 = ( ( Y D 1 + s C L i n 2 ) 1 + Z L i n ) 1 + s C L i n 2 + Y WT i n Y D 3 = ( ( Y D 2 + s C L i n 1 2 ) 1 + Z L i n 1 ) 1 + s C L i n 1 2 + Y WT i n 1 Y D n - k + 1 = ( ( Y D n - k + s C L i k + 1 2 ) 1 + Z L i k + 1 ) 1 + s C L i k + 1 2 + Y WT i k + 1
where YLeqn represents the equivalent impedance of the n-th feeder and YDn represents the equivalent impedance of the remaining equivalent wind farm subsystem.
Based on the above, the equivalent impedance Zwfeq of the residual equivalent wind field subsystem can be obtained, which can be expressed as:
Z wfeq = 1 Y D n - k + 1
Similarly, the equivalent impedance Zwteq of the equivalent wind turbine unit subsystem can be obtained, which can be expressed as:
Z wteq = 1 Y Ek

3. Analysis of High-Frequency Resonance Mechanism of Wind Farm Collector Grid

3.1. Quantitative Analysis of High-Frequency Resonance

As shown in Figure 8, the resonance mechanism of the system can be revealed by analyzing the current frequency domain characteristics of the PCC points. According to the superposition theorem, the PCC point current is excited by the wind turbine equivalent current source and the grid voltage.
In Figure 8, the PCC point current under separate excitation of the stroke generator is:
I pccw = I inv G 1 ( s ) = I inv Z c 2 Z inv Z g Z c ( Z inv + Z c ) + ( Z g + Z c ) ( Z l Z c + Z l Z inv + Z c Z inv )
In Figure 8, the PCC point current under grid voltage excitation is:
I pccg = U s G 2 ( s ) = U s 2 Z c Z inv + Z c Z l + Z c 2 + Z l Z inv Z g Z c ( Z inv + Z c ) + ( Z g + Z c ) ( Z l Z c + Z l Z inv + Z c Z inv )
According to the superposition theorem, the current expression of the PCC point under the joint action of the wind turbine and the power grid is:
I pcc = I inv G 1 ( s ) U s G 2 ( s ) = Z c 2 Z inv I inv ( 2 Z c Z inv + Z c Z l + Z c 2 + Z l Z inv ) U s Z g Z c ( Z inv + Z c ) + ( Z g + Z c ) ( Z l Z c + Z l Z inv + Z c Z inv )
where Zinv = ωLinv, and Linv is the inductance of the converter.
According to Formula (31), the following conditions shall be met for the resonance of PCC point current:
(1)
The current excitation source Iinv contains a certain harmonic current, or the voltage excitation source contains a certain harmonic voltage;
(2)
Transfer functions G1(s) and G2(s) have large amplification gain, that is, the denominator of the transfer function is infinitely close to zero at a certain frequency, and the corresponding frequency is the resonant frequency of the system.
In order to produce a simple expression for the resonance frequency, it is assumed that the impedance of the converter Zinv = ωLinv and the grid impedance is Zg = ωLg. When N wind turbines are connected, the equivalent impedance is Zinv = ωLinv/N; the cable impedance can be expressed as Zl = ωL1 and Zc = 1/(jωC1) when the line resistance is ignored, so the characteristic equation of the system is:
C 1 2 L 1 L g L inv s 4 + ( N C 1 L 1 L g + C 1 L 1 L inv + 2 C 1 L g L inv ) s 2 + ( N L 1 + n L g + L inv ) = 0
By solving the above equation, the potential resonant frequency of the system is:
f res = 1 2 π ( L inv L l + N L l L g + 2 L inv L g ) 2 L inv L g L l C l ± L 1 2 ( L inv N L g ) 2 + 4 L inv 2 L g 2 2 L inv L g L l C l
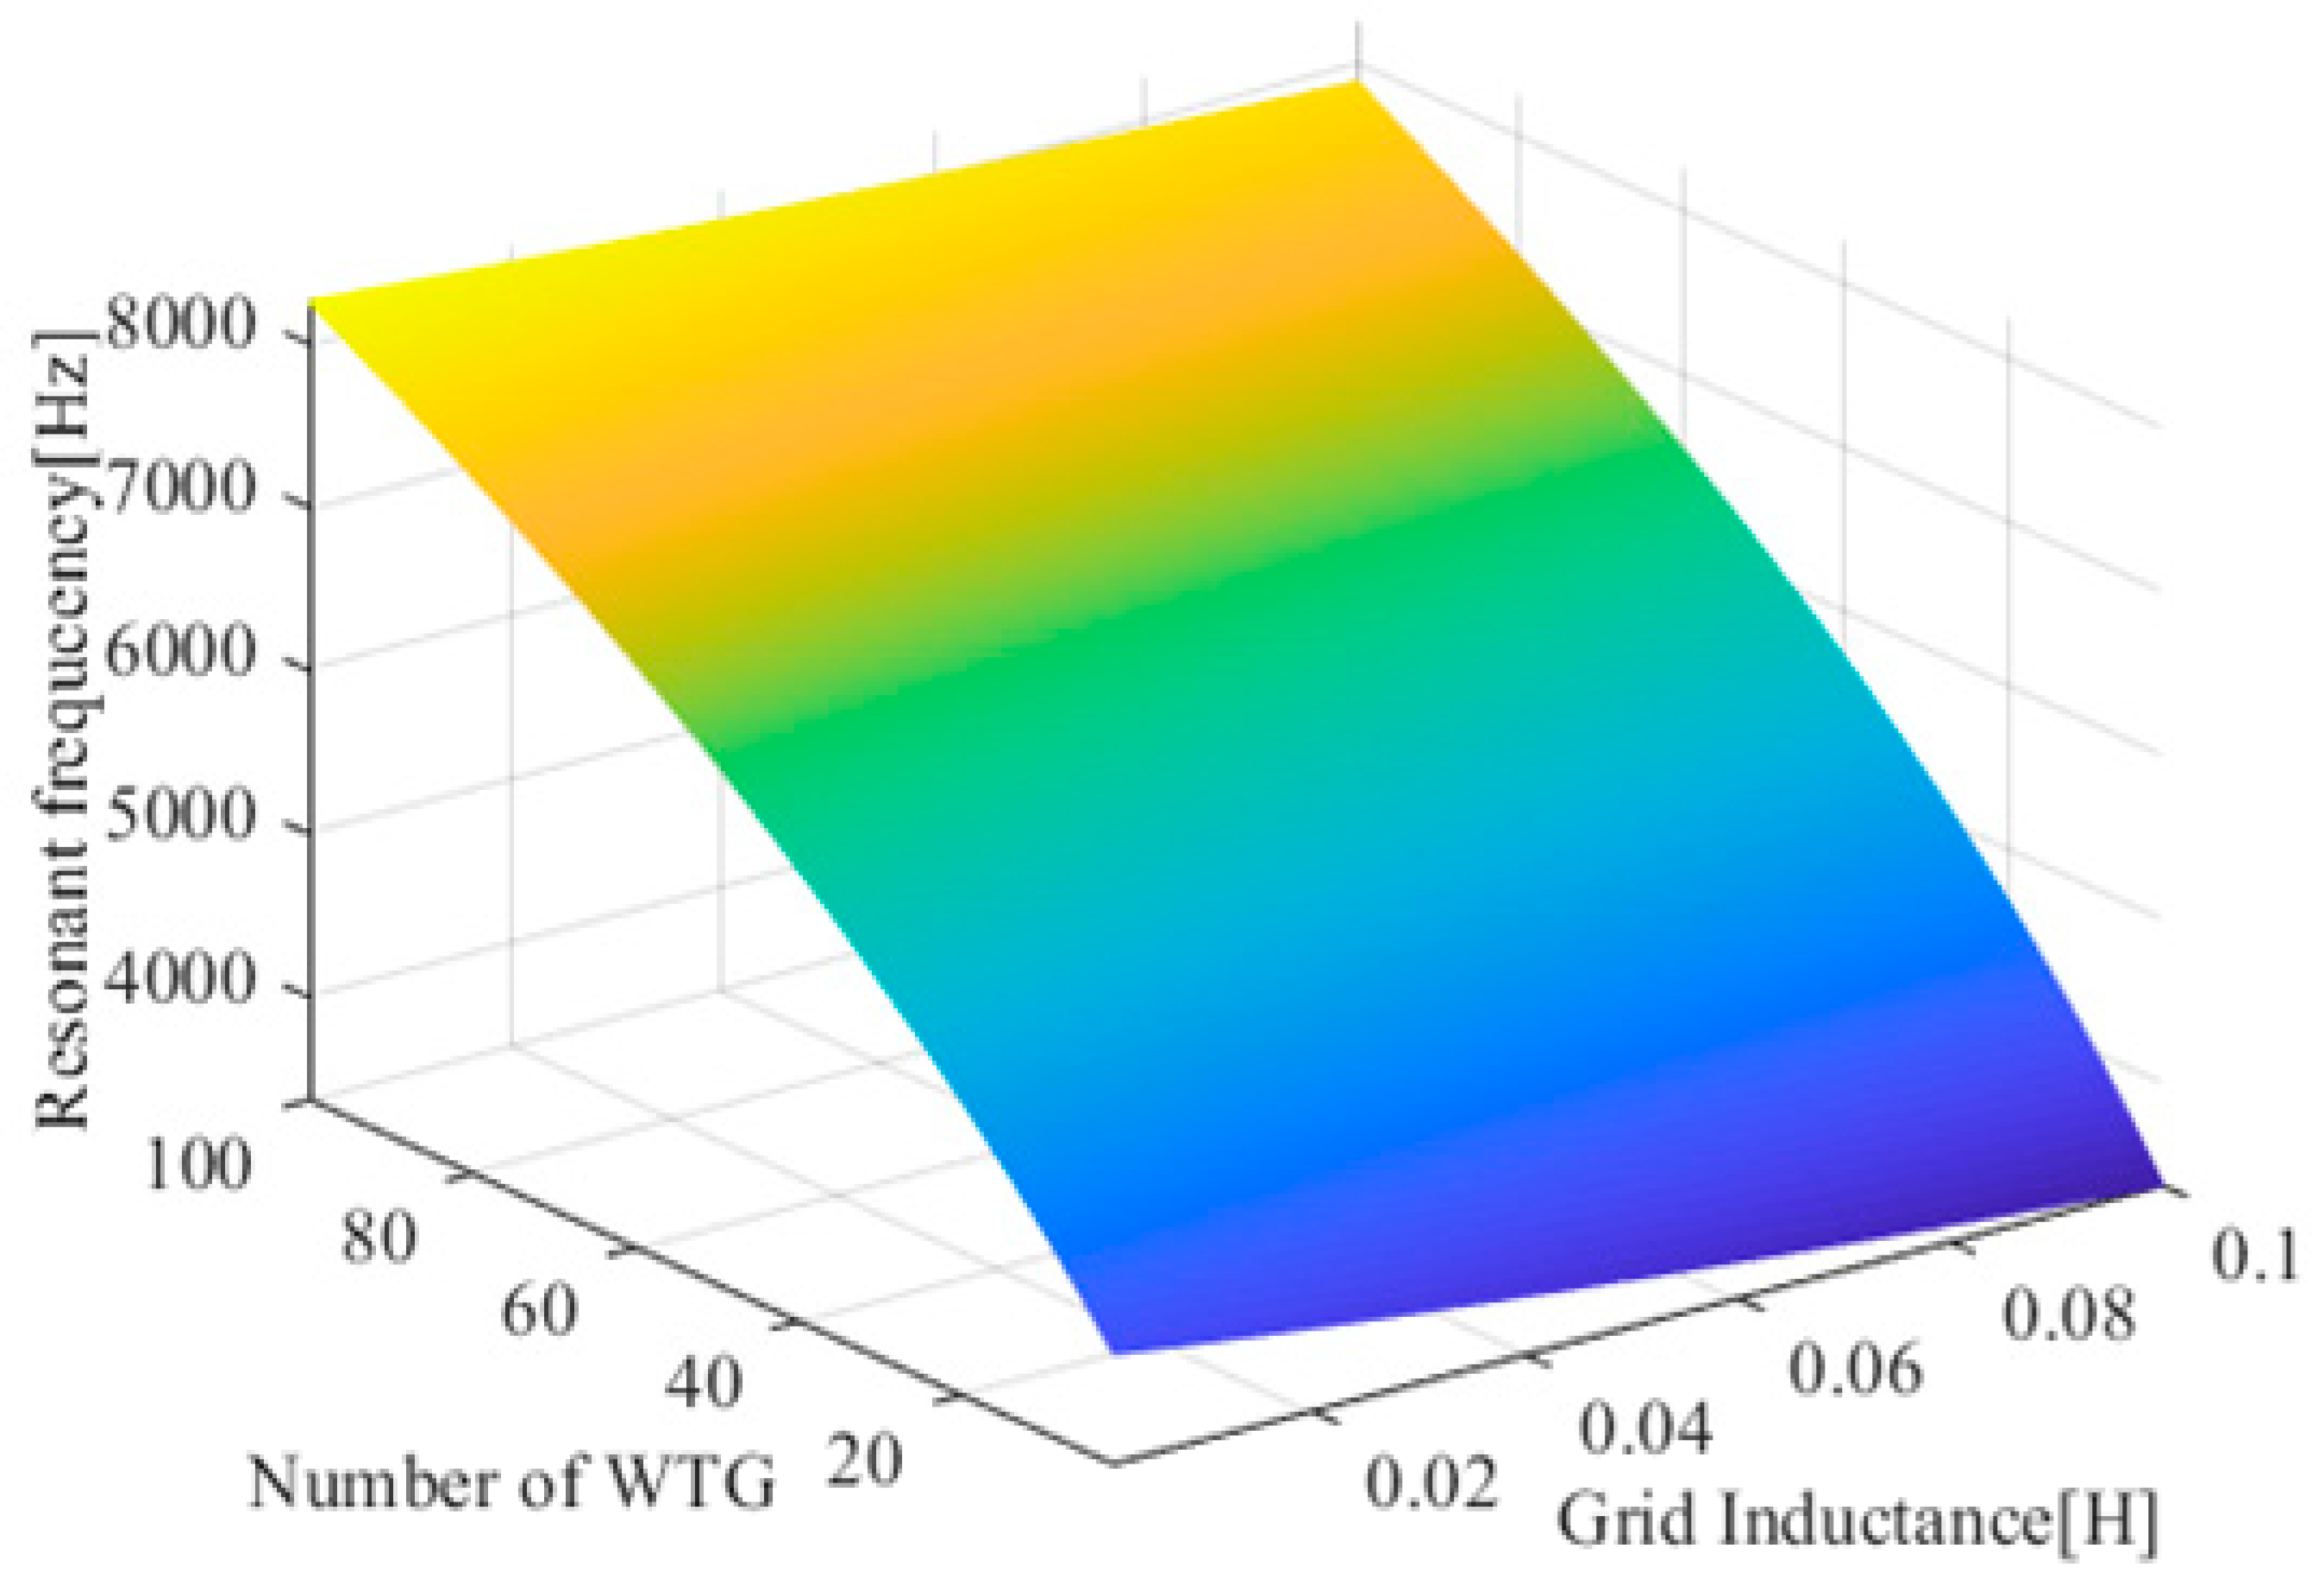
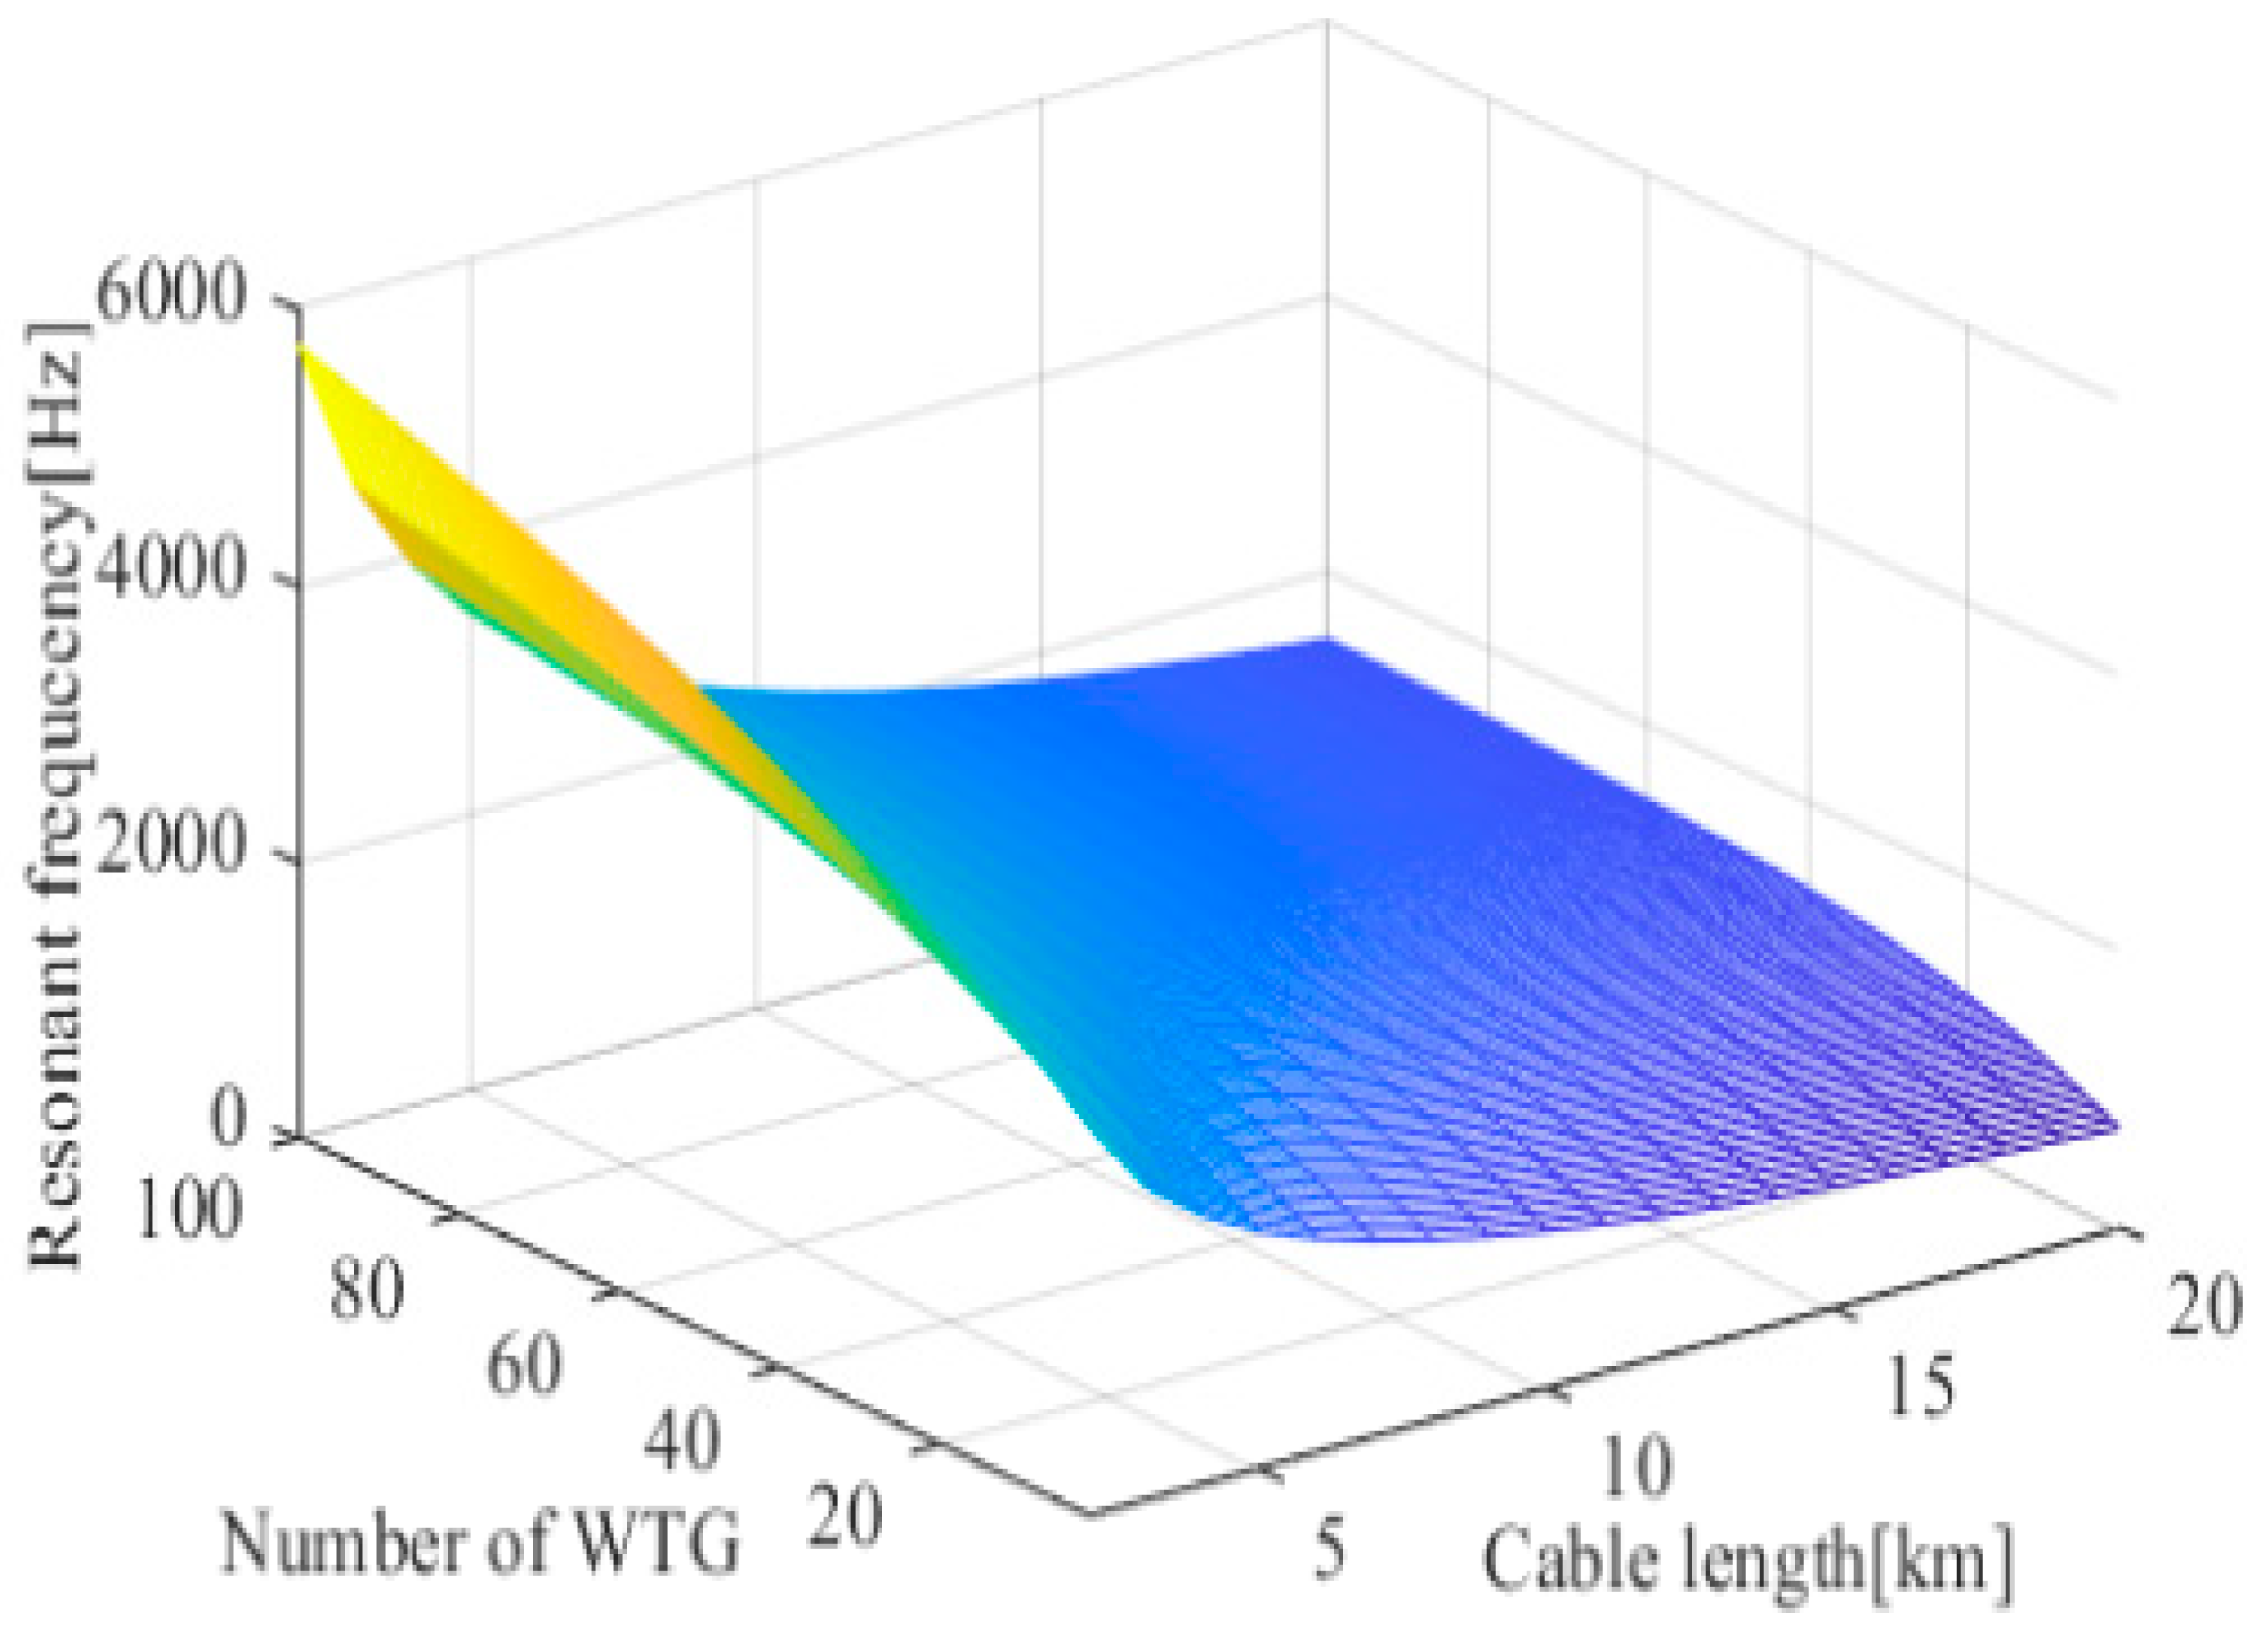
Expression (33) can be used to reveal the mechanism of high-frequency harmonic oscillation of wind farms. Based on this, the curves of the resonant frequency of the wind turbine unit with the power grid inductance Lg, the cable length lsingle, and the number of converters N can be drawn, as shown in Figure 9 and Figure 10.
By analyzing Figure 9 and Figure 10, the following conclusions can be obtained:
(1)
The frequency band of high-frequency resonance is fnrs~fsw.
(2)
The resonant frequency decreases with the increase in the equivalent reactance of the power grid. Figure 9 shows that when the number of wind turbines is 20 and the cable length is 1 km, when the equivalent reactance of the power grid increases from 10 mH to 100 mH, the resonant frequency decreases from 5140 Hz to 4670 Hz.
(3)
The resonant frequency decreases with the increase in cable length. Figure 9 shows that when the number of wind turbines is 20 and the equivalent reactance of the power grid is 10 mH, when the cable length increases from 2 km to 20 km, the resonant frequency decreases from 3684 Hz to 1146 Hz.
(4)
The resonant frequency increases with the increase in the number of wind turbines connected. Figure 10 shows that when the cable length is 5 km and the equivalent reactance of the power grid is 10 mH, the number of wind turbines increases from 1 to 50, and the resonant frequency increases from 1728 Hz to 2918 Hz.

3.2. High-Frequency Resonance Analysis Based on Impedance Model

According to the impedance stability theory, there is a risk of high-frequency resonance when the impedance curve of the interconnected system in the wind farm collector grid has an intersection and the corresponding phase angle margin is insufficient. Next, taking a wind farm as an example, the relevant factors affecting the high-frequency resonance of the wind farm collector network are analyzed, mainly including the cable length, the number of chain circuits in the field, the number of wind turbines in parallel operation, and the grid impedance. The parameters and cable parameters of the wind turbine set analyzed below are shown in Table 1 and Table 2.
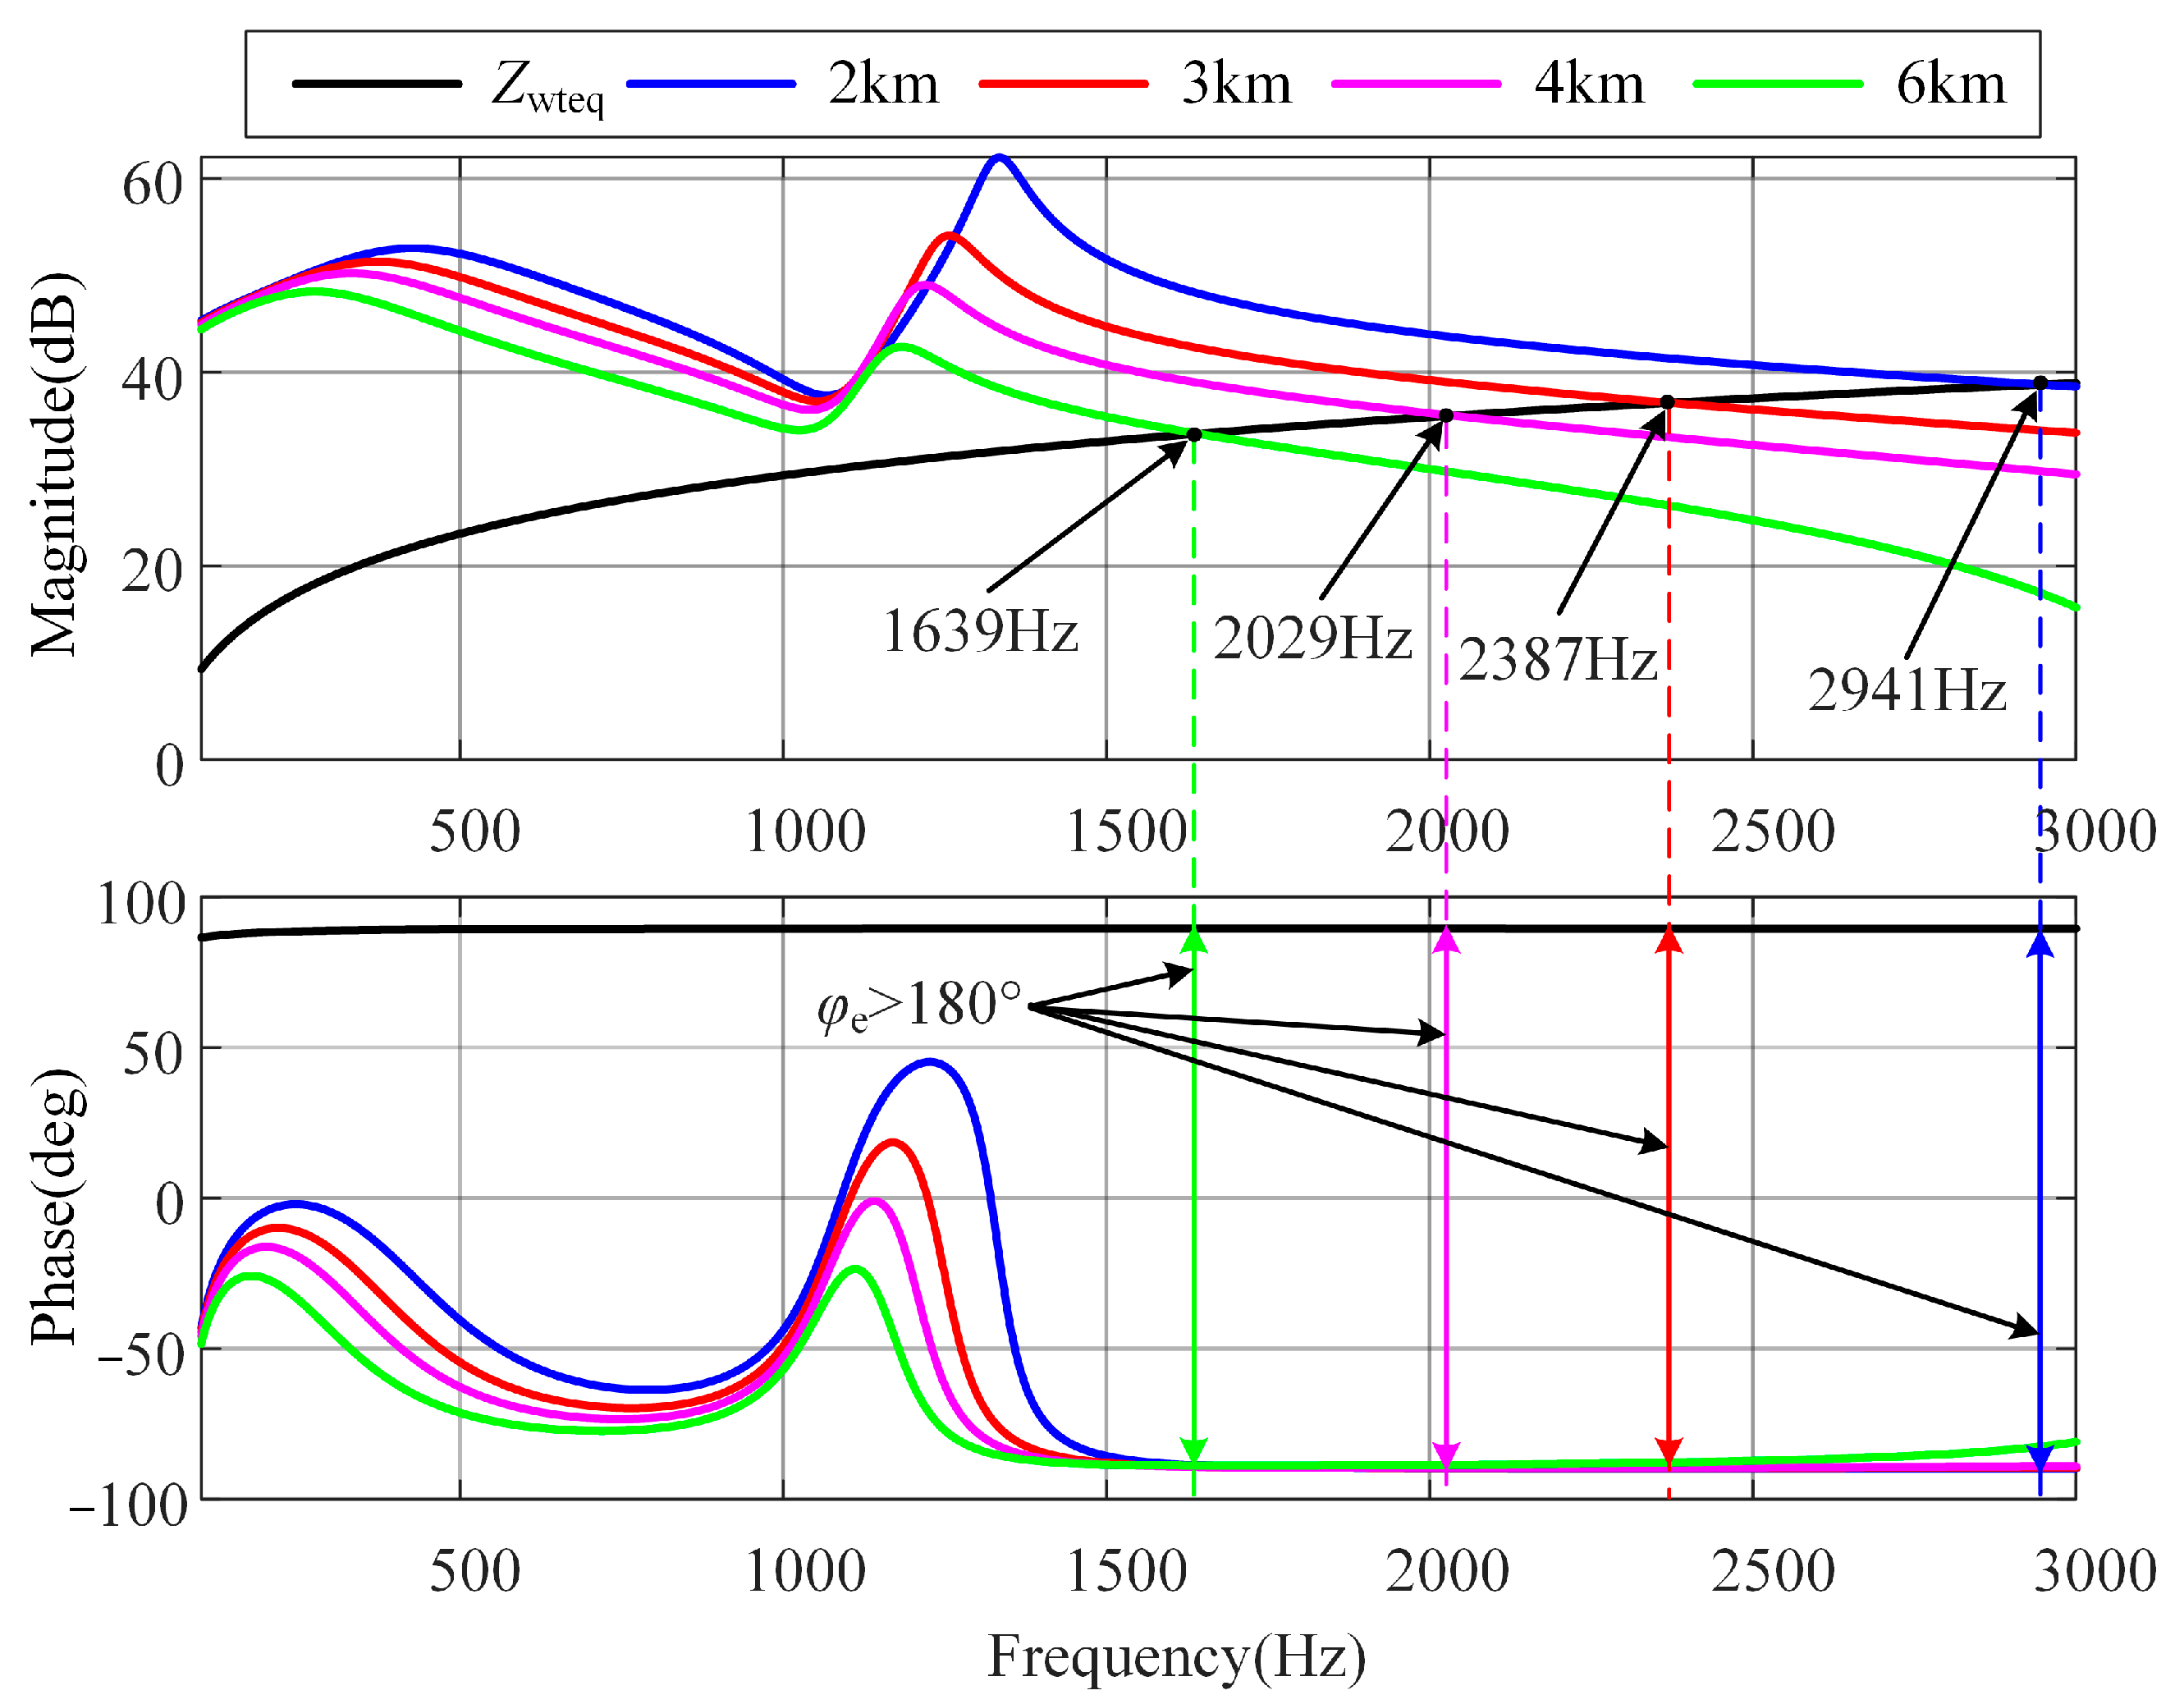
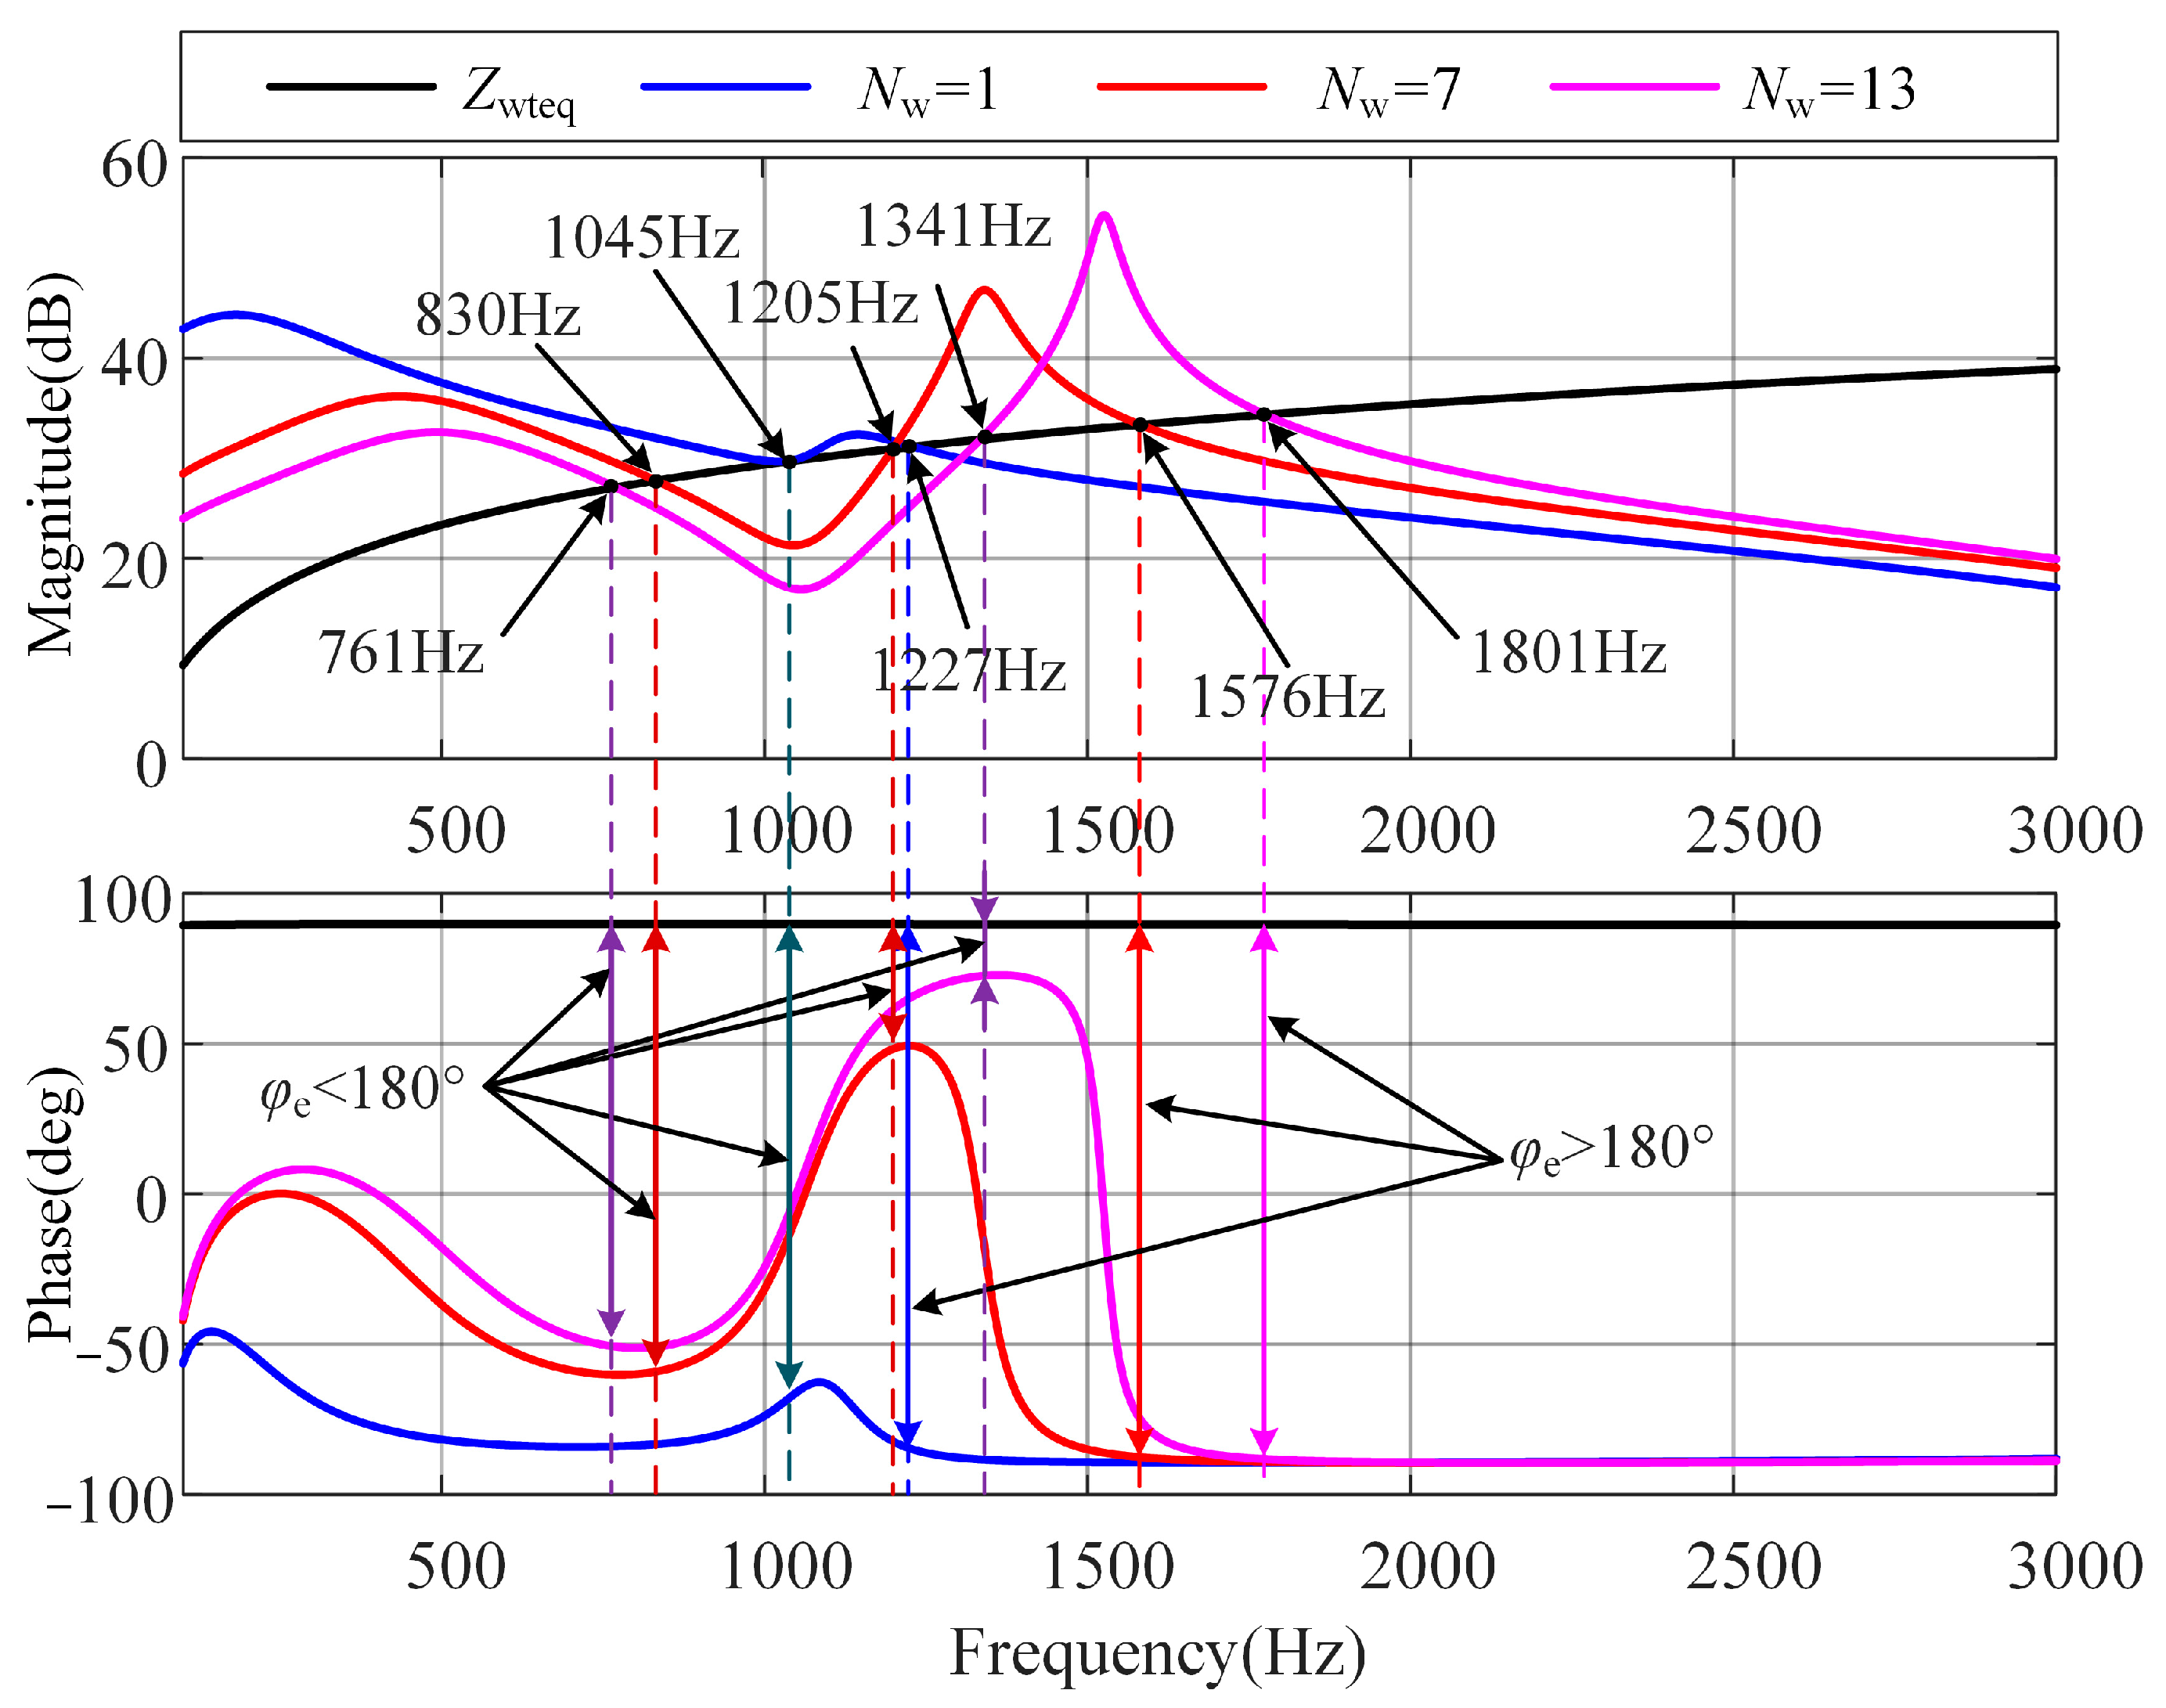
Figure 11 shows a typical chain topology wind farm. The system has three links, including four typhoon generators in Fed L1, five typhoon generators in Fed L2 and four typhoon generators in Fed L3. In order to analyze the variation law of the resonant frequency of the power grid, the impedance model of the interconnected system was established with the outlet end of the fourth unit of Fed L3 as the dividing point and the 35 kV bus of the wind farm as the dividing point. The impedance curves of the interconnected system established under different conditions are shown in Figure 12, Figure 13 and Figure 14. It should be noted that the black point in the figure represents the resonance frequency point meeting the high-frequency resonance conditions in the wind farm collector grid, and the black arrow indicates that the phase difference φe in the impedance curve of the interactive system corresponding to the resonance frequency is more than 180 °.

3.2.1. Variation Law of Resonant Frequency with Cable Length

When Fed L1 and Fed L2 are not connected in the wind farm, Figure 12 shows the impedance curve of the interconnected system when only the fourth unit connected to Fed L3 is connected, taking the outlet end of the unit as the dividing point and considering the length of the connecting cable between the units in the wind farm to be 2 km, 3 km, 4 km and 6 km. Note that Fed L3 has four connecting cables. As can be seen from Figure 12:
(1)
The resonant peak frequency of the impedance of the residual equivalent wind field subsystem moves to the low-frequency band with the increase in cable length;
(2)
The impedance of the two interconnected systems have intersections, and the intersection frequencies are 2941 Hz, 2387 Hz, 2029 Hz, and 1639 Hz respectively. They move to the low-frequency band with the increase in cable line length, and the phase angle difference at the four intersection frequencies is 180°. According to the impedance stability theory, there is a risk of high-frequency resonance.
Table 3 shows the comparison data between the resonance frequency point obtained by the mechanism model in Equation (33) and the frequency intersection of impedance model in Figure 12. It can be seen that the impedance analysis method in Figure 12 is basically consistent with the theoretical analysis results in Section 3.1.

3.2.2. Variation Law of Resonant Frequency with the Number of Connected Wind Turbines

Figure 13 shows that, when both Fed L1 and Fed L2 are connected in the wind farm and the outlet end of the WTG W34 of Fed L3 is taken as the dividing point, six units are not connected in the remaining wind farm subsystems and baud diagram of impedance curve of the interconnected system connected to twelve typhoon generator units during operation. The length of each cable line in the wind farm is 1 km. As can be seen from Figure 13:
(1)
Compared with Figure 12, the resonant peak frequency of the remaining equivalent wind farm subsystem impedance moves to the low-frequency band with the increase in the number of wind turbine links connected to the 35 kV convergence bus;
(2)
The resonant peak frequency of the residual equivalent wind farm subsystem impedance moves to the high-frequency band with the increase in the number of wind turbines incorporated into the wind turbine;
(3)
The impedance of the two interconnected systems has intersections, and the intersection frequencies are 1234 Hz, 1585 Hz, and 1813 Hz, respectively. They move to the high-frequency band with the increase in the number of wind turbine units, and the phase angle difference in the four intersection frequencies is 180°. According to the impedance stability theory, there is a risk of high-frequency resonance.

3.2.3. Variation Law of Resonant Frequency with Equivalent Impedance of Power Grid

The variation law of the internal resonant frequency of the wind farm with the impedance of the power grid was studied when all 13 wind turbines in the wind farm are connected. The impedance of the power grid was considered to be 1 mH, 10 mH, 100 mH, and 1 H, and the corresponding impedance curves are shown in Figure 14. As can be seen from Figure 14:
(1)
The resonant frequency of the interconnected system moves to the low-frequency band with the increase in power grid impedance;
(2)
There are intersections in the impedance of the interconnected system. The intersection frequencies are 1817 Hz, 1807 Hz, 1734 Hz, and 1609 Hz, respectively, they move to the low-frequency band with the increase in grid impedance, and the phase angle differences in the four intersection frequencies are all 180°. According to the impedance stability theory, there is a risk of high-frequency resonance.

4. High-Frequency Resonance Suppression Method for Wind Power GCC

From the previous analysis, it can be seen that the high-frequency resonant frequency range of the wind power GCC is about fnrs~fsw. Evidently, if this frequency is within the control bandwidth of the GCC, the active damping method can be used to suppress the resonant frequency; if the frequency exceeds the control bandwidth of the GCC, the suppression of the resonant frequency can only be achieved through the passive damping method.

4.1. Active Damping Control (ADC) Method

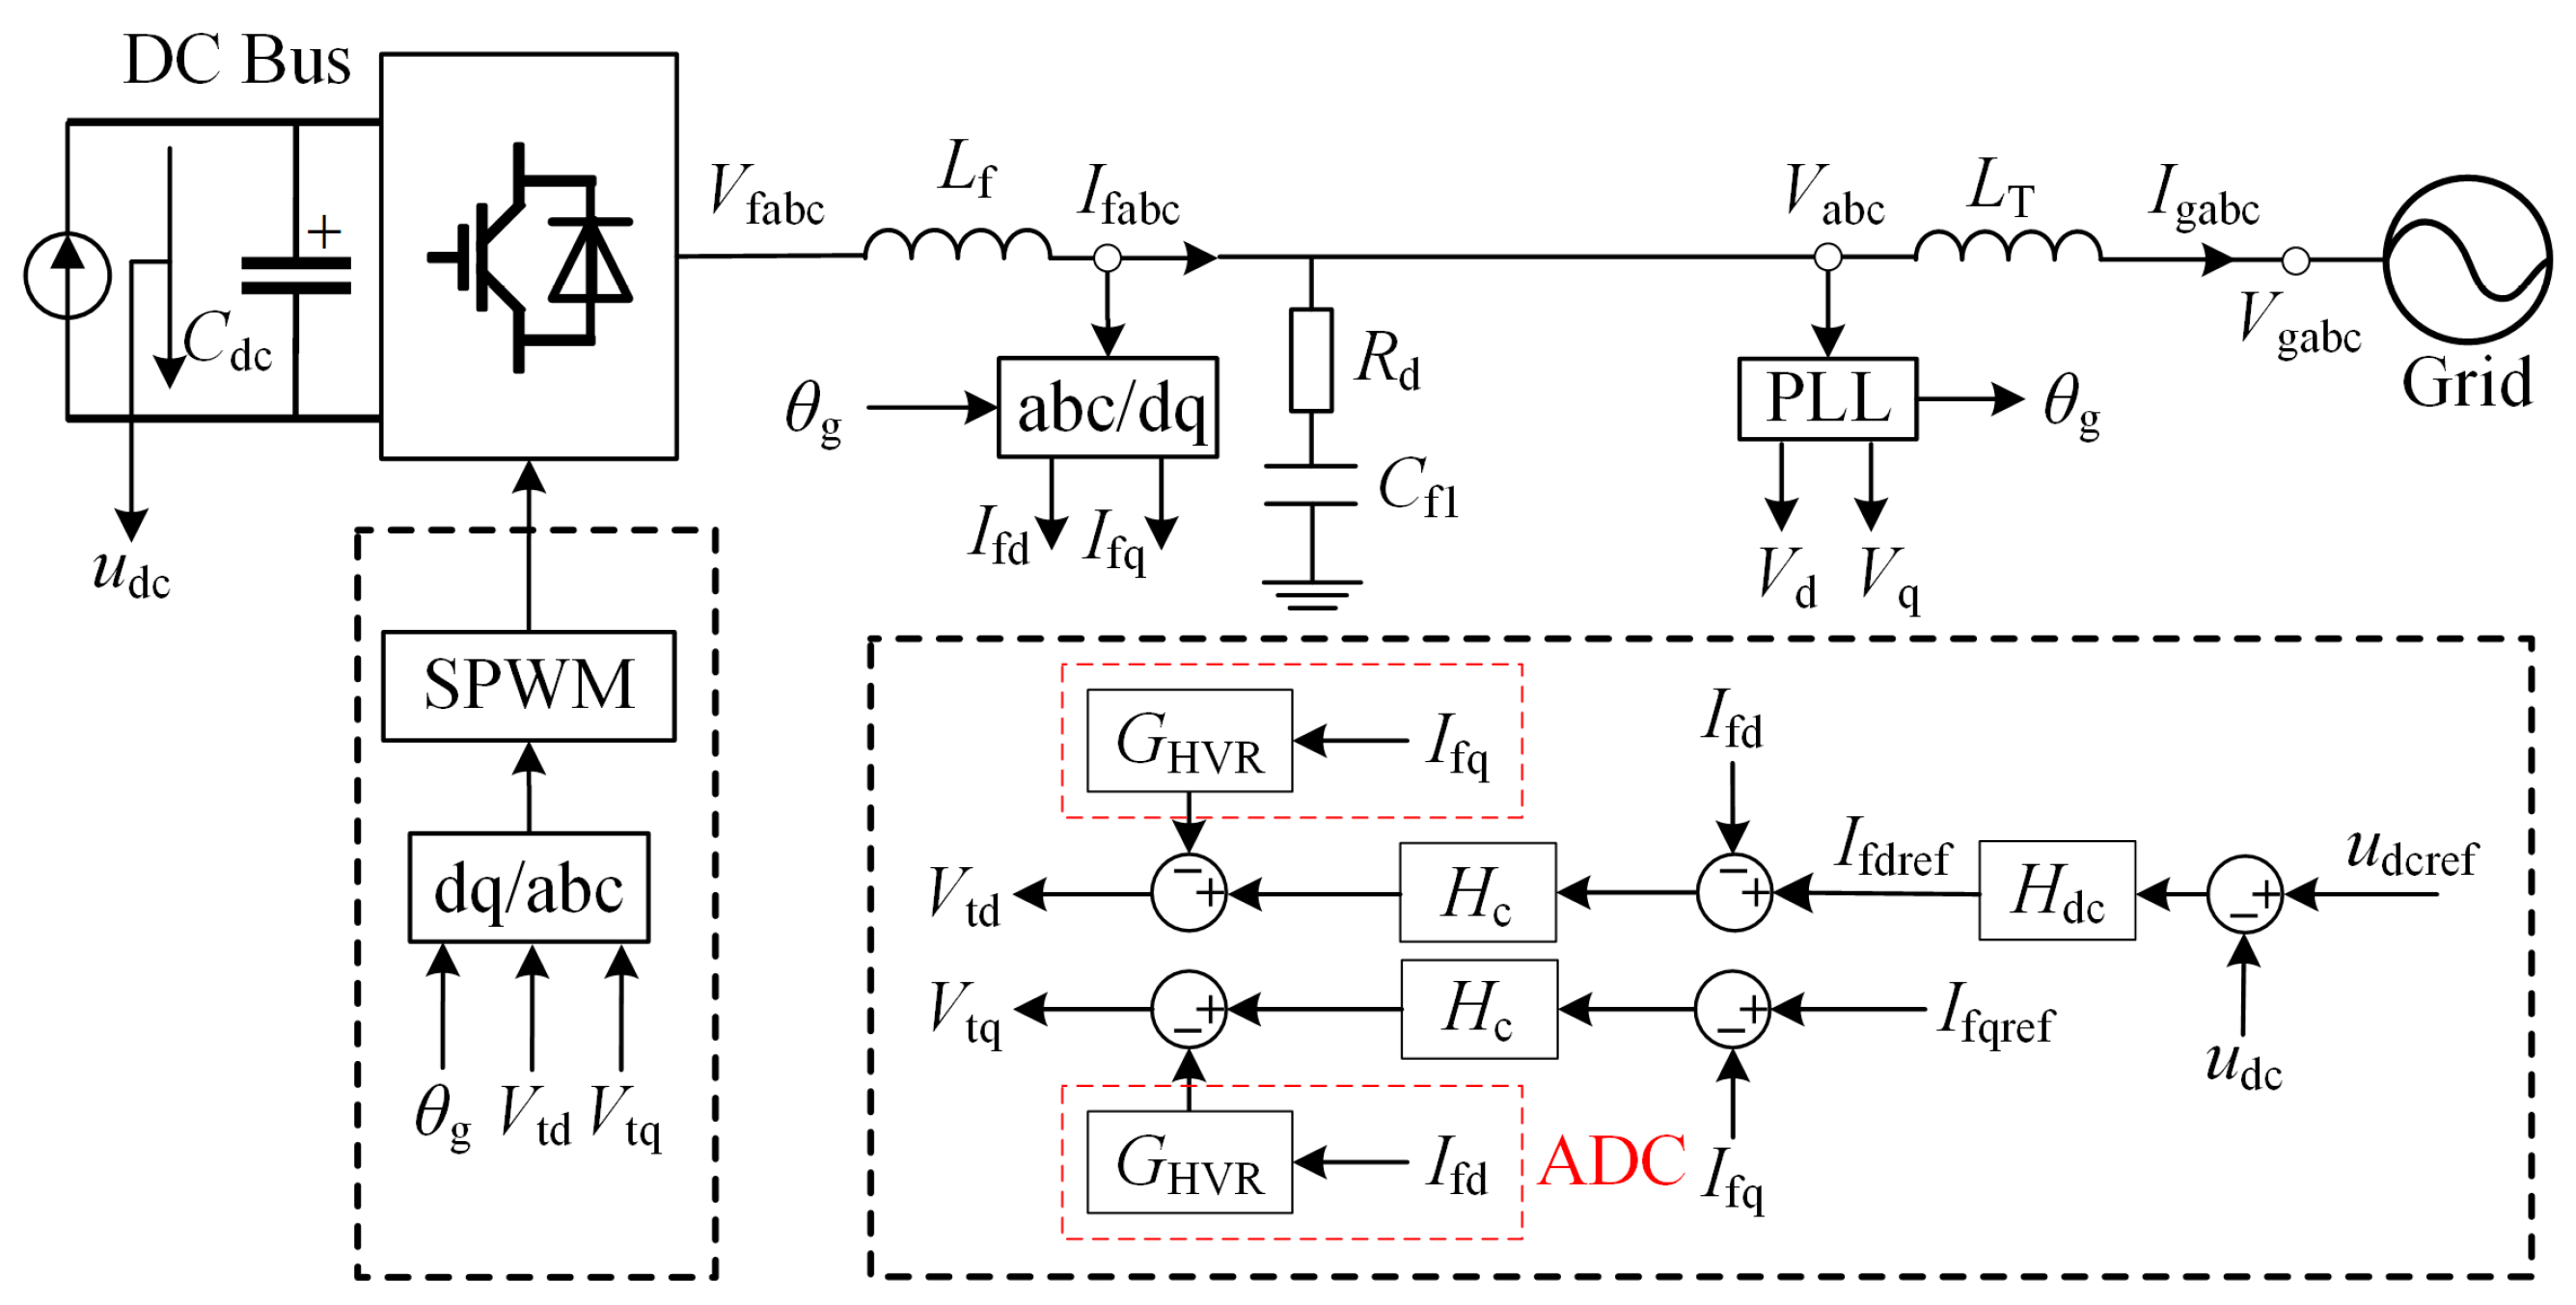
ADC can achieve impedance shaping at resonant frequency points, improve system stability margin, and suppress resonant current by extracting high-frequency harmonic components from the feedback current and attaching them to the output voltage control of the current loop. The control structure diagram is shown in Figure 15.
In Figure 15, a high-pass filter (HPF) is used to extract the resonant current, and its expression is:
G HVR ( s ) = k s 2 s 2 + 2 ξ ω r s s + ω r s 2
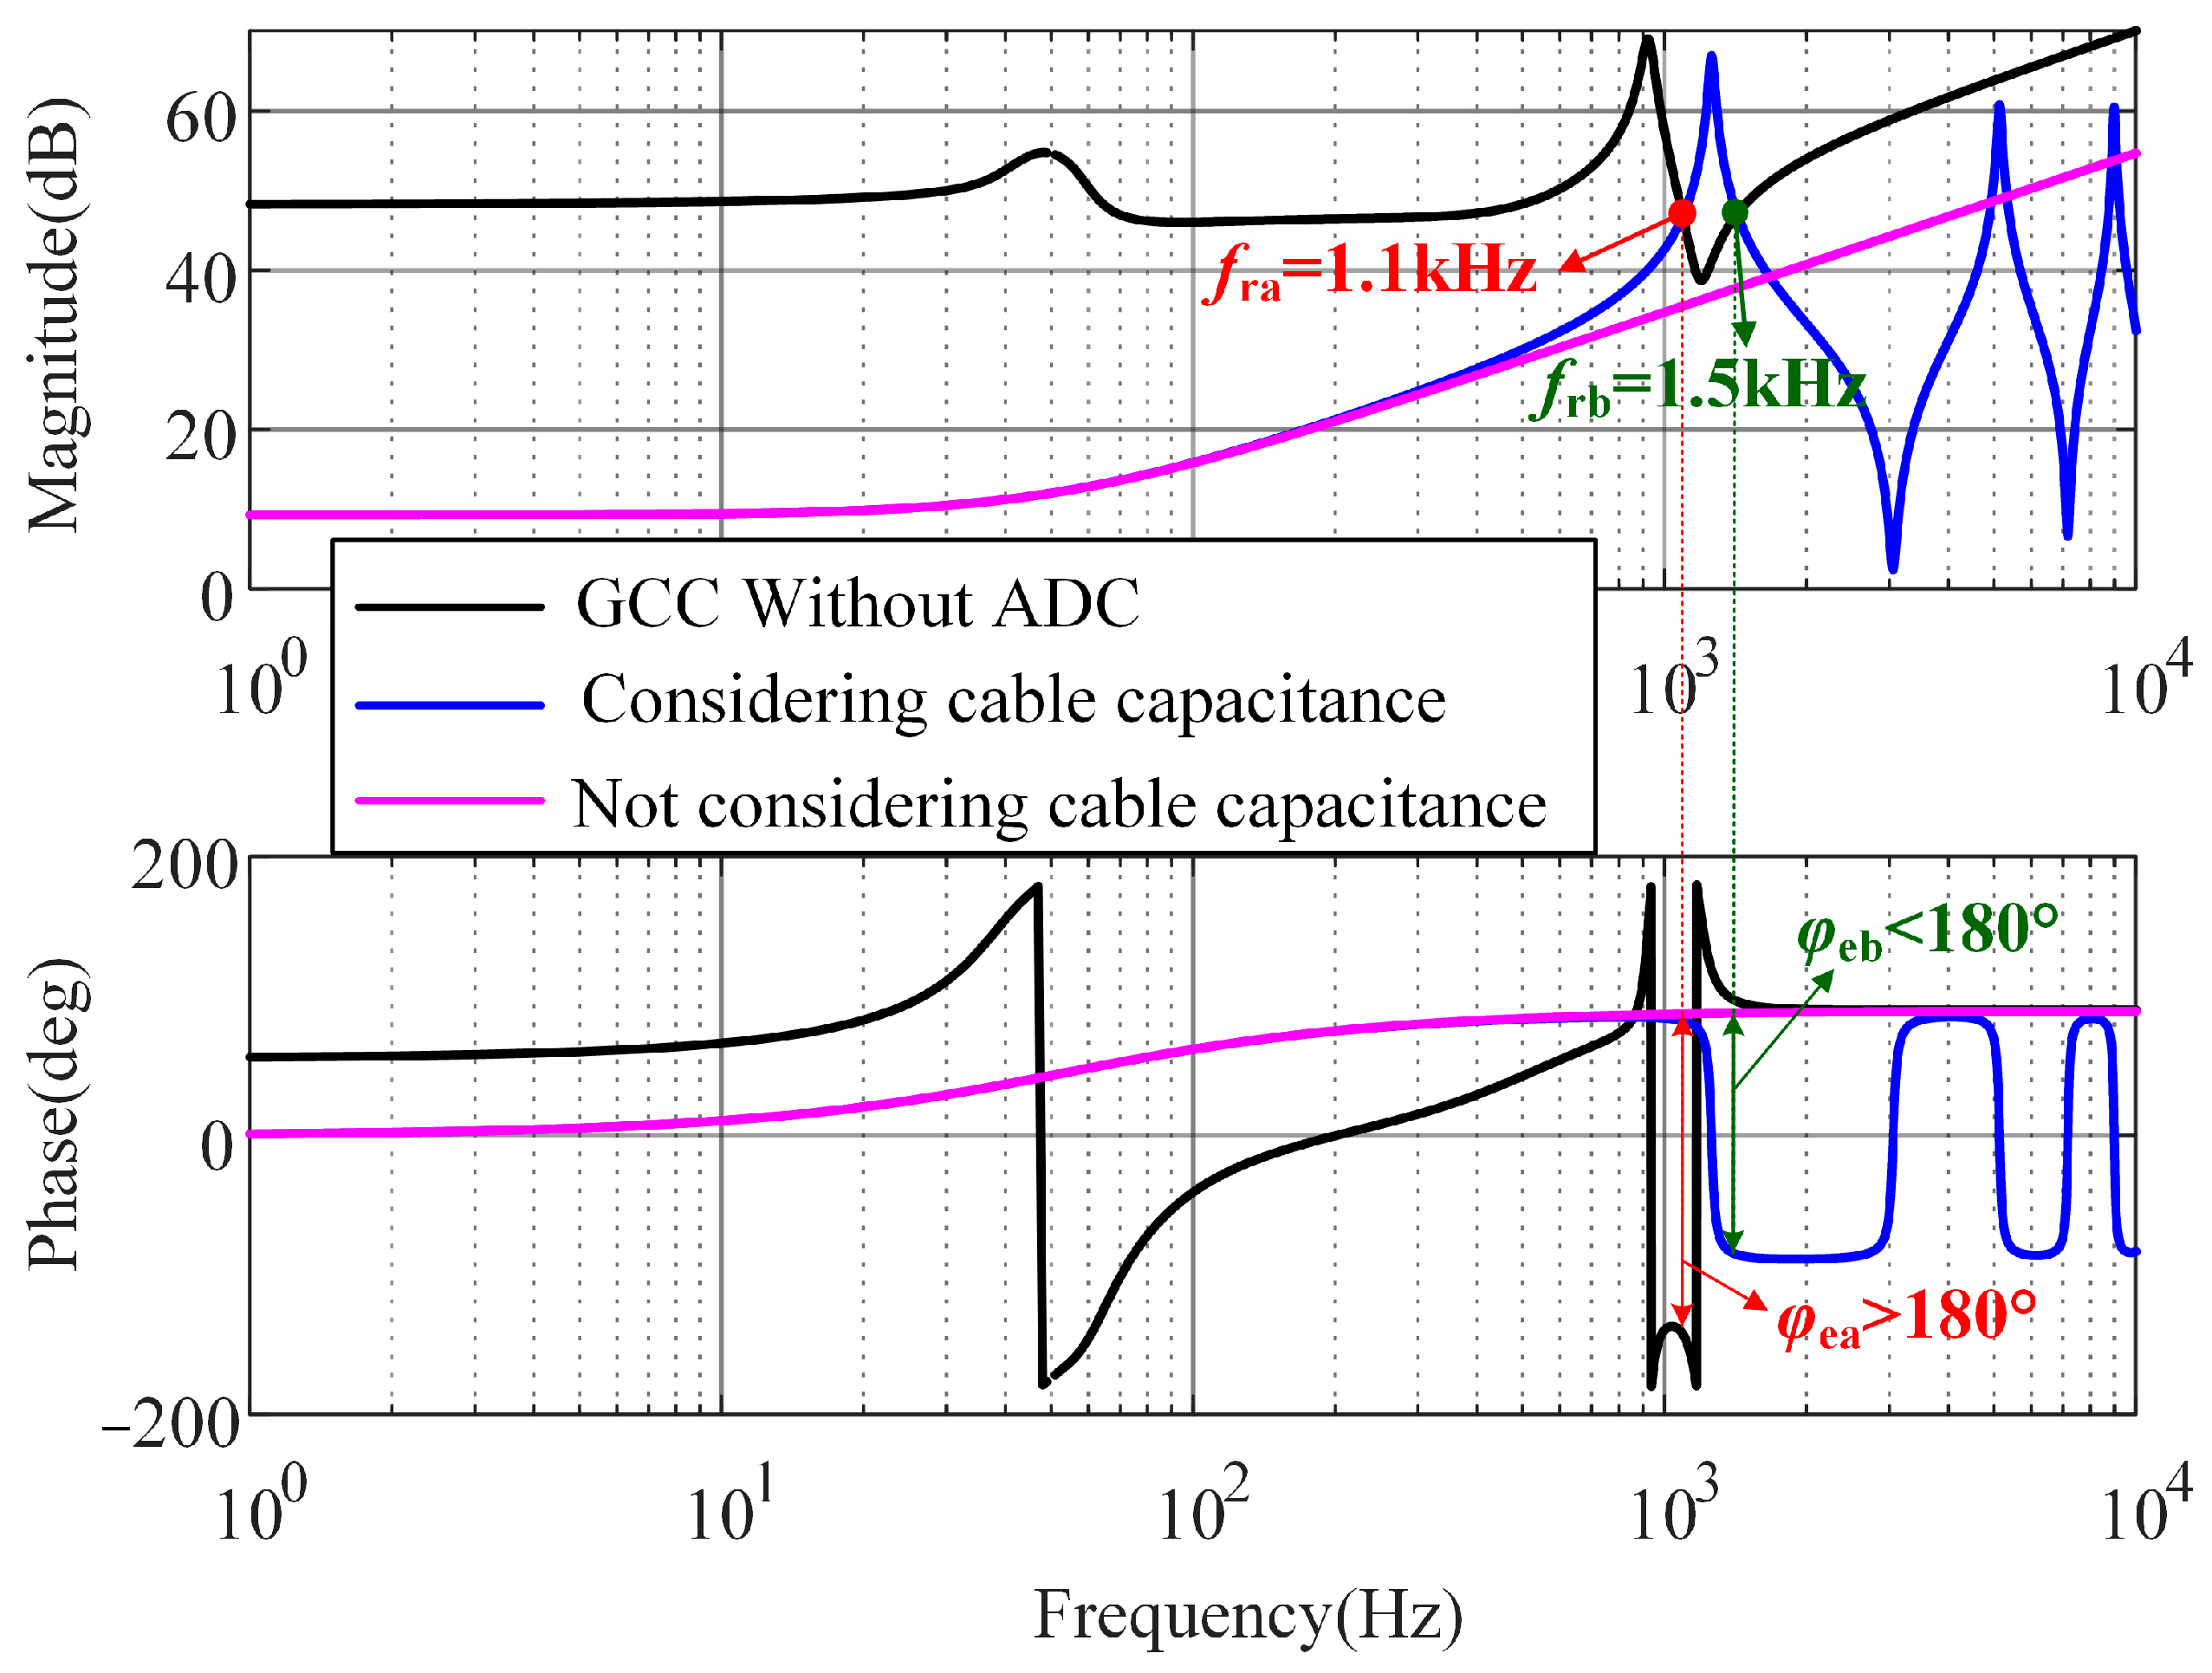
Figure 16 shows a schematic diagram of the impedance of the wind turbine GCC and the grid impedance before and after considering the cable capacitance effect. The cable length is considered to be 8 km, the delay time is considered to be 300 μs, and the current loop control parameters are taken as Kp = 0.1 and Ki = 15.7. As shown in Figure 16, when the cable capacitance effect is not considered, there is no intersection between the converter impedance and the grid impedance, and there is no oscillation frequency point in the system. If the cable capacitance effect is considered, there are points of intersection between the GCC impedance and the grid impedance at 1.1 kHz and 1.5 kHz, and the phase angle difference is φea > 180° and φeb < 180°. According to impedance stability theory, there is a risk of oscillation in the system at this frequency point of 1.1 kHz.
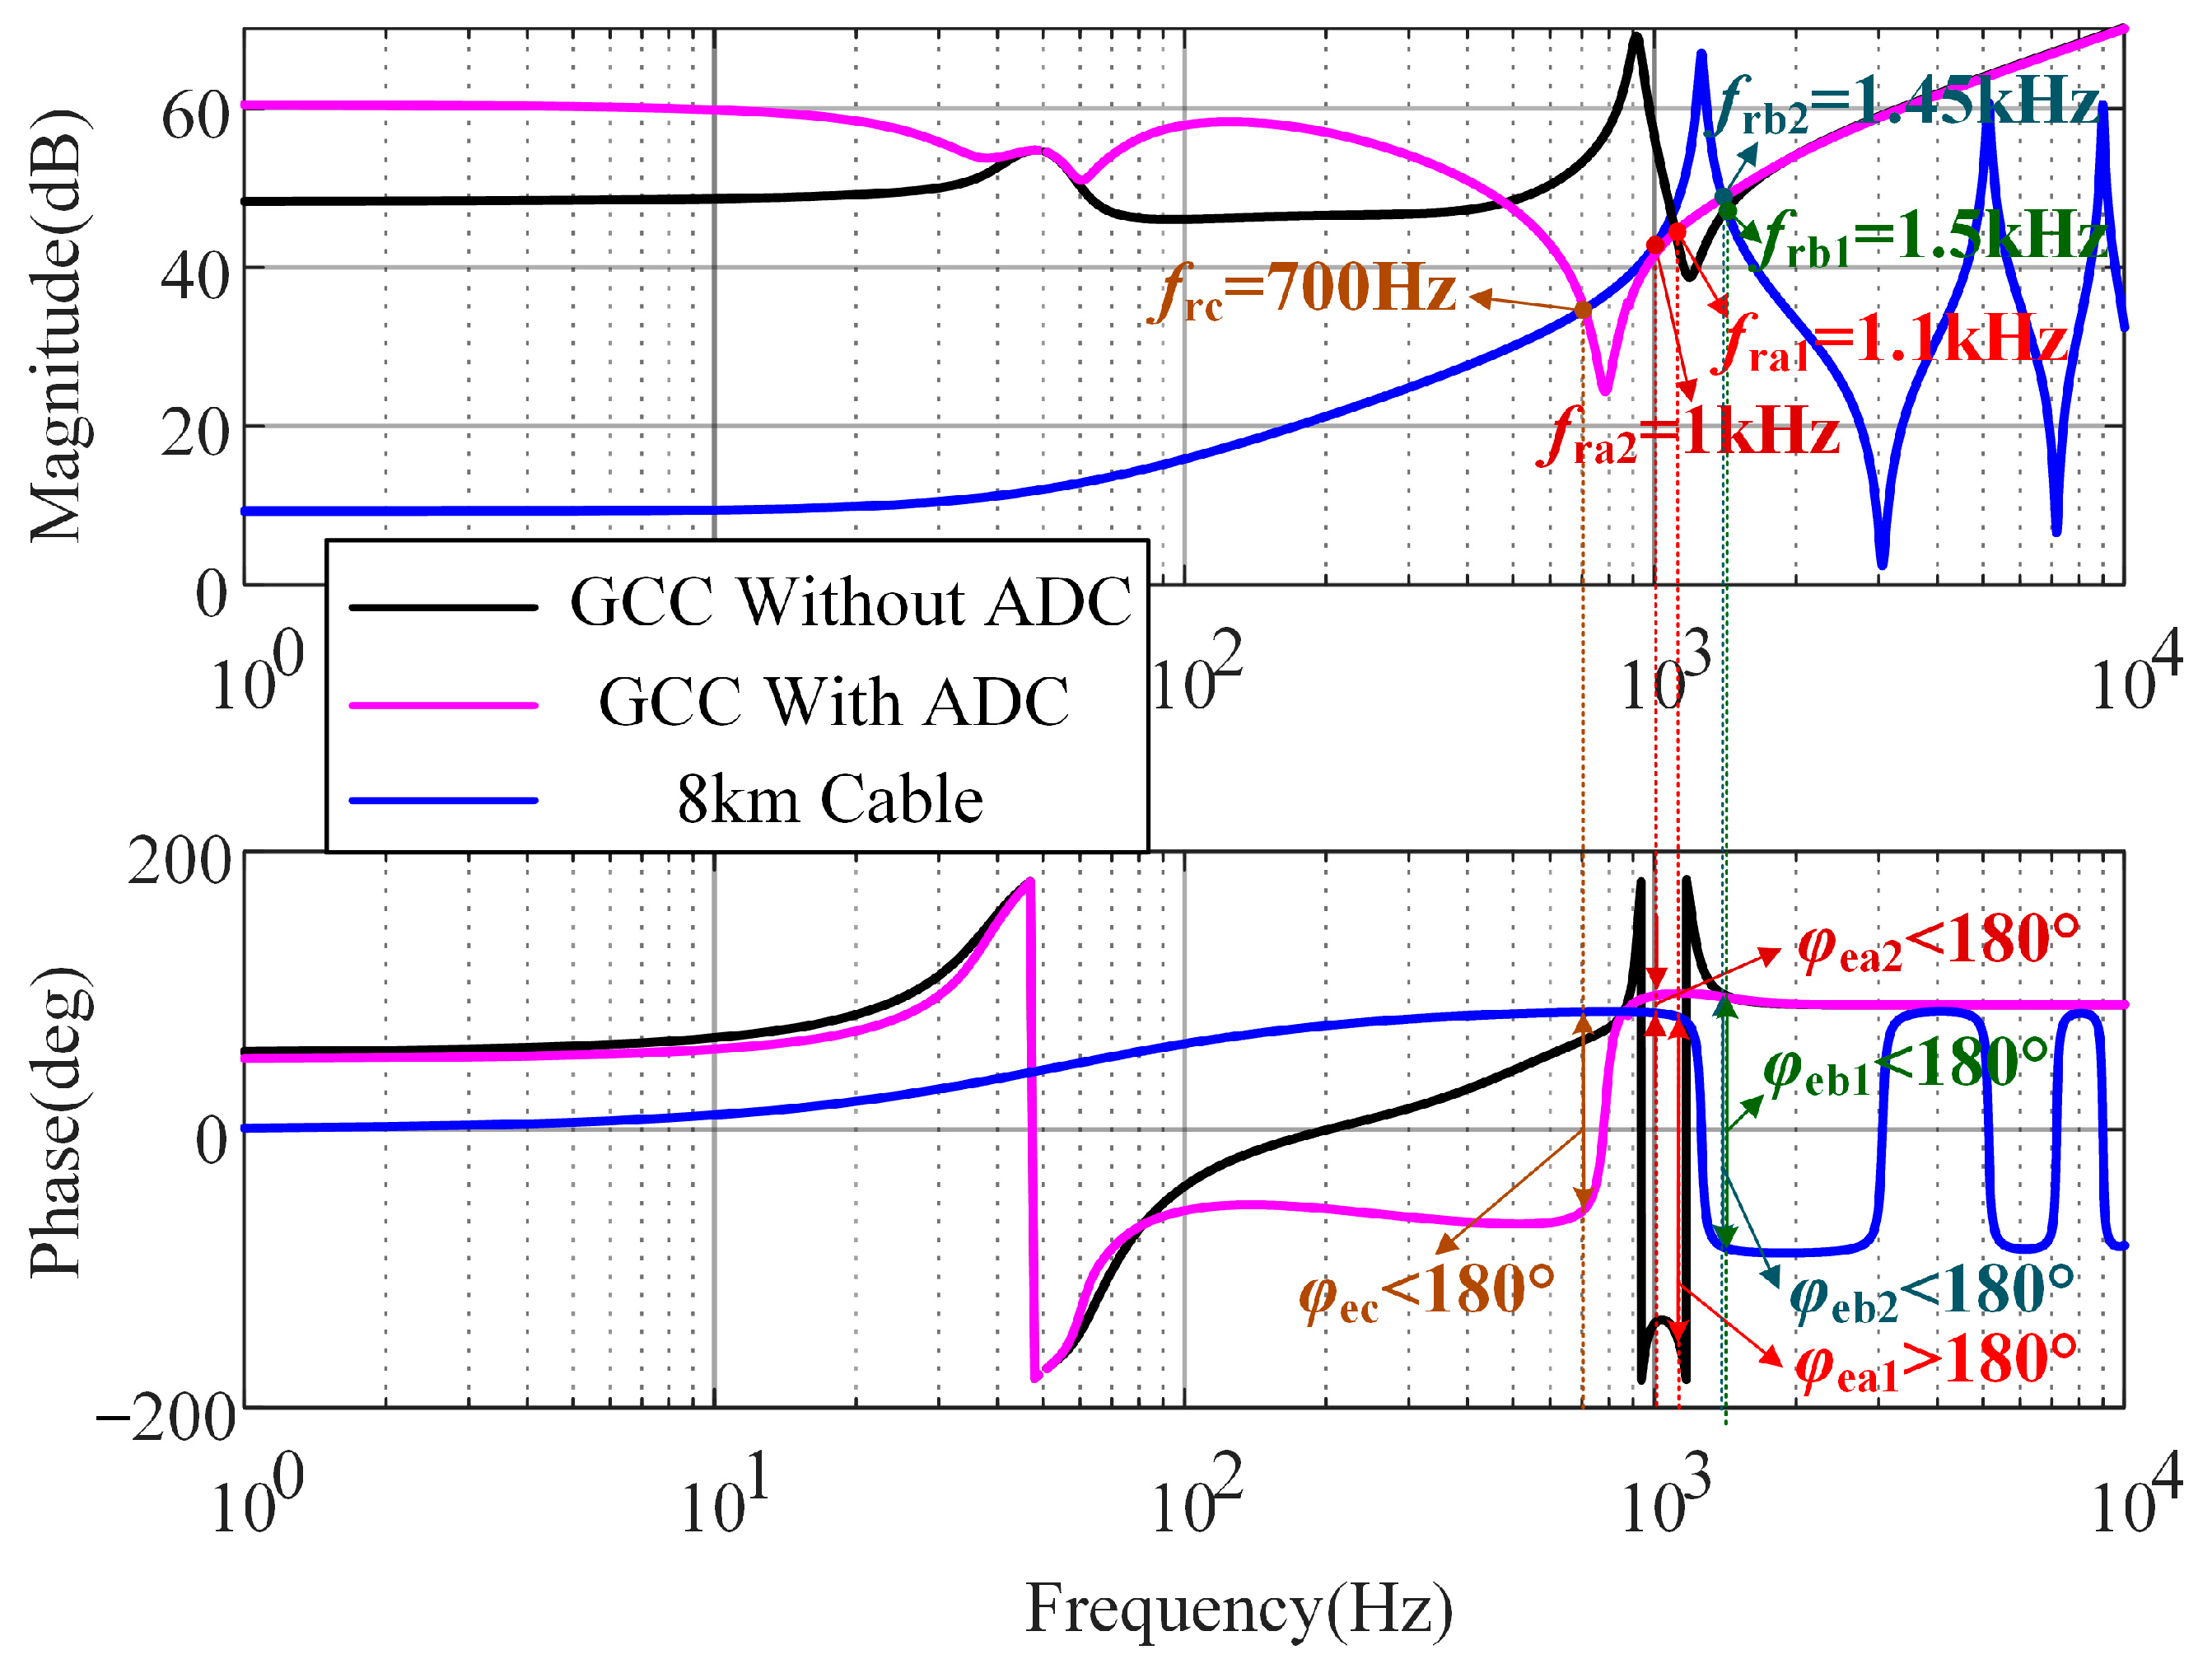
Figure 17 shows the impedance of the GCC and the grid impedance before and after the addition of the ADC strategy. From Figure 17, it can be seen that the addition of ADC changes the impedance curve of the GCC.
The impedance intersections of GCC without ADC and grid impedance are at 1.1 kHz and 1.5 kHz, and the phase angle difference φea1 exceeds 180°; φeb2 is within 180° at the intersection. There is an evident resonance problem at 1.1 kHz. However, with the ADC, the impedance intersections of GCC and grid impedance are at 700 Hz, 1 kHz, and 1.45 kHz, and the phase angle differences φea2, φeb2, and φec at the intersection are all within 180°. There is no resonance problem in the system. In addition, as shown in Figure 17, the resonance frequency point of the system was eliminated at 1.1 kHz, and the stability margin of the system was greatly improved at 1.1 kHz, which can effectively suppress the resonance of the system current.

4.2. Passive Damping Control (PDC) Method

When the resonant frequency exceeds the control bandwidth of the converter, the effectiveness of ADC is limited, so the PDC method needs to be considered. By adding an additional LC filtering branch and considering setting the resonant frequency of this branch to a resonant frequency, the high-frequency harmonics of the converter can be effectively filtered out and the resonant excitation source can be eliminated. The structural diagram of the wind turbine GCC using PDC is shown in Figure 18.
The passive damping method eliminates the resonant current source that excites system resonance by adding additional filtering branches, achieving the goal of suppressing the amplification and excitation of higher harmonic currents along the transmission line.
In Figure 18, the transfer function between the grid-side output current Ig and the inverter output voltage Vf, without considering the additional LC filtering branch, is:
G F 1 ( s ) = G RC ( s ) ( R f + s L f ) ( R g + s L g ) s C f 1 + G RC ( s ) [ R f + R g + s ( L f + L g ) ]
where the expression of GRC(s) is:
G RC ( s ) = s R g C f 1 + 1 s C f 1
In Figure 18, the parallel transfer function of the capacitor branch and the additional LC filtering branch is:
G LCR ( s ) = s 3 R d L res C f C res + s 2 L res C res + s R d C f + 1 s 3 L res C f C res + s 2 R d L res C res + s C f + s C res
Furthermore, the transfer function GLCL2(s) between the grid-side output current Ig and the inverter-output-side voltage Vf can be obtained as:
G F 2 ( s ) = I g ( s ) V f ( s ) = G LCR ( s ) ( R f + s L f ) ( R g + s L g ) + G LCR ( s ) [ R f + R g + s ( L f + L g ) ]
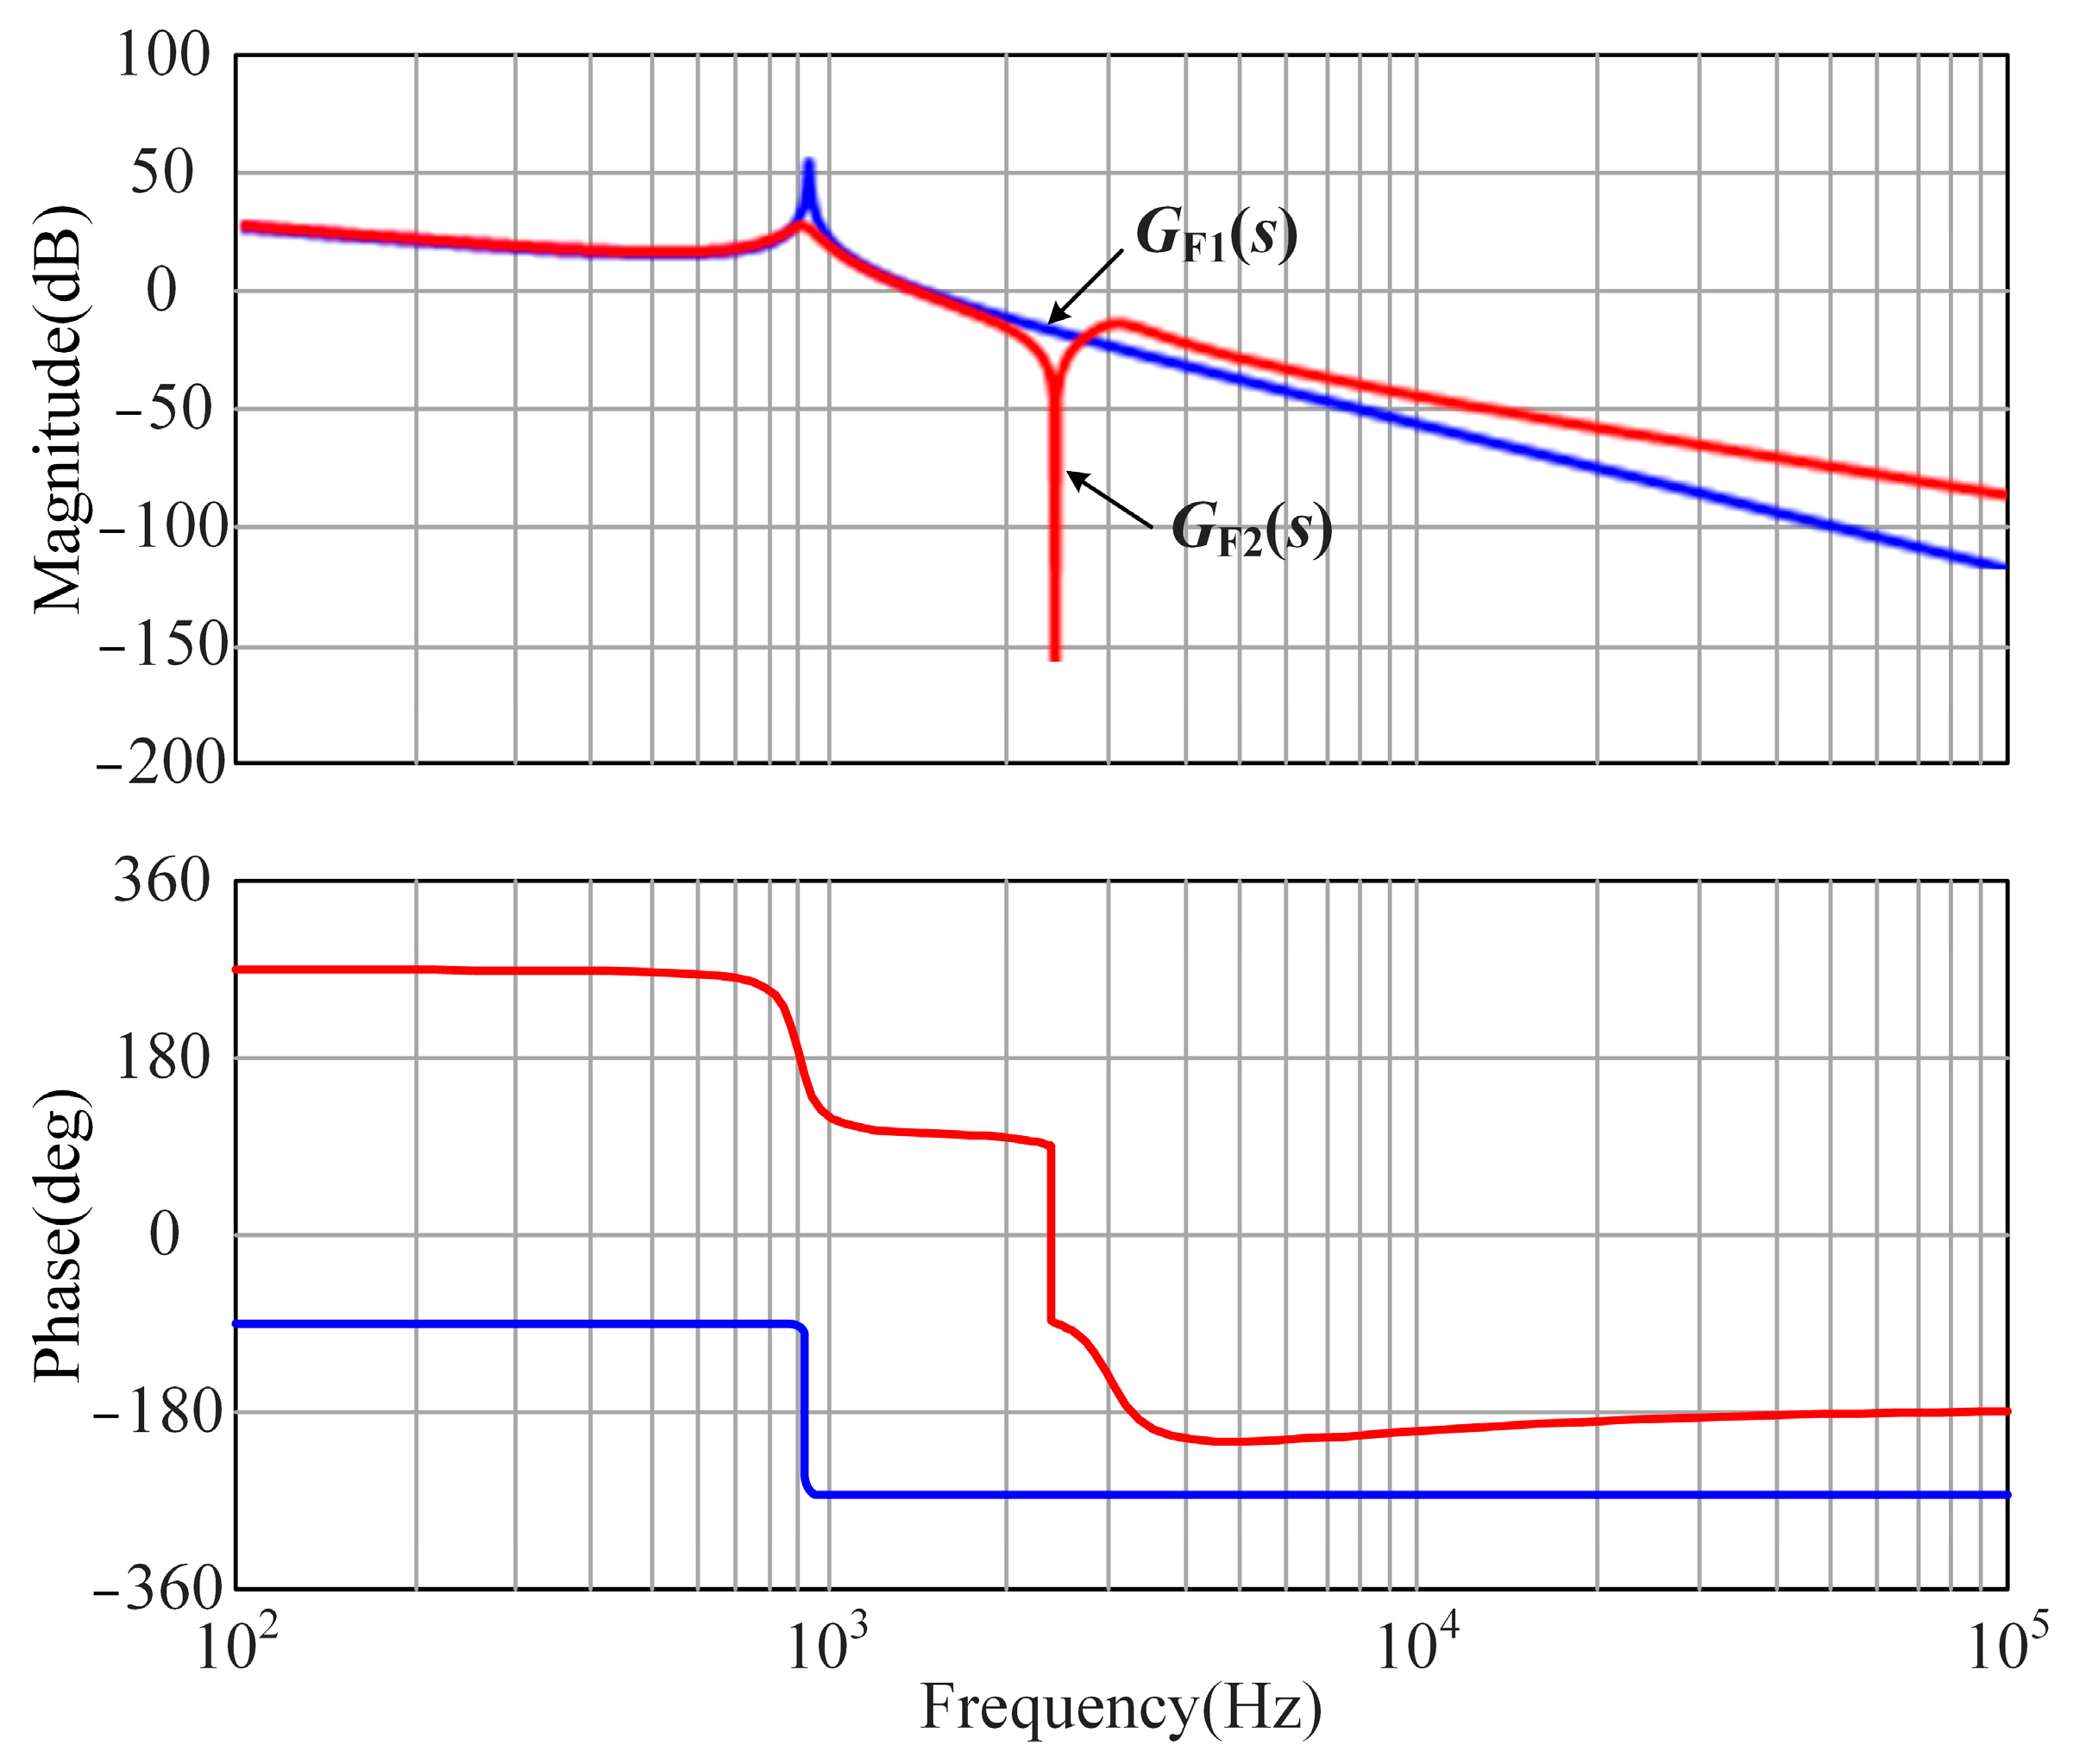
We plotted the Bode plots of transfer function GF1(s) and transfer function GF2(s) as shown in Figure 19. It can be seen from Figure 19 that, after adding LC series filter branch for resonant frequency, the gain of the filter at the resonant frequency is greatly reduced, and the phase margin of the system is greatly improved, which can effectively suppress the output harmonics of the GCC and realize the suppression of current resonance.

5. Experimental Verification

5.1. High-Frequency Resonance Control Methods Verification

5.1.1. ADC Experiment

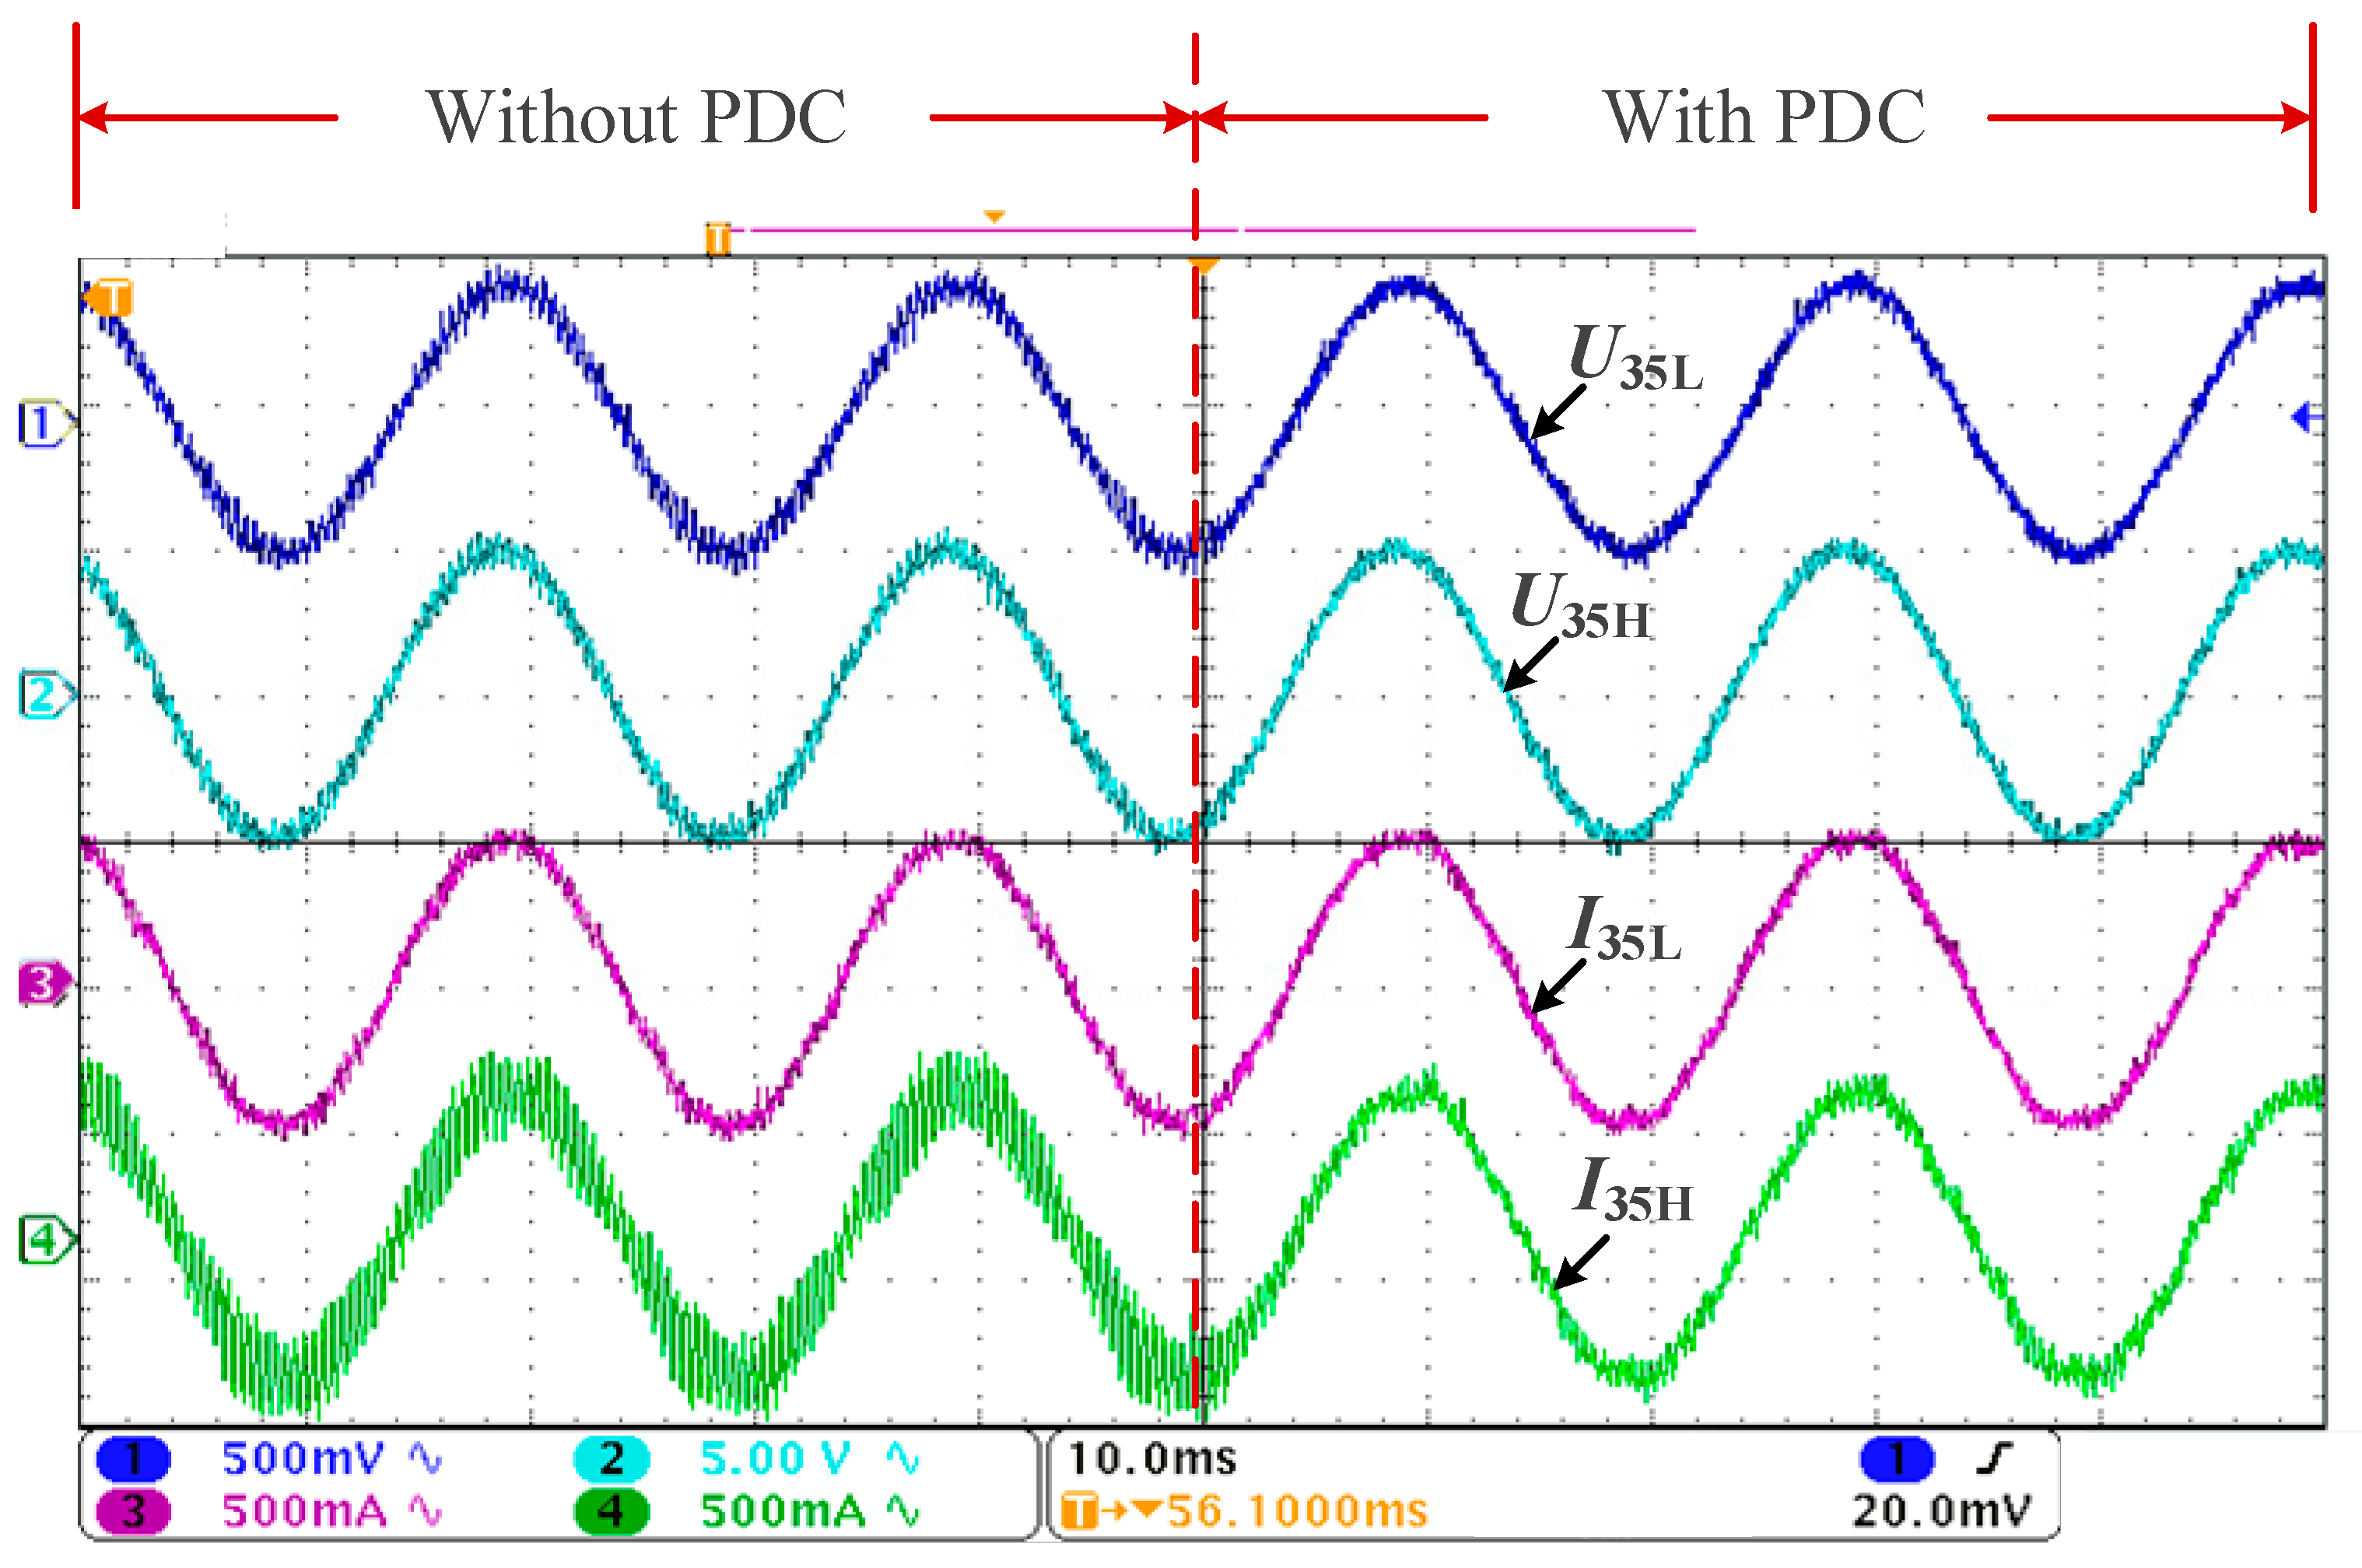
Experimental conditions: The length of the cable line was 8 km, the control delay of the GCC was 300 μs, and the current loop parameters were Kp = 0.1 and Ki = 15.7. Through impedance analysis, the resonance frequency of the system was found to be about 1.09 kHz. Figure 20 shows the effect of the ADC method, and Figure 21 and Figure 22 show the experimental results before and after the ADC method was put into use.
From Figure 20, it can be seen that, before the ADC was put into operation, the current resonance at the end of the 35 kV cable was very evident. After applying the ADC strategy to the GCC, the current resonance phenomenon at the end of the 35 kV cable was significantly suppressed.
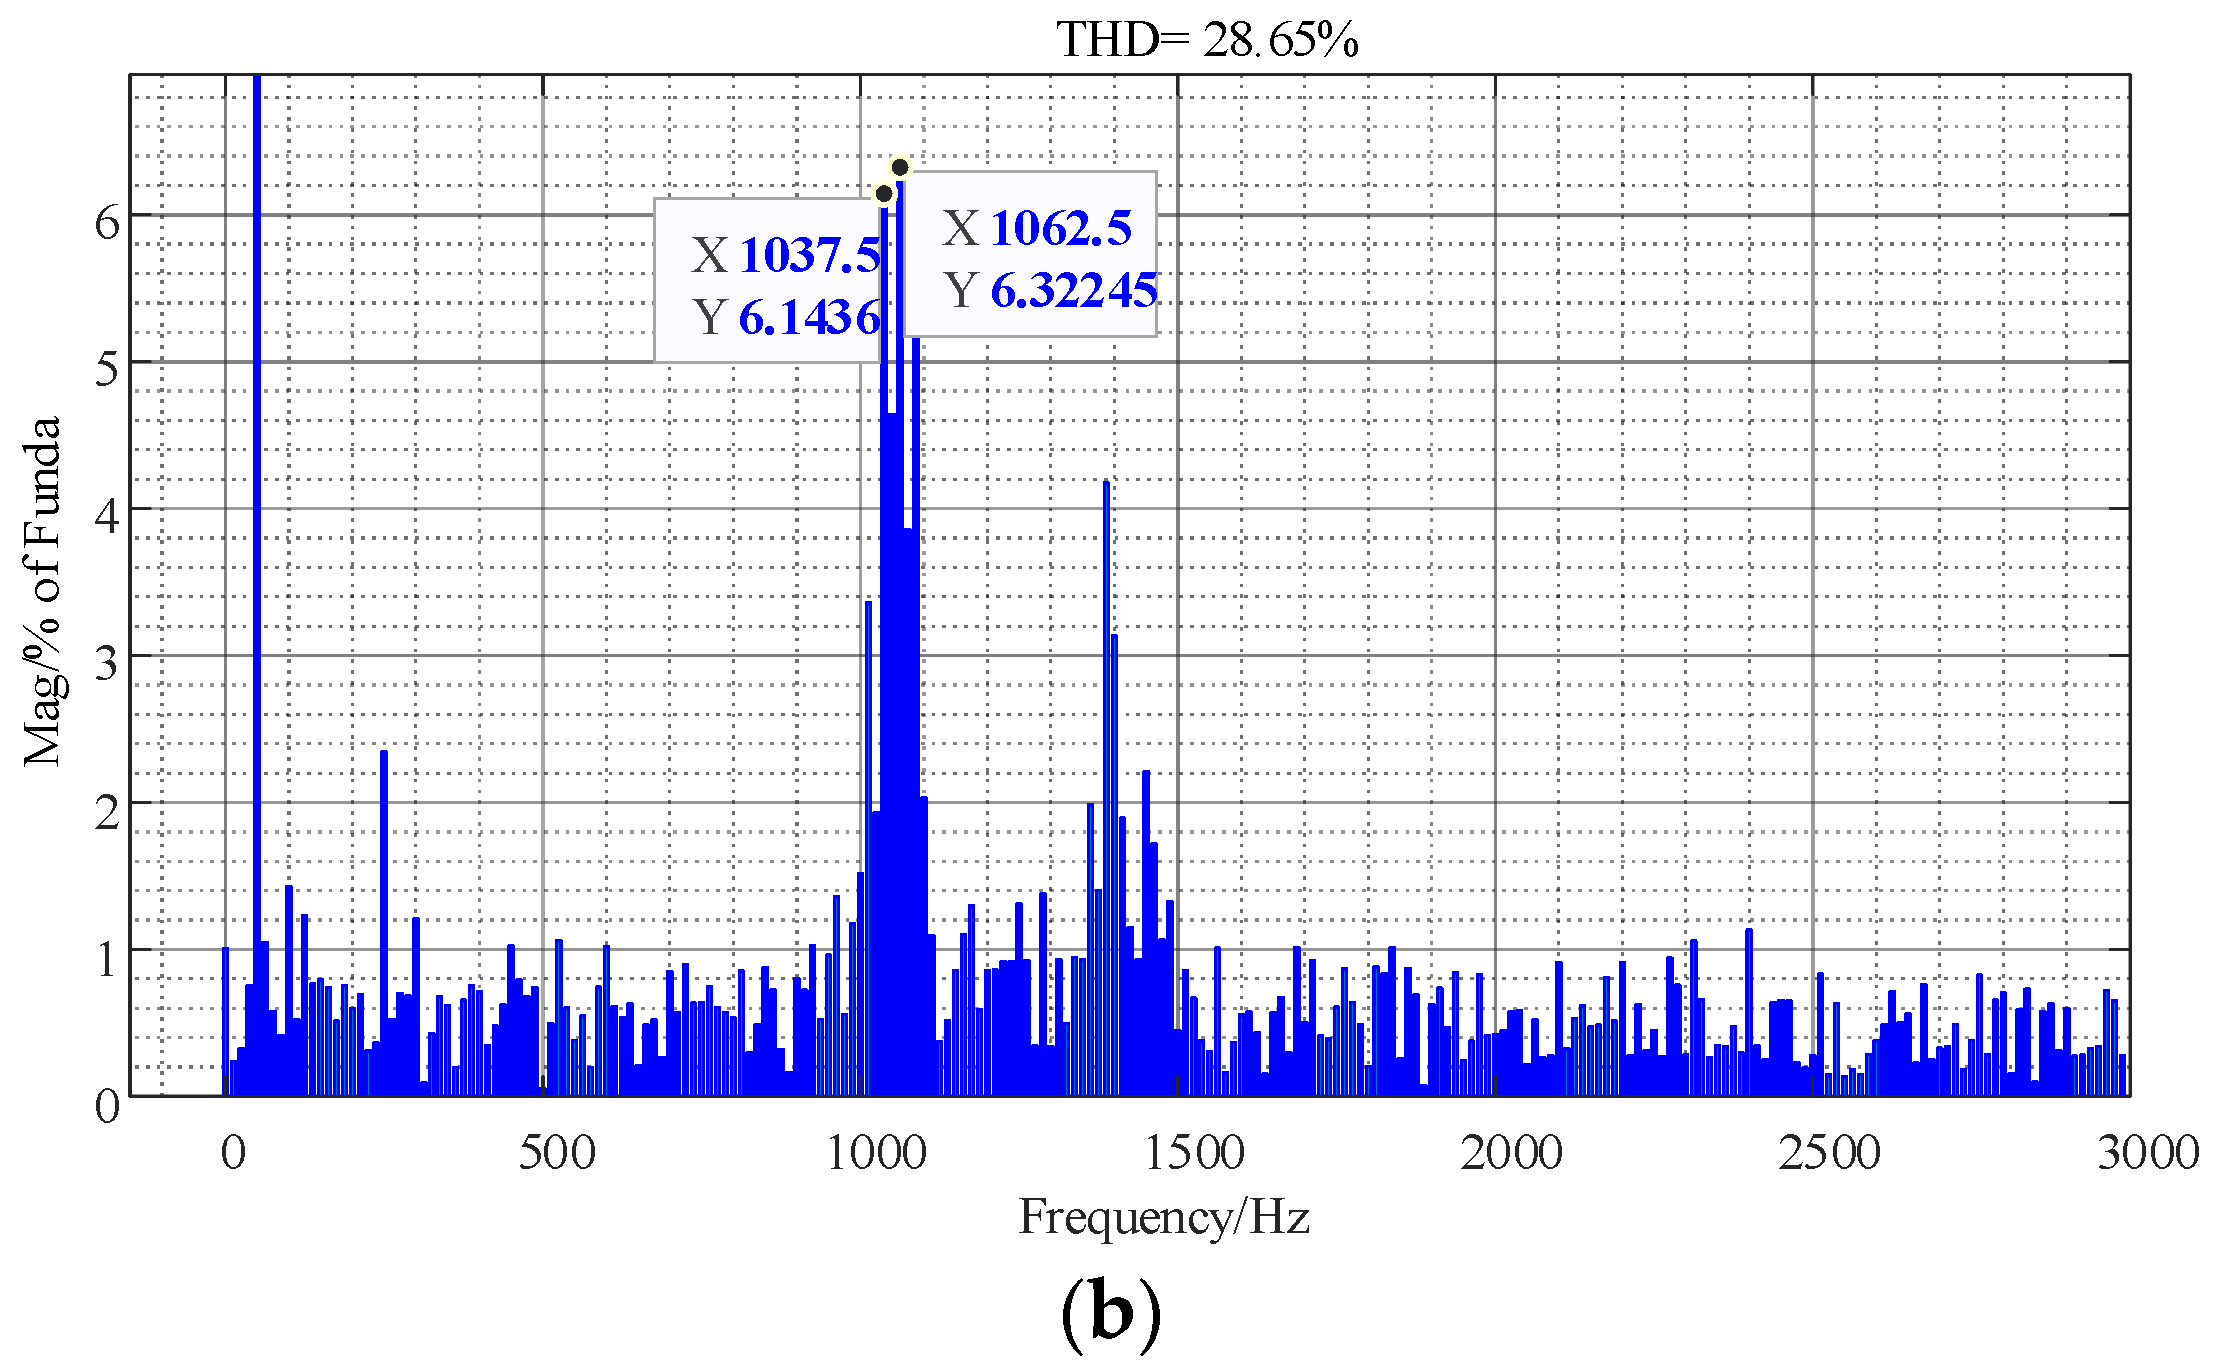
Comparing Figure 21 and Figure 22, it can be seen that, before the ADC was put into operation, the harmonic content of the current at the end of the 35 kV cable was as high as 192.78%. After the ADC was put into operation, the harmonic content of the current at the end of the 35 kV cable decreased to 28.65%, and the current harmonic phenomenon was significantly suppressed, verifying the effectiveness of the ADC strategy.

5.1.2. PDC Experiment

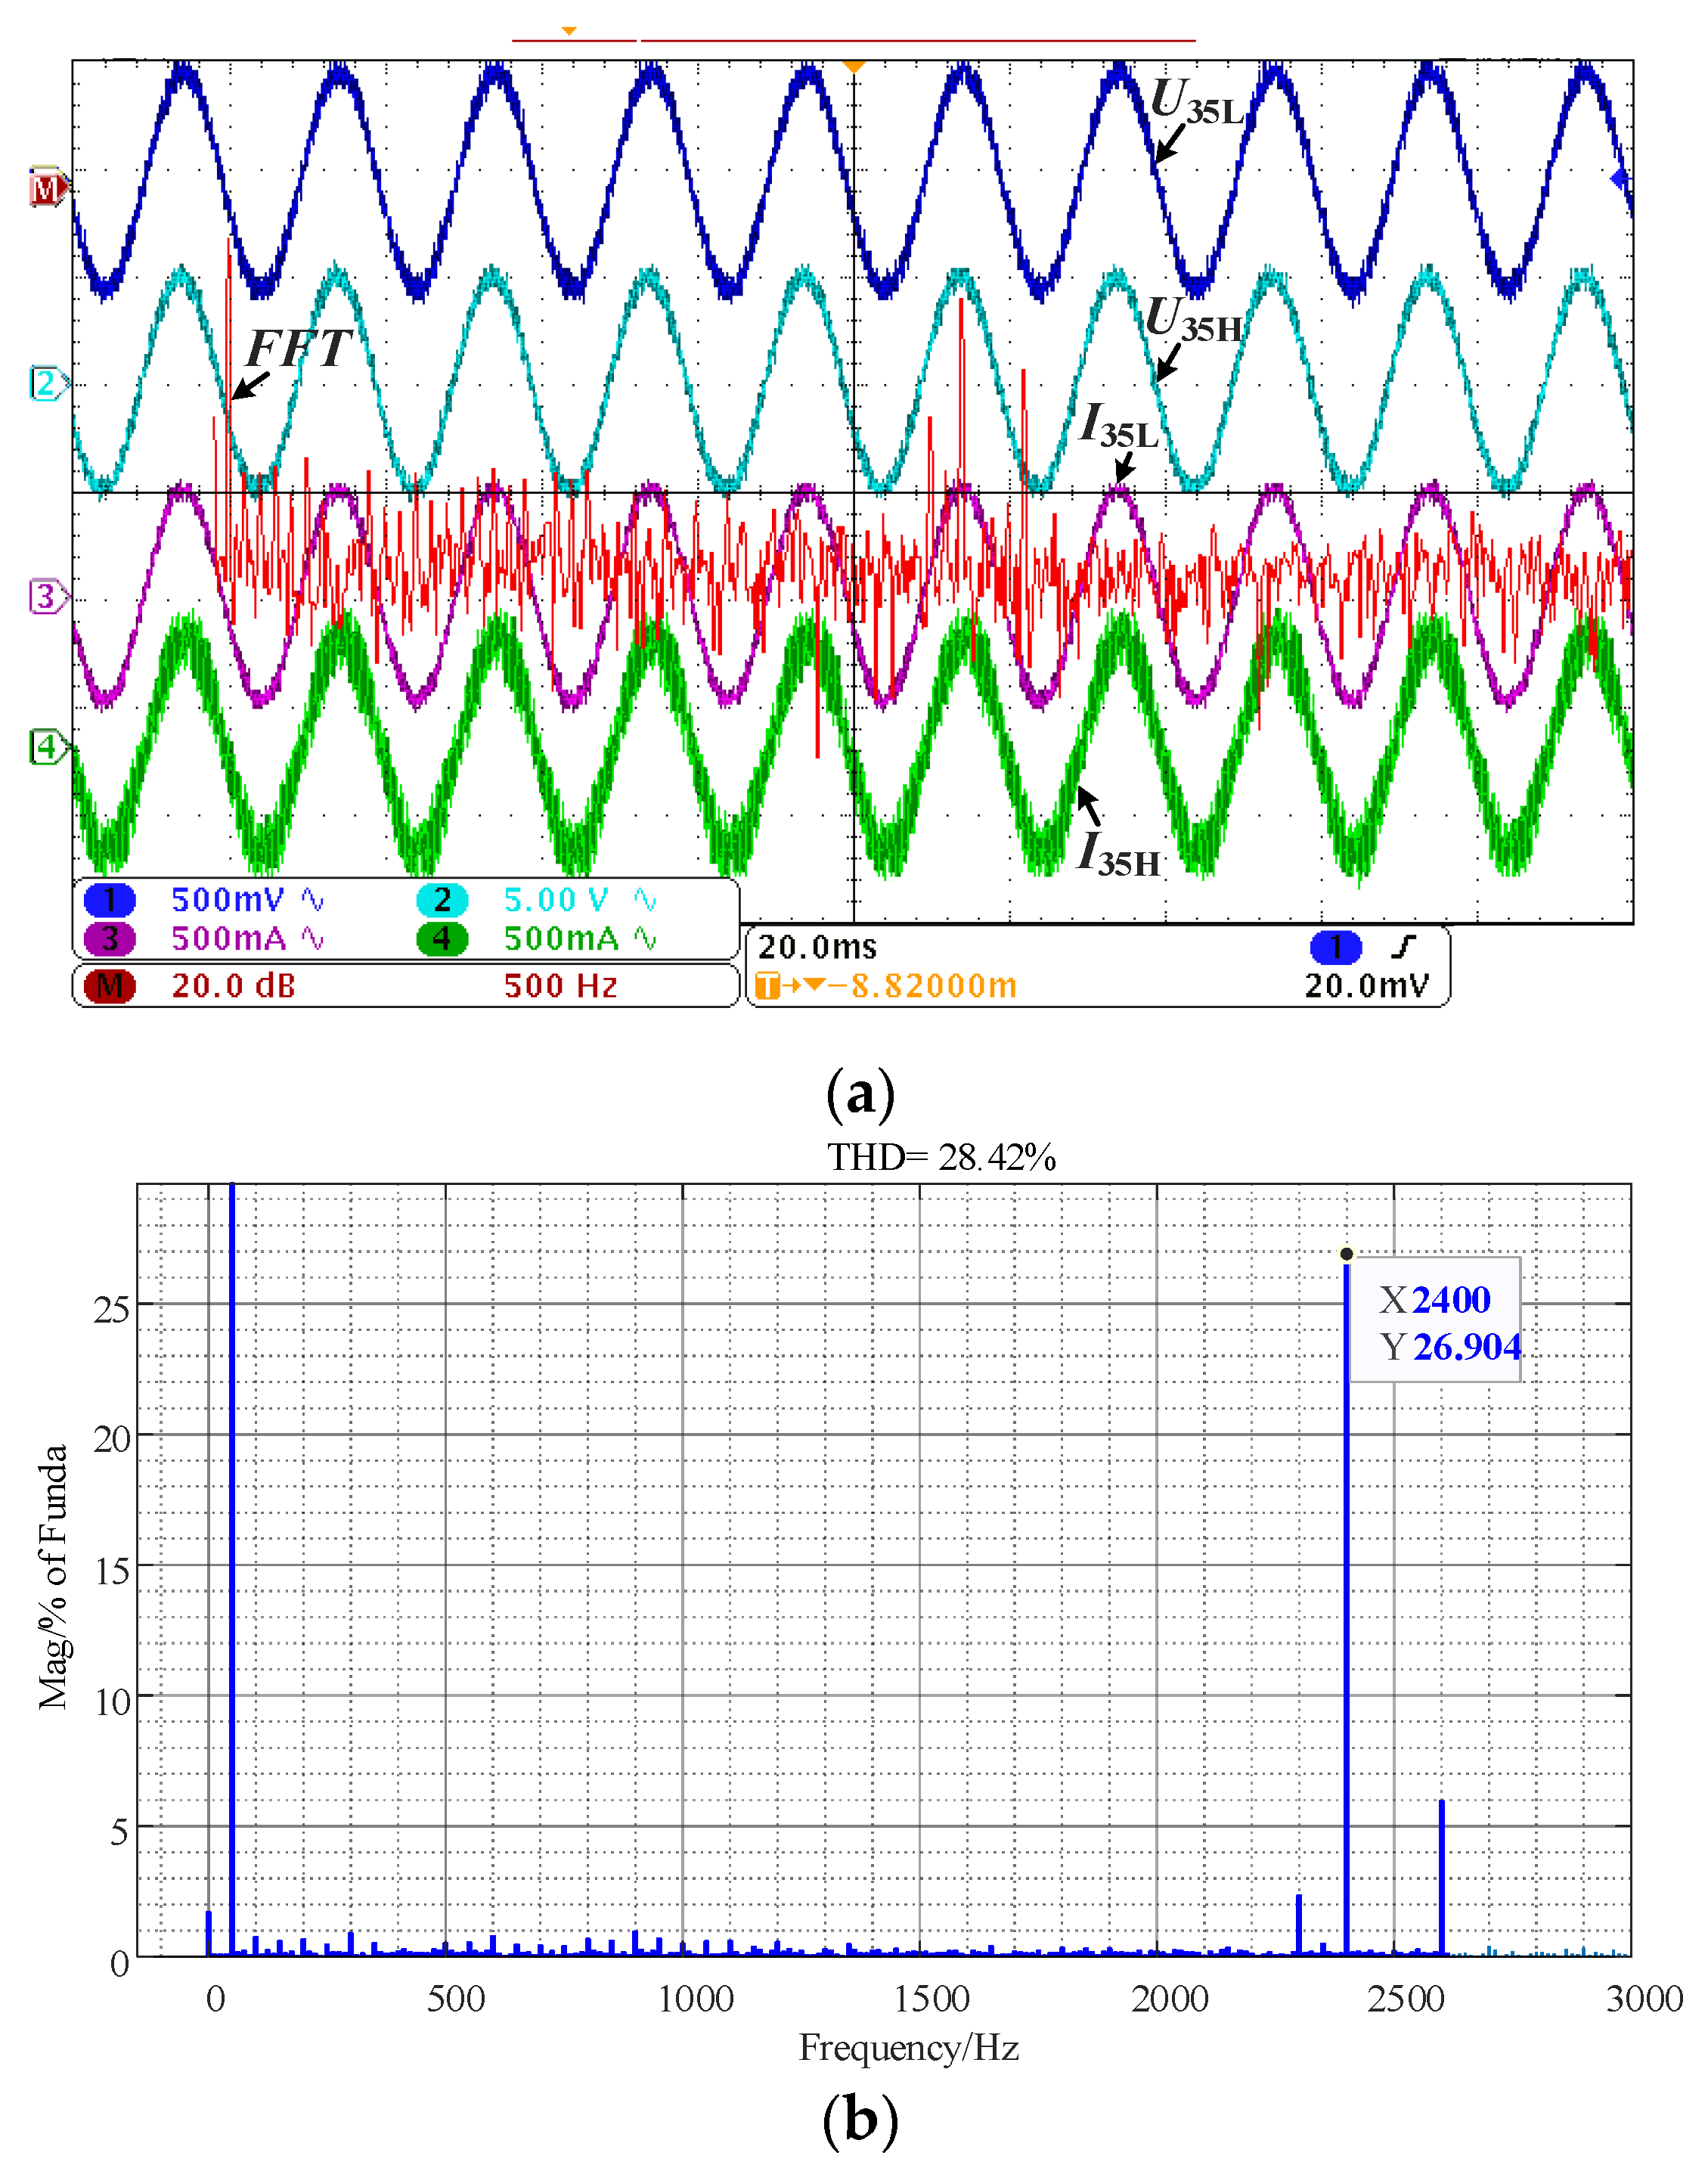
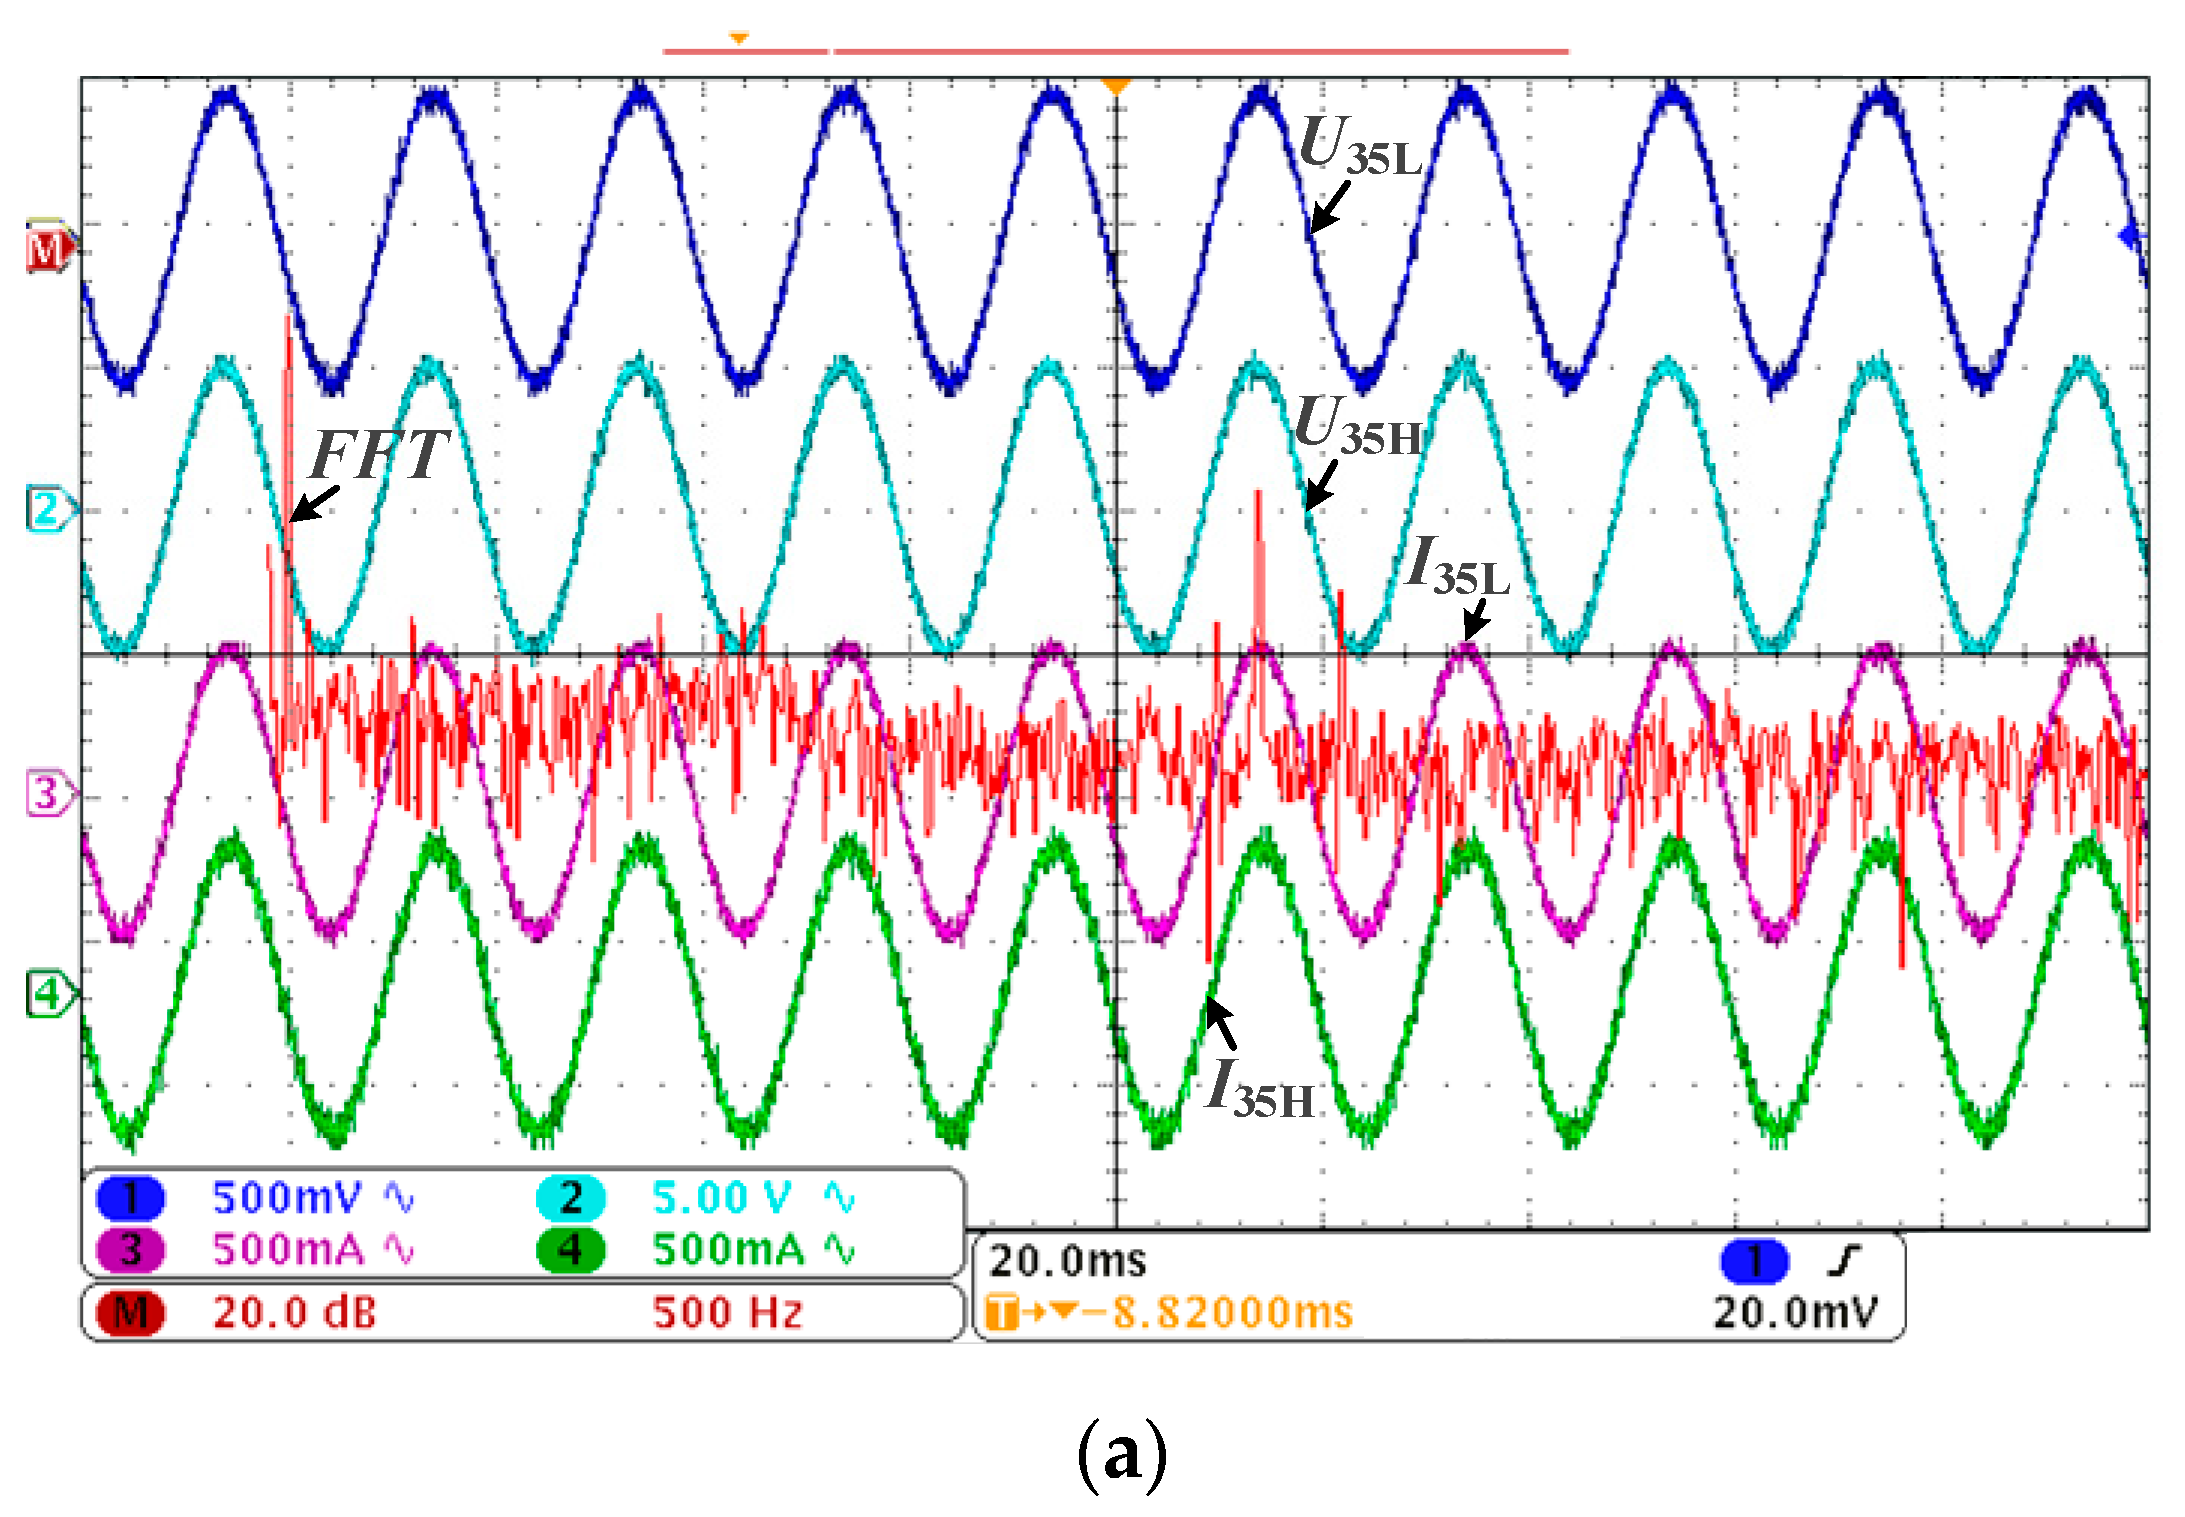
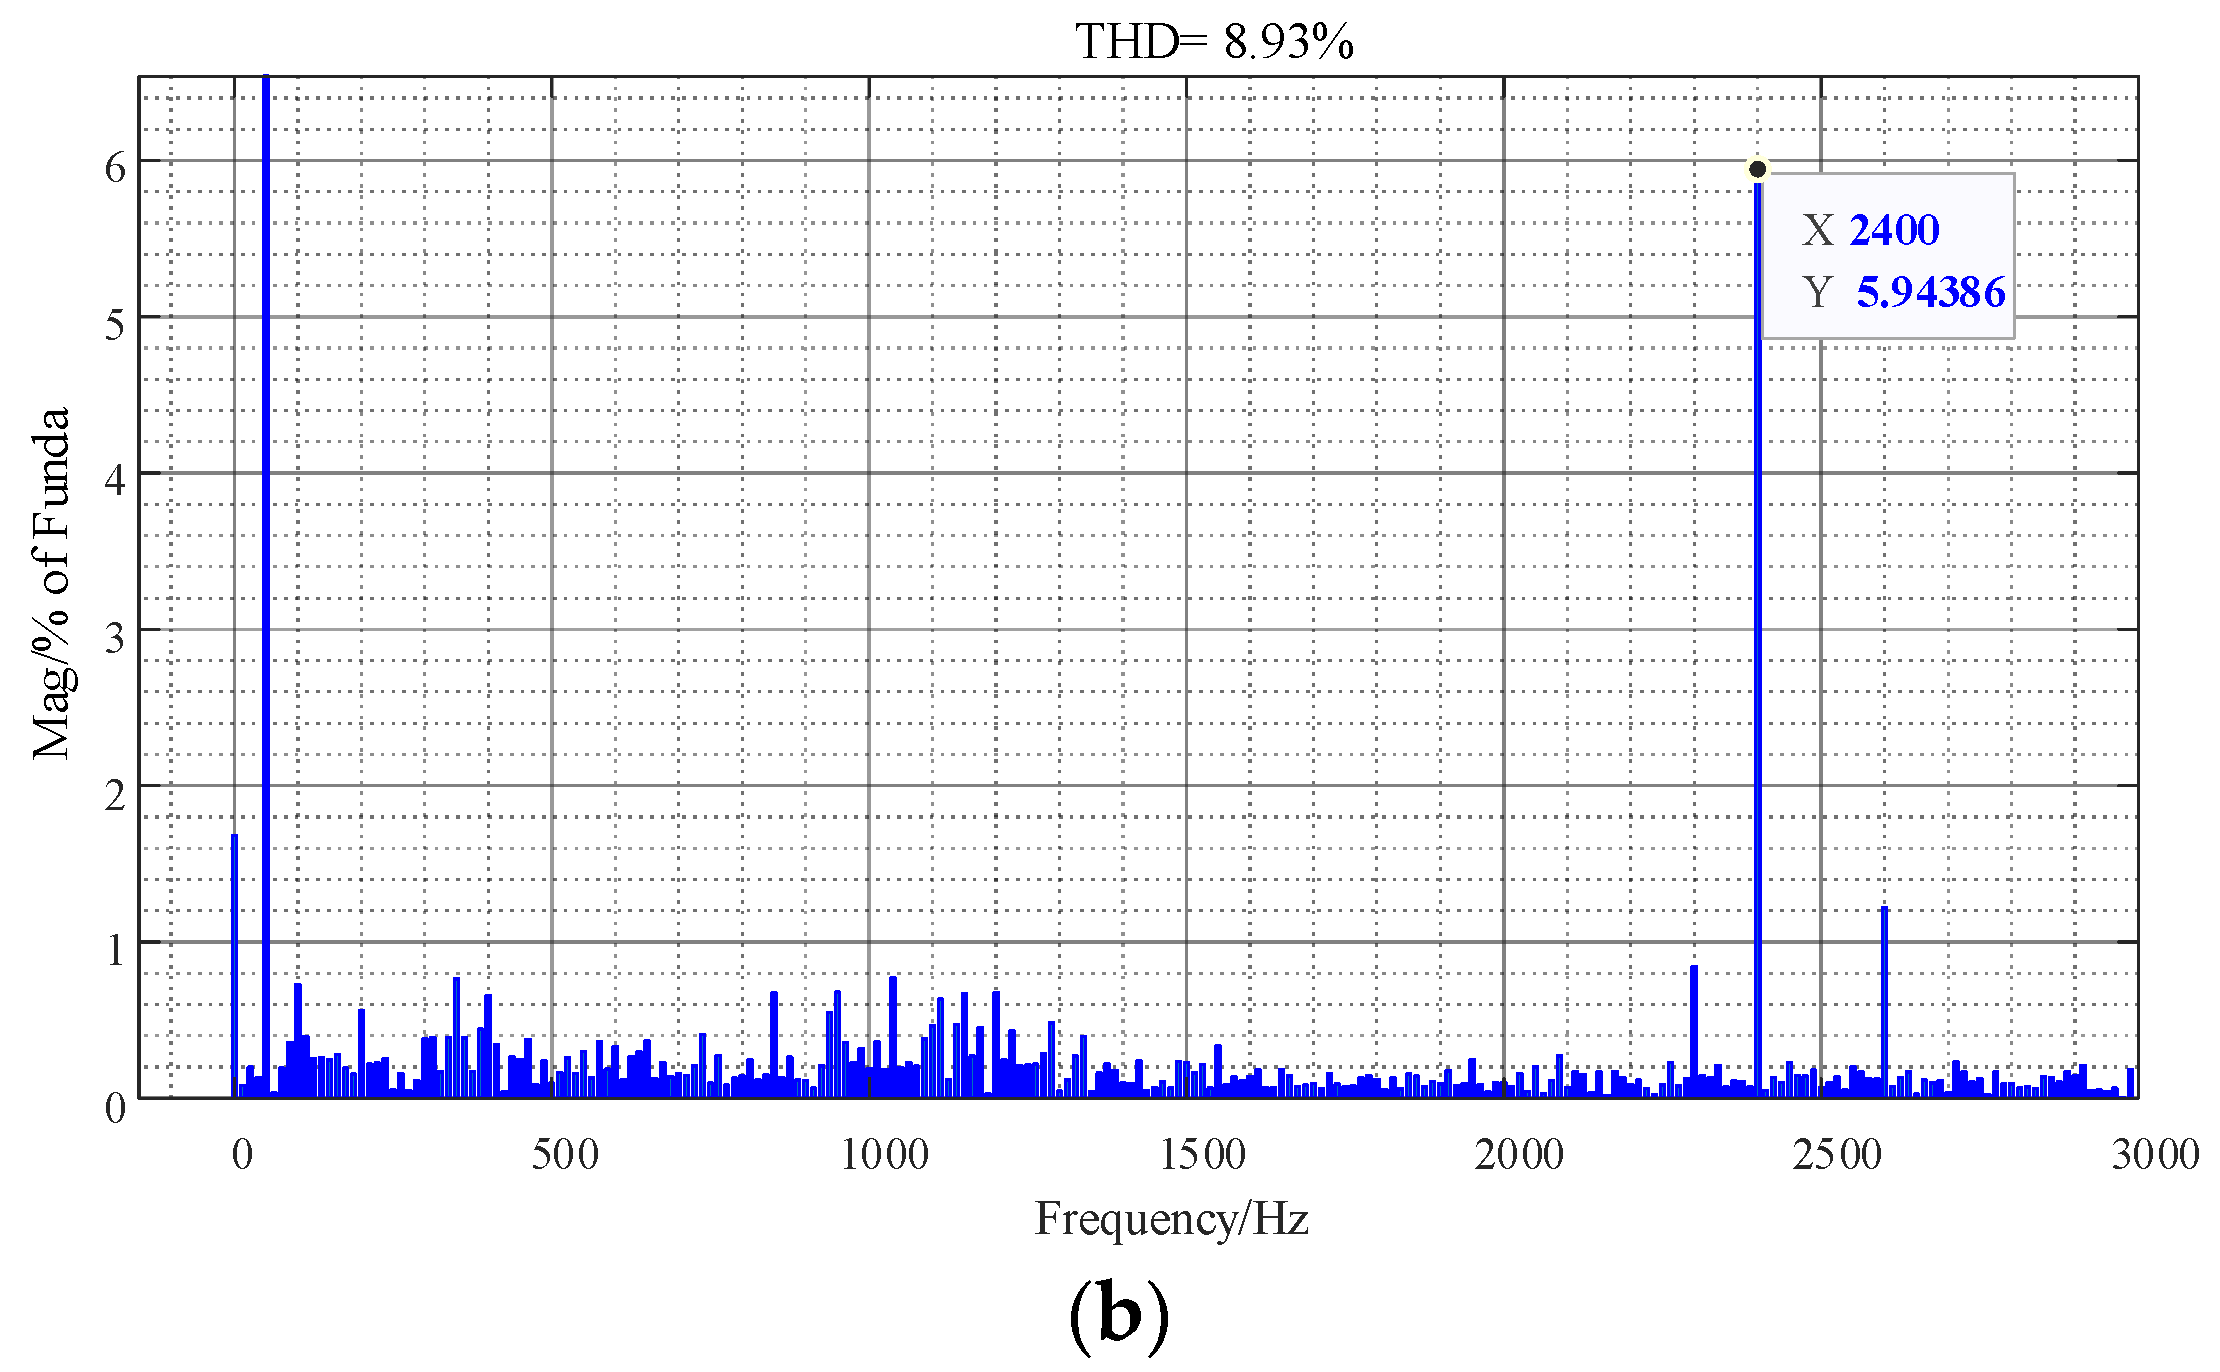
Experimental conditions: The length of the cable line was 3 km, and the other conditions remained unchanged. Through the impedance analysis, it can be concluded that the resonant frequency of the system is about 2.4 kHz, which exceeds the control bandwidth of the GCC. The ADC method is limited and can only be used to suppress current resonance. Figure 23 shows the effect of the PDC method, and Figure 24 and Figure 25 show the experimental results before and after the PDC method was put into use.
From Figure 23, it can be seen that, before the PDC was put into operation, the current resonance at the end of the 35 kV cable was very obvious. After applying the PDC strategy to the GCC, the current harmonic phenomenon at the end of the 35 kV cable was significantly suppressed.
Comparing Figure 24 and Figure 25, it can be seen that, before the PDC was put into operation, the harmonic content of the current at the end of the 35 kV cable was as high as 28.42%. After the PDC was put into operation, the harmonic content of the current at the end of the 35 kV cable decreased to 8.93%, and the current harmonic phenomenon was significantly suppressed, verifying the effectiveness of the PDC strategy.

6. Conclusions

To overcome the problem that the distributed capacitance of a cable line in an offshore wind farm collector network cannot be ignored, the impedance model of a wind turbine and cable line was established to reveal the mechanism of high-frequency resonance, the hybrid damping control method was proposed to suppress the resonance, and an experiment was performed to verify the effectiveness of the analysis results and proposed control method. The overall conclusion can be summarized in the following points:
  • There is a risk of high-frequency resonance in the wind farm, but two conditions need to be met: one is that the impedance curve of the interconnected system has an intersection, that is, there is a potential resonance frequency; second, there is a sufficient level of harmonic voltage or harmonic current at the corresponding resonant frequency.
  • With the increase in the length of the connecting cables between the WTGs and the number of wind turbine links connected to the AC convergence bus, the resonance point of the interconnected system moves to the low-frequency band; with the increase in the number of wind turbines, the resonance point of the interconnected system moves to the high-frequency band. In addition, with the increase in equivalent impedance of the 220 kV power grid, the resonance point of the interconnected system moves to the low-frequency band.
  • For the high-frequency resonance problem of the AC network of the wind farm collector line, most of the time, the range of the high-frequency resonant frequency for the wind turbine ranges from the LCL resonance frequency to the switching frequency. The hybrid damping control method combining ADC and PDC can effectively solve the broadband resonance problem caused by the capacitance of the cable line.

Author Contributions

Conceptualization, L.D. and H.W.; methodology, Y.Q., H.W., G.S., and X.C.; investigation, J.Z. and H.W.; software, H.W. and G.S.; validation, Y.Q., H.W., and G.S.; supervision, Y.Q., J.Z., and X.C.; writing—original draft, L.D. and G.S.; review and editing, G.S., H.W., J.Z., and X.C. All authors have read and agreed to the published version of the manuscript.

Funding

This research was supported by Open Fund of State Key Laboratory of Operation and Control of Renewable Energy & Storage Systems (China Electric Power Research Institute) (No. NYB51202001605).

Data Availability Statement

Not applicable.

Acknowledgments

The funding support for our work is greatly appreciated.

Conflicts of Interest

The authors declare no conflict of interest.

References

  1. Shuai, Z.; Liu, D.; Shen, J.; Tu, C.; Luo, A. Series and parallel resonance problem of wideband frequency harmonic and its elimination strategy. IEEE Trans. Power Electron. 2014, 29, 1941–1952. [Google Scholar] [CrossRef]
  2. He, J.; Li, Y.; Wang, R.; Zhang, C. Analysis and mitigation of resonance propagation in grid-connected and islanding microgrids. IEEE Trans. Energy Convers. 2015, 30, 70–81. [Google Scholar] [CrossRef]
  3. Song, Y.; Ebrahimzadeh, E.; Blaabjerg, F. Analysis of high-frequency resonance in DFIG-based offshore wind farm via long transmission cable. IEEE Trans. Energy Convers. 2018, 33, 1036–1046. [Google Scholar] [CrossRef] [Green Version]
  4. Zhang, S.; Jiang, S.; Lu, X.; Ge, B.; Peng, F. Resonance issues and damping techniques for grid-connected inverters with long transmission cable. IEEE Trans. Power Electron. 2014, 29, 110–120. [Google Scholar] [CrossRef]
  5. Sowa, I.; Domínguez-García, J.; Gomis-Bellmunt, O. Impedance-based analysis of harmonic resonances in HVDC connected offshore wind power plants. Electr. Power Syst. Res. 2019, 166, 61–72. [Google Scholar] [CrossRef]
  6. Cheah-Mane, M.; Liang, J.; Jenkins, N.; Sainz, L. Electrical resonance instability study in HVDC-connected Offshore Wind Power Plants. In Proceedings of the 2016 IEEE Power and Energy Society General Meeting (PESGM), Boston, MA, USA, 17–21 July 2016. [Google Scholar]
  7. Chen, Z.; Huang, X.; Luo, A.; Yang, J.; Yang, L. Wideband harmonic resonance characteristics and coordinated damping method for distributed generation power plants. IEEE Trans. Ind. Electron. 2019, 66, 7753–7764. [Google Scholar] [CrossRef]
  8. Chen, Z.; Luo, A.; Kuang, H.; Zhou, L.; Chen, Y.; Huang, Y. Harmonic resonance characteristics of large-scale distributed power plant in wide-band frequency domain. Electr. Power Syst. Res. 2017, 143, 53–65. [Google Scholar] [CrossRef]
  9. Xin, Y.; Tang, W.; Luan, L.; Chen, G.; Wu, H. Overvoltage protection on high-frequency switching transients in large offshore wind farms. In Proceedings of the 2016 IEEE Power and Energy Society General Meeting (PESGM), Boston, MA, USA, 17–21 July 2016. [Google Scholar]
  10. Sainz, L.; Monjo, L.; Pedra, J.; Cheah-Mane, M.; Liang, J. Effect of wind turbine converter control on wind power plant harmonic response and resonances. IET Electr. Power Appl. 2017, 11, 157–168. [Google Scholar] [CrossRef]
  11. Kunjumuhammed, L.; Pal, B.; Oates, C.; Dyke, K. The Adequacy of the present practice in dynamic aggregated modeling of wind farm systems. IEEE Trans. Sustain. Energy 2017, 8, 23–32. [Google Scholar] [CrossRef] [Green Version]
  12. Lyu, J.; Cai, X.; Molinas, M. Frequency domain stability analysis of MMC-based HVDC for wind farm integration. IEEE J. Emerg. Sel. Top. Power Electron. 2016, 4, 141–151. [Google Scholar] [CrossRef] [Green Version]
  13. Zhang, Y.; Klabunde, C.; Wolter, M. Frequency-coupled impedance modeling and resonance analysis of DFIG-based offshore wind farm with HVDC connection. IEEE Access 2020, 8, 147880–147894. [Google Scholar] [CrossRef]
  14. Xu, W.; Huang, Z.; Cui, Y.; Wang, H. Harmonic resonance mode analysis. IEEE Trans. Power Deliv. 2005, 20, 1182–1190. [Google Scholar] [CrossRef]
  15. Du, W.; Dong, W.; Wang, H.; Cao, J. Dynamic Aggregation of same wind turbine generators in parallel connection for studying oscillation stability of a wind farm. IEEE Trans. Power Syst. 2019, 34, 4694–4705. [Google Scholar] [CrossRef]
  16. Li, Z.; Hu, H.; Tang, L.; Wang, Y.; He, Z. Quantitative severity assessment and sensitivity analysis under uncertainty for harmonic resonance amplification in power systems. IEEE Trans. Power Deliv. 2020, 35, 809–818. [Google Scholar] [CrossRef]
  17. Hong, L.; Shu, W.; Wang, J.; Mian, R. Harmonic resonance investigation of a multi-inverter grid-connected system using resonance modal analysis. IEEE Trans. Power Deliv. 2019, 34, 63–72. [Google Scholar] [CrossRef]
  18. Qin, Y.; Wang, H.; Li, Y.; Cai, X.; Shi, X.; Dai, L. Research on Wideband Harmonic Resonance of Collector System in Offshore Wind Farm. In Proceedings of the Energy Conversion Congress and Exposition-Asia (ECCE), Singapore, 24–27 May 2021. [Google Scholar]
  19. Song, Y.; Ebrahimzadeh, E.; Blaabjerg, F. Sensitivity analysis of the wind farm high frequency resonance under transmission cable resistance variation. In Proceedings of the IEEE Applied Power Electronics Conference and Exposition (APEC), San Antonio, TX, USA, 4–8 March 2018. [Google Scholar]
  20. Zhang, Y.; Christian Klabunde, C.; Wolter, M. Harmonic Filtering in DFIG-based Offshore Wind Farm through Resonance Damping. In Proceedings of the 2019 IEEE PES Innovative Smart Grid Technologies Europe (ISGT-Europe), Bucharest, Romania, 29 September–2 October 2019. [Google Scholar]
  21. Zhang, Y.; Klabunde, C.; Wolter, M. Harmonic Resonance Analysis for DFIG-based Offshore Wind Farm with VSC-HVDC Connection. In Proceedings of the 2019 IEEE Milan PowerTech, Milan, Italy, 23–27 June 2019. [Google Scholar]
  22. Zha, L.; He, P.; Hu, Z.; Li, S. Research on Harmonic Resonance and Suppression Measures of Offshore Wind Farm. In Proceedings of the 2022 5th International Conference on Power and Energy Applications (ICPEA), Guangzhou, China, 18–20 November 2022. [Google Scholar]
  23. Xue, T.; Lyu, J.; Li, Y.; Wang, H.; Cai, X. A comprehensive study on impedance models of grid-tied voltage-source converters. In Proceedings of the 46th Annual Conference of the IEEE Industrial Electronics Society (IECON), Singapore, 18–21 October 2020. [Google Scholar]
  24. Xue, T.; Lyu, J.; Wang, H.; Cai, X. A Complete Impedance Model of a PMSG-Based Wind Energy Conversion System and Its Effect on the Stability Analysis of MMC-HVDC Connected Offshore Wind Farms. IEEE Trans. Energy Convers. 2021, 36, 3449–3461. [Google Scholar] [CrossRef]
  25. Zhang, C.; Cai, X.; Molinas, M.; Rygg, A. On the impedance modeling and equivalence of AC/DC-side stability analysis of a grid-tied type-IV wind turbine system. IEEE Trans. Energy Convers. 2019, 34, 1000–1009. [Google Scholar] [CrossRef]
  26. Rygg, A.; Molinas, M.; Zhang, C.; Cai, X. A modified sequence-domain impedance definition and its equivalence to the dq-domain impedance definition for the stability analysis of AC power electronic systems. IEEE J. Emerg. Sel. Top. Power Electron. 2016, 4, 1383–1396. [Google Scholar] [CrossRef] [Green Version]
Figure 1. Typical topology of offshore wind power.
Electronics 12 02638 g001
Figure 2. Control block diagram of the grid-side converter.
Electronics 12 02638 g002
Figure 3. Comparison of theoretical impedance and frequency–scan impedance of WTG.
Electronics 12 02638 g003
Figure 4. Cable transmission line model: (a) Lumped parameter model; (b) distributed parameter model.
Electronics 12 02638 g004
Figure 5. Impedance of cable line: (a) Single π-type equivalent circuit; (b) series π-type equivalent circuit.
Electronics 12 02638 g005
Figure 6. Bode diagram of simplified model and precise model of transmission line.
Electronics 12 02638 g006
Figure 7. Schematic diagram of equivalent impedance of a typical wind farm: (a) Impedance model of wind farm with single feeder; (b) impedance model of wind farm with multiple feeders.
Electronics 12 02638 g007
Figure 8. Schematic diagram of equivalent impedance of a simple system.
Electronics 12 02638 g008
Figure 9. Curve of resonance frequency changing with the number of WTGs and grid inductance (the length of cable is considered 1 km).
Electronics 12 02638 g009
Figure 10. Curve of resonance frequency changing with the number of WTGs and the length of cable line (the grid inductance is considered 0.1 mH).
Electronics 12 02638 g010
Figure 11. Schematic diagram of the investigated offshore wind farm.
Electronics 12 02638 g011
Figure 12. Bode diagram of equivalent impedance of interconnected system with different cable line lengths.
Electronics 12 02638 g012
Figure 13. Bode diagram of equivalent impedance of interconnected system under different numbers of WTGs.
Electronics 12 02638 g013
Figure 14. Bode diagram of equivalent impedance of interconnected system with different grid equivalent inductances.
Electronics 12 02638 g014
Figure 15. Block diagram of ADC for GCC.
Electronics 12 02638 g015
Figure 16. The influence of cable capacitance on the system resonance frequency.
Electronics 12 02638 g016
Figure 17. Bode wave of grid impedance and GCC impedance with ADC and without ADC.
Electronics 12 02638 g017
Figure 18. Block diagram of PDC for GCC.
Electronics 12 02638 g018
Figure 19. Bode wave of LCL filter with and without the PDC.
Electronics 12 02638 g019
Figure 20. Experimental waveform without ADC and with ADC of GCC.
Electronics 12 02638 g020
Figure 21. Experimental waveform without ADC of GCC: (a) Voltage and current waveforms of 35 kV cables; (b) current harmonic distortion of terminal 35 kV cable.
Electronics 12 02638 g021
Figure 22. Experimental waveform with ADC of GCC: (a) Voltage and current waveforms of 35 kV cables; (b) current harmonic distortion of terminal 35 kV cable.
Electronics 12 02638 g022aElectronics 12 02638 g022b
Figure 23. Experimental waveform without PDC and with PDC of GCC.
Electronics 12 02638 g023
Figure 24. Experimental waveform without PDC of GCC: (a) Voltage and current waveforms of 35 kV cables; (b) current harmonic distortion of terminal 35 kV cable.
Electronics 12 02638 g024
Figure 25. Experimental waveform with PDC of GCC: (a) Voltage and current waveforms of 35 kV cables; (b) current harmonic distortion of terminal 35 kV cable.
Electronics 12 02638 g025aElectronics 12 02638 g025b
Table 1. Simulation parameters of WTG.
ParametersSimplesValuesUnits
Rated powerP4.5MW
Grid voltage (L-L)U0.69kV
Rated DC bus voltageUdc1.2kV
DC capacitanceCdc10mF
LC Filter inductanceLf35uH
LC Filter capacitanceCf1.602mF
Damping resistanceRd0.0306Ω
Equivalent inductance of 35 kV transformerLT20uH
Equivalent inductance of 220 kV transformerLZT0.2016H
Switching frequencyfsw2500Hz
System delayTd150μs
Table 2. Parameters of cable line for 35 kV and 220 kV.
ParametersSimplesValuesUnits
35 kV unit cable line resistanceR00.3421Ω
35 kV unit cable line inductanceL00.499mH
35 kV unit cable line capacitanceC00.3305uF
220 kV unit cable line resistanceRp0.0467Ω
220 kV unit cable line inductanceLp0.461mH
220 kV unit cable line capacitanceCp0.315uF
Table 3. Intersection frequency under mechanism model and impedance model.
TypesResonance Frequency under Different Cable Lengths [Hz]
6 km4 km3 km2 km
Mechanism model1621.52029.12368.12931.1
Impedance model1641203423912946
Error−1.19%−0.24%−0.96%−0.51%
Disclaimer/Publisher’s Note: The statements, opinions and data contained in all publications are solely those of the individual author(s) and contributor(s) and not of MDPI and/or the editor(s). MDPI and/or the editor(s) disclaim responsibility for any injury to people or property resulting from any ideas, methods, instructions or products referred to in the content.