Abstract
Automated extraction of key points from three-dimensional (3D) point clouds in transmission corridors provides technical support for digital twin construction and risk management of the power grid. However, accurately and efficiently segmenting the point clouds of transmission corridors remains a challenging problem. Traditional segmentation methods for transmission corridors suffer from low accuracy and poor generalization ability, and the potential of deep learning in this field has been overlooked. Therefore, the PointNet++ deep learning model is employed as the backbone network for the segmentation of 3D point clouds in transmission corridors. Additionally, given the distinct distribution of key components, an end-to-end CA-PointNet++ architecture is proposed by integrating the Coordinate Attention (CA) module with PointNet++. This approach captures long-distance spatial contextual features and improves feature saliency for more precise segmentation. Furthermore, CA-PointNet++ is evaluated on a dataset of 3D point clouds collected by unmanned aerial vehicles (UAV) equipped with Light Detection and Ranging (LiDAR) for inspecting transmission corridors. The results show that CA-PointNet++ achieved 93.7% overall accuracy (OA) and 67.4% mean Intersection over Union (mIoU). Comparative studies with established deep learning models confirm that our proposed CA-PointNet++ exhibits high accuracy and strong generalization ability for point cloud segmentation tasks in transmission corridors.
1. Introduction
The electric power transmission grid is a crucial component of the power system infrastructure, serving as the primary carrier for long-distance transmission of electricity. Monitoring its operational status is critical for ensuring safety and has always been a priority for power system maintenance and management departments. However, traditional methods for transmission grid inspection typically rely on professional personnel supplemented by laser rangefinders, optical theodolites, and other related equipment to complete the inspection. These methods have drawbacks such as safety risks and low efficiency and cannot meet the needs of power system management or the requirements of power grid development and institutional reform [1]. For reliable and safe transmission of power resources, ultra-high voltage (UHV)/High voltage (HV) grids call for an advanced, scientific, and efficient power inspection mode [2].
Amidst the context of the smart grid, efficient inspection methods that utilize information processing techniques such as electric big data and computer vision have sparked a trend in intelligent identification and prevention of safety risks [3,4]. In the field of electric power, two-dimensional (2D) images have played an important role in safety production monitoring, defect detection, and other areas; however, they have limitations in spatial distance perception [5]. Taking into account the advantages of spatial distance measurement, three-dimensional (3D) point cloud technology is increasingly being recognized and effectively applied in various industrial domains [6]. In the power industry, there is a growing appreciation for the potential of 3D point cloud technology. With the rapid development of high-resolution and fine remote sensing technology, unmanned aerial vehicles (UAVs) equipped with light detection and ranging (LiDAR) can quickly acquire high-precision and high-density 3D spatial geometry information of transmission grids, providing advantages such as high efficiency, no wireless loss, and immunity to terrain conditions [7,8]. UAVs fly along the transmission line corridor and use onboard LiDAR to scan the line, towers, and surrounding environmental point clouds, thereby establishing a high-precision digital model of the transmission line corridor [9,10,11]. As a consequence, the integration of remote sensing techniques, such as acquiring point cloud data through UAVs, with research in the field of computer vision holds tremendous potential for intelligent detection in transmission corridors [1].
With the emergence of the concept of a digital twin in the power grid, research on mapping the physical scenes of transmission corridors into virtual digital representations has garnered significant attention. This facilitates comprehensive awareness and fine-grained management of the power system [12]. For instance, in the case of transmission lines, trees located too close to the conductors can cause line tripping or even lead to fires [13]. By utilizing digital twins, it becomes easier to assess the clearance distance between trees and conductors within a specific area and even identify potential tree-related hazards as the vegetation grows or under different weather conditions in the power corridor [14]. Similarly, during live-line work, the distance between workers and transmission lines or towers has a significant impact on worker safety [15,16]. By reconstructing a digital twin of specific corridors, including the lines and towers, it becomes possible to simulate live-line work and mitigate safety hazards in real-world projects. The construction of a digital twin for the power grid heavily relies on the accurate reconstruction of typical power equipment and surrounding environments. Many scholars have already explored the reconstruction of power facilities based on 3D point cloud data [17]. Based on 3D point cloud data, key elements such as transmission lines, towers, and the surrounding environment are extracted to achieve the segmentation of transmission corridor scenes, which provides support for the reverse construction of a 3D digital model of transmission corridor scenes. However, there are still some pressing issues that need to be addressed in order to automatically and accurately extract the individual parts from the complex 3D point clouds of transmission corridors, which is crucial in digital twin modeling.
In the context of transmission corridor scenes, the primary focus of segmentation includes power lines, towers, and vegetation. In the field of vegetation, Knapp et al. [18] proposed integrating LiDAR remote sensing with dynamic modeling of tropical forests, revealing the future potential of related research. Kohek et al. [19] suggested automating the simulation of forest growth using LiDAR-derived point cloud data and predicting and estimating the growth status of forests. These studies present promising opportunities for vegetation segmentation, laying the foundation for establishing dynamic models of vegetation in transmission corridors [20]. Currently, there are mainly three methods for extracting transmission corridor components from LiDAR point clouds: rule-based methods, machine learning-based methods, and deep learning-based methods. The rule-based method, which utilizes prior knowledge to formulate constraints such as elevation thresholds, linear constraints, and spatial positional constraints, is the most conventional approach for scene segmentation. Jwa et al. [21] applied voxel-based classification and Line Compass Filtering (LCF) to the point cloud data and then utilized the Hough transform (HT) on the projected point clouds to extract the transmission lines. Zhang et al. [22] extracted power lines by estimating height similarity and clustering linear features based on the local distribution characteristics of denoised point clouds in sparse grids, and the characteristics of grids in both horizontal and vertical directions were analyzed to identify transmission towers. Chen et al. [23] utilized the spatial topology and geometric features of transmission towers to achieve a coarse extraction of towers, combined region growth, and the random sample consensus (RANSAC) algorithm to accurately extract multiple types of towers. However, these rule-based methods require extremely high regularity in the spatial distribution of point cloud scenes, and the accuracy is greatly affected when there is missing data. When significant changes occur in the terrain, towers, and other factors in transmission corridors, corresponding judgment criteria need to be adjusted to adapt to the scene changes. In response to the above issues, some scholars have proposed the supervised classification approach, which extracts global and local representative point feature descriptors such as density, flatness, and curvature from training samples and then uses the geometric structural information to classify the point clouds into predefined semantic categories through machine learning classification models. Guo et al. [24] defined over ten features using points as input and utilized the JointBoost classifier to classify ground and power lines while considering contextual relationships. Toschi et al. [25] fed the five deep features into a random forest classifier to extract the transmission line point clouds and further implement the model reconstruction. However, it is still subject to factors such as the strong subjectivity of handcrafted features and the complexity of hyperparameter tuning. Moreover, when extended to complex transmission corridor scenarios, the generalization ability and accuracy of point cloud classification are not satisfactory [26].
In view of the excellent performance of deep learning in 2D image processing, scholars have applied it to the classification and segmentation tasks of 3D point clouds, which can be divided into indirect and direct methods. One approach in the former method is to project the point clouds from multiple viewpoints into 2D images and then process them with a 2D convolutional neural network. In contrast, Su et al. [27] proposed multi-view convolutional neural networks (MVCNN) based on multiple 2D images from different views that extract 3D shape descriptors to achieve 3D object recognition. Although the above processing method reduces the complexity of the network to some extent, it may cause a loss of 3D spatial information [28]. Another indirect approach is voxelization-based methods, and Maturana et al. [29] proposed the Voxnet model, an end-to-end object detection neural network for voxelized point clouds. Nevertheless, this method’s drawbacks include the potential loss of resolution and the associated increase in memory utilization. In contrast to the indirect methods above, direct methods take the raw point clouds as the input to the deep learning model. As it has not undergone complex transformations, it retains more information and has become a key research object in recent years. Qi et al. [30] proposed a PointNet for direct processing of irregular and unstructured point clouds, regarded as the pioneer of end-to-end direct processing of point cloud data, which can be used for classification, part segmentation, and scene segmentation. However, PointNet only considers global features and may suffer from information loss in the local structure. In response to the aforementioned limitations, Qi et al. [31] proposed an improved version of PointNet called PointNet++, which adds a local feature extraction module on top of PointNet. Subsequently, some algorithms, such as PointCNN [32], DGCNN [33], and ShellNet [34], were proposed by improving domain feature extraction and the convolution kernel. PointCNN [32] proposed hierarchical convolution and the X-Conv operator. DGCNN [33] emphasized the dynamic generation of node neighbors, with its core being the EdgeConv operator. ShellNet [34] is a lightweight and efficient neural network structure based on the ShellConv operator. However, these algorithms have achieved good results on publicly available indoor scene datasets, and their performance on large-scale outdoor datasets is still to be further confirmed. Meanwhile, as an important and classic outdoor scene, there are only a few examples of applying point cloud-related deep learning algorithms to the segmentation of transmission corridors [35,36], and the potential of deep learning in this field is overlooked.
Although a significant amount of research has been conducted on the segmentation of transmission corridors, there are still some limitations. Firstly, existing studies have mostly focused on extracting transmission lines, with less attention paid to equally important components such as transmission towers and ground wires, which are crucial for building a digital twin of the power grid. Secondly, when applying deep learning models to semantic segmentation in transmission corridors, the accuracy of segmenting each component needs to be improved due to the presence of invalid position information and channel information. Due to the lightweight structure and robustness of the PointNet++ model, it has been widely used in the industrial field. Therefore, in this paper, the CA-PointNet++ model is proposed, with PointNet++ as the backbone network, embedded with a Coordinate Attention (CA) [37] module to integrate channel relationships and feature space position information. The proposed CA-PointNet++ structure is applied to a 3D point cloud data set of transmission corridors collected by UAVs carrying LiDAR from Jiangsu, Hubei, and Sichuan provinces, segmenting the transmission corridor into transmission lines, towers, ground wires, and ground, which lays the foundation for the digital twin modeling of transmission corridors. The main contributions of this paper are as follows:
- Proposing a novel end-to-end CA-PointNet++ network for semantic segmentation. To improve segmentation accuracy, a Coordinate Attention module is embedded to integrate channel relationships and feature space position information, suppressing unimportant information in the 3D point clouds.
- Applying the proposed improved deep learning network to the actual collected transmission corridor data set for semantic segmentation, accurately dividing the transmission corridor into transmission lines, towers, ground wires, and ground, effectively demonstrating the feasibility and effectiveness of the model.
- Conducting a comprehensive comparative analysis of the segmentation effect of different attention modules embedded in the backbone network in transmission corridor semantic segmentation, verifying the superiority of the proposed model.
2. Methodology
In this section, we first provide an overview of the proposed CA-PointNet++ model’s network architecture, which utilizes an embedded attention mechanism to enhance the accuracy of 3D point cloud segmentation in transmission corridor scenes. Furthermore, we present a detailed description of the CA module’s structure as well as the specific structure and implementation process of incorporating the CA module into the PointNet++ model to form the CA-PointNet++ model.
2.1. CA-PointNet++ Framework
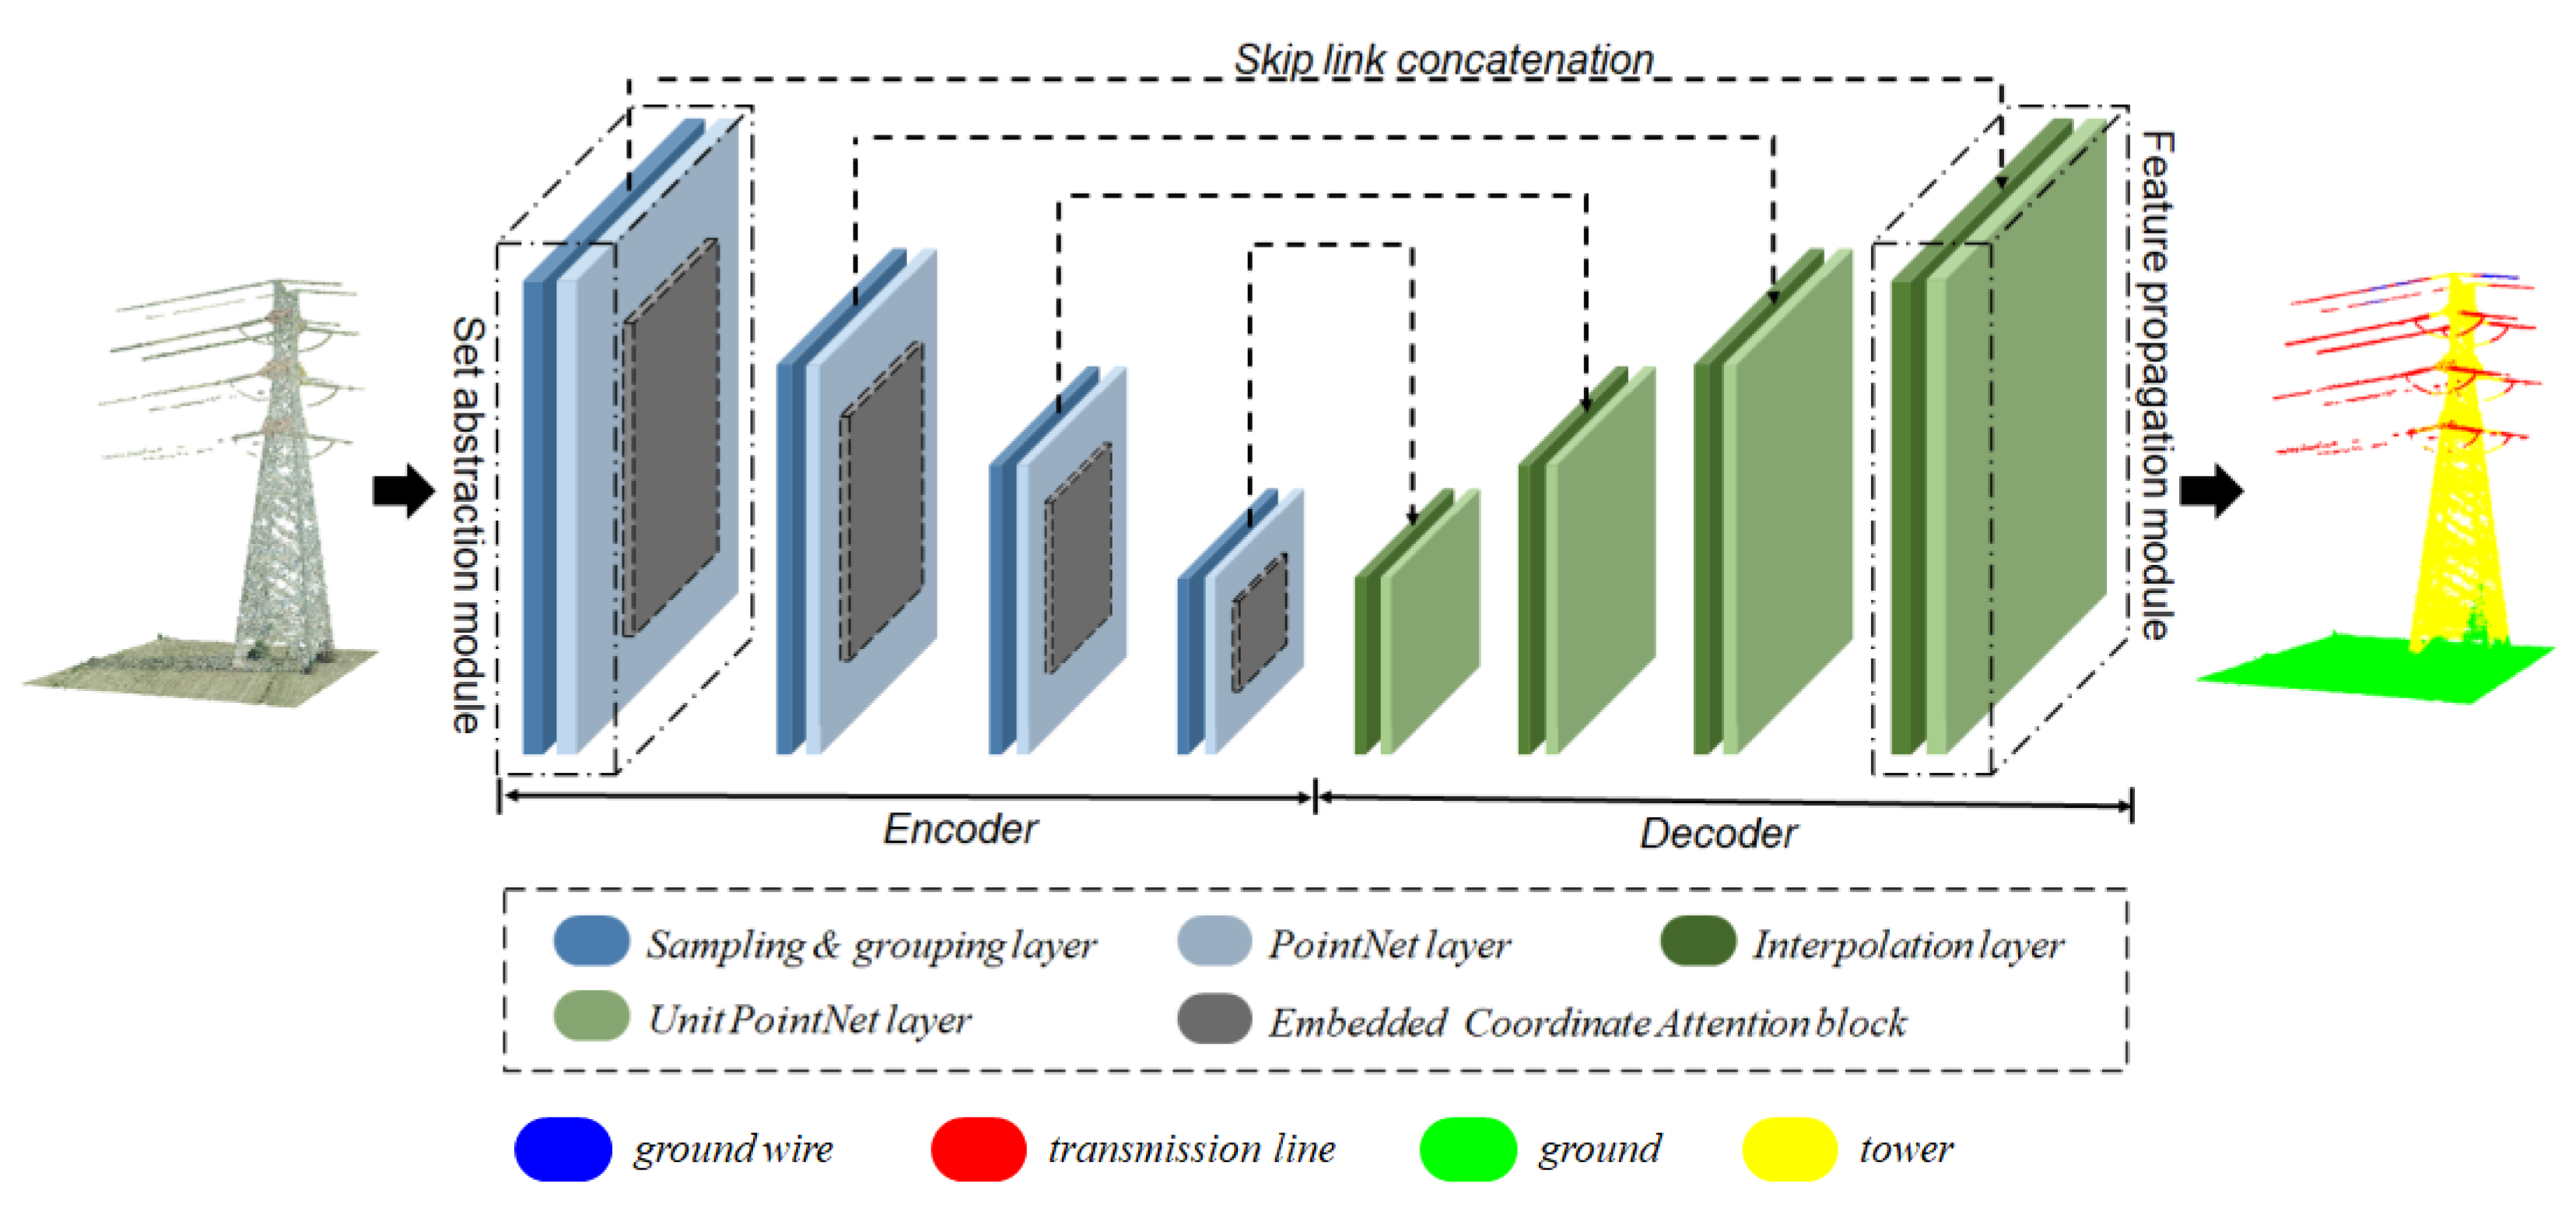
When applying deep learning methods to point cloud segmentation tasks, challenges arise due to the inability to ignore irrelevant feature information and insufficient exploration of spatial relationships, resulting in high computational costs and suboptimal accuracy. In the context of 3D point cloud semantic segmentation, a CA-PointNet++ network architecture is proposed, which combines the CA module with the PointNet++ model. Figure 1 illustrates the framework of CA-PointNet++.
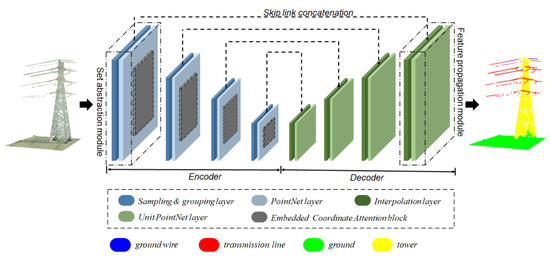
Figure 1.
An illustration of the proposed CA-PointNet++.
PointNet++ serves as the backbone network, consisting of an encoder and a decoder. The encoder consists of four cascaded set abstraction modules, with each set abstraction module embedded with the corresponding CA module to capture important features and spatial relationships within the point cloud data. Similarly, the decoder is composed of four corresponding feature propagation modules. The following subsections will introduce the network structure of the Coordinate Attention block and the CA-PointNet++ model, providing detailed explanations of the composition of the individual set abstraction module and the feature propagation module.
2.2. Coordinate Attention
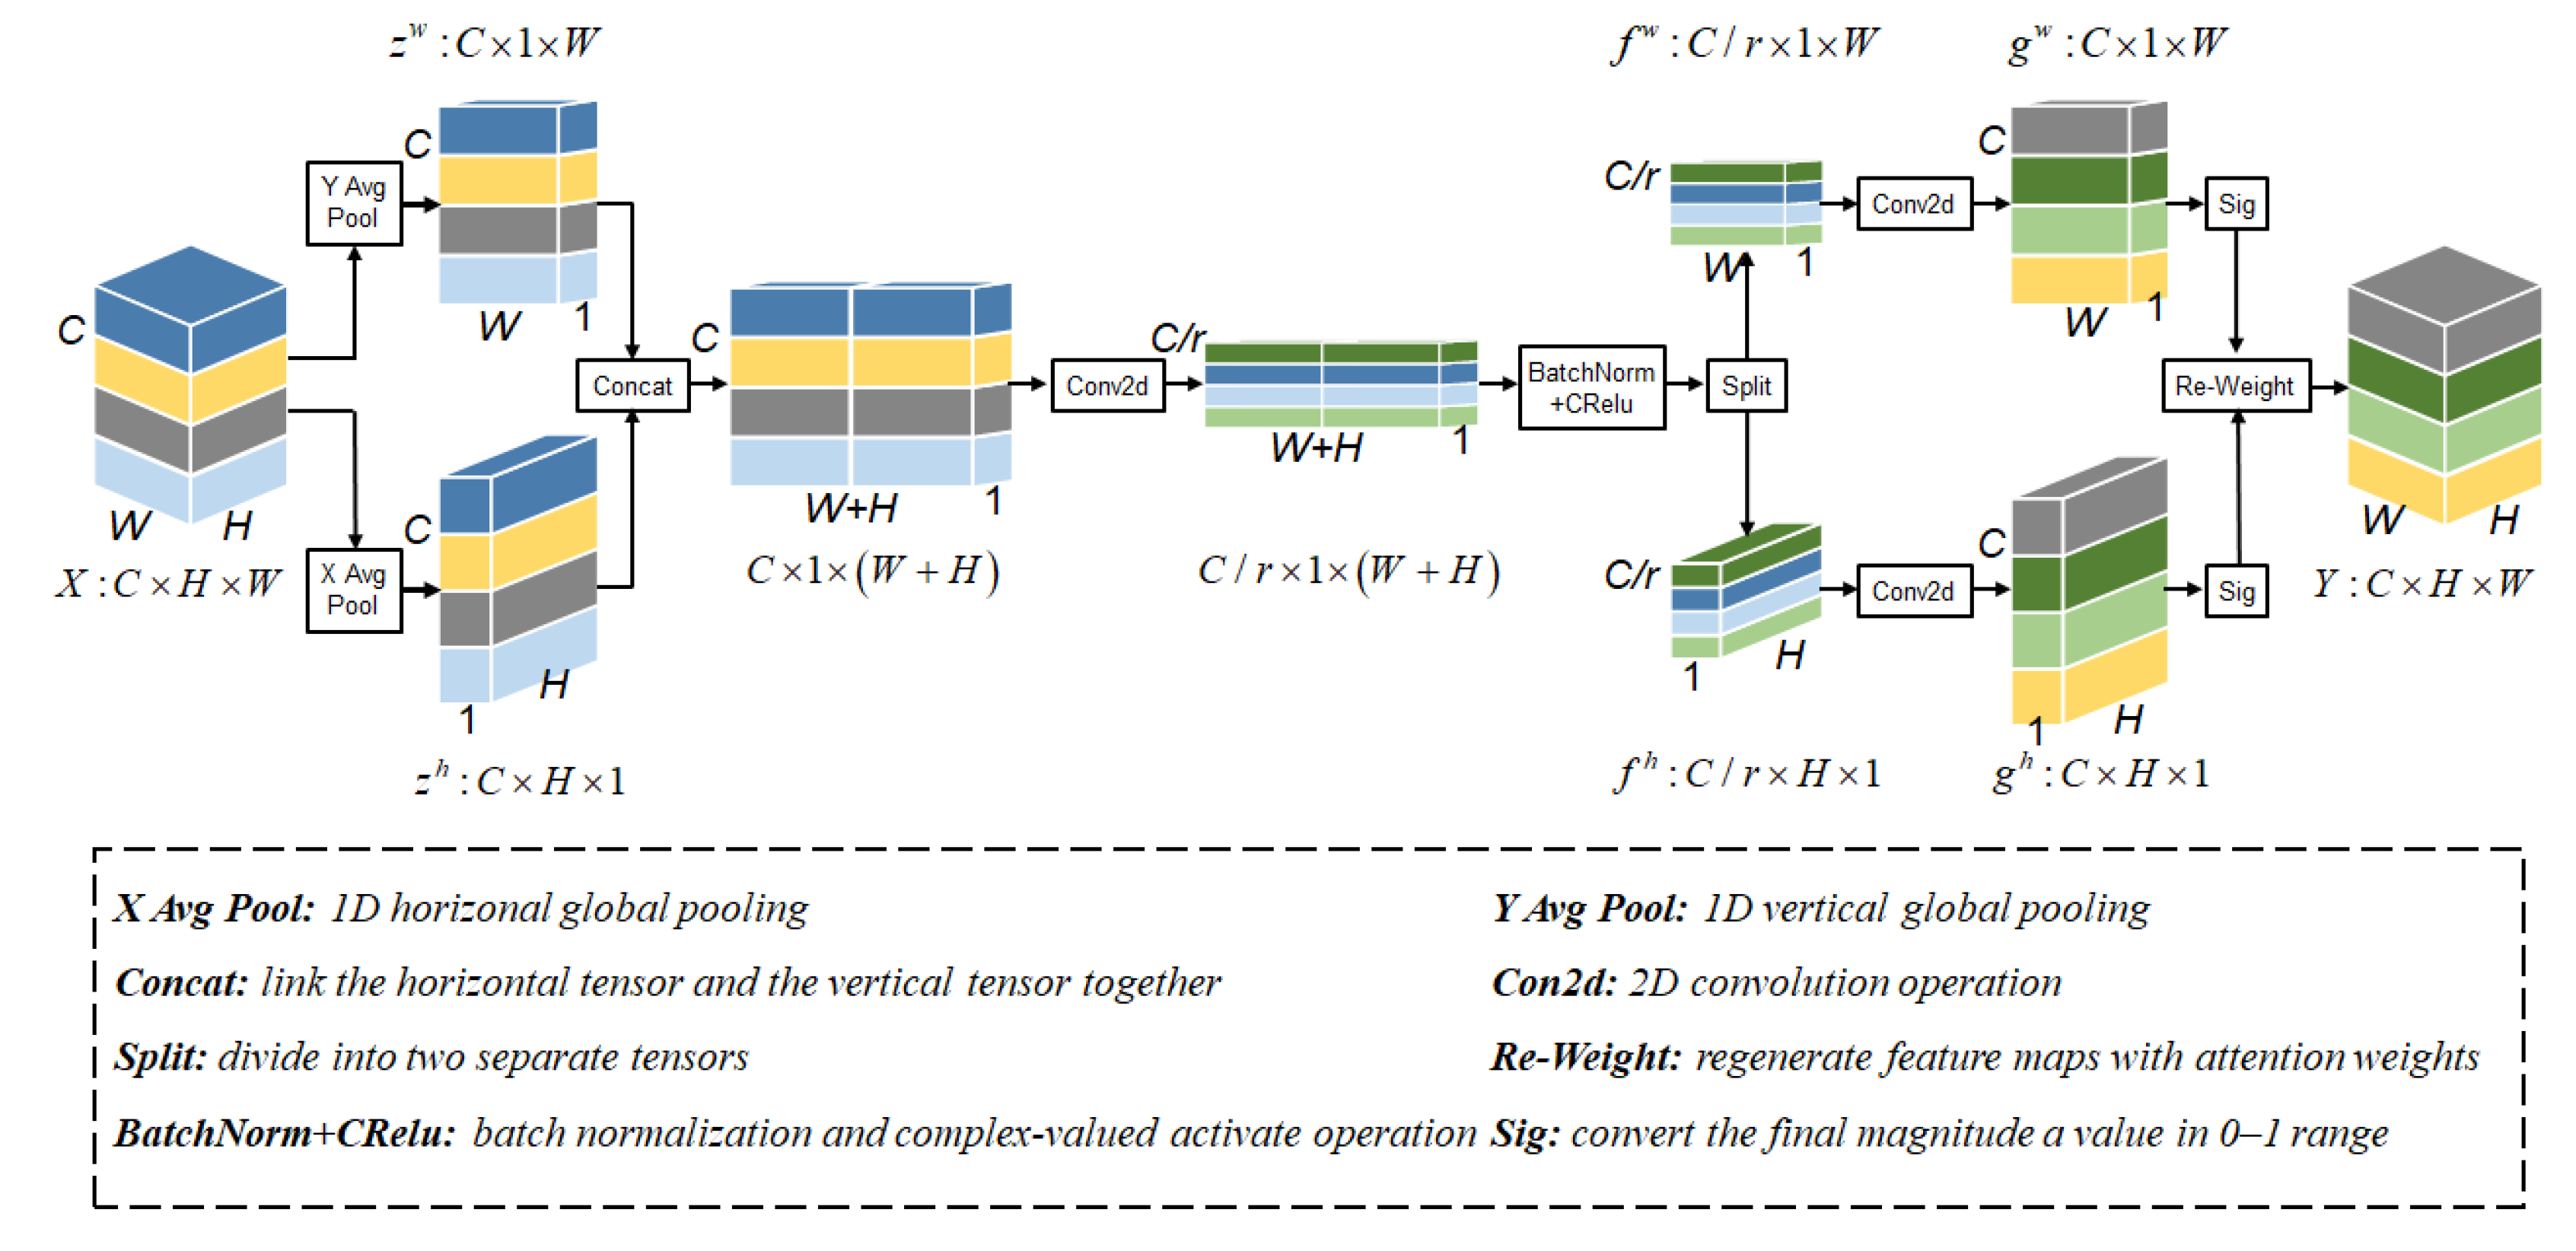
Compared with typical attention mechanism modules, the squeeze-and-excitation (SE) attention module [38] only considers the importance of channels while ignoring positional information, and the convolutional block attention module (CBAM) [39] only focuses on local positional correlation, leading to insufficient long-range dependency. In contrast, the CA module embeds positional information into channel attention, which helps the model locate the regions of interest more accurately [37]. Figure 2 shows the structure of the CA module.
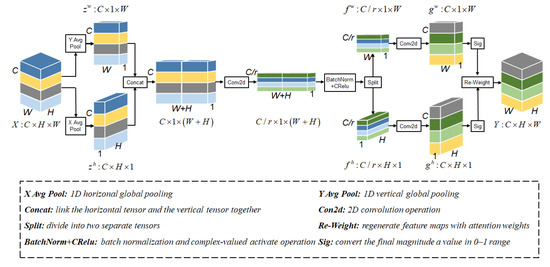
Figure 2.
An illustration of the Coordinate Attention module.
Given an input feature map , where H, W, and C represent the height, width, and number of channels, respectively, the CA module computes a set of spatial coordinates as follows: The CA module first considers embedding coordinate information by using two one-dimensional global pooling operations to encode each channel of the input along the vertical and horizontal directions, respectively. The expression of the c channel with height h is as follows:
Similarly, the output expression of the c channel with width w is as follows:
Then, Coordinate Attention is generated by concatenating the two feature maps generated above, followed by convolutional dimension reduction and activation to generate an intermediate feature map of spatial information.
where F1 is a 1 × 1 convolutional kernel; δ is a non-linear activation function; is the feature map in two directions; and r is the downsampling ratio.
The resulting f is then converted into two separate tensors and along the spatial dimension, and the convolutional kernels are used to transform the two feature maps, respectively.
where σ is the sigmoid function; Fh and Fw are both 1×1 convolutional kernels; and g represents the attention weight.
Considering the above weight, for the original feature map X passed through the CA module, after multiplication weighting calculation in the width and height directions, the output tensor expression is as follows:
2.3. Proposed CA-PointNet++ Model
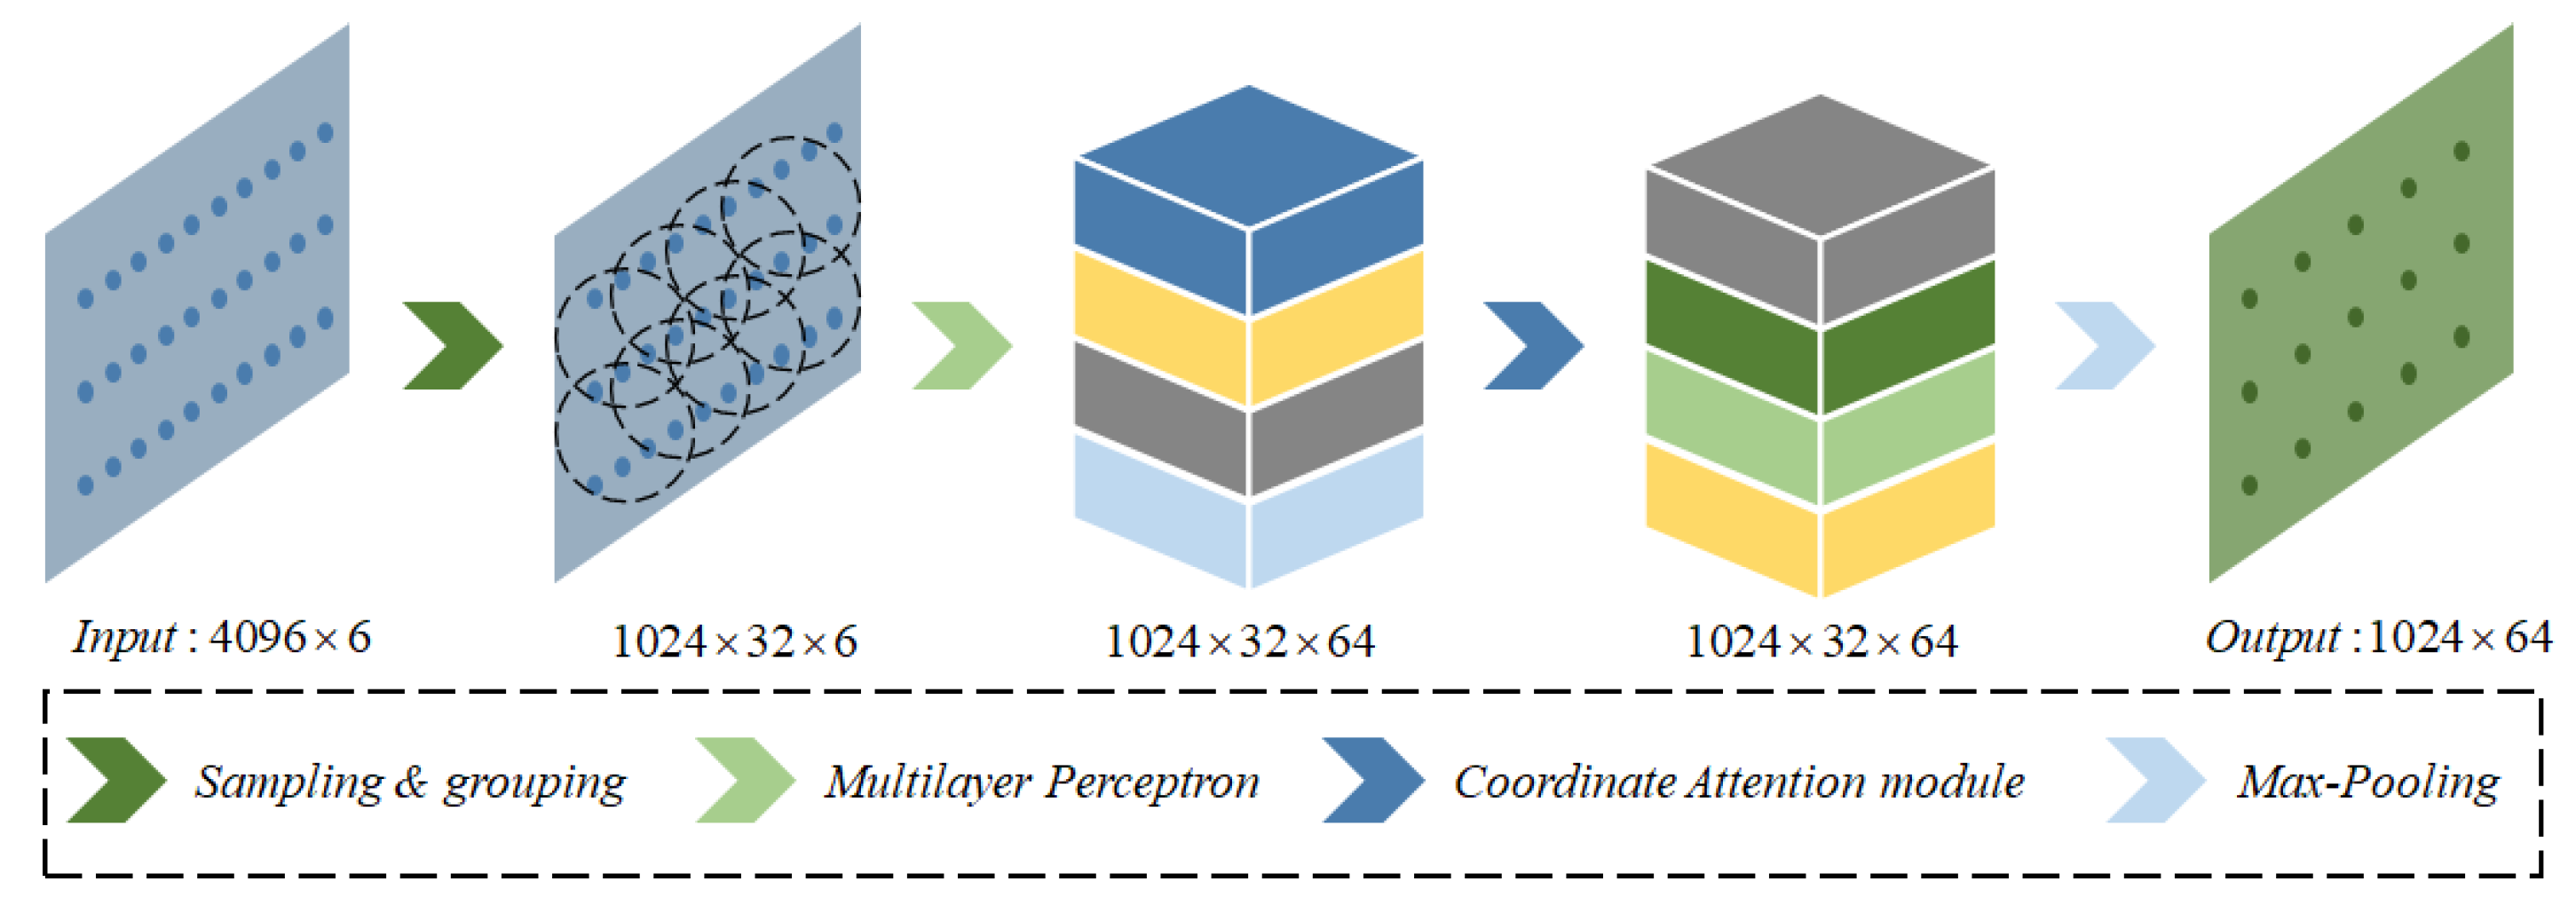
The CA-PointNet++ algorithm takes N × (d + c) dimensional raw point cloud data as input, where N is the number of points, d is the geometric position information, and c is the point cloud feature. The input raw point clouds undergo the first set of abstraction modules for local feature extraction directly. Each set abstraction (SA) module consists of a sampling layer, a grouping layer, and a PointNet layer, where the CA mechanism is embedded in the PointNet. For example, as seen in Figure 3, in the first SA module, a fixed number of N/4 distant center points are randomly selected using the furthest point sampling (FPS) algorithm. Then, K points are sampled within the sphere with a radius r centered on each center point using the ball query, which divides the point clouds into N/4 overlapping small regions. The input data dimension is then transformed into N/4 × K × (d + c), which is used as input for the PointNet to complete shallow feature extraction of the local area point clouds, with an output dimension of N/4 × 64. It should be noted that the CA module is embedded in the aforementioned PointNet structure. The input of PointNet is processed by Multilayer Perceptron (MLP) to extract high-dimensional features, resulting in N/4 × K × (d + c) dimensional data, which is then fed as the input of the CA module. After undergoing a series of transformations, the CA module obtains important features and their positional relationships, followed by local max pooling of the output to obtain local global features. Similarly, the extracted local features are combined with coordinate information and further grouped into larger units as input for the next SA module to generate higher-level features until the global features of the entire point set are extracted. For the segmentation task of CA-PointNet++, the encoder consists of four SA modules, with the data dimension changing from N × (d + c) to N/4 × 64, N/16 × 128, N/64 × 256, and N/256 × 512, respectively, constituting an iterative multilevel feature learning process.
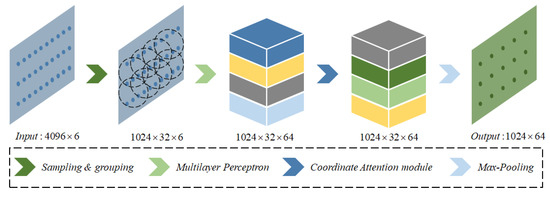
Figure 3.
An illustration of the first set abstraction module.
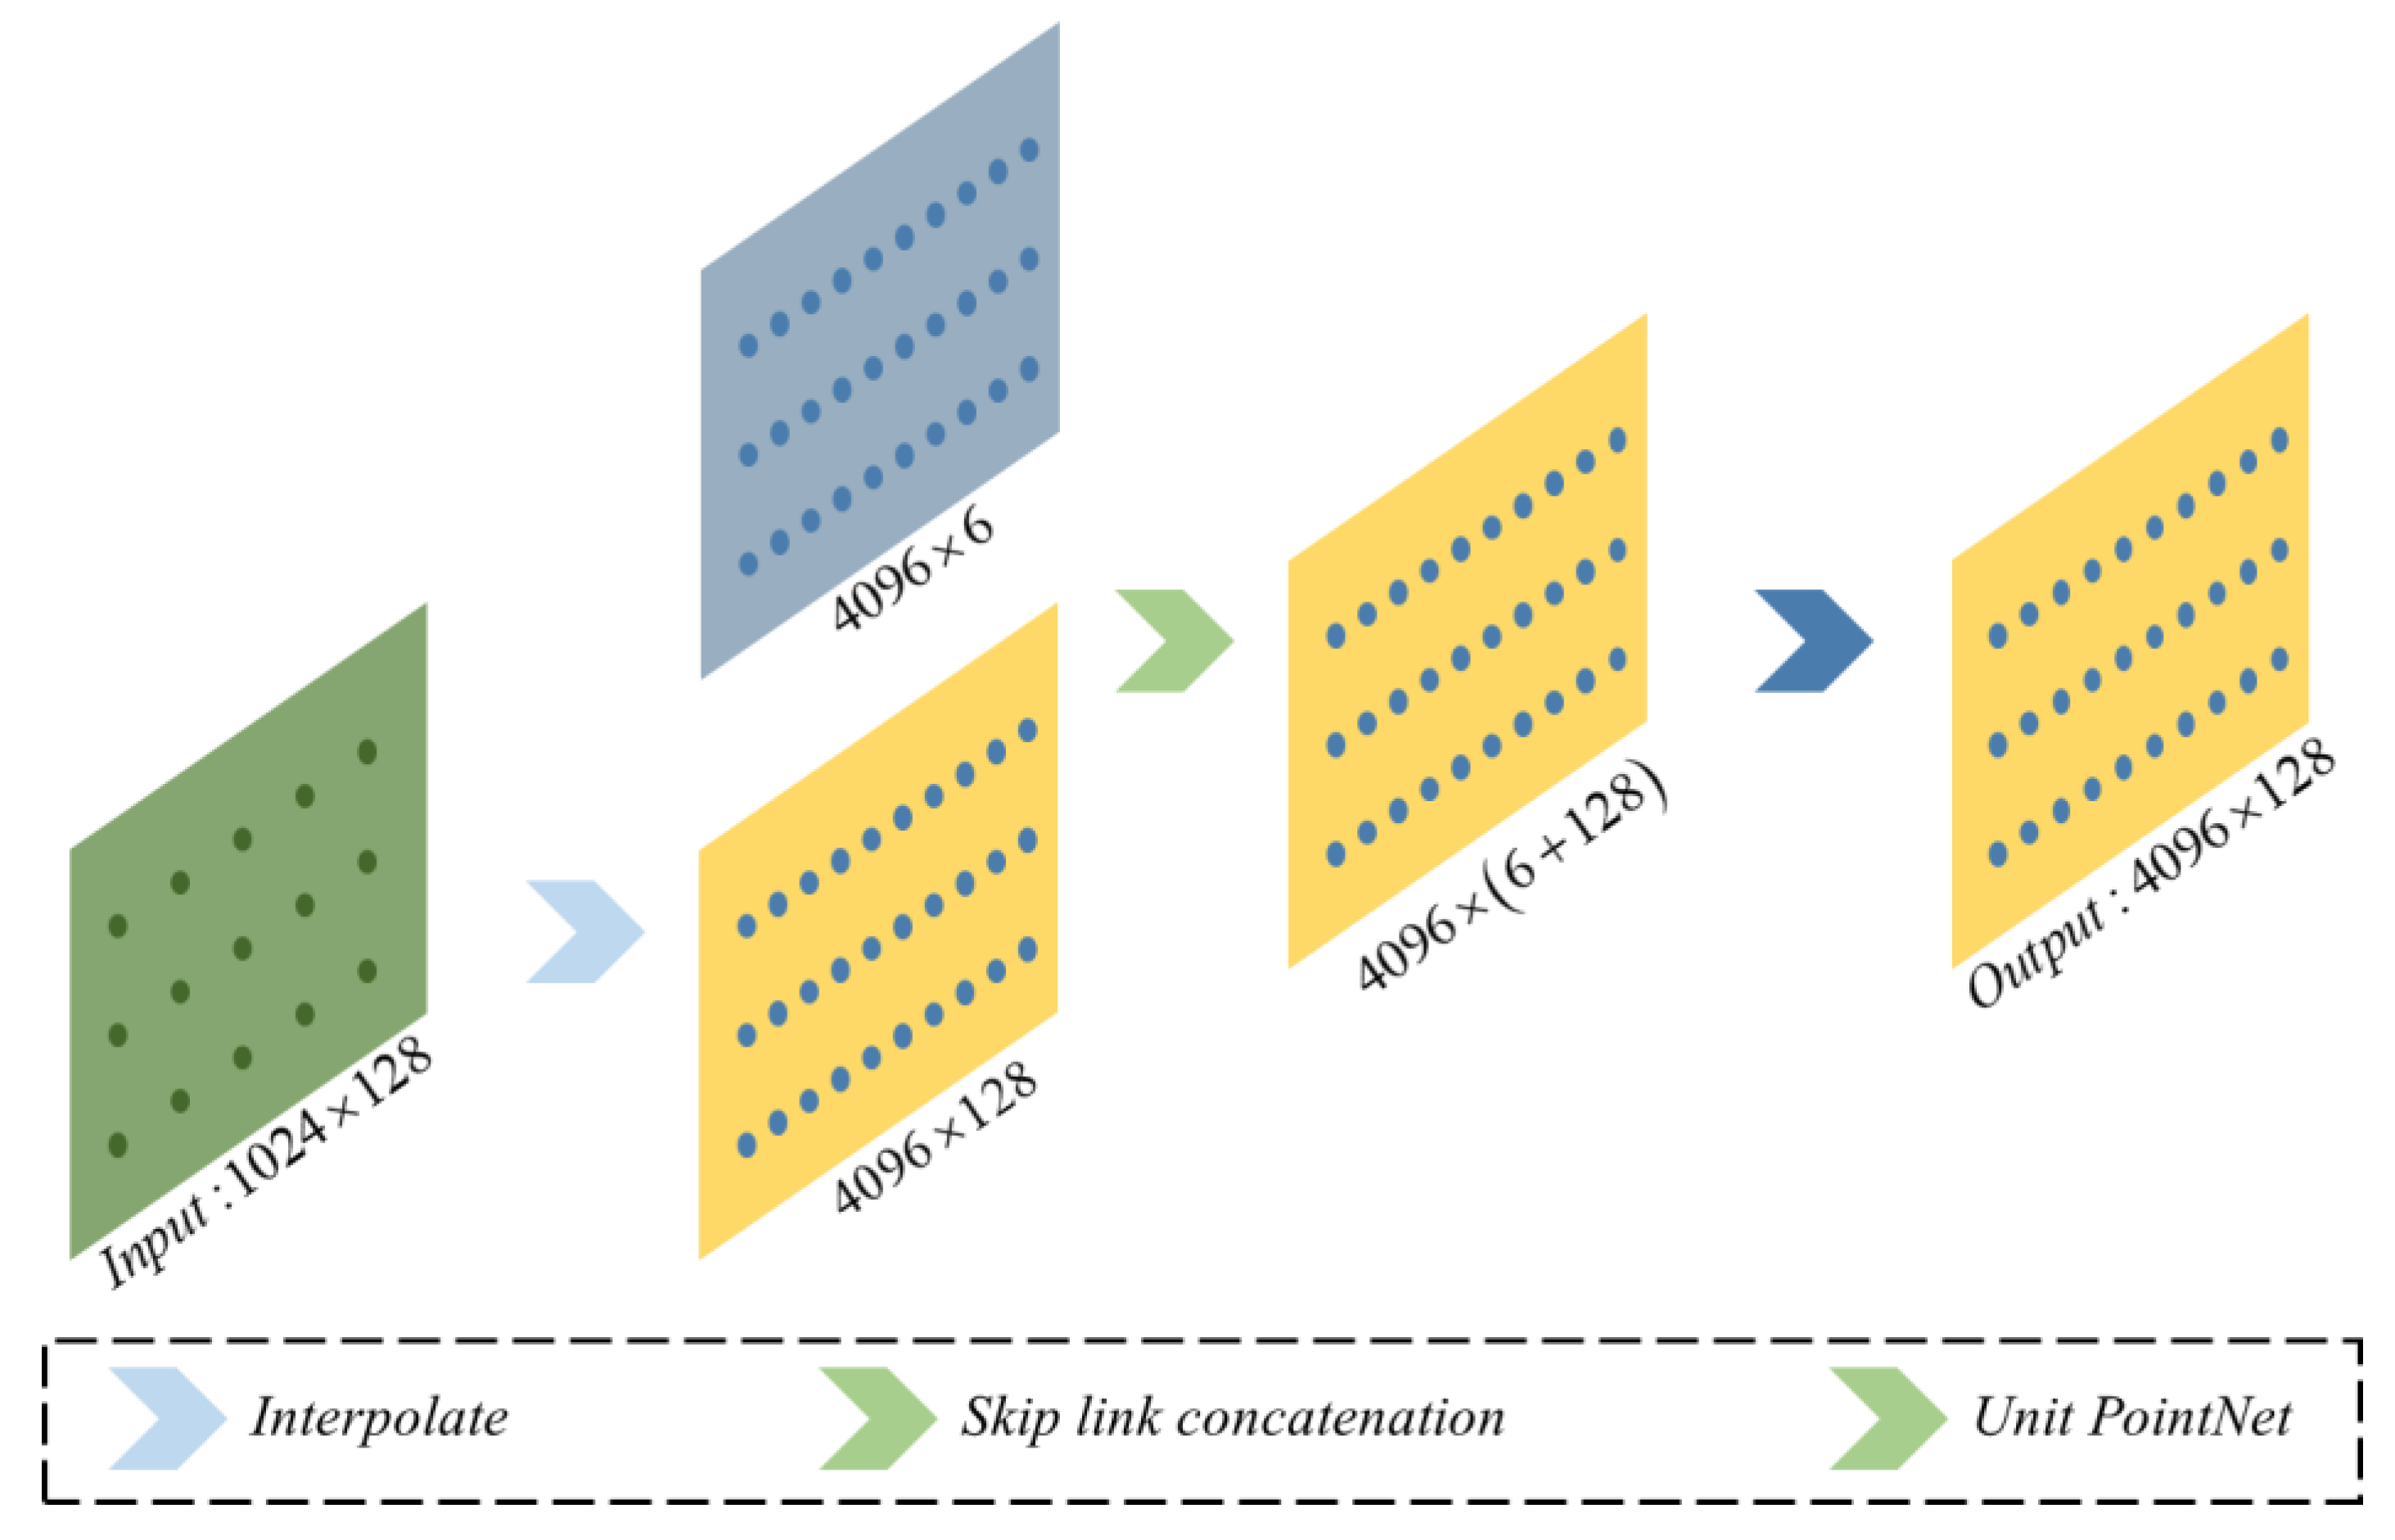
Similarly, for the segmentation task, the decoder part consists of four feature propagation modules, each of which is composed of an interpolation layer, a skip link concatenation layer, and a unit PointNet layer. In each feature propagation (FP) module, the point features are interpolated to the target points using the inverse distance weighting (IDW) method. The shallow features are then calculated based on the deep features of each point in the current network, i.e., the features of N1 × (d + c) points are transferred to Nl-1 points, where Nl-1 and N1 are the number of points before and after downsampling by the SA module, respectively. Based on this, the interpolated features and the output features of the corresponding set abstraction layer are fused using skip link concatenation and then fed into PointNet to obtain new features. After four cascaded feature propagation modules for upsampling, the final classification results for each point are obtained, thus accomplishing the semantic segmentation task. Figure 4 shows the specific structure of the last FP module. For the CA-PointNet++ model that performs the segmentation task, after four cascaded FP modules, each point’s classification result is obtained, ultimately achieving semantic segmentation.
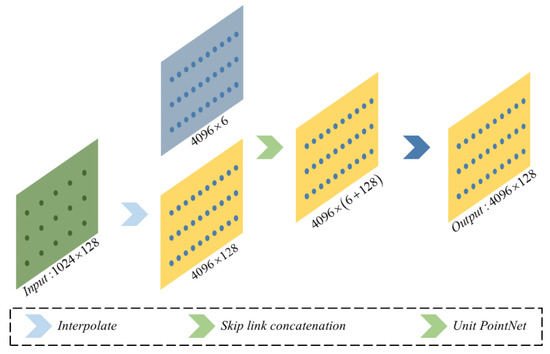
Figure 4.
An illustration of the last feature propagation module.
3. Experiments and Results
3.1. Data Descriptions
In this study, the DJI M300RTK flight platform was used in conjunction with the integrated Livox L1 LiDAR module to obtain point cloud data of power transmission corridors. 3D point cloud data for the transmission corridors located in Wuxi, Jiangsu Province, Xiangyang, Hubei Province, and Bazhong, Sichuan Province, were collected. The collected LiDAR data included 3D coordinate information for the points as well as their RGB color information. The data covers both double-circuit and quadruple-circuit transmission lines with voltage levels of 110 kV and 220 kV and tower types including straight-line towers, tension towers, angle towers, and terminal towers. The majority of the transmission corridors are located in plain areas. Considering that there are almost no houses, railways, etc. in the collected point cloud data of the transmission corridors, to meet the demand for digital twin reconstruction of transmission corridors, the point clouds were classified into four categories: towers, transmission lines, ground wires, and ground. Trees and other objects that are connected to the ground were classified as ground surfaces without further division. The dataset was labeled using the open-source software CloudCompare, and Figure 5a–d shows the rendered image with labeled color information of the transmission corridors.


Figure 5.
Comparison of the results of semantic segmentation of transmission corridors using CA-PointNet++. Subplots (a–d) show the ground truth segmentation renderings of test areas I–IV, respectively, while subplots (e–h) show the corresponding predicted segmentation results, respectively.
3.2. Experimental Setting
The experimental environment of this paper is configured as follows: using an i5-10400F CPU and an NVIDIA GeForce RTX 4080 GPU, with the Pytorch1.7.0 deep learning framework to implement all tests. During the model training process, the number of sampled points N was set to 4096; when using the ball query method, K was set to 32; for the four SA modules, r was sequentially set to 0.1, 0.2, 0.4, and 0.8; the optimizer used was adaptive moment estimation (Adam). The initial learning rate, momentum, batch size, and max epoch were set to 0.001, 0.9, 32, and 100, respectively.
3.3. Evaluation Metrics
To evaluate the experimental results of the 3D point cloud semantic segmentation for transmission corridor scenarios, the overall accuracy (OA), intersection over union (IoU), and mean intersection over union (mIoU) were introduced as evaluation metrics for the model. The formulas for calculating each evaluation metric are presented below.
where TP represents true positive samples that are correctly identified, TF represents true negative samples that are correctly identified, FN represents false negative samples that are mistakenly identified, and FP represents false positive samples that are mistakenly identified. k represents the number of divided categories.
3.4. Results Analysis
To evaluate the performance of the proposed CA-PointNet++ network, we trained and tested the model on a 3D point cloud dataset of transmission corridors that we constructed. In order to reduce information leakage and more accurately reflect the model’s performance, the LiDAR data was split into training, validation, and test sets in a 6:2:2 ratio. Figure 5 shows the segmentation results of the CA-PointNet++ model on the test set of the transmission corridor 3D point clouds, where we listed the predicted results of areas I–IV as a demonstration of the results. According to the results shown in Figure 5, it can be seen intuitively that all four categories are generally classified correctly. Specifically, comparing the ground truth in Figure 5a–d with the predicted values in Figure 5e–h, it can be seen that the ground, transmission line, and tower parts were accurately segmented, but some ground wire points were misclassified as transmission line points. This phenomenon may be due to the fact that the spatial geometric structure and distribution characteristics of transmission lines and ground wires are too similar and the spatial differences are not sufficient to distinguish them, leading to misjudgment. Additionally, due to insufficient sampling accuracy, the lack of insulation and hardware components resulted in mixed categories and unclear boundaries between tower and transmission line categories, and the segmentation results at the junctions were not clear.
To perform a qualitative analysis accurately, we selected the ground truth and predicted values for each category of test area II and analyzed them in detail, listing them as a confusion matrix in Table 1.

Table 1.
Confusion matrix composed of each category in the scene segmentation of test area II.
Based on the comparison of the ground truth and predicted values for each category mentioned above in test area II, it can be observed that for the ground wire category, the classification accuracy is as high as 92.5%, with only a small portion of ground wire points being misidentified as tower points, which may be due to the unclear boundary between ground wires and towers. Almost all ground points were accurately identified, while merely 141 points were mistakenly classified as tower points due to the interaction and overlap between tower points and some vegetation points in the middle of the ground. For tower points, the identification accuracy is only 78.9%, possibly due to the neglect of some components such as insulators and fittings at the connection between the tower and the line, which were roughly processed and caused inconsistencies between ground truth and predicted values. In addition, due to the obstruction of bushes and vegetation on the ground, a part of the tower base was not detected, resulting in 11,212 points (17.6%) being identified as tower points. As for transmission line points, 1413 transmission line points (11.7%) were confused with ground wire points due to the high similarity in spatial distribution and geometric structure between line and ground. Moreover, 2658 points (22.0%) were mistakenly classified as tower points due to insufficient refinement at the junction between line and tower. However, overall, the ground wire, ground tower, and transmission line categories were all relatively accurately classified.
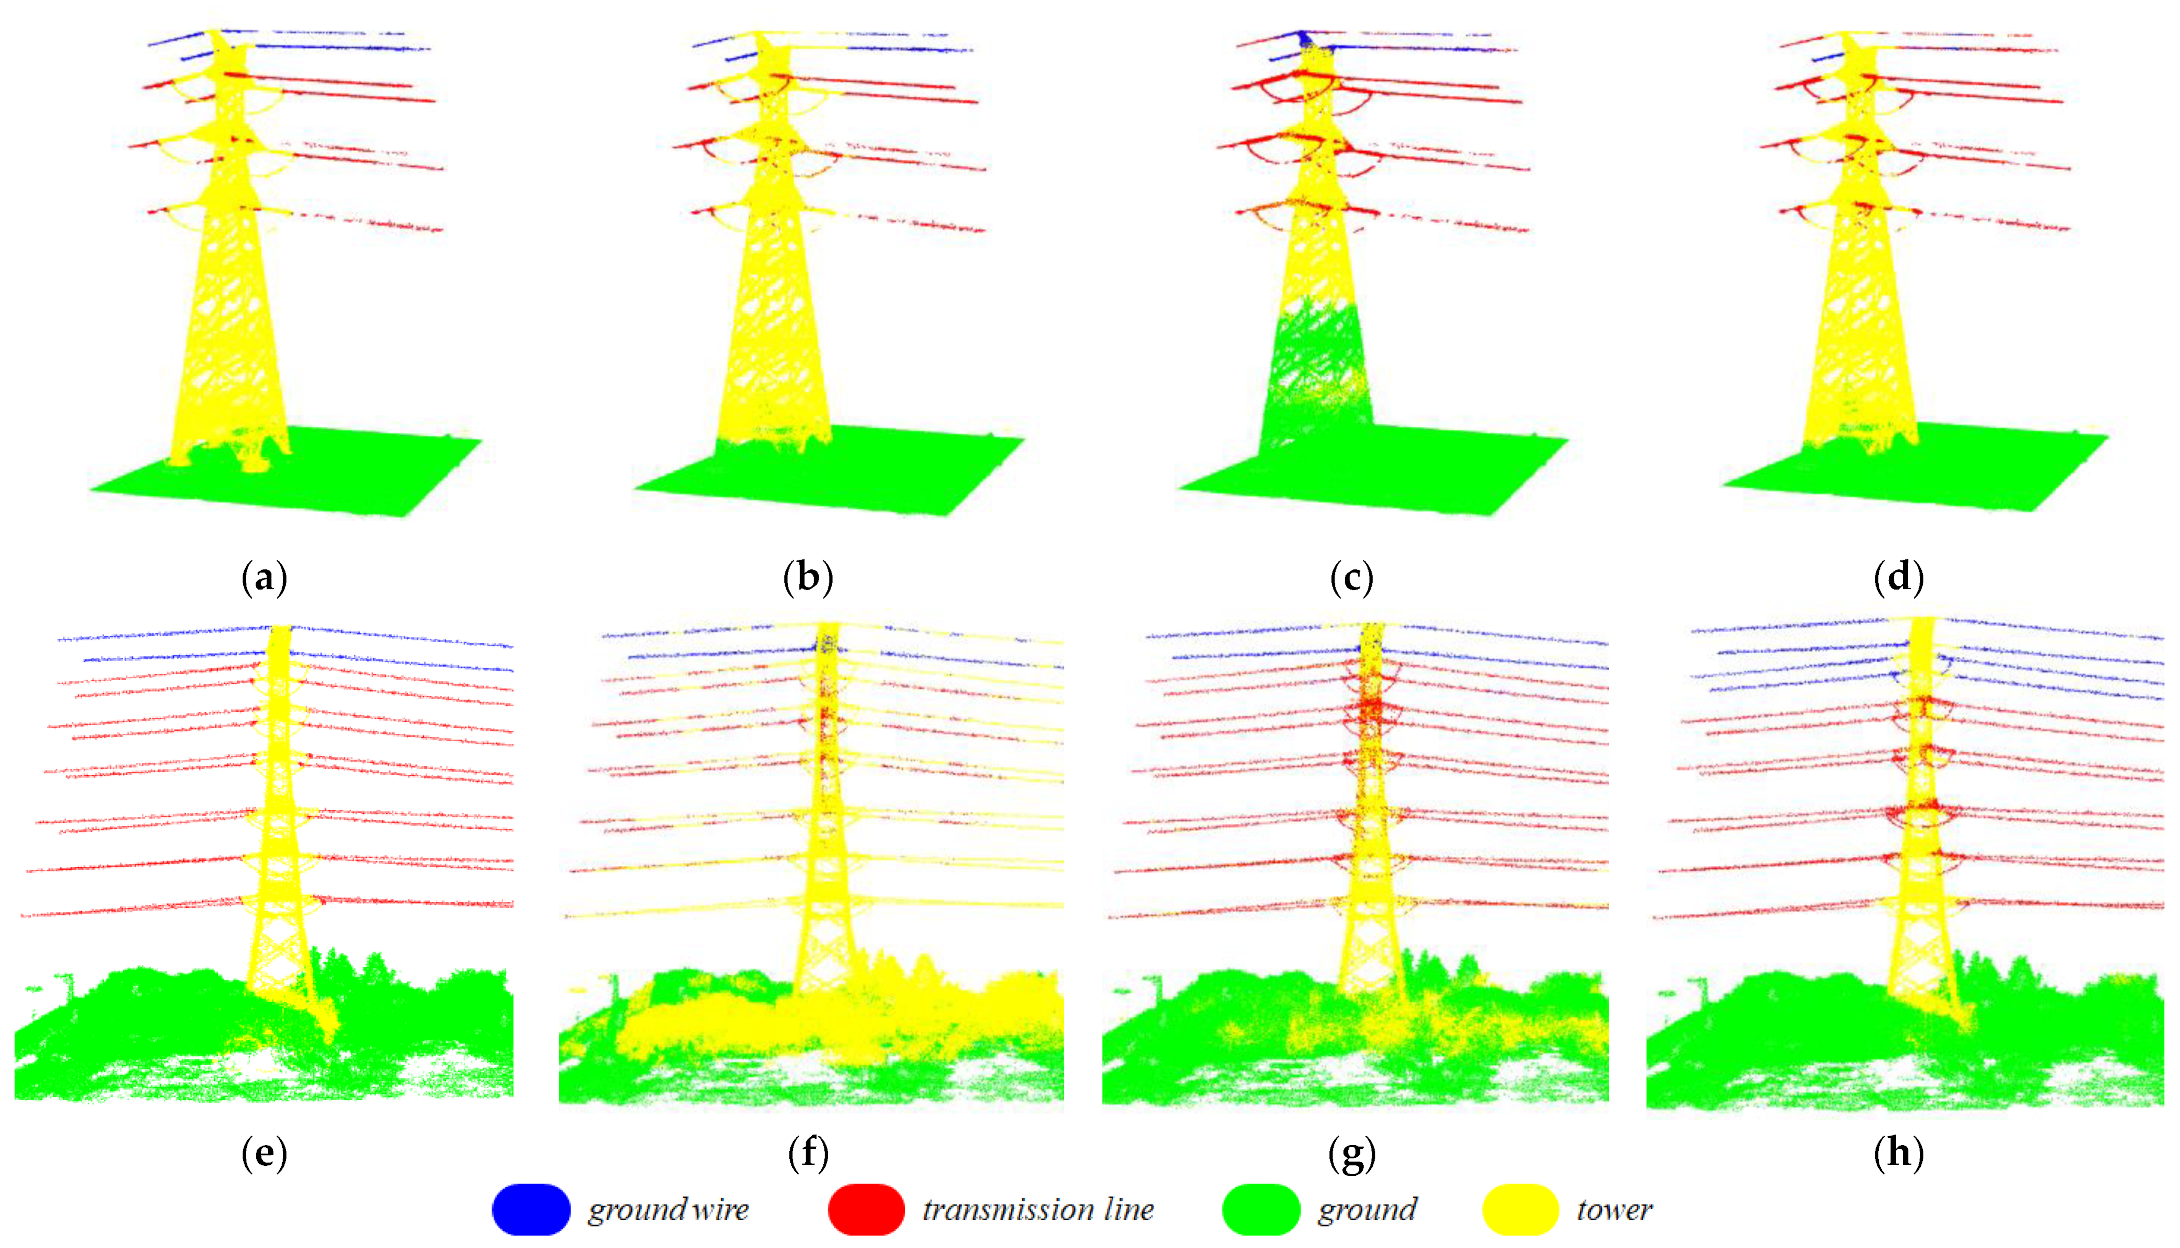
In order to objectively validate the effectiveness and robustness of our proposed CA-PointNet framework, we compared it with other point-based 3D point cloud segmentation deep learning models, including PointNet and PointNet++. Although these models have achieved good segmentation results on public datasets such as s3dis, they have rarely been used in power transmission corridor semantic segmentation. In this paper, we compared our proposed CA-PointNet++ model with other classical models in transmission corridor semantic segmentation, and the qualitative comparison results of various indicators are shown in Table 2. In addition, we used test areas I and II as examples to visualize the segmentation results of the above models. As shown in Figure 6, we highlighted different categories with different colors to emphasize their classification.

Table 2.
Comparison results of our proposed CA-PointNet++ model with other classic deep learning models on the 3D point cloud segmentation of power transmission corridors.
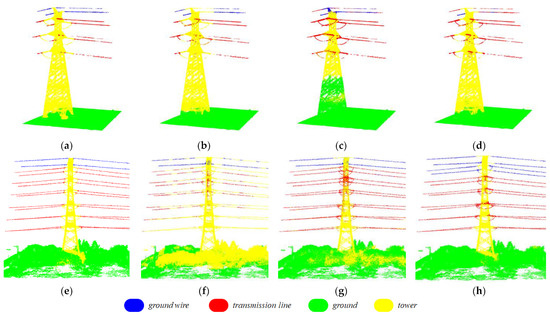
Figure 6.
The comparison of semantic segmentation results of transmission corridors using different deep learning models. Subfigures (a–d) show the rendered comparison of scene segmentation results of ground truth, PointNet, PointNet++, and CA-PointNet++ on test area I. Similarly, subfigures (e–h) show the rendered comparison of scene segmentation results of ground truth, PointNet, PointNet++, and CA-PointNet++ on test area II.
According to the results in Table 2, the PointNet model has the lowest relative performance for the OA evaluation metric at only 73.9%. Furthermore, except for the ground and tower category, the IoU for the other two categories is below 50%, indicating that the segmentation results are generally mediocre. The mIoU is also much lower than the other two models. As shown in Figure 6, the segmentation results of the PointNet model are significantly inconsistent with the actual scene. The main reason for this phenomenon is that the PointNet model ignores the neighborhood relationships between points, resulting in insufficient segmentation precision and poor generalization ability. In contrast, PointNet++ considers the local structure and achieves further improvement in performance, with significant IoU improvements of more than 10% for both transmission lines and ground points and an increase in mIoU of about 4.4%. Fusing local features of points while introducing a channel attention (CA) module that emphasizes channel importance and position information is conducive to extracting detailed information. Therefore, the proposed CA-PointNet++ model also achieves further improvement in performance for 3D point cloud semantic segmentation. The OA of the CA-PointNet++ model reached 93.7%, which represents an improvement of 19.8% and 13.4% compared to the PointNet and PointNet++ models, respectively. Additionally, the mIoU of the CA-PointNet++ model improved by 20.7% and 16.3% compared to the PointNet and PointNet++ models, respectively, reaching 67.4%. Furthermore, when compared to PointNet++, the proposed CA-PointNet++ model demonstrated varying degrees of improvement in the segmentation results for all four categories, as evidenced by their respective IoU scores. Moreover, the IoU scores for the tower and ground categories even reached around 90%, indicating a highly precise segmentation performance. However, it is worth noting that the IoU for ground wire segmentation in the CA-PointNet++ model is only 32.8%, which may be due to the uneven distribution of points. Compared with the sufficient number of ground points, the number of ground line points is relatively small, leading to significant fluctuations in evaluation results. Referring to Figure 6, the segmentation result of the CA-PointNet++ model shows that the model misclassifies the top power line as a ground line, causing a sharp drop in the segmentation result for ground lines.
As shown in Figure 6, the segmentation results of our proposed CA-PointNet++ model are significantly better than the other two models, with the segmentation boundary being almost identical to the ground truth. For example, the segmentation of the tower can be seen as a complete tower model. However, the segmentation boundary of the PoinNet and PointNet++ models is prone to significant errors, with a large number of ground points and tower points mixed together in the predicted classification, making it difficult to further exploit and utilize them. Comparing test area I and test area II, they also perform far worse than the CA-PointNet++ model in terms of generalization ability. Overall, by embedding the CA module into the backbone network of PointNet++, our proposed framework emphasizes important channels and considers point position information during feature extraction, achieving good segmentation performance for tower, ground, transmission line, and ground wire extraction in the transmission corridor scenes.
4. Discussion
The attention mechanism simulates the ability of the human visual system to focus on the relevant parts and can effectively improve the accuracy and efficiency of models. Currently, the most popular attention mechanism is SE, which only considers channel importance and has some limitations compared to CA modules. In order to further demonstrate the superior performance of the proposed CA-PointNet++ model for 3D segmentation in transmission corridors, we discuss the fusion of different attention mechanisms, namely SE modules and the PointNet++ backbone, to construct the SE-PointNet++ model. The qualitative comparison results of the above models and the backbone model for transmission corridor 3D point cloud segmentation are shown in Table 3.

Table 3.
Comparison results of our proposed CA-PointNet++ model and PointNet++ incorporating other attention mechanisms.
An analysis of the data in Table 3 reveals that, for the 3D point cloud segmentation of transmission corridors using PointNet++, the integration of two different attention mechanisms led to improvements in various evaluation metrics, except for the IoU of transmission lines and ground wires. This indicates that attention mechanisms indeed play a supportive role in improving the segmentation performance of the scene. Comparing the SE-PointNet++ and CA-PointNet++ models, the latter significantly outperformed the former in all evaluation metrics, achieving higher segmentation accuracy. Specifically, CA-PointNet++ improved the OA metric by 5.8%, and the IoU of the four categories, including towers, transmission lines, ground wires, and ground, increased by 8.5%, 23.1%, 9.2%, and 7.6%, respectively. Moreover, the mIoU also increased by 12.1%. These results confirm that CA effectively captures long-range spatial contextual features that are helpful for more accurate semantic segmentation by emphasizing channel importance and positional relationships. When integrated with the PointNet++ backbone network, the CA module demonstrates a positive and effective performance in improving the quality of 3D point cloud semantic segmentation for power transmission corridors, even outperforming the classical SE attention mechanism.
5. Conclusions
Automated segmentation of power components and scenes in Lidar data of transmission corridors is the basis for constructing a digital twin and risk management of the power grid, such as providing decision-making assistance for hazardous live-line work. In this study, we propose an improved PointNet++ model named CA-PointNet++, which is a robust and accurate method for segmenting transmission corridor 3D point clouds. CA-PointNet++ is a novel end-to-end network architecture that incorporates the latest CA module into the encoder part of the PointNet++ model. The CA module highlights important channels and suppresses unimportant ones, capturing cross-channel information and location-aware features. A dataset of Lidar data collected by a small UAV for transmission corridor detection is divided into four typical categories: transmission lines, towers, ground wires, and ground. The dataset is used to qualitatively and quantitatively analyze the accuracy and robustness of CA-PointNet++. The experimental results show that the CA-PointNet++ model achieves 93.7% OA and 67.4% mIoU in the segmentation of 3D point clouds in transmission corridors. For the four categories of towers, transmission lines, ground wires, and ground, their IoU values are 82.9%, 60.4%, 32.8%, and 93.5%, respectively. Compared with classical point cloud segmentation algorithms (PointNet and PointNet++), CA-PointNet++ outperforms them in both performance indicators and generalization ability. The addition of the CA module increases the OA by 13.4% and the mIoU by 16.3%, demonstrating the effectiveness and superiority of the integrated CA-PointNet++ network. In addition, compared with the classical SE module, the integration of the CA module into the backbone model of CA-PointNet++ has a more significant effect on improving performance indicators. Furthermore, considering the limitations of our study, future research can focus on more fine-grained segmentation of transmission corridors, including buildings and other smaller electrical equipment. Additionally, the generalizability of the method should be explored when dealing with variable point quantities and densities. These aspects can be considered to enhance the scope of the research in the context of semantic segmentation of transmission corridor 3D point clouds.
Author Contributions
Conceptualization, G.W. and L.W.; methodology, G.W.; validation, G.W.; resources, L.W. and B.S.; data curation, G.W., S.W. and S.Z.; writing—original draft preparation, G.W.; writing—review and editing, G.W. and S.W.; visualization, G.W. All authors have read and agreed to the published version of the manuscript.
Funding
This research received no external funding.
Data Availability Statement
The data presented in this study are available on request from the corresponding author. The data are not publicly available due to privacy restrictions.
Conflicts of Interest
The authors declare no conflict of interest.
References
- Yang, L.; Fan, J.; Liu, Y.; Li, E.; Peng, J.; Liang, Z. A Review on State-of-the-Art Power Line Inspection Techniques. IEEE Trans. Instrum. Meas. 2020, 69, 9350–9365. [Google Scholar] [CrossRef]
- Peng, X.; Chen, C.; Rao, Z.; Yang, B.; Mai, X.; Wang, K. Safety Inspection and Intelligent Diagnosis of Transmission Line Based on Unmanned Helicopter of Multi Sensor Data Acquisition. High Volt. Eng. 2015, 41, 159–166. [Google Scholar] [CrossRef]
- Daki, H.; El Hannani, A.; Aqqal, A.; Haidine, A.; Dahbi, A. Big Data Management in Smart Grid: Concepts, Requirements and Implementation. J. Big Data 2017, 4, 13. [Google Scholar] [CrossRef]
- Qarabsh, N.A.; Sabry, S.S.; Qarabash, H.A. Smart Grid in the Context of Industry 4.0: An Overview of Communications Technologies and Challenges. Indones. J. Electr. Eng. Comput. Sci. 2020, 18, 656–665. [Google Scholar] [CrossRef]
- Wen, Q.; Luo, Z.; Chen, R.; Yang, Y.; Li, G. Deep Learning Approaches on Defect Detection in High Resolution Aerial Images of Insulators. Sensors 2021, 21, 1033. [Google Scholar] [CrossRef]
- Popișter, F.; Popescu, D.; Păcurar, A.; Păcurar, R. Mathematical Approach in Complex Surfaces Toolpaths. Mathematics 2021, 9, 1360. [Google Scholar] [CrossRef]
- Brede, B.; Lau, A.; Bartholomeus, H.M.; Kooistra, L. Comparing RIEGL RiCOPTER UAV LiDAR Derived Canopy Height and DBH with Terrestrial LiDAR. Sensors 2017, 17, 2371. [Google Scholar] [CrossRef]
- Jaakkola, A.; Hyyppä, J.; Yu, X.; Kukko, A.; Kaartinen, H.; Liang, X.; Hyyppä, H.; Wang, Y. Autonomous Collection of Forest Field Reference—The Outlook and a First Step with UAV Laser Scanning. Remote Sens. 2017, 9, 785. [Google Scholar] [CrossRef]
- Chen, C.; Yang, B.; Song, S.; Peng, X.; Huang, R. Automatic Clearance Anomaly Detection for Transmission Line Corridors Utilizing UAV-Borne LIDAR Data. Remote Sens. 2018, 10, 613. [Google Scholar] [CrossRef]
- Cong, Y.; Chen, C.; Yang, B.; Li, J.; Wu, W.; Li, Y.; Yang, Y. 3D-CSTM: A 3D Continuous Spatio-Temporal Mapping Method. ISPRS J. Photogramm. Remote Sens. 2022, 186, 232–245. [Google Scholar] [CrossRef]
- Boukoberine, M.N.; Zhou, Z.; Benbouzid, M. A Critical Review on Unmanned Aerial Vehicles Power Supply and Energy Management: Solutions, Strategies, and Prospects. Appl. Energy 2019, 255, 113823. [Google Scholar] [CrossRef]
- Jiang, Z.; Lv, H.; Li, Y.; Guo, Y. A Novel Application Architecture of Digital Twin in Smart Grid. J. Ambient. Intell. Humaniz. Comput. 2022, 13, 3819–3835. [Google Scholar] [CrossRef]
- Chi, P.; Lei, Y.; Shan, S.S.; Wei, Z.; Hao, D. Research on Power Line Segmentation and Tree Barrier Analysis. In Proceedings of the 2019 3rd International Conference on Electronic Information Technology and Computer Engineering, Xiamen, China, 18–20 October 2019; pp. 1395–1399. [Google Scholar]
- Hu, Z.; He, T.; Zeng, Y.; Luo, X.; Wang, J.; Huang, S.; Liang, J.; Sun, Q.; Xu, H.; Lin, B. Fast Image Recognition of Transmission Tower Based on Big Data. Prot. Control. Mod. Power Syst. 2018, 3, 15. [Google Scholar] [CrossRef]
- Gao, J.; Wang, L.; Wu, S.; Xie, C.; Liu, L.; Li, E.; Wang, T.; Cavallini, A. Breakdown Characteristics of a Long Air Gap Containing a Floating Conductor Under Positive Switching Impulse. IEEE Trans. Dielectr. Electr. Insul. 2022, 29, 1913–1922. [Google Scholar] [CrossRef]
- Xie, C.; Wang, L.; Gao, J.; Peng, Y.; Wu, S.; Wu, S.; Wang, W.; Liu, J.; Liu, Y. Experimental Investigation of Discharge Path Selectivity of a Long Air Gap Containing a Floating Conductor. IEEE Trans. Electromagn. Compat. 2022, 64, 1278–1287. [Google Scholar] [CrossRef]
- Guo, B.; Li, Q.; Huang, X.; Wang, C. An Improved Method for Power-Line Reconstruction from Point Cloud Data. Remote Sens. 2016, 8, 36. [Google Scholar] [CrossRef]
- Knapp, N.; Fischer, R.; Huth, A. Linking Lidar and Forest Modeling to Assess Biomass Estimation across Scales and Disturbance States. Remote Sens. Environ. 2018, 205, 199–209. [Google Scholar] [CrossRef]
- Kohek, Š.; Žalik, B.; Strnad, D.; Kolmanič, S.; Lukač, N. Simulation-Driven 3D Forest Growth Forecasting Based on Airborne Topographic LiDAR Data and Shading. Int. J. Appl. Earth Obs. Geoinf. 2022, 111, 1–13. [Google Scholar] [CrossRef]
- Tompalski, P.; Coops, N.C.; White, J.C.; Goodbody, T.R.; Hennigar, C.R.; Wulder, M.A.; Socha, J.; Woods, M.E. Estimating Changes in Forest Attributes and Enhancing Growth Projections: A Review of Existing Approaches and Future Directions Using Airborne 3D Point Cloud Data. Curr. For. Rep. 2021, 7, 1–24. [Google Scholar] [CrossRef]
- Jwa, Y.; Sohn, G.; Kim, H.B. Automatic 3d Powerline Reconstruction Using Airborne Lidar Data. Int. Arch. Photogramm. Remote Sens. 2009, 38, 105–110. [Google Scholar]
- Zhang, R.; Yang, B.; Xiao, W.; Liang, F.; Liu, Y.; Wang, Z. Automatic Extraction of High-Voltage Power Transmission Objects from UAV Lidar Point Clouds. Remote Sens. 2019, 11, 2600. [Google Scholar] [CrossRef]
- Chen, S.; Wang, C.; Dai, H.; Zhang, H.; Pan, F.; Xi, X.; Yan, Y.; Wang, P.; Yang, X.; Zhu, X. Power Pylon Reconstruction Based on Abstract Template Structures Using Airborne Lidar Data. Remote Sens. 2019, 11, 1579. [Google Scholar] [CrossRef]
- Guo, B.; Huang, X.; Zhang, F.; Sohn, G. Classification of Airborne Laser Scanning Data Using JointBoost. ISPRS J. Photogramm. Remote Sens. 2015, 100, 71–83. [Google Scholar] [CrossRef]
- Toschi, I.; Morabito, D.; Grilli, E.; Remondino, F.; Carlevaro, C.; Cappellotto, A.; Tamagni, G.; Maffeis, M. CLOUD-BASED SOLUTION FOR NATIONWIDE POWER LINE MAPPING. Int. Arch. Photogramm. Remote Sens. Spat. Inf. Sci. 2019, XLII-2/W13, 119–126. [Google Scholar] [CrossRef]
- Chen, C.; Jin, A.; Yang, B.; Ma, R.; Sun, S.; Wang, Z.; Zong, Z.; Zhang, F. DCPLD-Net: A Diffusion Coupled Convolution Neural Network for Real-Time Power Transmission Lines Detection from UAV-Borne LiDAR Data. Int. J. Appl. Earth Obs. Geoinf. 2022, 112, 102960. [Google Scholar] [CrossRef]
- Su, H.; Maji, S.; Kalogerakis, E.; Learned-Miller, E. Multi-View Convolutional Neural Networks for 3d Shape Recognition. In Proceedings of the IEEE International Conference on Computer Vision, Santiago, Chile, 7–13 December 2015; pp. 945–953. [Google Scholar]
- Guo, Y.; Wang, H.; Hu, Q.; Liu, H.; Liu, L.; Bennamoun, M. Deep Learning for 3d Point Clouds: A Survey. IEEE Trans. Pattern Anal. Mach. Intell. 2020, 43, 4338–4364. [Google Scholar] [CrossRef]
- Maturana, D.; Scherer, S. Voxnet: A 3d Convolutional Neural Network for Real-Time Object Recognition. In Proceedings of the 2015 IEEE/RSJ International Conference on Intelligent Robots and Systems, Hamburg, Germany, 28 September–2 October 2015; pp. 922–928. [Google Scholar]
- Qi, C.R.; Su, H.; Mo, K.; Guibas, L.J. Pointnet: Deep Learning on Point Sets for 3d Classification and Segmentation. In Proceedings of the IEEE Conference on Computer Vision and Pattern Recognition, Honolulu, HI, USA, 21–26 July 2017; pp. 652–660. [Google Scholar]
- Qi, C.R.; Yi, L.; Su, H.; Guibas, L.J. Pointnet++: Deep Hierarchical Feature Learning on Point Sets in a Metric Space. In Proceedings of the Advances in Neural Information Processing Systems, Long Beach, CA, USA, 4–9 December 2017; pp. 5105–5114. [Google Scholar]
- Li, Y.; Bu, R.; Sun, M.; Wu, W.; Di, X.; Chen, B. Pointcnn: Convolution on x-Transformed Points. In Proceedings of the Advances in Neural Information Processing Systems, Montreal, Canada, 3–8 December 2018; pp. 820–830. [Google Scholar]
- Wang, Y.; Sun, Y.; Liu, Z.; Sarma, S.E.; Bronstein, M.M.; Solomon, J.M. Dynamic Graph Cnn for Learning on Point Clouds. Acm Trans. Graph. 2019, 38, 1–12. [Google Scholar] [CrossRef]
- Zhang, Z.; Hua, B.-S.; Yeung, S.-K. Shellnet: Efficient Point Cloud Convolutional Neural Networks Using Concentric Shells Statistics. In Proceedings of the IEEE/CVF International Conference on Computer Vision, Seoul, Republic of Korea, 27 October–2 November 2019; pp. 1607–1616. [Google Scholar]
- Yang, J.; Huang, Z.; Huang, M.; Zeng, X.; Li, D.; Zhang, Y. Power Line Corridor LiDAR Point Cloud Segmentation Using Convolutional Neural Network. In Proceedings of the Pattern Recognition and Computer Vision: Second Chinese Conference, Xi’an, China, 8–11 November 2019; pp. 160–171. [Google Scholar]
- Peng, S.; Xi, X.; Wang, C.; Xie, R.; Wang, P.; Tan, H. Point-Based Multilevel Domain Adaptation for Point Cloud Segmentation. IEEE Geosci. Remote Sens. Lett. 2020, 19, 1–5. [Google Scholar] [CrossRef]
- Hou, Q.; Zhou, D.; Feng, J. Coordinate Attention for Efficient Mobile Network Design. In Proceedings of the IEEE/CVF Conference on Computer Vision and Pattern Recognition, Nashville, TN, USA, 20–25 June 2021; pp. 13713–13722. [Google Scholar]
- Hu, J.; Shen, L.; Sun, G. Squeeze-and-Excitation Networks. In Proceedings of the IEEE Conference on Computer Vision and Pattern Recognition, Salt Lake City, UT, USA, 18–23 June 2018; pp. 7132–7141. [Google Scholar]
- Woo, S.; Park, J.; Lee, J.-Y.; Kweon, I.S. Cbam: Convolutional Block Attention Module. In Proceedings of the European Conference on Computer Vision (ECCV), Munich, Germany, 8–14 September 2018; pp. 3–19. [Google Scholar]
Disclaimer/Publisher’s Note: The statements, opinions and data contained in all publications are solely those of the individual author(s) and contributor(s) and not of MDPI and/or the editor(s). MDPI and/or the editor(s) disclaim responsibility for any injury to people or property resulting from any ideas, methods, instructions or products referred to in the content. |
© 2023 by the authors. Licensee MDPI, Basel, Switzerland. This article is an open access article distributed under the terms and conditions of the Creative Commons Attribution (CC BY) license (https://creativecommons.org/licenses/by/4.0/).

