
Research on the Application of Heterogeneous Cellular Automata in the Safety Control and Detection System of Construction Project Implementation Phase
Abstract
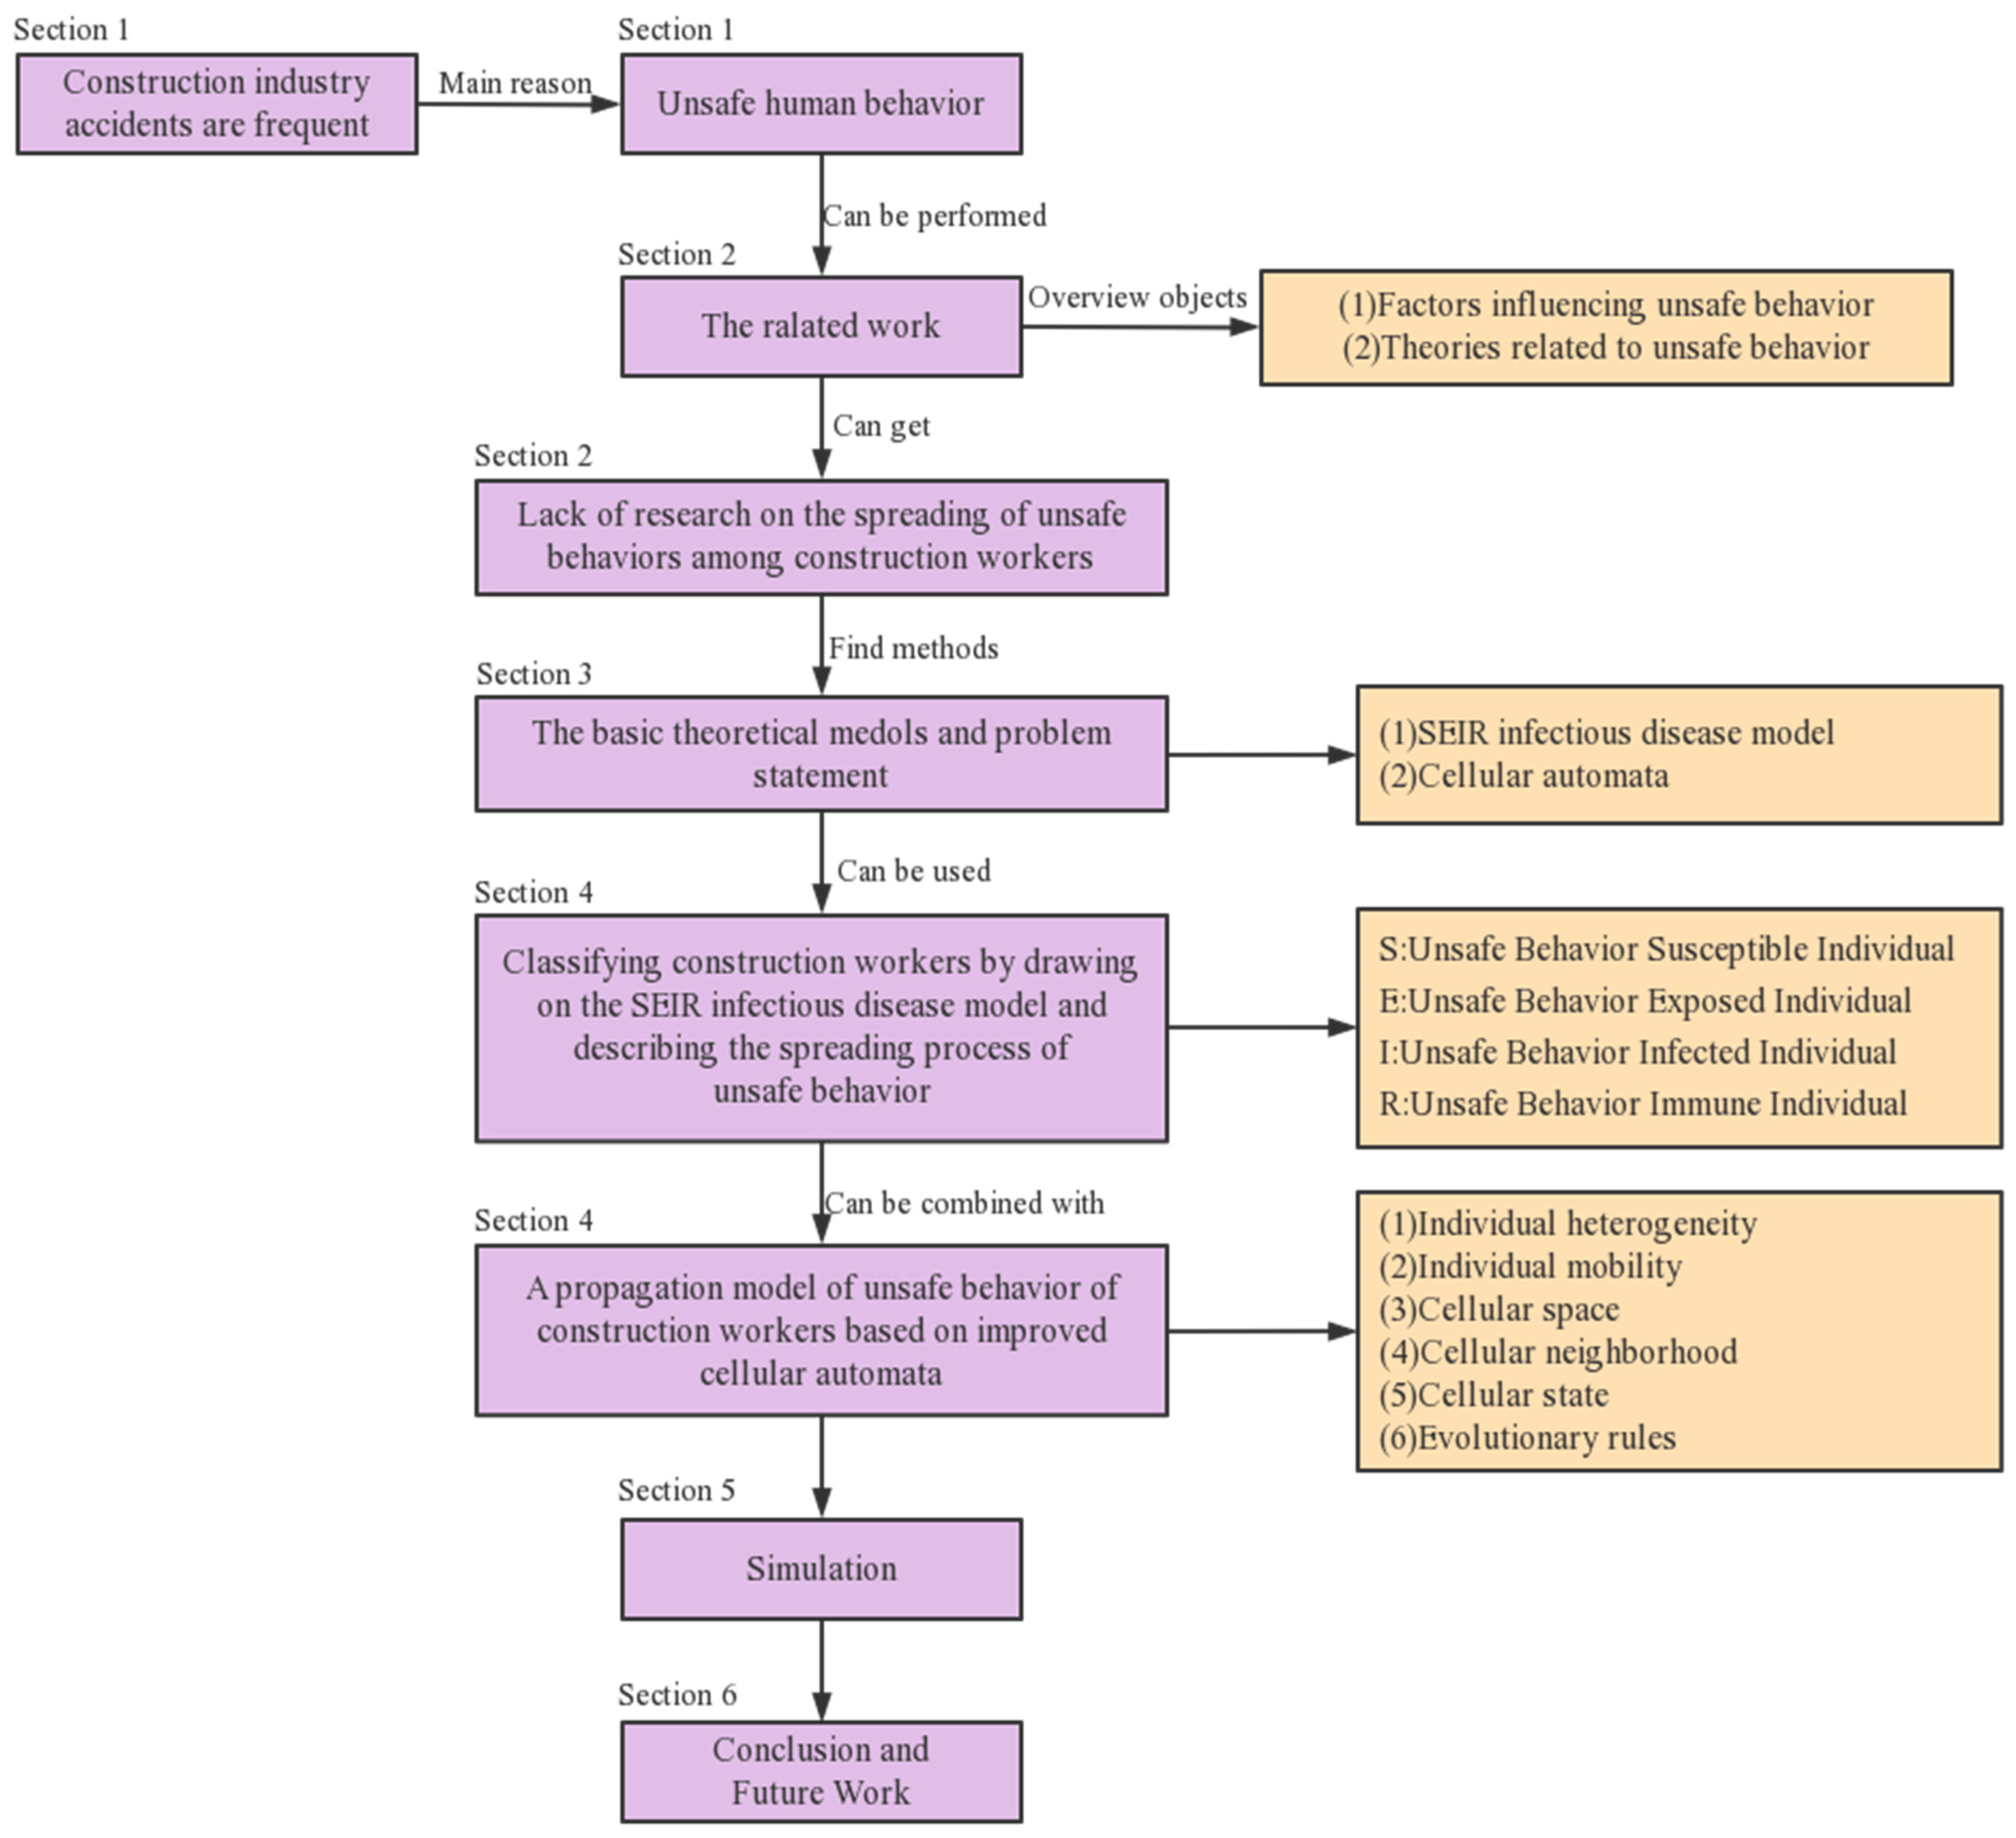
:1. Introduction
2. The Related Work
3. The Basic Theoretical Models and Problem Statement
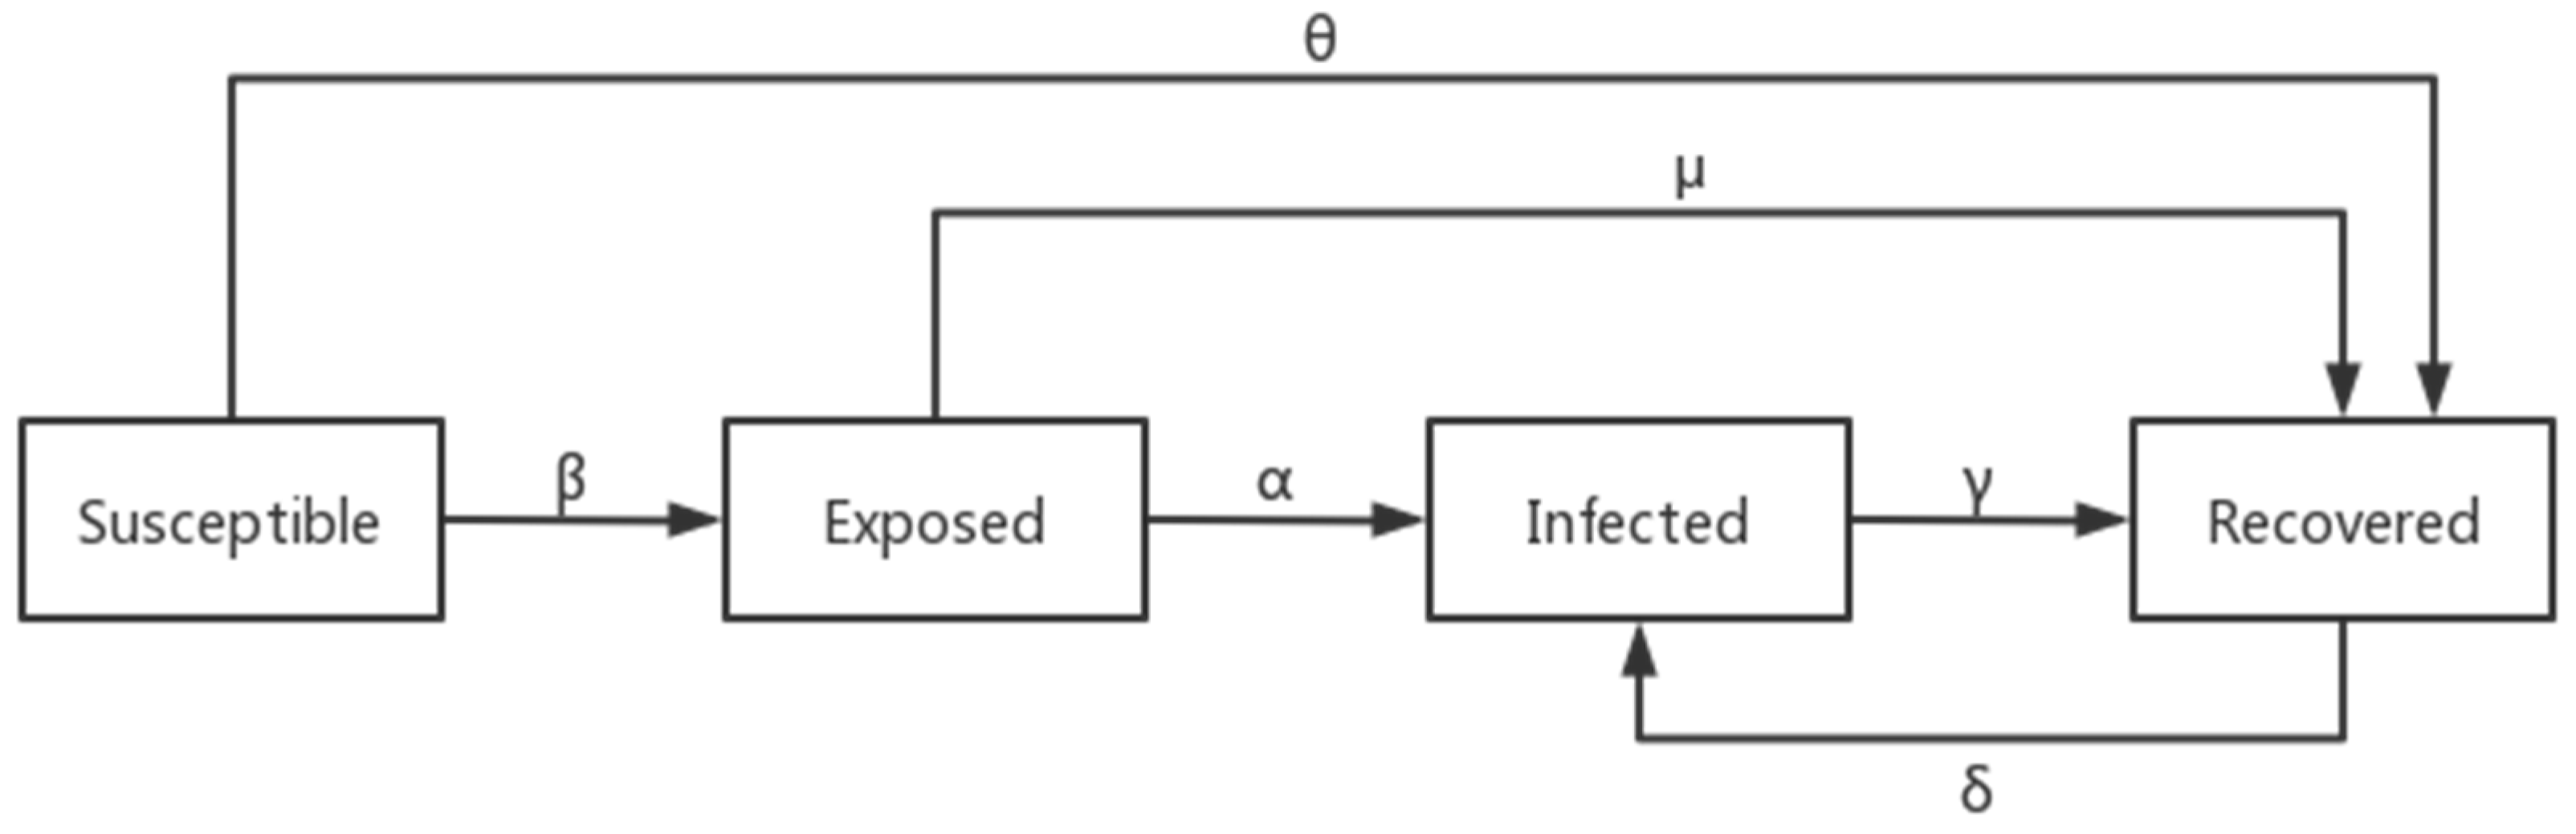
3.1. Theoretical Approach I: SEIR Infectious Disease Model
3.2. Theoretical Approach II: The Principle of Cellular Automata
4. Our Proposed Secure Control Detection System for Construction Engineering Safety Management
4.1. Spreading Process of CWUB Based on SEIR Model
4.2. Propagation Model of CWUB Based on Improved Cellular Automata
4.2.1. Individual Heterogeneity
4.2.2. Individual Mobility
4.2.3. Cellular Space
4.2.4. Cellular Neighborhood
4.2.5. Cellular State
4.2.6. Evolutionary Rules
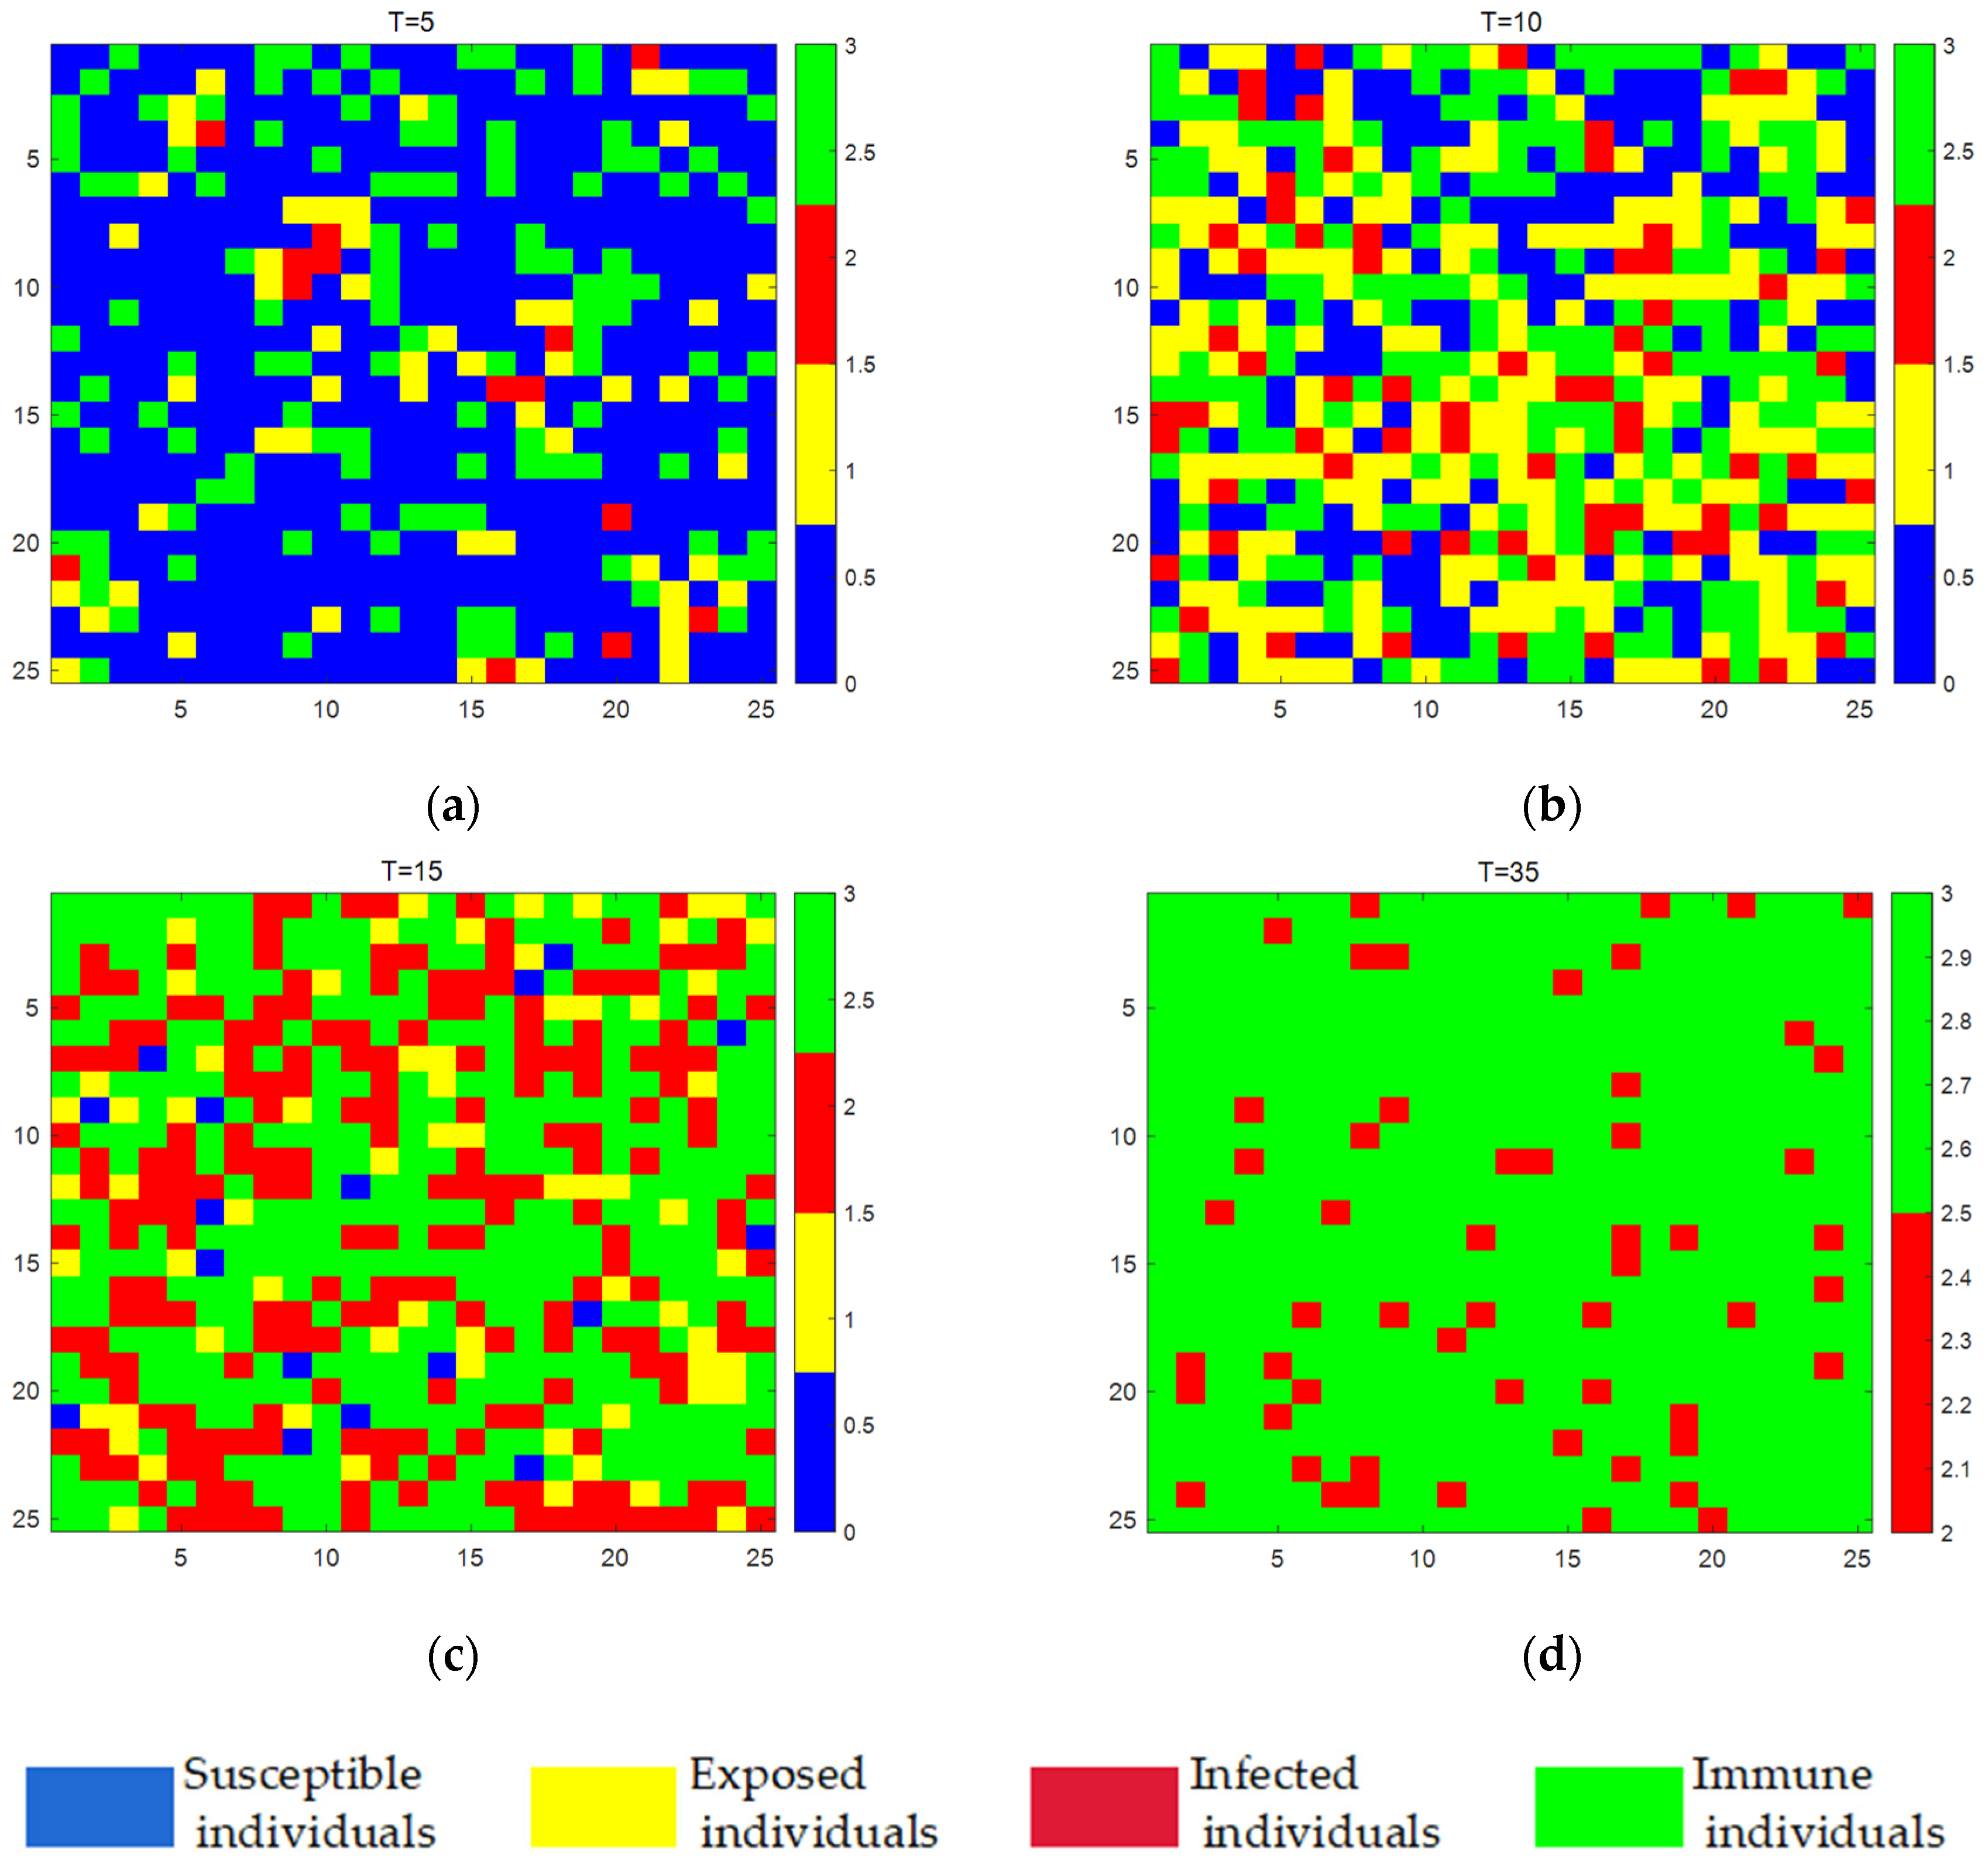
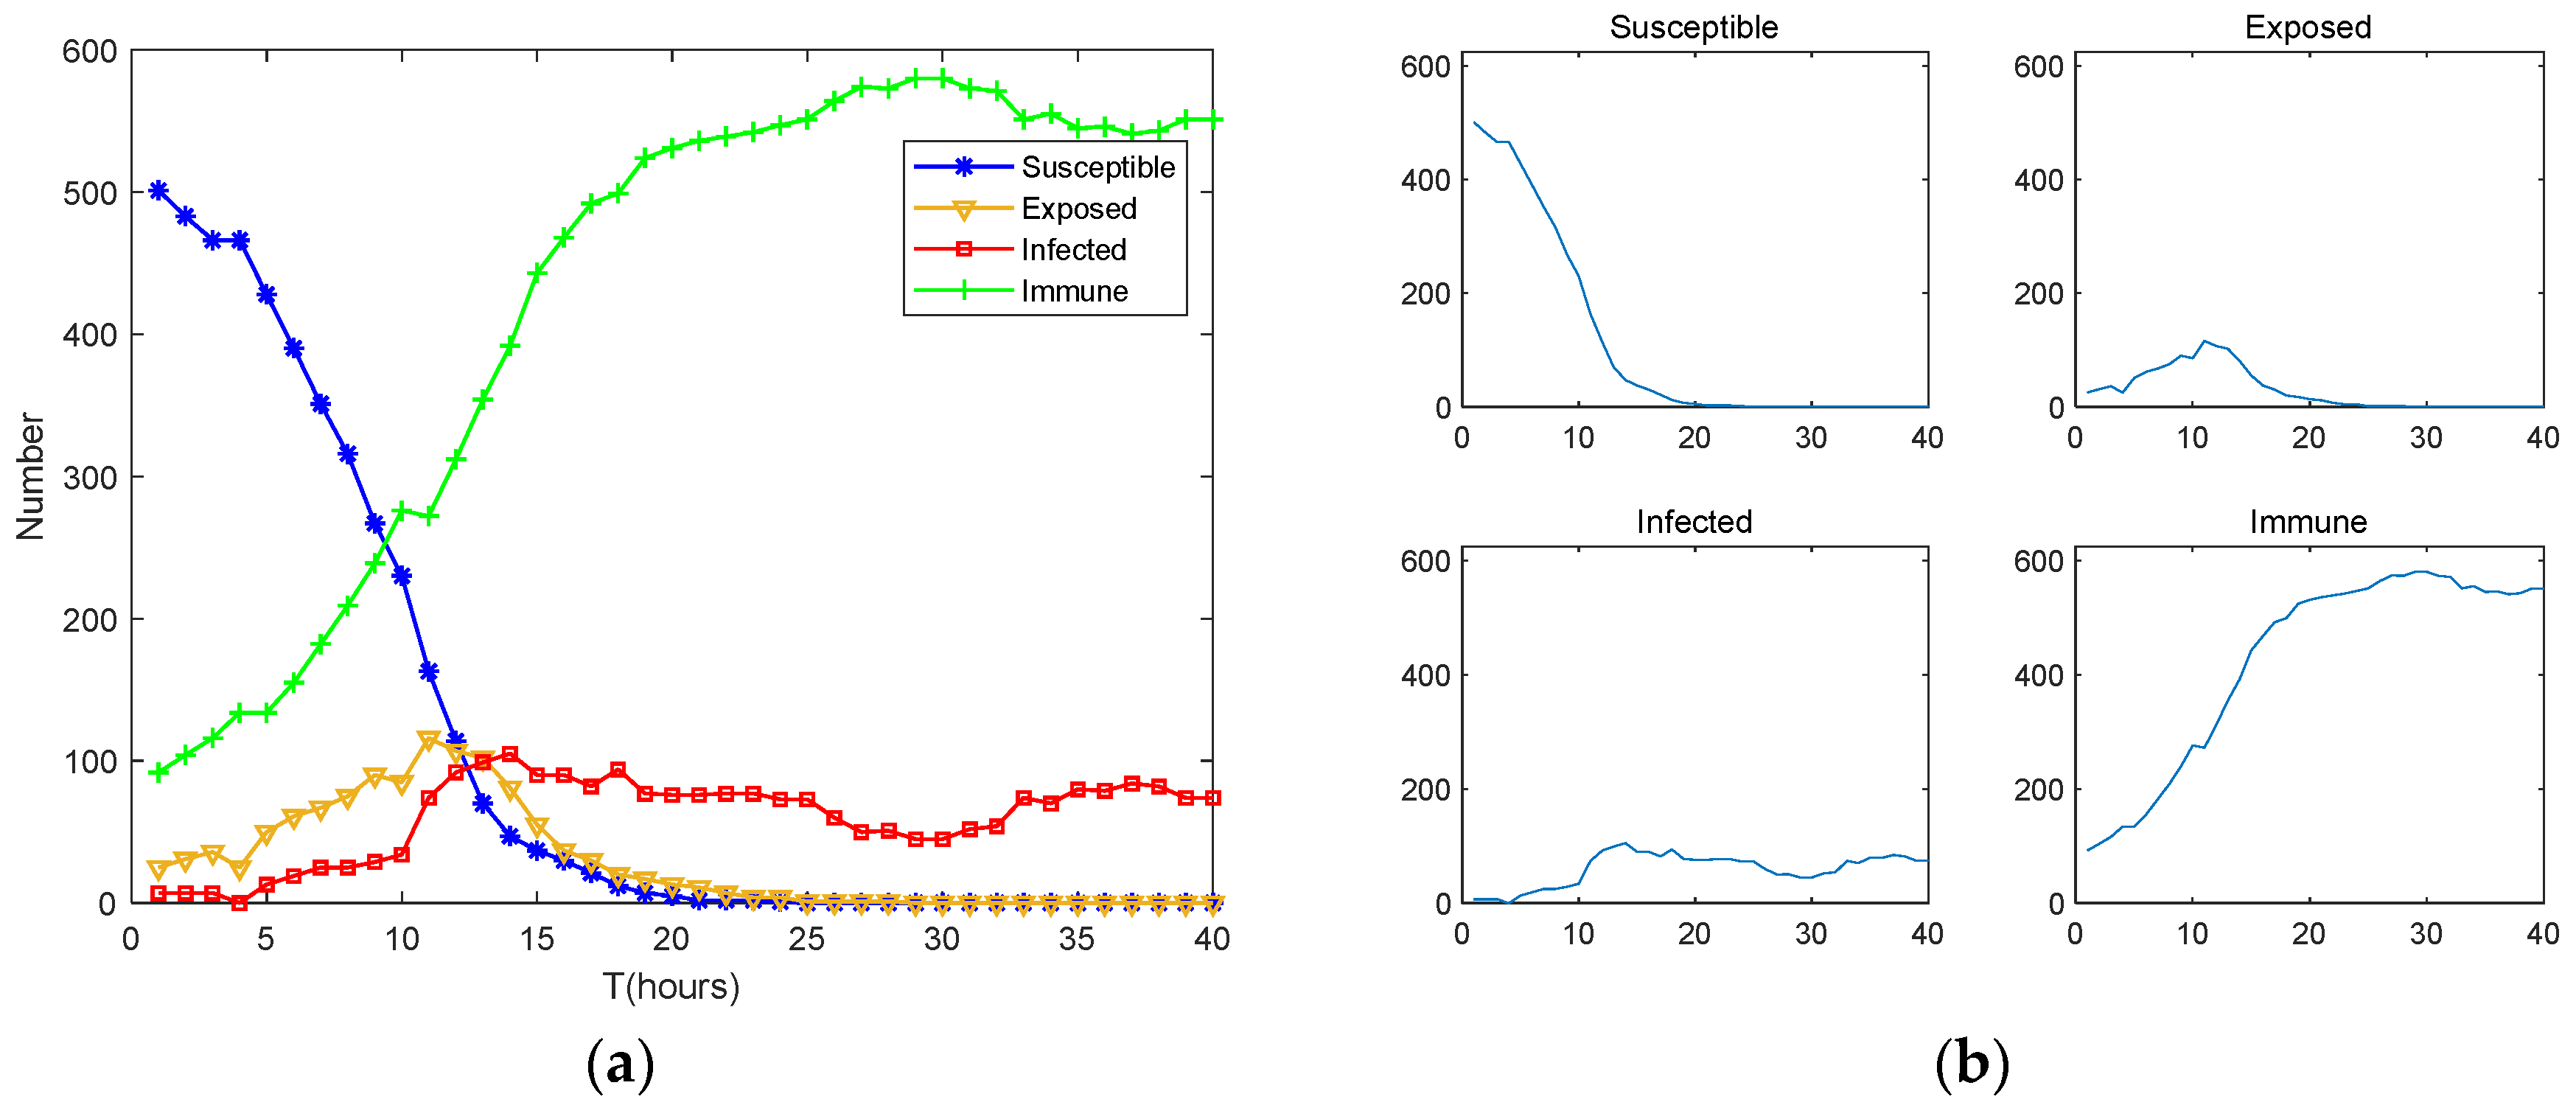
5. Performance Analysis about Our Secure Control Detection System for Construction Engineering Safety Management
5.1. Unsafe Behavior Susceptible Individual Control Strategy
5.2. Unsafe Behavior Exposed Individual Control Strategy
5.3. Unsafe Behavior Infected Individual Control Strategy
5.4. Unsafe Behavior Immune Individual Control Strategy
6. Conclusions and the Future Work
Author Contributions
Funding
Institutional Review Board Statement
Informed Consent Statement
Data Availability Statement
Conflicts of Interest
References
- Im, H.-J.; Kwon, Y.-J.; Kim, S.-G. The characteristics of fatal occupational injuries in Korea’s construction industry, 1997–2004. Saf. Sci. 2009, 47, 1159–1162. [Google Scholar] [CrossRef]
- United States Department of Labor. Viewed on 20 September 2021. Available online: https://www.labour.gov.hk/eng/osh/content10.htm (accessed on 24 March 2022).
- Health and Safety Executive. Construction Statistics in Great Britain. 2020. Available online: https://www.hse.gov.uk/statistics/industry/index.htm (accessed on 4 November 2020).
- Sunindijo, R.Y.; Zou, P.X.W. Political Skill for Developing Construction Safety Climate. J. Constr. Eng. Manag. 2012, 138, 605–612. [Google Scholar] [CrossRef]
- Peng, Y.; Zhang, S.; Wu, P. Factors influencing workplace accident costs of building projects. Saf. Sci. 2015, 72, 97–104. [Google Scholar]
- Jiang, Z.M.; Fang, D.P.; Zhang, M.C. Understanding the Causation of Construction Workers’ Unsafe Behaviors Based on System Dynamics Modeling. J. Manag. Eng. 2015, 31, 72–103. [Google Scholar] [CrossRef]
- Helen, L.; Rowlinson, S. Occupational Health and Safety in Construction Project Management; Routledge: London, UK, 2004. [Google Scholar]
- Suraji, A.; Duff, A.R.; Peckitt, S.J. Development of Causal Model of Construction Accident Causation. J. Constr. Eng. Manag. 2001, 127, 337–344. [Google Scholar] [CrossRef]
- Kim, J.M.; Son, K.; Yum, S.G. Analyzing the Risk of Safety Accidents: The Relative Risks of Migrant Workers in Construction Industry. Sustainability 2020, 12, 5430. [Google Scholar] [CrossRef]
- You, M.; Li, S.; Li, D. Study on the Influencing Factors of Miners’ Unsafe Behavior Propagation. Front. Psychol. 2019, 10, 2467. [Google Scholar] [CrossRef] [PubMed]
- Shi, J.; Zheng, P.; Chang, D.Y. Study on the propagation model of miners’ unsafe behavior based on SEIMR. J. Saf. Environ. 2021, 21, 1203–1211. [Google Scholar]
- Ye, G.; Duan, S.L.; Wang, H.X. Research on the causes of unsafe behavior of construction workers. J. Saf. Sci. Technol. 2015, 11, 170–177. [Google Scholar]
- Ghasemi, F.; Kalatpour, O.; Moghimbeigi, A. A path analysis model for explaining unsafe behavior in workplaces: The effect of perceived work pressure. Int. J. Occup. Saf. Ergon. 2018, 24, 303–310. [Google Scholar] [CrossRef]
- Li, H.; Chen, H.; Zhao, Z. Tunnel Construction Workers’ Cognitive Biases and Unsafe Behaviors: The Mediating Effects of Risk Perceptions. Adv. Civ. Eng. 2020, 2020, 8873113. [Google Scholar] [CrossRef]
- Shin, M.; Lee, H.S.; Park, M. A system dynamics approach for modeling construction workers’ safety attitudes and behaviors. Accid. Anal. Prev. 2014, 68, 95–105. [Google Scholar] [PubMed]
- Hedlund, A.; Gummesson, K.; Rydell, A. Safety motivation at work: Evaluation of changes from six interventions. Saf. Sci. 2016, 82, 155–163. [Google Scholar] [CrossRef]
- Zhu, J.B.; Zhang, C.; Wang, S.Y. Evolutionary Game Analysis of Construction Workers’ Unsafe Behaviors Based on Incentive and Punishment Mechanisms. Front. Psychol. 2022, 13, 907382. [Google Scholar] [CrossRef] [PubMed]
- Leung, M.Y.; Chan, I.Y.S.; Yu, J. Preventing construction worker injury incidents through the management of personal stress and organizational stressors. Accid. Anal. Prev. 2012, 48, 156–166. [Google Scholar] [CrossRef]
- Wang, M.; Sun, J.; Du, H. Relations between Safety Climate, Awareness, and Behavior in the Chinese Construction Industry: A Hierarchical Linear Investigation. Adv. Civ. Eng. 2018, 2018, 6580375. [Google Scholar] [CrossRef]
- Cigularov, K.P.; Chen, P.Y.; Rosecrance, J. The effects of error management climate and safety communication on safety: A multi-level study. Accid. Anal. Prev. 2010, 42, 1498–1506. [Google Scholar] [CrossRef]
- Li, H.; Di, H.; Tian, S. The Research on the Impact of Management Level’s Charismatic Leadership Style on Miners’ Unsafe Behavior. Open Biomed. Eng. J. 2015, 9, 244–249. [Google Scholar] [CrossRef]
- Shi, Y.; Du, J.; Ahn, C.R. Impact assessment of reinforced learning methods on construction workers’ fall risk behavior using virtual reality. Autom. Constr. 2019, 104, 197–214. [Google Scholar]
- Feng, Y.J.; Xing, Z.C. Work-family conflict and construction workers’ unsafe behavior: A moderated chain mediation model. J. Saf. Environ. 2021, 21, 2129–2138. [Google Scholar]
- Li, S.; Wu, X.; Wang, X. Relationship between Social Capital, Safety Competency, and Safety Behaviors of Construction Workers. J. Constr. Eng. Manag. 2020, 146, 04020059. [Google Scholar]
- Wang, Y.; Chong, H.Y.; Liao, P.C. Interactive mechanism of working environments and construction behaviors with cognitive work analysis: An elevator installation case study. Int. J. Occup. Saf. Ergon. 2019, 25, 362–376. [Google Scholar] [CrossRef] [PubMed]
- Ke, J.J.; Zhang, M.; Luo, X.W. Monitoring distraction of construction workers caused by noise using a wearable Electroencephalography (EEG) device. Autom. Constr. 2021, 125, 103598. [Google Scholar] [CrossRef]
- Greenwood, M.; Woods, H.M. The Incidence of Industrial Accidents upon Individuals: With Special Reference to Multiple Accidents; Her Majesty’s Stationery Office: London, UK, 1919. [Google Scholar]
- Heinrich, H.W. Industrial accident prevention. Soc. Serv. Rev. 1931, 5, 323–324. [Google Scholar]
- Russel, L.J.A.; Mehrabian, A. An Approach to Environmental Psychology; The MIT Press: Cambridge, MA, USA, 1974. [Google Scholar]
- Reason, J. Human Error; Cambridge University Press: Cambridge, UK, 1990. [Google Scholar]
- Marden, P. Human Factors in Nuclear Safety; Taylor & Francis: London, UK, 1996; pp. 99–116. [Google Scholar]
- Zhang, J.; Xiang, P.C.; Zhang, R. Mediating Effect of Risk Propensity between Personality Traits and Unsafe Behavioral Intention of Construction Workers. J. Constr. Eng. Manag. 2020, 146, 105–120. [Google Scholar] [CrossRef]
- Cheng, H.; Xie, Z. Multi-step data prediction in wireless sensor networks based on one-dimensional CNN and bidirectional LSTM. IEEE Access 2019, 7, 117883–117896. [Google Scholar] [CrossRef]
- Xia, H.; Hao, R. Adaptive GTS allocation in IEEE 802.15. 4 for real-time wireless sensor networks. J. Syst. Archit. 2013, 59, 1231–1242. [Google Scholar] [CrossRef]
- Yao, Y.; Xiong, N. Privacy-preserving max/min query in two-tiered wireless sensor networks. Comput. Math. Appl. 2013, 65, 1318–1325. [Google Scholar] [CrossRef]
- Lin, C.; He, Y.X. An energy-efficient dynamic power management in wireless sensor networks. In Proceedings of the 2006 Fifth International Symposium on Parallel and Distributed Computing, Timisoara, Romania, 6–9 July 2006. [Google Scholar]
- Kumar, P.; Kumar, R. PPSF: A privacy-preserving and secure framework using blockchain-based machine-learning for IoT-driven smart cities. IEEE Trans. Netw. Sci. Eng. 2021, 8, 2326–2341. [Google Scholar] [CrossRef]
- Wu, C.; Luo, C. A greedy deep learning method for medical disease analysis. IEEE Access 2018, 6, 20021–20030. [Google Scholar] [CrossRef]
- Qin, J.; Liu, C.; Huang, Q. Simulation on fire emergency evacuation in special subway station based on Pathfinder. Case Stud. Therm. Eng. 2020, 21, 100677. [Google Scholar] [CrossRef]
- He, S.B.; Peng, Y.X.; Sun, K.H. SEIR modeling of the COVID-19 and its dynamics. Nonlinear Dyn. 2020, 101, 1667–1680. [Google Scholar] [CrossRef] [PubMed]
- Wolfram, S. Universality and complexity in cellular automata. Phys. D Nonlinear Phenom. 1984, 10, 1–35. [Google Scholar] [CrossRef]
- Newaz, M.T.; Davis, P.; Jefferies, M. The Psychological Contract of Safety: The Missing Link between Safety Climate and Safety Behaviour in Construction Sites. Saf. Sci. 2016, 112, 9–17. [Google Scholar] [CrossRef]
- Rasmussen, J. The definition of human error and a taxonomy for technical system design. In New Tech and Human Error; Wiley: London, UK, 1987; pp. 23–30. [Google Scholar]
- Zhou, D. Research on the Propagation Characteristics and Mechanism of Unsafe Behavior of Construction Workers. Master’s Thesis, Jiangsu University, Zhenjiang, China, 2016. [Google Scholar]
- Figueroa, M.E. A Theory-Based Socioecological Model of Communication and Behavior for the Containment of the Ebola Epidemic in Liberia. J. Health Commun. 2017, 22, 5–9. [Google Scholar] [CrossRef]
- Wang, D.; Guan, F.; Jia, Q. Research on the transmission path of unsafe behavior of construction workers based on social network analysis. J. Saf. Sci. Technol. 2018, 14, 180–186. [Google Scholar]
- Xuan, H.Y.; Xu, L.D.; Li, L. A CA-based epidemic model for HIV/AIDS transmission with heterogeneity. Ann. Oper. Res. 2009, 168, 81–99. [Google Scholar] [CrossRef]
- Su, J.F.; Yang, Y.; Zhang, N. Study on the Tacit Knowledge Diffusion in Knowledge Collaboration Team Based on Heterogeneous Cellular Automata. Chin. J. Manag. 2017, 14, 245–253. [Google Scholar]
- Yu, H.; Qiang, M.; Dan, Z. Propagation characteristics of unsafe behaviors for construction workers from the perspective of group closeness. J. Saf. Sci. Technol. 2016, 12, 187–192. [Google Scholar]


Disclaimer/Publisher’s Note: The statements, opinions and data contained in all publications are solely those of the individual author(s) and contributor(s) and not of MDPI and/or the editor(s). MDPI and/or the editor(s) disclaim responsibility for any injury to people or property resulting from any ideas, methods, instructions or products referred to in the content. |
© 2023 by the authors. Licensee MDPI, Basel, Switzerland. This article is an open access article distributed under the terms and conditions of the Creative Commons Attribution (CC BY) license (https://creativecommons.org/licenses/by/4.0/).
Share and Cite
Chen, Z.; Zhang, Z.; Xiang, Y.; Wei, Y. Research on the Application of Heterogeneous Cellular Automata in the Safety Control and Detection System of Construction Project Implementation Phase. Electronics 2023, 12, 4046. https://doi.org/10.3390/electronics12194046
Chen Z, Zhang Z, Xiang Y, Wei Y. Research on the Application of Heterogeneous Cellular Automata in the Safety Control and Detection System of Construction Project Implementation Phase. Electronics. 2023; 12(19):4046. https://doi.org/10.3390/electronics12194046
Chicago/Turabian StyleChen, Zeyou, Zheyuan Zhang, Yong Xiang, and Yao Wei. 2023. "Research on the Application of Heterogeneous Cellular Automata in the Safety Control and Detection System of Construction Project Implementation Phase" Electronics 12, no. 19: 4046. https://doi.org/10.3390/electronics12194046