Article

Small-Signal Modeling and Configuration Analysis of Grid-Forming Converter under 100% Renewable Electricity Systems

1
State Grid Hubei Electric Power Research Institute, Wuhan 430074, China
2
State Grid Hubei Electric Power Company Limited, Wuhan 430074, China
*
Author to whom correspondence should be addressed.
Electronics 2023, 12(19), 4078; https://doi.org/10.3390/electronics12194078
Submission received: 4 September 2023 / Revised: 22 September 2023 / Accepted: 25 September 2023 / Published: 28 September 2023

Abstract

:
With the rapid development of renewable energy sources such as wind power and photovoltaics, the penetration rate of power electronic equipment represented by grid-forming (GFM) and grid-following (GFL) converters in the power system has been increasing. The development of modern power systems is gradually showing a trend of high proportion of renewable energy and high proportion of power electronic devices (double-high), which profoundly changes the dynamic characteristics of modern power systems. Most of the converters in the power system adopt the GFL control strategy, which lacks the ability to support frequency and voltage. The converter with GFM control have gradually been incorporated into high-proportion renewable energy systems due to their voltage support and inertial response capabilities. However, the proportion configurations of GFM converter in the GFM/GFL hybrid system still needs to be further investigated. Therefore, this paper compares the basic principles and control methods of converters based on GFM strategy and GFL strategy, establishes the small-signal model of 100% REI system, and comparatively analyzes the dynamic characteristics of GFM and GFL converters. Secondly, a proportional configuration method for the GFM converter in 100% renewable electricity independent system (100% REI system) is proposed, and then through the small-signal model, the influence of different proportions of GFM converters and control mode on the stability of 100% REI system is discussed, the minimum configuration proportion of GFM converter to satisfy the stable operation of the system is explored. Finally, the correctness of the proportional configuration of GFM converters proposed in this paper and the engineering feasibility of independent operation of 100% REI system is verified.

1. Introduction

With the goal of “carbon peaking and carbon neutrality” and the rapid development of renewable energy generation and control technology. The wide access of high proportion of renewable energy and the large-scale application of high proportion of power electronic equipment are becoming the important trend and key characteristics of the development of power system [1,2]. The new power system, characterized by a high proportion of renewable energy, determines notable disparities in control mode, physical topology, fault ride through, and devices interactions, when compared to conventional power systems dominated by synchronous generators [3,4,5]. Under the background of “double-high”, its large-scale application will greatly change the compositional structure and dynamic behavior of modern power system, and the inertia response and active support capacity of the system will experience a substantial decline, which have a profound impact on the operation characteristics and dynamic behavior of modern power system, and have produced some new stability problems [6,7].
Power electronic devices, represented by converters, make renewable energy “adjustable and controllable” due to their flexibility and rapidity of the control strategy, this enables the effective mitigation of the impact of high proportion of renewable energy integration on the stability of the power grid, and play an irreplaceable role in the stable operation of the power grid [8,9,10]. However, with the gradual replacement of electromechanical rotating devices, represented by synchronous generators, by high proportion of renewable energy based on power electronic technology, the power system is manifested as the reduction of rotor entity, the reduction of system’s inertia and the weakening of system damping at the physical level [11,12], which in turn leads to the weakening of system strength, and is more likely to lead to stability issues such as oscillations [13,14]. Furthermore, the characteristics of the modern power system from the rotor motion of traditional synchronous determines the phase and the excitation system determines the amplitude of the terminal voltage, into the multi-loop control of power electronic devices to determine the phase and amplitude of the terminal voltage, which further results in the fundamental change of the system characteristics and dynamic behavior [15,16]. Especially under high proportion or even 100% REI system, the dynamic behavior and stable characteristics of power electronic devices represented by converters are still unclear.
Currently, most of the converters in the power system adopt GFL control [17]. They regulate the input current by adjusting the reference value of active power or voltage, thereby controlling the active/reactive power fed into the grid [18]. Furthermore, they must rely on phase-locked loops to achieve synchronization with the grid and exhibit current-source characteristics and lack the ability to support frequency and voltage [19]. In order to solve the problems of “low inertia” and “weak damping” brought about by the high proportion of power electronic devices large-scale access to the power grid represented by converters, scholars in various countries have proposed the virtual synchronous generator (VSG) control technology by drawing on the physical mechanism of synchronous generators [20,21,22], which applied the synchronous generator’s rotor motion equations and the primary frequency regulation to the control of power electronic devices [23], so as to make the external characteristics of the power electronic devices present the similarity of the synchronous generator’s inertia and damping characteristics [24], and to be able to autonomously establish the voltage and frequency of the system [25,26], so as to effectively improve the stability of the power system dominated by the power electronic devices [27]. At present, many studies have been conducted on the single-unit operating characteristics of GFM converter [28], while the research on the stability of high proportion or even 100% renewable electricity hybrid system which are composed of GFM/GFL converters is relatively scarce. From the perspective of grid operation, some countries in the world, such as Denmark and Ireland, have already experienced scenarios where the instantaneous penetration rate of renewable energy reaches or even exceeds 100% during part of the year [29], and the dynamic behavior and stability problems of the system under such extreme scenarios are fundamentally different from the traditional power systems.
Under the GFL control strategy, PV and wind turbines have a weak support capacity for the frequency and voltage of the grid [30], which is difficult to satisfy the operation requirements of the 100% REI system. Therefore, it is necessary to add a certain proportion of converters with GFM control of the 100% REI system, which can increase the stability of the system, so as to improve the support capability of the system and enhance the strength of the grid. However, a low proportion of GFM converters can undermine the operation of the independent power system, while too high proportion of GFM converters may lead to oscillation problems. Simultaneously, the mechanical and electrical systems of wind turbines with GFM control have a coupling effect, creating new risks of electromechanical coupling oscillations that could result in severe equipment damage. Therefore, delving into a thorough investigation on the principles and influence of proportional configuration of GFM converters in 100% REI system holds significant importance regarding the construction and stable operation of 100% REI system. Short circuit ratio (SCR) is a useful indicator of system strength, the larger the SCR, the less the system is affected by disturbances, and the better the ability to stabilize the system [31,32]. Therefore, a proportional configuration method based on SCR for the GFM converter in 100% REI system is proposed.
Device model is one of the steps in the study of system stability [33,34], the basic principles and control methods of converters based on GFM strategy and GFL strategy are given in section II, and then established the small-signal model of the 100% REI system. The section III provides proportional configuration method. Then, by the small-signal model and engineering test results of a 100% REI system. In section IV, the influence of different proportions of GFM converters and control mode on the stability of system is discussed. Section V summarizes the conclusions.

2. Modeling of Devices and Comparative Analysis

Figure 1 depicts the typical topology of GFM/GFL converters, which consists of five parts: the DC-side equivalent circuit, the DC/AC converter, the LCL filtering circuit, the control mode switching module, and the AC grid. The DC-side of the GFM/GFL converters is considered a controlled DC voltage source, with Udc denoting the voltage of DC power supply, while L1 and L2 represent the filtering inductances and Ca, Cb and Cc denotes the filtering capacitance, they can be connected to each other through the corresponding capacitors [35,36]. i1abc and vabc represent the AC current and terminal voltage of converter, respectively. i2abc and uabc correspond to the current and voltage at point of common coupling(PCC) of the system. rl is the equivalent resistance of the line, and Ll is the equivalent inductance. eabc is the equivalent voltage of the grid, and the control mode switching module contains the GFM control strategy and the GFL control strategy.
Figure 2 is the control strategy of the GFM converter. The control strategy consists of two components: the outer-loop control and the inner-loop control. The outer-loop control encompasses the active power-frequency control strategy and the reactive power-voltage control strategy. In particular, the active power-frequency control strategy provides inertia support and damping characteristics for the 100% REI system by simulating the synchronous generator’s rotor motion equations and obtains the phase of the terminal voltage. On the other hand, the reactive power-voltage control strategy obtains the amplitude of the terminal voltage by simulating the excitation of the synchronous generator through droop control. The inner-loop control comprises the voltage control loop and the current control loop, effectively enhancing the response characteristics of the GFM converter. The current control loop obtains the reference value of terminal voltage for GFM converter by comparing the output current with the voltage control loop output. In this paper, Pref denotes the reference value for the active power, Pout signifies the active power output of the system, w0 represents the rated angular frequency of the grid, J stands for the virtual inertia coefficients, D pertains to the damping coefficient, w represents the output angular frequency of the active power-frequency control branch, Qref accounts for the reference value for the reactive power, Qout denotes the reactive power output of the system, Dq signifies the droop coefficient for the reactive power-voltage control strategy, Uref indicates the reference value of the PCC voltage, and U represents the measured value of the PCC voltage.
Figure 3 depicts the control scheme of the GFL converter. It comprises the voltage control loop, current control loop, and phase-locked loop. The voltage control loop ensures the terminal voltage remains at a nominal value by utilizing the reactive current command. The DC voltage is regulated using the active current command value. The phase-locked loop operates by continuously monitoring phase angle of the grid, offering a synchronization signal reference for control and pulse sequence generation.

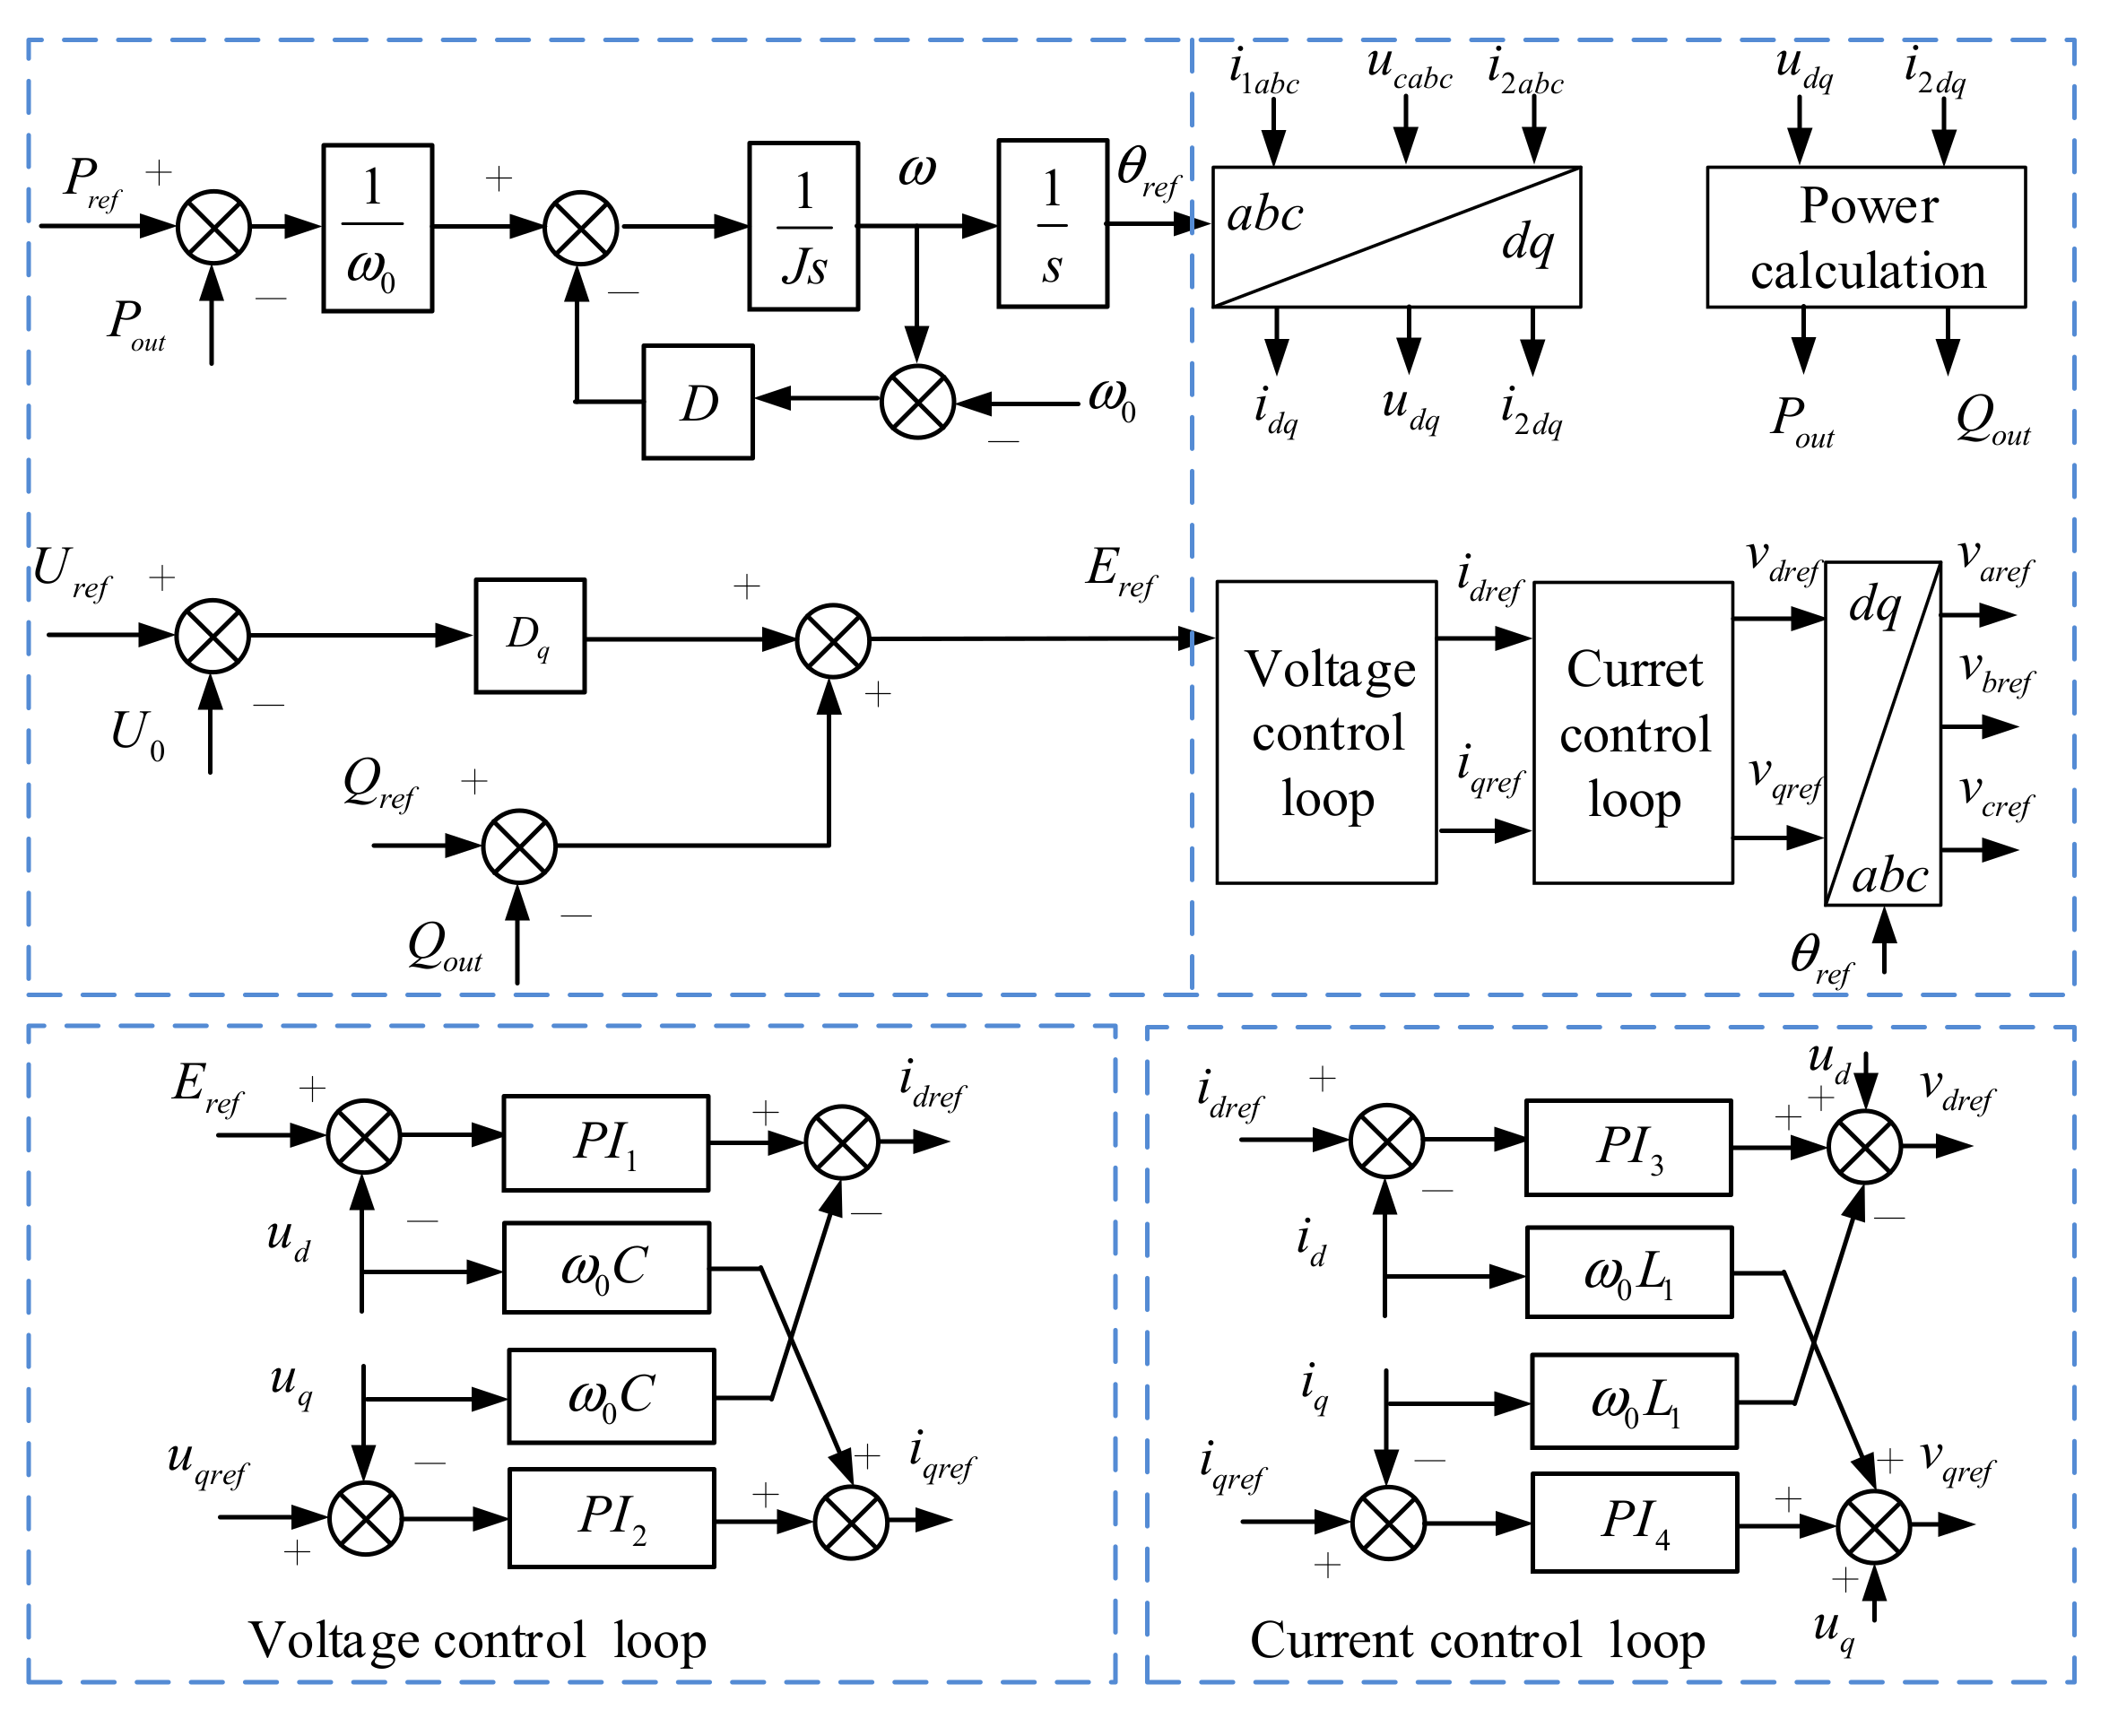
2.1. Modeling of GFM Converter

The GFM control strategy in this paper is mainly based on enhancing the inertia and damping characteristics of the system, which increases the inertia and damping for the converter by simulating the electromagnetic and mechanical equations of synchronous machine.
For the GFM control strategy, the response of the inner-loop control is fast enough to keep the terminal voltage at the rated value, E = Eref + j0 is the reference vector for the terminal voltage of GFM converter, Eref is determined by the reactive power-voltage control strategy, it ensures that the initial terminal voltage vector of the GFM converter lies on the d-axis of the controller by setting the uqref to zero.
The reactive power-voltage control strategy of GFM converter simulates the terminal voltage regulation characteristics of synchronous generator, and the equation can be obtain as
E r e f = Q r e f Q o u t + D q ( U r e f U ) K s
where K is the voltage regulation factor of reactive power-voltage control strategy.
Linearization is applied to Formula (1) at the equilibrium point.
Δ E r e f = Δ Q r e f Δ Q o u t D q Δ U K s
where Δ stands the disturbance around stable operating point, U is given as
U = u d 2 + u q 2
where ud and uq are the components of the PCC voltage in d-axis and q-axis, respectively, which are obtained by coordinate transformation of the measured value of the PCC voltage, and the perturbation can be expressed as
Δ U = u d 0 Δ u d + u q 0 Δ u q u d 0 2 + u q 0 2
The subscript 0 indicates the steady-state value corresponding to the variable. The active power-frequency control strategy of GFM converter simulates the synchronous generator’s rotor motion equations and obtains the phase of the terminal voltage, and the equation can be described by Formula (5)
J d ω d t = P r e f P o u t ω 0 D ω ω 0 d θ r e f / d t = ω
The J and D in the control strategy make the GFM converter have similar characteristics to the synchronous generator, and they supplement the inertia and damping required to maintain system stability.
Linearization is applied to Formula (5) at the equilibrium point.
J d Δ ω d t = Δ P r e f Δ P o u t ω 0 D Δ ω d Δ θ r e f / d t = Δ ω
The output power equation of the GFM converter is expressed as follows
P o u t = u d i d + u q i q Q o u t = u q i d u d i q
The id and iq are the components of the i1abc in d-axis and q-axis, respectively. The perturbation can be expressed as
Δ P o u t = u d 0 Δ i d + i d 0 Δ u d + u q 0 Δ i q + i q 0 Δ u q Δ Q o u t = u q 0 Δ i d + i d 0 Δ u q u d 0 Δ i q i q 0 Δ u d
The inner-loop control can effectively improve the dynamic performance of the GFM converter and limit the fault current, the dynamic equation of the voltage control loop can be described by Formula (9)
i d r e f = ( E r e f u d ) k v d p + k v d i / s ω 0 C u q i q r e f = ( u q r e f u q ) k v q p + k v q i / s + ω 0 C u d
where kvdp, kvdi and kvqp, kvqi are the PI control parameters of the d-axis and q-axis control of the voltage control loop of the GFM converter respectively.
Linearization is applied to Formula (9) at the equilibrium point.
Δ i d r e f = ( Δ E r e f Δ u d ) k v d p + k v d i / s ω 0 C Δ u q Δ i q r e f = ( Δ u q r e f Δ u q ) k v q p + k v q i / s + ω 0 C Δ u d
The equation of current control loop can be described by Formula (11)
v d r e f = ( i d r e f i d ) k v i d p + k v i d i / s ω 0 L 1 i q r e f + u d v q r e f = ( i q r e f i q ) k v i q p + k v i q i / s + ω 0 L 1 i d r e f + u q
where kvidp, kvidi and kviqp, kviqi are the PI control parameters of the d-axis and q-axis control of the current control loop of the GFM converter respectively.
Linearization is applied to Formula (11) at the equilibrium point
Δ v d r e f = ( Δ i d r e f Δ i d ) k v i d p + k v i d i / s ω 0 L 1 Δ i q r e f + Δ u d Δ v q r e f = ( Δ i q r e f Δ i q ) k v i q p + k v i q i / s + ω 0 L 1 Δ i d r e f + Δ u q

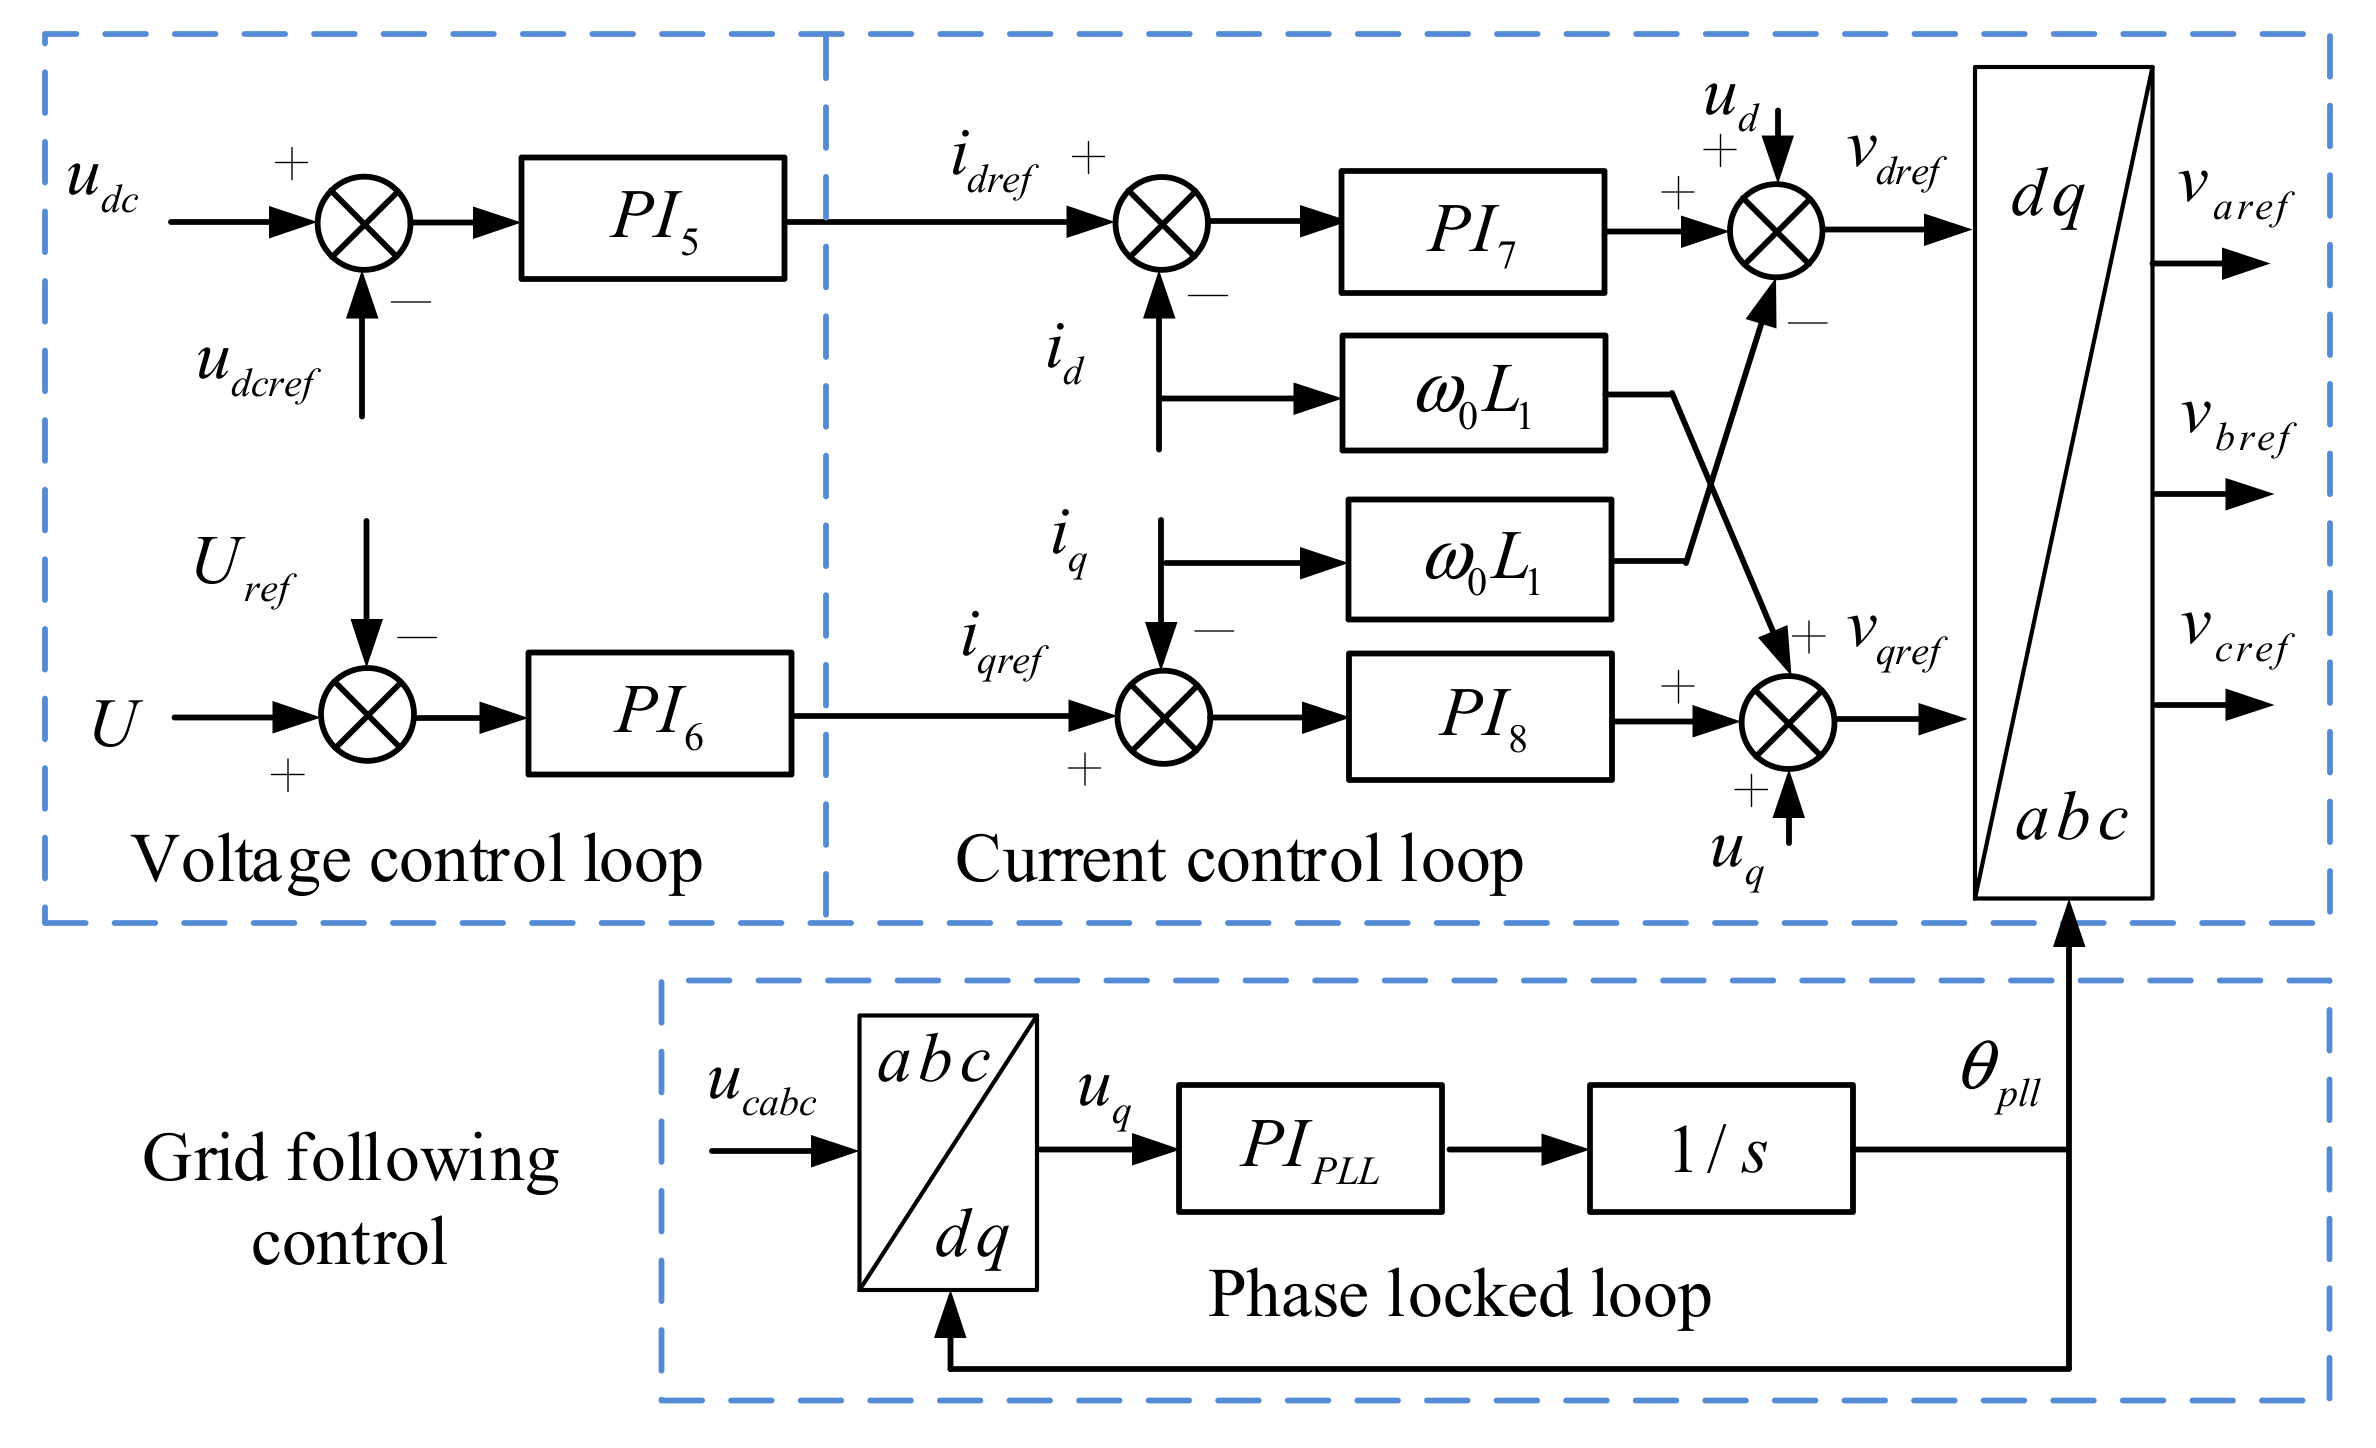
2.2. Modeling of GFL Converter

In this section, the internal coupling of the GFL converter is considered. The original equations of the DC voltage and a constant DC voltage control strategy for the d-axis can be obtained by neglecting the switching and conduction losses of the GFL converter
u d c = 2 P i n P o u t / s C d c i d r e f = u d c u d c r e f k l v d p + k l v d i / s
where klvdp, klvdi are the PI control parameters of the d-axis control of the voltage control loop of the GFL converter respectively
Linearization is applied to Formula (13) at the equilibrium point.
Δ u d c = Δ P i n Δ P o u t / s C d c u d c 0 Δ i d r e f = Δ u d c Δ u d c r e f k l v d p + k l v d i / s
The dynamic equation of terminal voltage control strategy for the q-axis can be expressed as
i q r e f = U 0 U r e f k l v q p + k l v q i / s
where klvqp, klvqi are the PI control parameters of the q-axis control of the voltage control loop of the GFL converter respectively
Linearization is applied to Formula (15) at the equilibrium point.
Δ i q r e f = Δ U 0 Δ U r e f k l q p + k l q i / s
The dynamic equations of the inner-loop current control of GFL converter can be expressed as
v d r e f = ( i d r e f i d ) k i d p + k i d i / s ω 0 L 1 i q r e f + u d v q r e f = ( i q r e f i q ) k i q p + k i q i / s + ω 0 L 1 i d r e f + u q
where kidp, kidi and kiqp, kiqi are the PI control parameters of the d-axis and q-axis control of the current control loop of the GFM converter respectively.
Linearization is applied to Formula (17) at the equilibrium point.
Δ v d r e f = ( Δ i d r e f Δ i d ) k i d p + k i d i / s ω 0 L 1 Δ i q r e f + Δ u d Δ v q r e f = ( Δ i q r e f Δ i q ) k i q p + k i q i / s + ω 0 L 1 Δ i d r e f + Δ u q

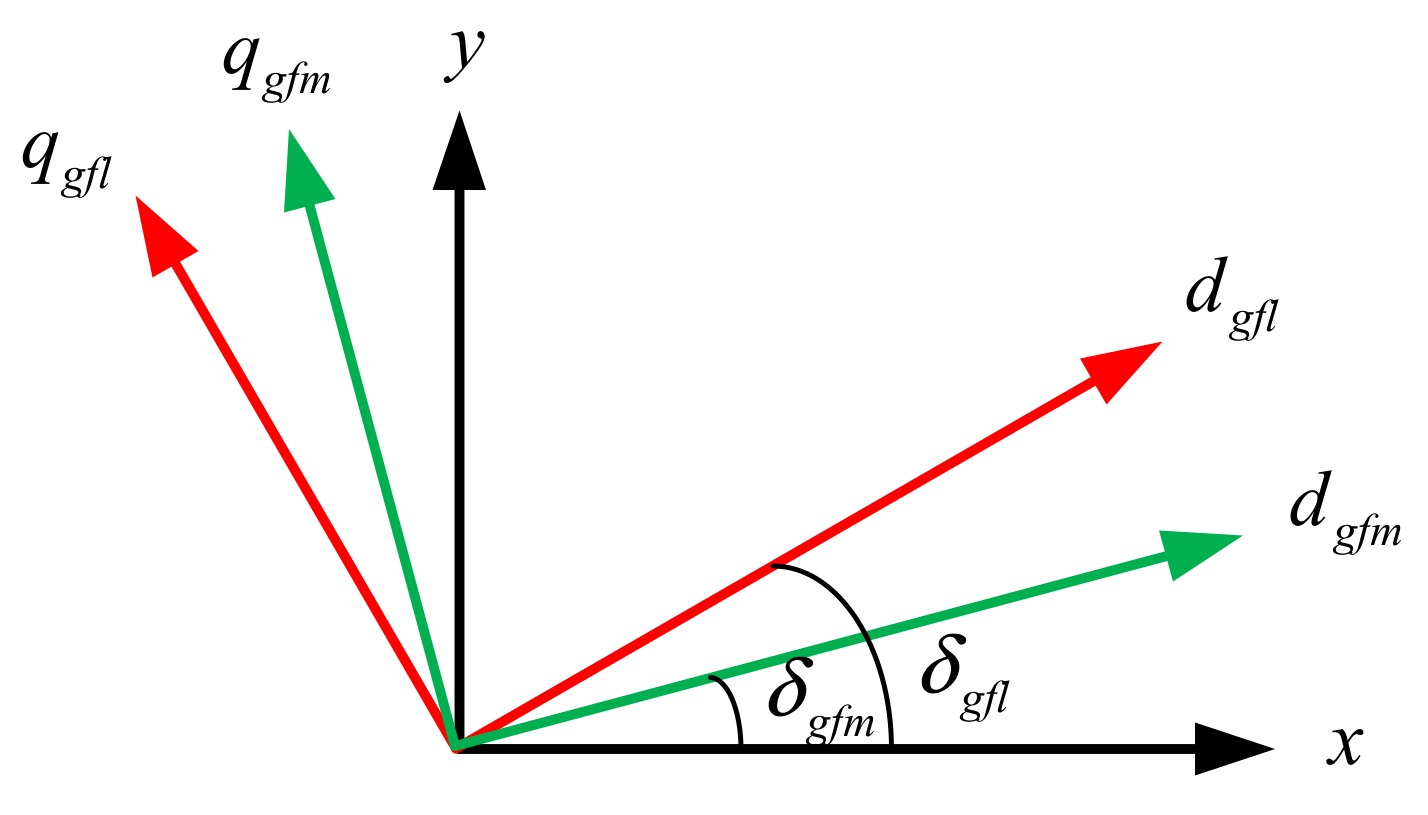
2.3. Interfaces Relationship

The control methods of the GFM/GFL converters are established based on respective synchronous dq reference frame, while the grid is established based on xy reference frame. Therefore, the relationship between the different reference frames needs to be established. The relative position relationship between the dq reference frame of the GFM converter, the dq reference frame of the GFL converter and the xy common reference frame is shown in Figure 4. δgfm and δgfl denote the angular relationship between the different reference frames.
The relationship between the different reference frames be described by Formulas (19) and (20)
f x f y = cos δ g f m sin δ g f m sin δ g f m cos δ g f m f d f q
f d f q = cos δ g f m sin δ g f m sin δ g f m cos δ g f m f x f y
The spatial rotation vector f can represent rotation vectors such as magnetic chains, voltages, currents, etc. Other reference frames have a similar relationship with the common reference frame, which will not be repeated here.

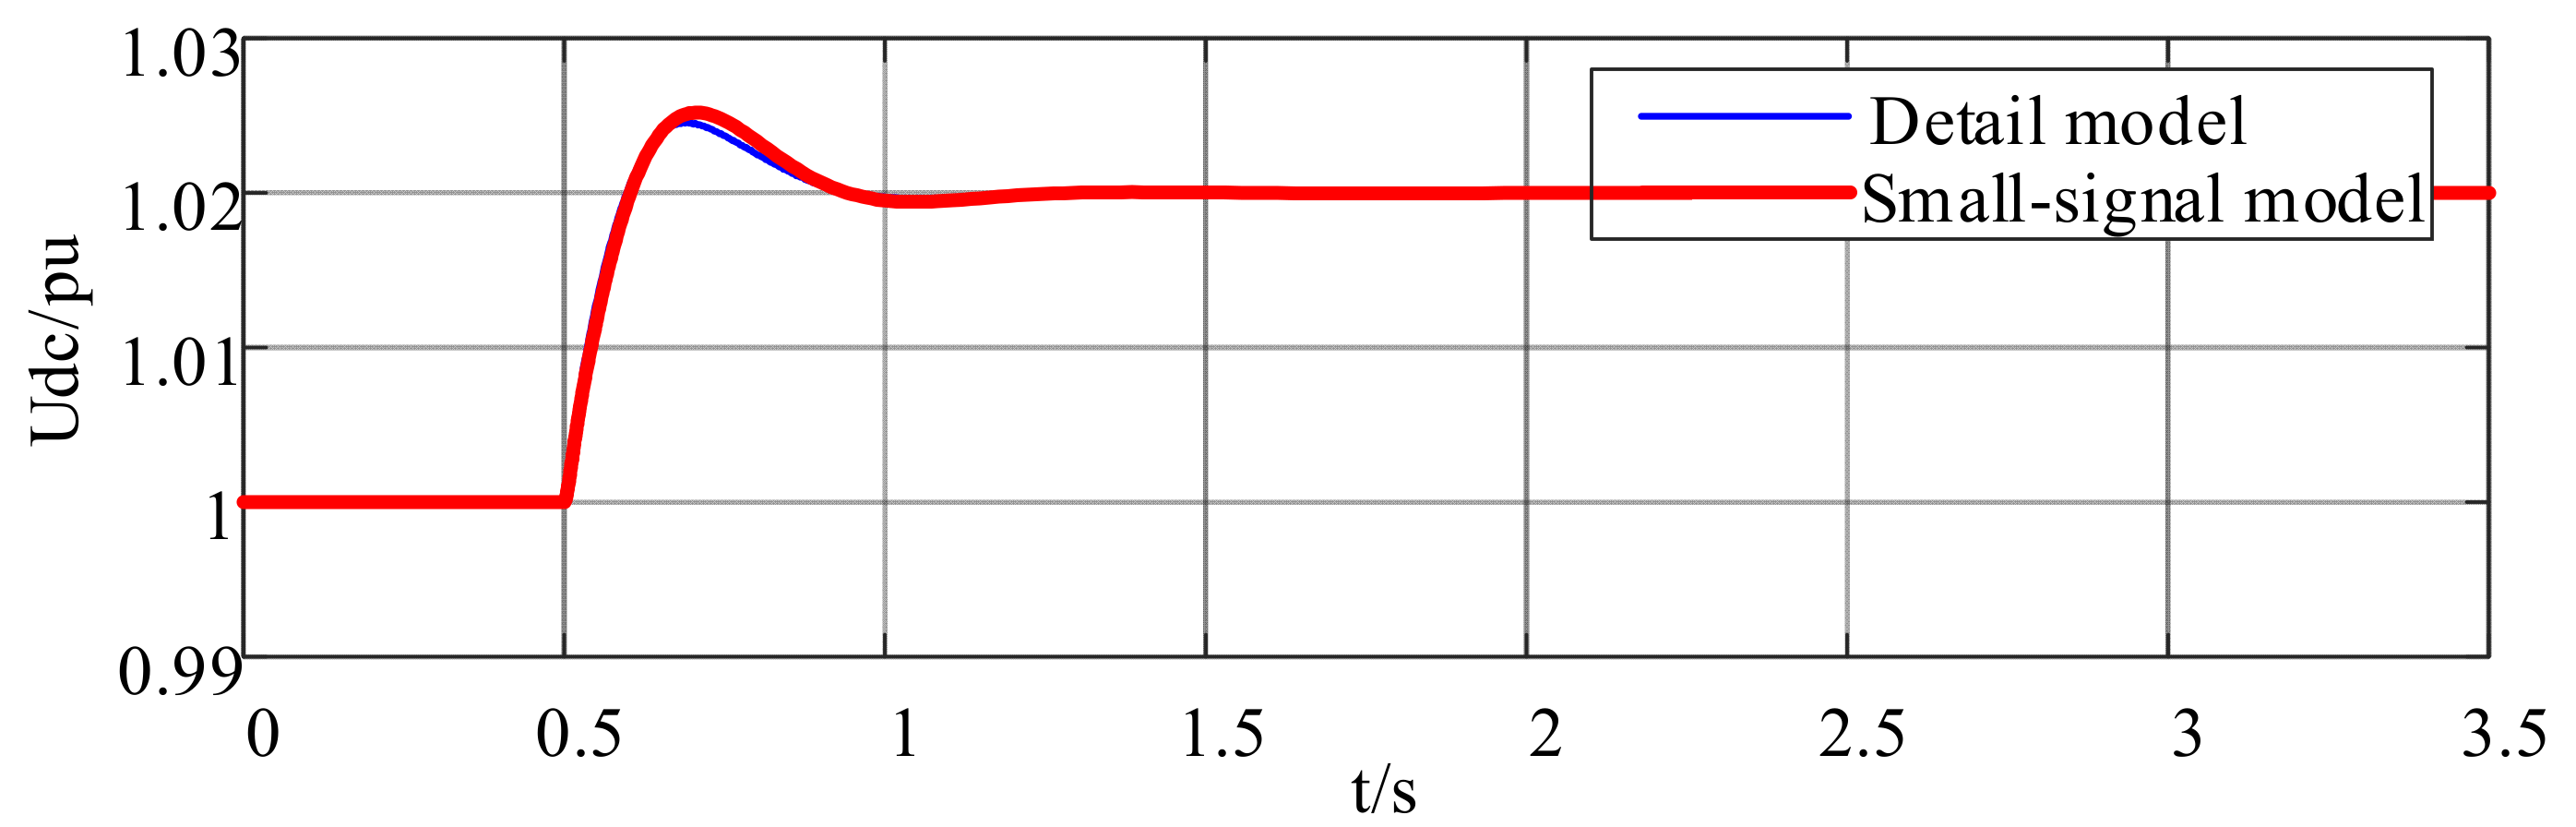
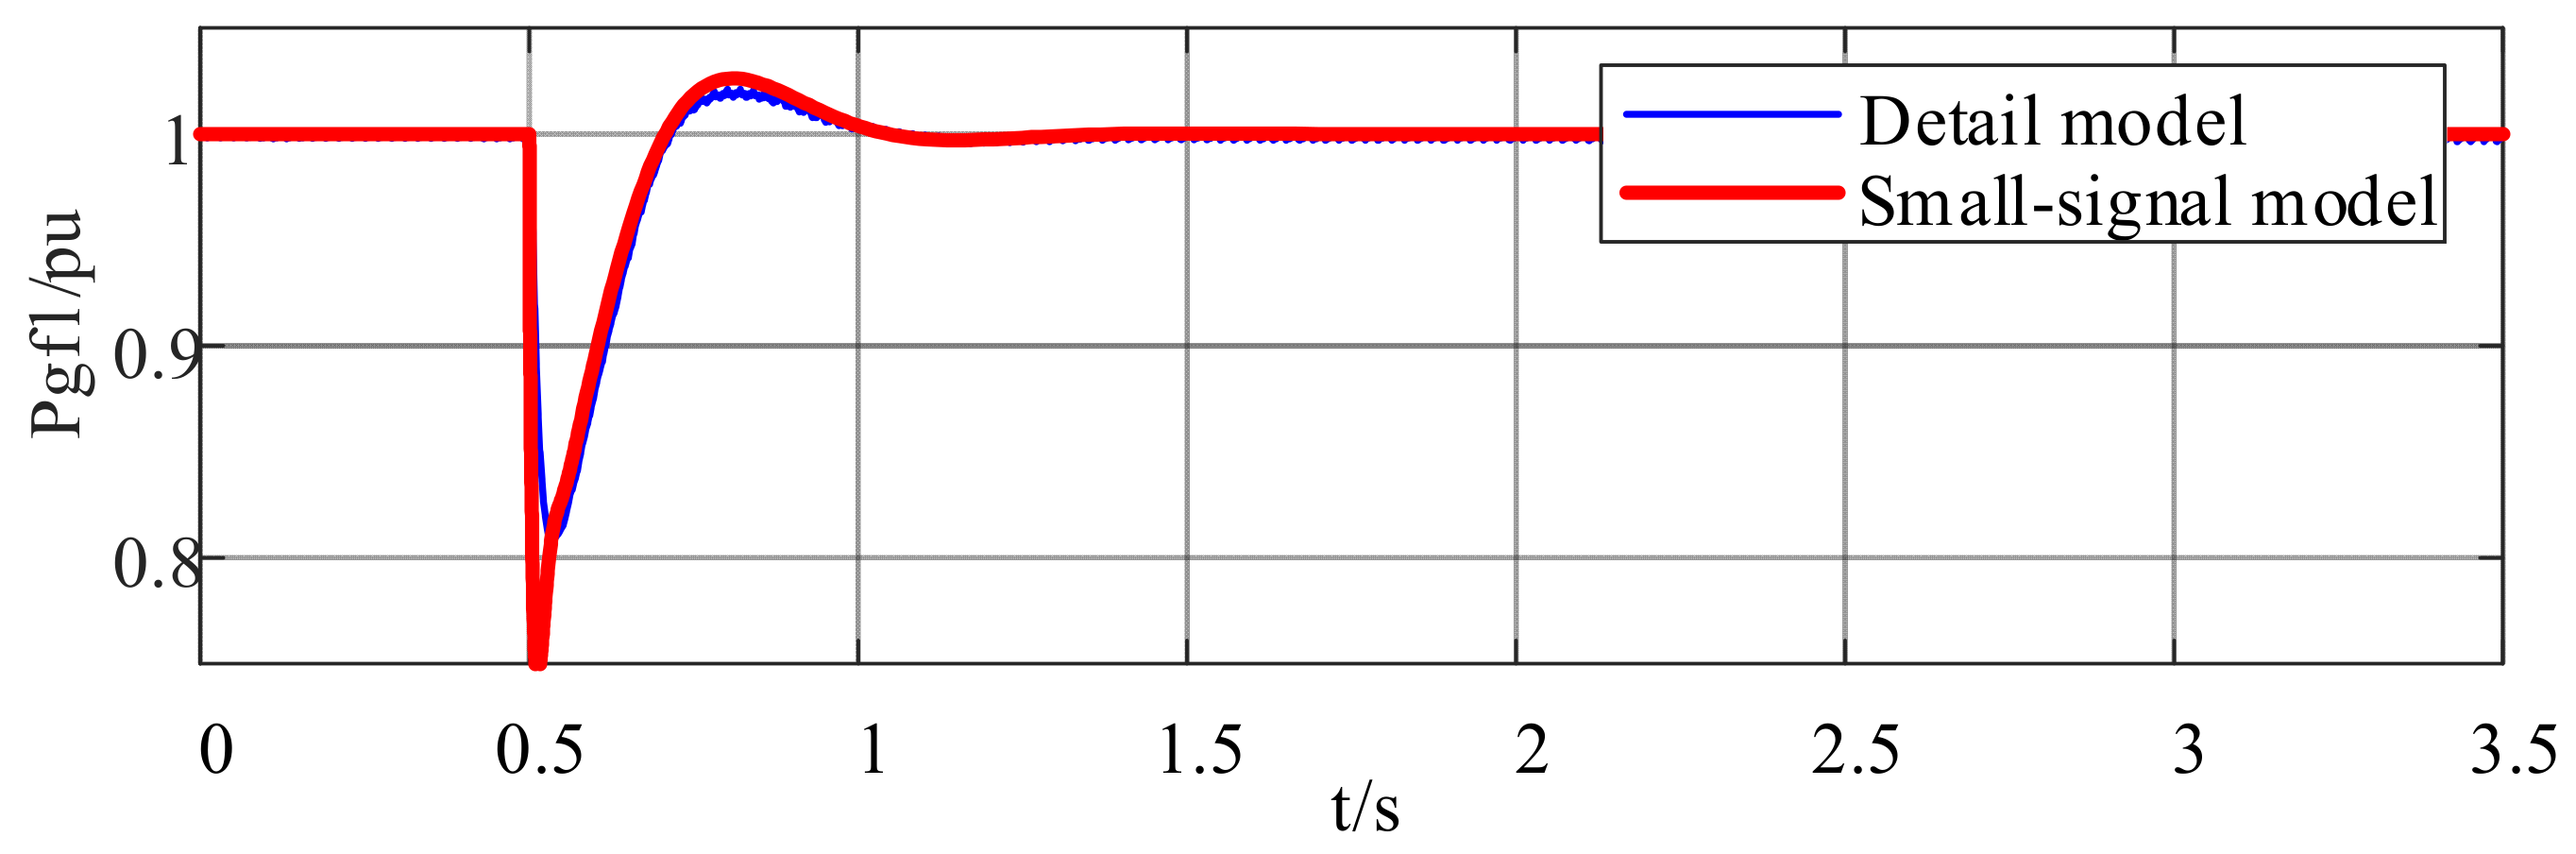
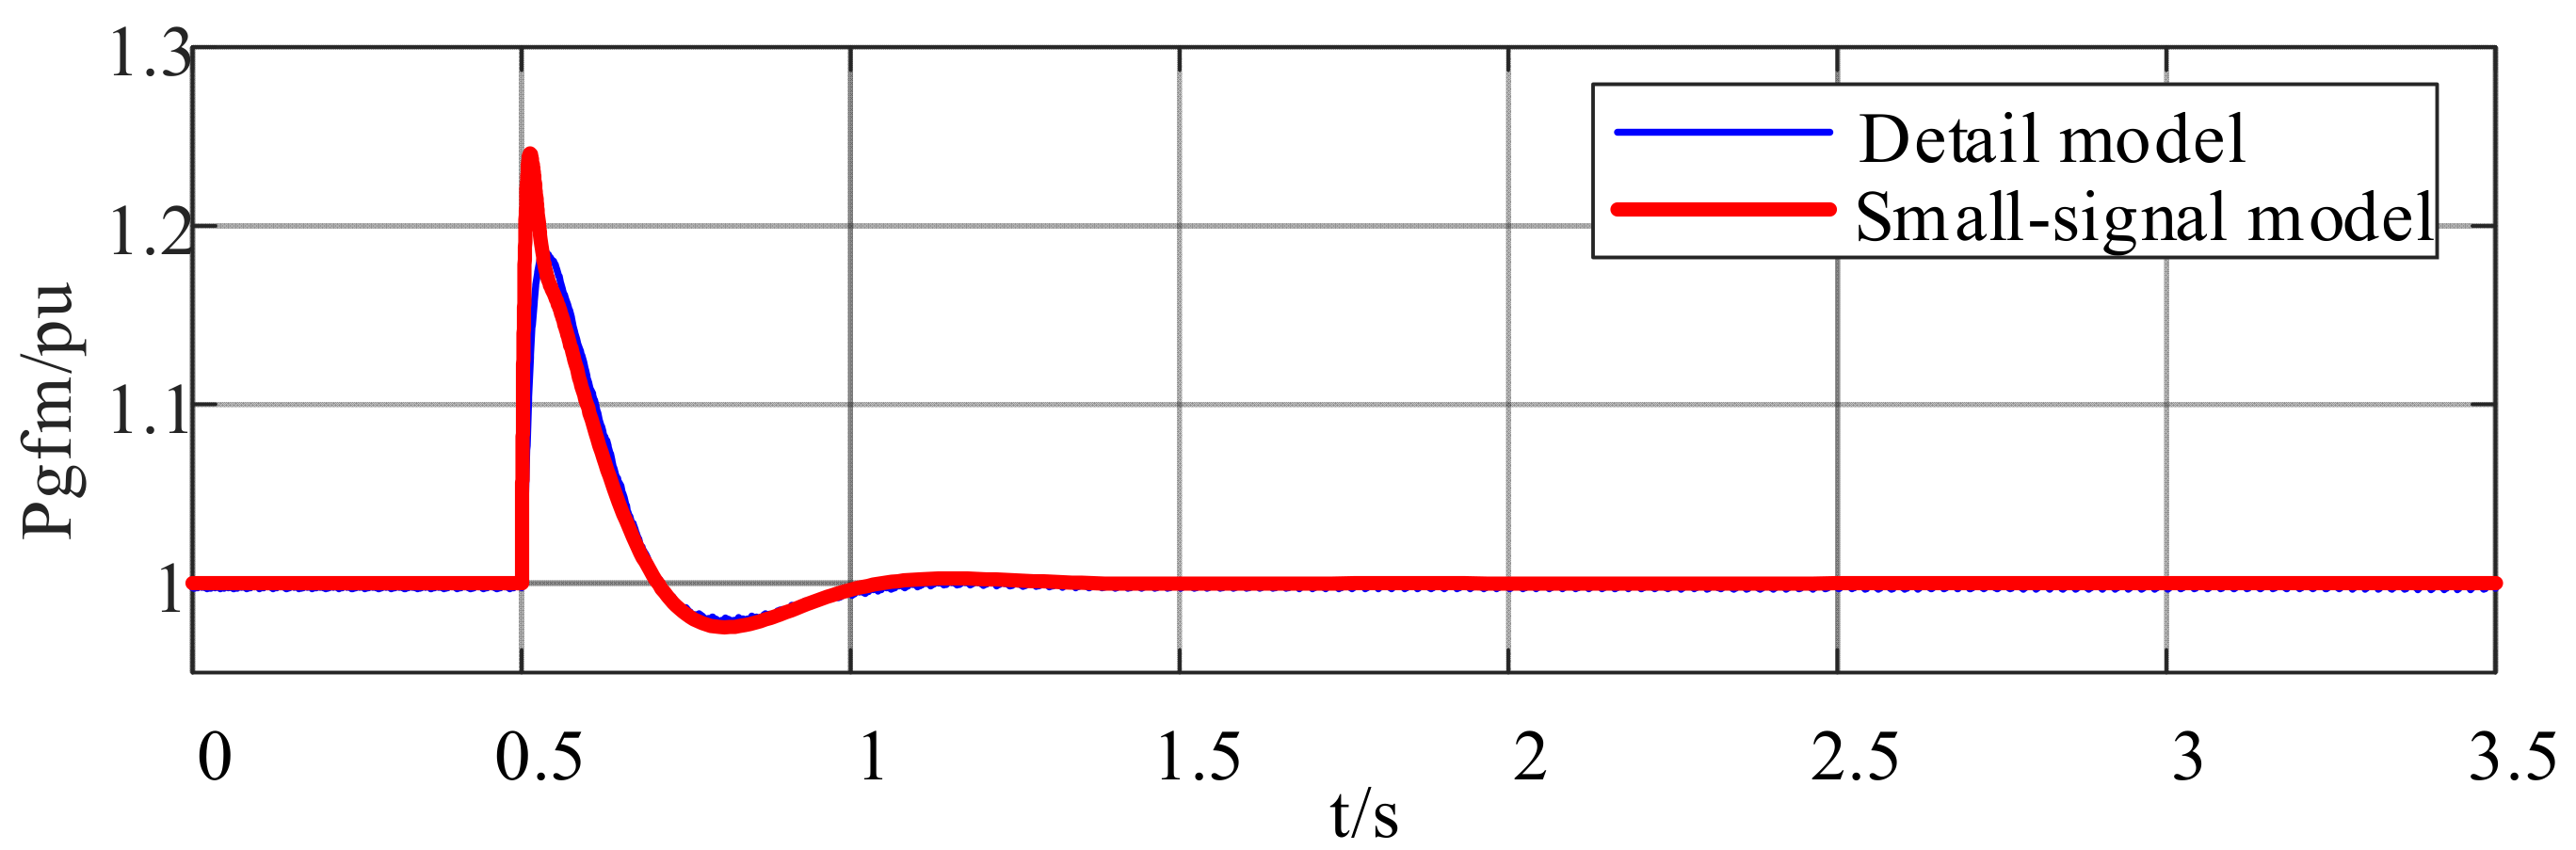
2.4. Small-Signal Model Validation

In order to verify the correctness of the small-signal model in this paper, the time-domain model shown in Figure 5 was established in PSCAD. The small-signal model derived in this paper was established in Matlab/Simulink, the main parameters of the system are given in Table 1. The results of the two models were compared and the accuracy of the small-signal model was verified.
Initially, the system of PV station with the GFL control strategy operates at udcref = 1.0 pu, the udcref experienced a reference value perturbation of +0.03 pu at 0.5 s, and the time-domain comparative results of the two models are given in in Figure 6, Figure 7 and Figure 8. The Figure 6 gives the time-domain comparative results of the DC voltage of PV station with the GFL control strategy. The Figure 7 gives the time-domain comparative results of the active power of PV station with the GFL control strategy. The Figure 8 gives the time-domain comparative results of the active power of PV station with the GFM control strategy. From time-domain comparative results of the GFM/GFL converter, the dynamic process of the small signal in this paper can fit the dynamic process of the time-domain model well, and the correctness of the small-signal model can be verified.

3. Characteristics Comparative Analysis and Proportional Configuration Method

3.1. Characteristics Comparative Analysis of GFM and GFL Control

When the PV station with GFL control strategy is connected to a weak grid, due to its physical structure and control strategy, it lacks the ability to support the frequency and voltage of the power system, and is prone to instability. On the contrary, the PV station with GFM control strategy is controlled as the voltage source, and its dynamic characteristics can be described by the parallel connection of the two voltage sources, and the stronger strength of the system is, the smaller the liaison impedance between the two voltage sources, which in turn raises the risk of instability.
The Nyquist diagram of PV stations with GFM/GFL control under different SCRs are given in Figure 9. It can be seen from Figure 9 that when the SCR is 5 and 2.5, neither the PV station with GFM control nor PV station with GFL control do not enclose the point (−1 + j0). When the SCR is 1.5, the PV station with GFL control encircles the point (−1 + j0) two times counterclockwise and the system is in an unstable state, while the PV station with GFM control does enclose the point (−1 + j0) when the SCR is 1.5, and the system is in a stable state. So it can be seen that for the PV system, the PV station with GFM control has a better stability under the weak grid, and it is able to better adapt to the system with different SCRs.
Figure 10 shows the Nyquist diagram of PV stations with GFM/GFL control under different kP and ki parameters when the SCR is 2.5. It is possible to learn from the diagram that when the ki parameter of current control loop is 10, both the PV station with GFM control and PV station with GFL control are in a stable state, and when the integral parameter increases to 100, the PV station with GFL control encircles the point (−1 + j0) counterclockwise and the system is in an unstable state, while the PV station with GFM control is in a stable state. When the kP parameter of current control loop increases, both the PV station with GFM control and PV station with GFL control are in a stable state.
Through the above analysis, it can be seen that the stability of the PV station with GFL control is relatively poor under the weak grid, and the setting range of the current control loop parameters is relatively small. The PV station with grid-forming control adopts the self-synchronized control mode, which will no longer rely on the phase-locked loop and has the inertia support ability, and has a stronger adaptive ability to the weak grid, and the adaptive performance of the current control loop parameters is better.

3.2. Proportional Configuration Method

The GFM converter has the characteristics of power synchronization or inertial synchronization, which not only can spontaneously synchronize with the grid without PLL, but also can autonomously construct the frequency and voltage of the system [37,38,39,40,41]. However, it is not necessarily better for the stability performance of a 100% renewable electricity system to have a higher proportion of GFL converter, the control strategy of GFL converter introduces the rotor operation equation of synchronous generators, as well as the power angle and synchronization problems, which may further lead to more complex coupling oscillations and other problems [42,43,44], therefore, a fully GFM-control-based system is not recommend. From the perspective safe and stable operation of new power systems, the complementary approach of GFL control and GFM control in 100% renewable electricity system is an effective solution. Some converters adopt the GFM control strategy to generate the voltage and frequency of the system, while other converters still use the existing GFL control strategy, therefore, how to determine the reasonable has become one of the main difficult issues of current research. To address this, this section proposes a capacity configuration principle based on SCR, taking the Figure 5 as an example, to analyze the minimum proportion requirement for GFM devices in 100% REI system
Firstly, it is imperative to elucidate the definition of the proportions by the GFM devices, namely the ratio between the installed capacity of the GFM equipment and the total installed capacity of the system.
s g = S g f m S g f m + S g f l
where Sgfm and Sgfl represent the installed capacity of the GFM equipment and GFL equipment of the system, respectively.
In a renewable electricity system, the SCR is used to measure the relative strength of the AC grid relative to the electricity equipment
S C R = S a c P N = 1 Z p u
where Sac represents the short-circuit capacity of AC grid, PN is the rated capacity of the power electronic equipment, Zpu represents the normalized value of the impedance of system. By utilizing Formulas (21) and (22), the terminal SCR of the PV station with the GFL control can be obtained.
S C R = 1 ( Z g f m + Z T 1 ) s g ( 1 s g ) + Z T 2
where Zgfm represents the internal impedance of the PV station with the GFM control, ZT1 and ZT2 represent leakage reactance of the transformer.
According to the Formula (23), the proportions of the PV station with the GFL control strategy of the system can be obtained.
s g = Z g f m + Z T 1 S C R 1 + S C R ( Z g f m + Z T 1 Z T 2 )
The critical short-circuit ratio can measure the critical stability of the system, and for a 100% REI system, there should exist a critical SCR. When the actual SCR of the system exceeds the critical SCR, the system will become unstable. In Figure 5, the internal impedance of GFM converter is 0.14 pu, ZT1 and ZT2 are 0.1 pu, according to the GB/T 40581-2021, when the SCR of the renewable electricity system is less than 1.5, the power system is very easy to be destabilized. Bringing SCR = 1.5 to Formula (24), we can get the proportion of the GFM converters as 30%. It needs to be explained that the SCR analysis only considers the impact of the short-circuit capacity provided by GFM devices on the PV station with the GFL control, without taking into account the interaction and influence among devices. Therefore, the actual proportion of GFM devices in the configuration is often slightly higher than the calculation result in this paper. In addition, the installation proportion of GFM devices also needs to be analyzed in detail, considering factors such as load characteristics, network structure, and stability assessment standards.

4. Discussion Analysis and Engineering Case Study

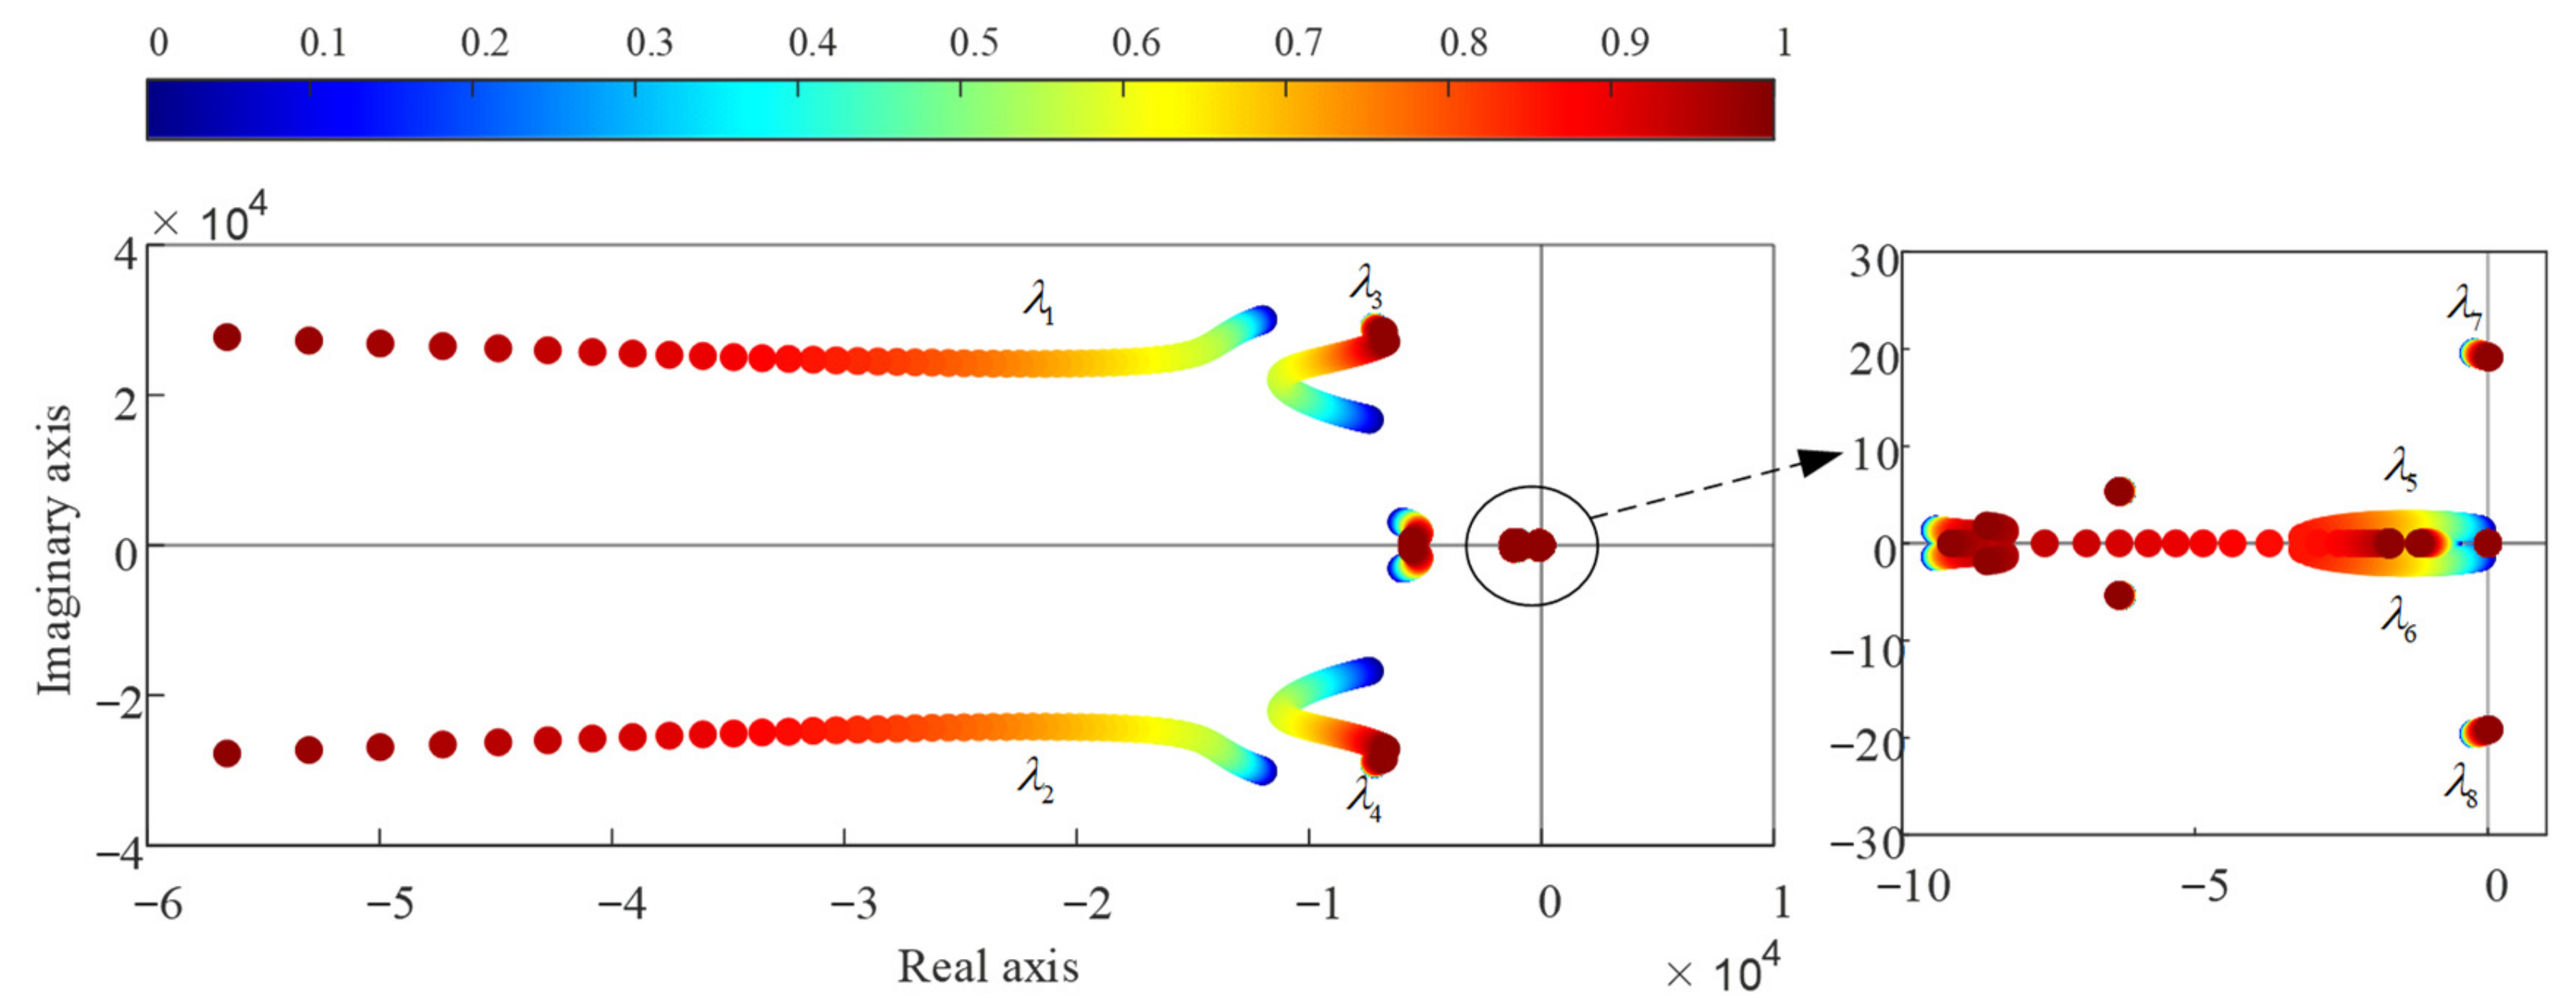
4.1. Discussion Analysis of Different Proportions of GFM Converter

In order to verify the correctness of the proportional configuration method of GFM converters proposed in this paper. The small-signal model of the 100% REI system will be used to discuss the influence of different proportions of GFM converter on the stability of system. Different proportions of GFM converter will affect the dynamic stability characteristics of the 100% REI system, and Figure 5 gives the 100% REI system diagram. The effect of different proportions of the PV station with the GFM control strategy on the stability of 100% REI system is investigated. In addition, the modal participation factor is also used, which can describe the degree to which the main state variables participate in the oscillation mode.
Figure 11 shows the influence of different proportions of the PV station with the GFM control strategy on the stability of 100% REI system. With the decrease of the proportions of the PV station with the GFM control strategy, the λ1,2 move monotonically toward the imaginary axis, but always stays to the left of the imaginary axis, and showing a decrease in stability as the proportions decrease, the λ11,12 move monotonically toward and across the imaginary axis, and as the proportions decrease they reach the right of the imaginary axis, at which point 100% REI system has a steady state transition to an unstable state, where the eigenvalue that causes the system state to change is (0.0059 ± 1.2i). The proportions of the PV station with the GFM control strategy in this scenario is 37%, which is slightly larger than the calculated value and can illustrate the validity of the proposed proportional configuration method.
Based on the eigenvalue locus analysis of the 100% REI system, the modal analysis is applied, and the results give the main state variables of unstable mode caused by the different proportions of the PV station with the GFM control strategy. Table 2 gives the eigenvalues of the oscillation mode and the participation factor of main state variables, the subscript GFM denotes the corresponding variable in GFM control. According to Table 2, the unstable mode mainly related to active power-frequency control strategy and voltage control of GFM converter.

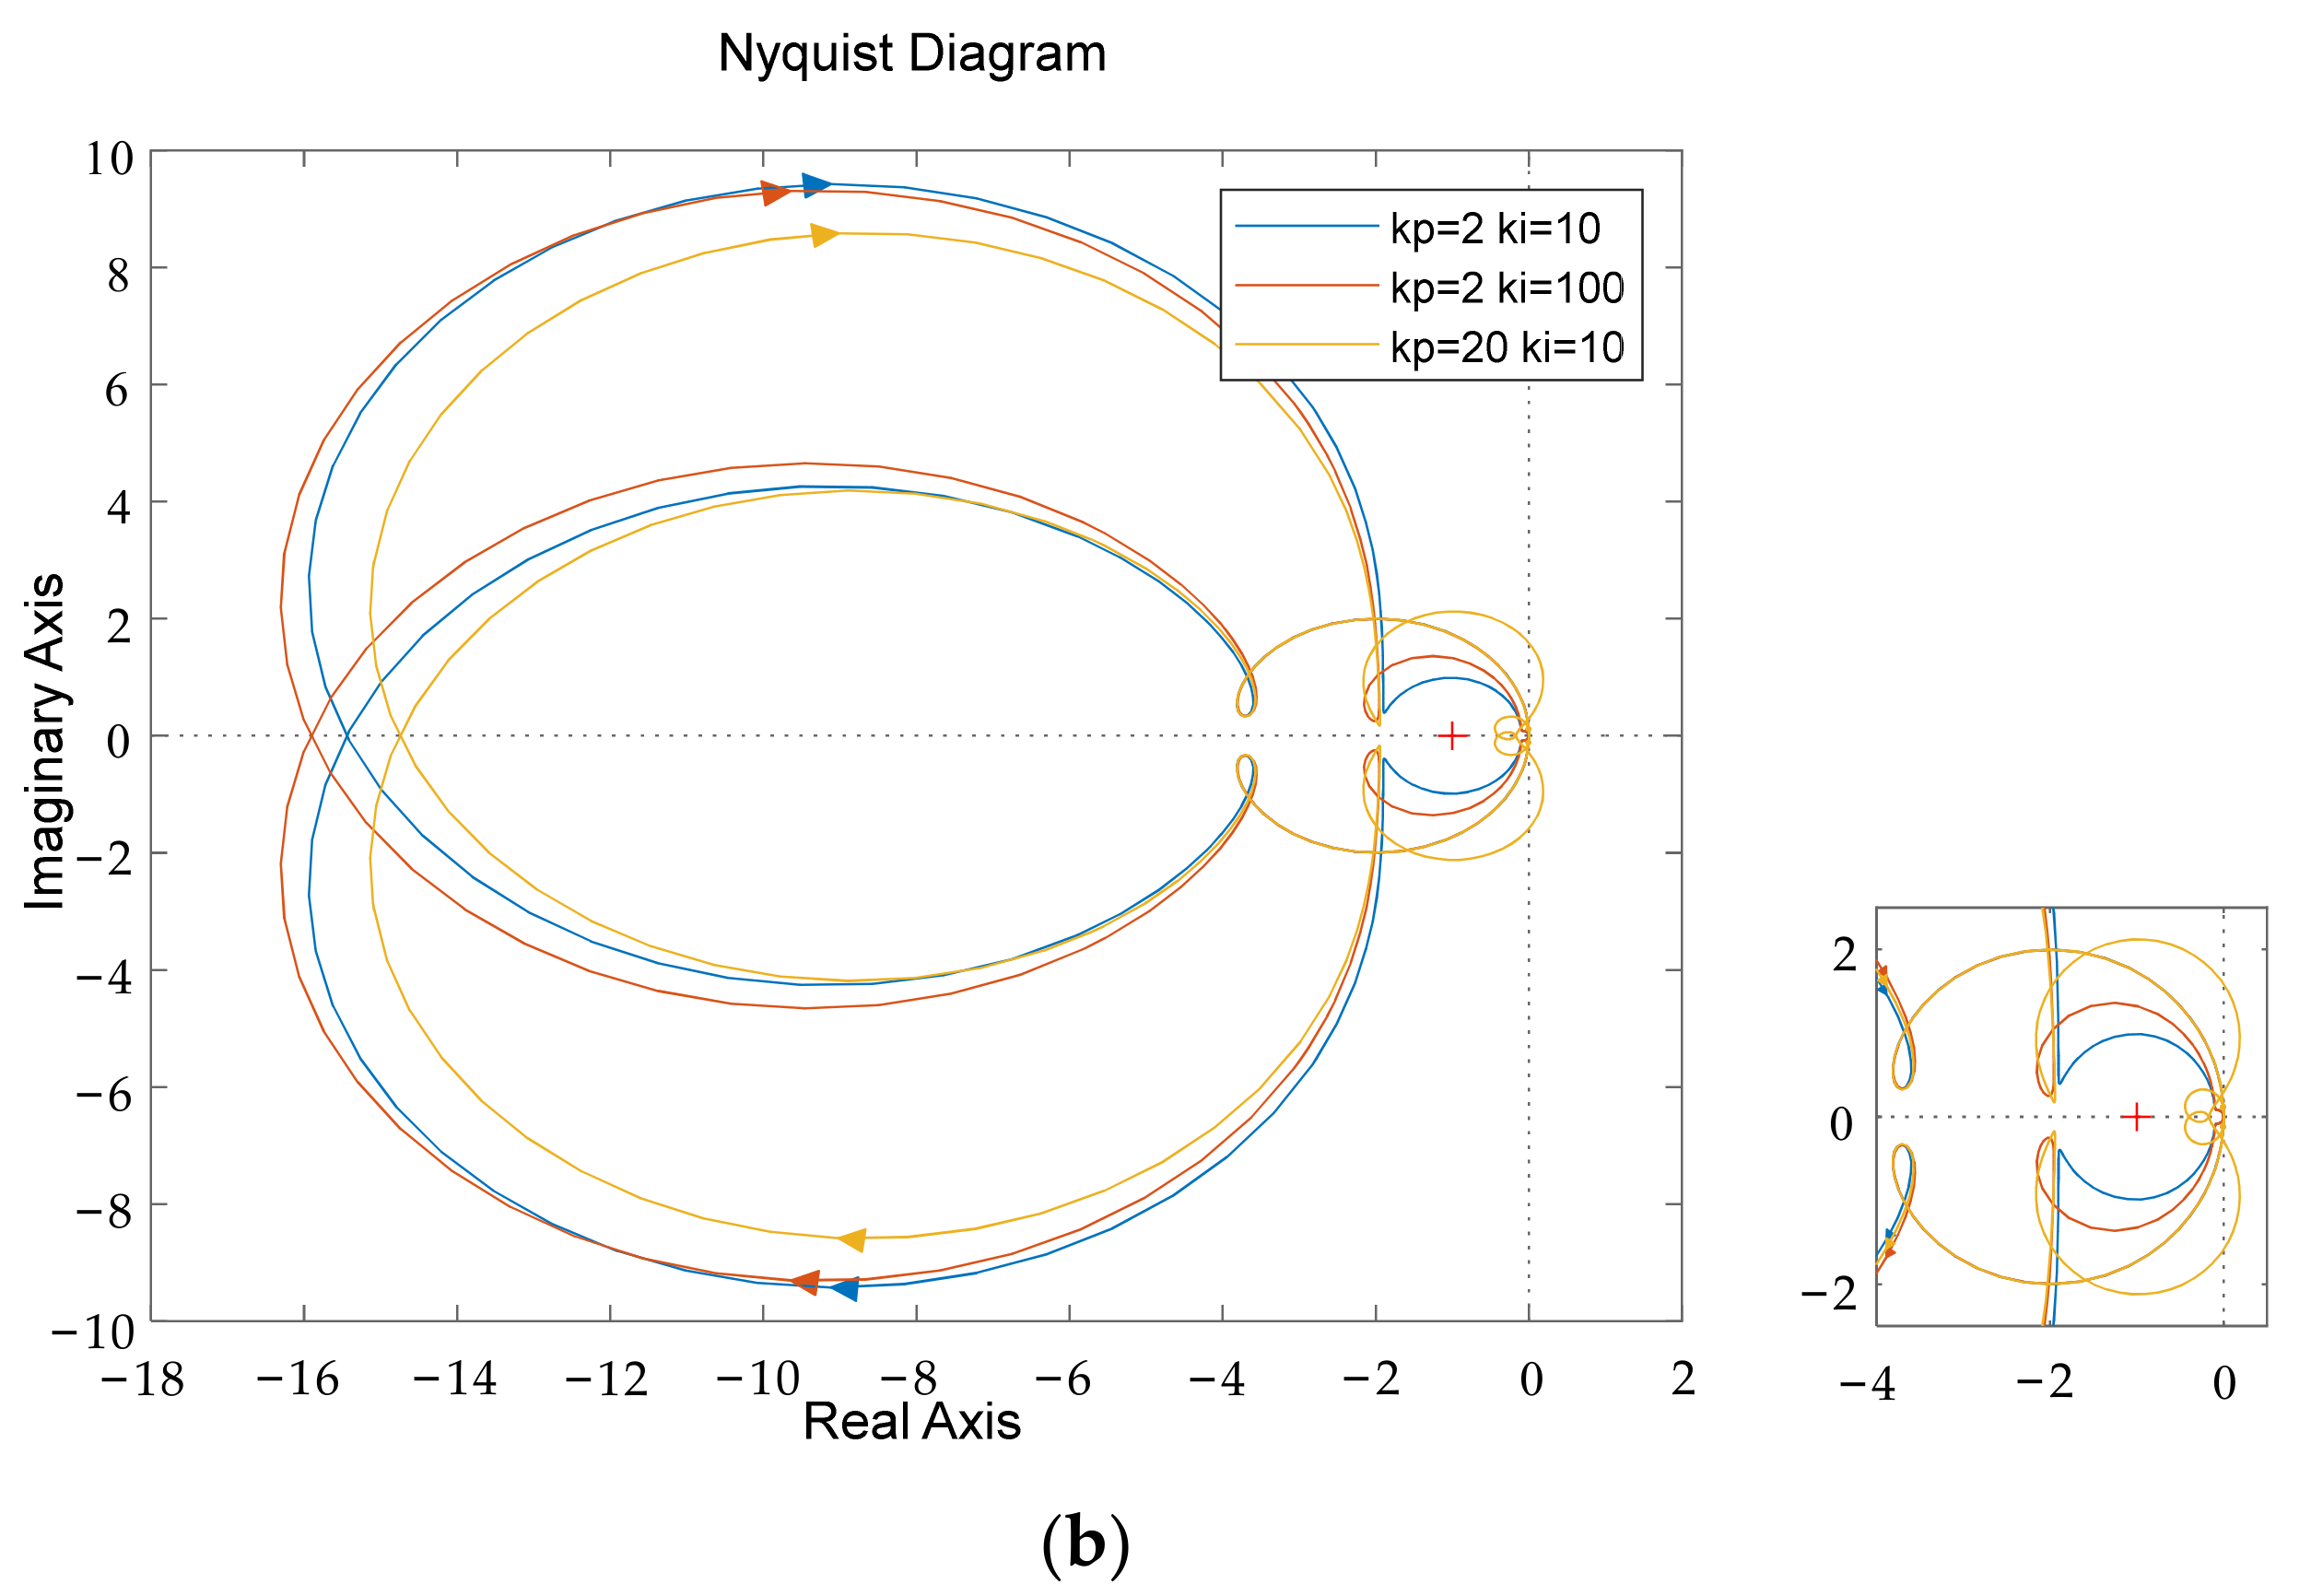
4.2. Discussion Analysis of Different Voltage Control Loop Parameters of GFM Converter

The voltage control loop of GFM converter can effectively enhance the response characteristics of the GFM converter and its control parameters will affect the dynamic characteristics of the 100% REI system. The small-signal model of the 100% REI system will be used to analyze the influence of different voltage control loop parameters of GFM converter on the stability of system. The effect of different bandwidth of the voltage control loop of GFM converter on the stability of 100% REI system is investigated, and the bandwidth can be changed by changing the PI parameters of the voltage loop [45]. In addition, the modal participation factor is also used, which can describe the degree to which the main state variables participate in the oscillation mode.
Figure 12 shows the influence of different bandwidth of the voltage control loop of GFM converter on the stability of 100% REI system. As the bandwidth of the voltage control of GFM converter increases while the damping ratio keeps constant, the λ1,2 and λ5,6 move monotonically in the direction away from the imaginary axis, and showing an increase in stability as the bandwidth increase, the λ3,4 move in the direction away from the imaginary axis and then toward the imaginary axis, but always stays to the left of the imaginary axis, the λ7,8 move monotonically toward and across the imaginary axis, and as the bandwidth increase they reach the right of the imaginary axis, at which point 100% REI system has a steady state transition to an unstable state, where the eigenvalue that causes the system state to change is (0.0145 ± 19.17i).
Based on the eigenvalue locus analysis of the 100% REI system, the modal analysis is applied, and the results give the main state variables of unstable mode caused by the different bandwidth of the voltage control loop of GFM converter. Table 3 gives the eigenvalues of the oscillation mode and the participation factor of main state variables, the subscript GFL denotes the corresponding variable in GFL control. According to Table 3, the unstable mode mainly related to the dynamics of DC-side capacitance, voltage control loop and current control loop of PV station with GFL control strategy.

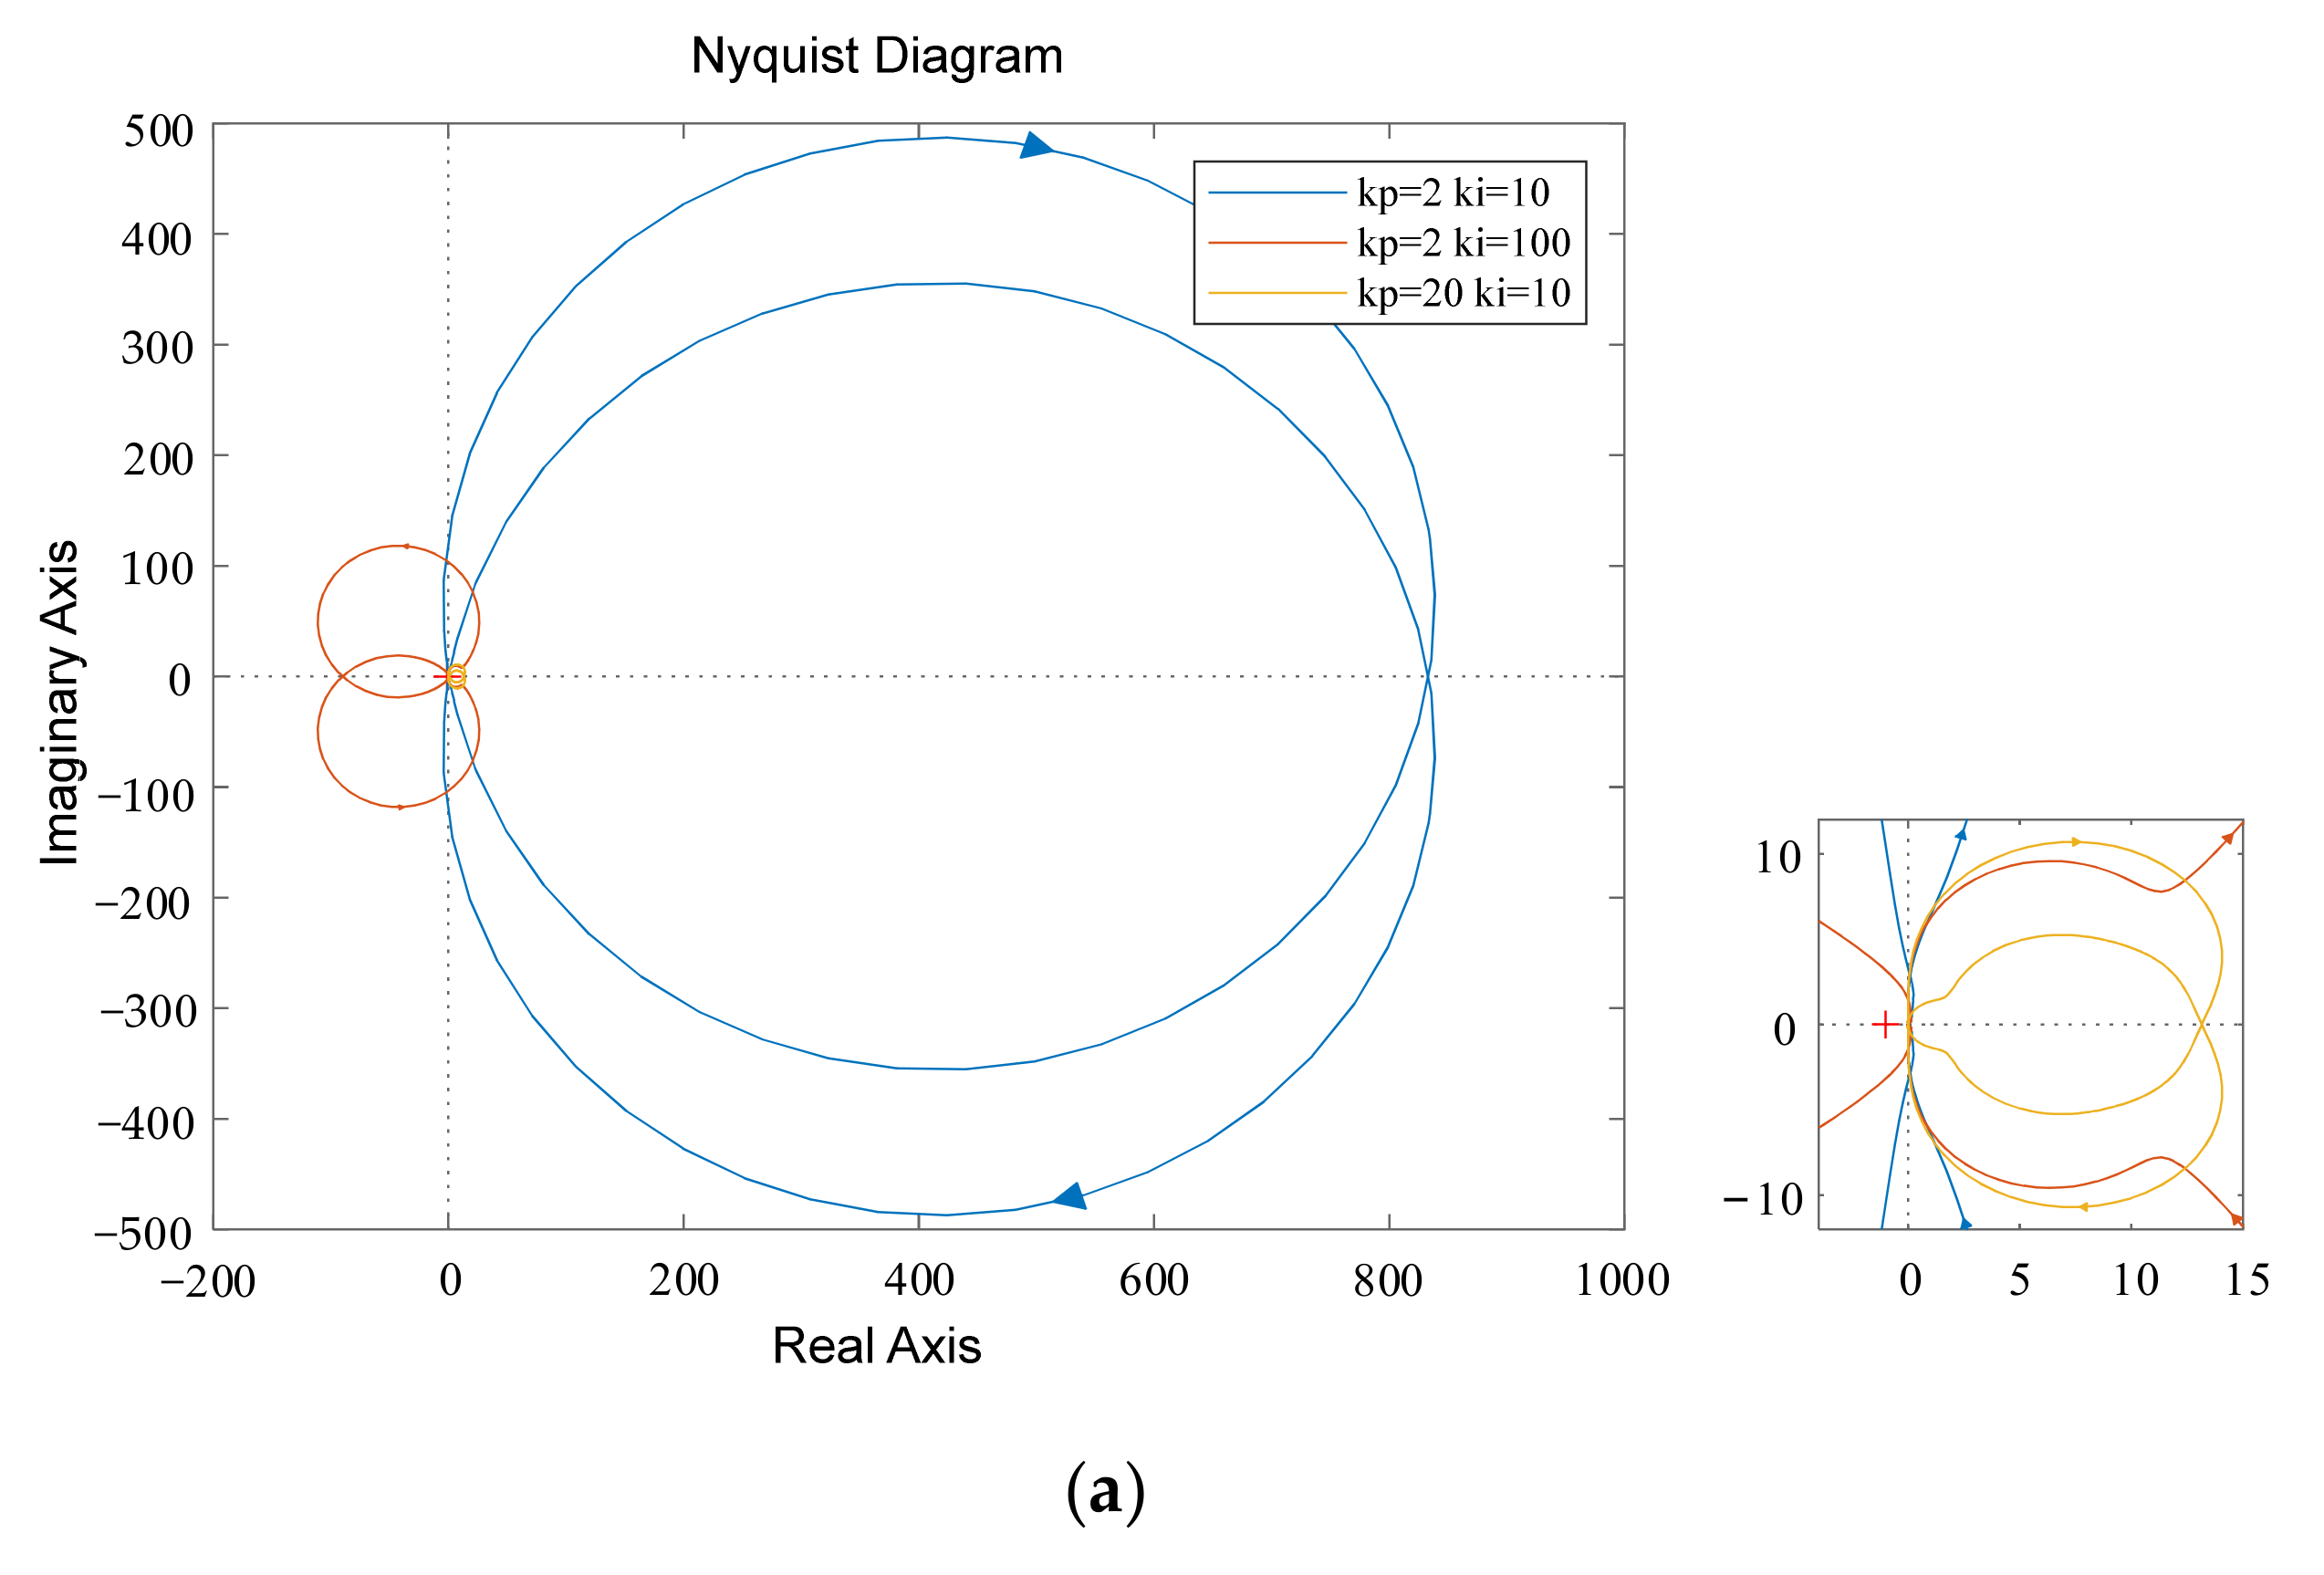
4.3. Discussion Analysis of Different Voltage Control Loop Parameters of GFL Converter

The voltage control loop of GFL converter ensures the terminal voltage remains at a nominal value by utilizing the reactive current command and its control parameters will affect the dynamic characteristics of the 100% REI system. The small-signal model of the 100% REI system will be used to analyze the influence of different voltage control loop parameters of GFL converter on the stability of system. The effect of different bandwidth of the voltage control loop of GFL converter on the stability of 100% REI system is investigated, and the bandwidth can be changed by changing the PI parameters of the voltage loop [45]. In addition, the modal participation factor is also used, which can describe the degree to which the main state variables participate in the oscillation mode.
Figure 13 shows the influence of different bandwidth of the voltage control loop of GFL converter on the stability of 100% REI system. As the bandwidth of the voltage control of GFL converter increases while the damping ratio keeps constant, the λ1,2, λ3,4 and λ11,12 move monotonically in the direction away from the imaginary axis, and showing an increase in stability as the bandwidth increase, the λ5,6 and λ7,8 move monotonically toward the imaginary axis, but always stays to the left of the imaginary axis, and showing a decrease in stability as the bandwidth increase, the λ9,10 move toward the imaginary axis and then move in the direction away from the imaginary axis, but always stays to the left of the imaginary axis, the λ13,14 move monotonically toward and across the imaginary axis, and as the bandwidth increase they reach the right of the imaginary axis, at which point 100% REI system has a steady state transition to an unstable state, where the eigenvalue that causes the system state to change is (2.12 ± 190i).
Based on the eigenvalue locus analysis of the 100% REI system, the modal analysis is applied, and the results give the main state variables of unstable mode caused by the different bandwidth of the voltage control loop of GFL converter. Table 4 gives the eigenvalues of the oscillation mode and the participation factor of main state variables. According to Table 4, the unstable mode mainly related to the dynamics of DC-side capacitance, filtering inductances and current control loop of PV station with GFL control strategy, and the dynamics of filtering inductances of PV station with GFM control strategy.

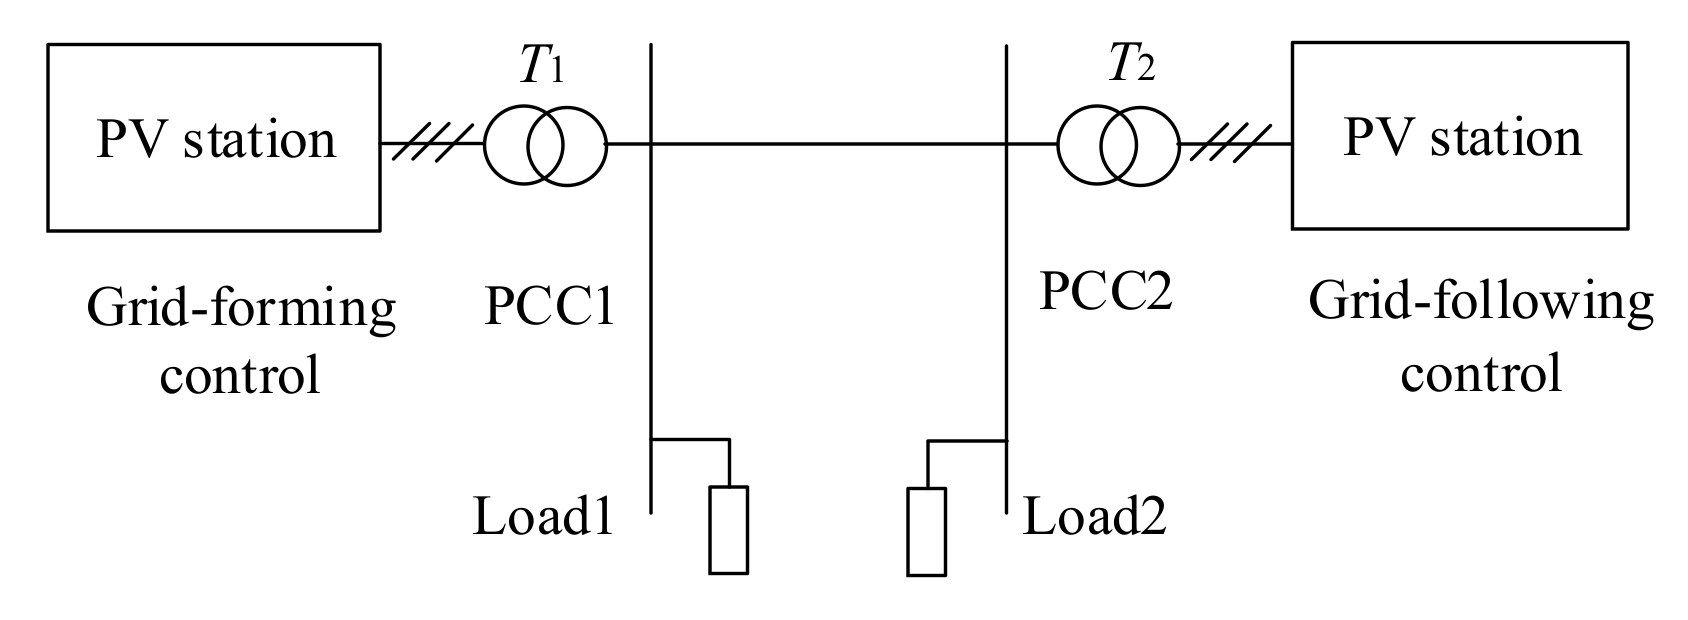
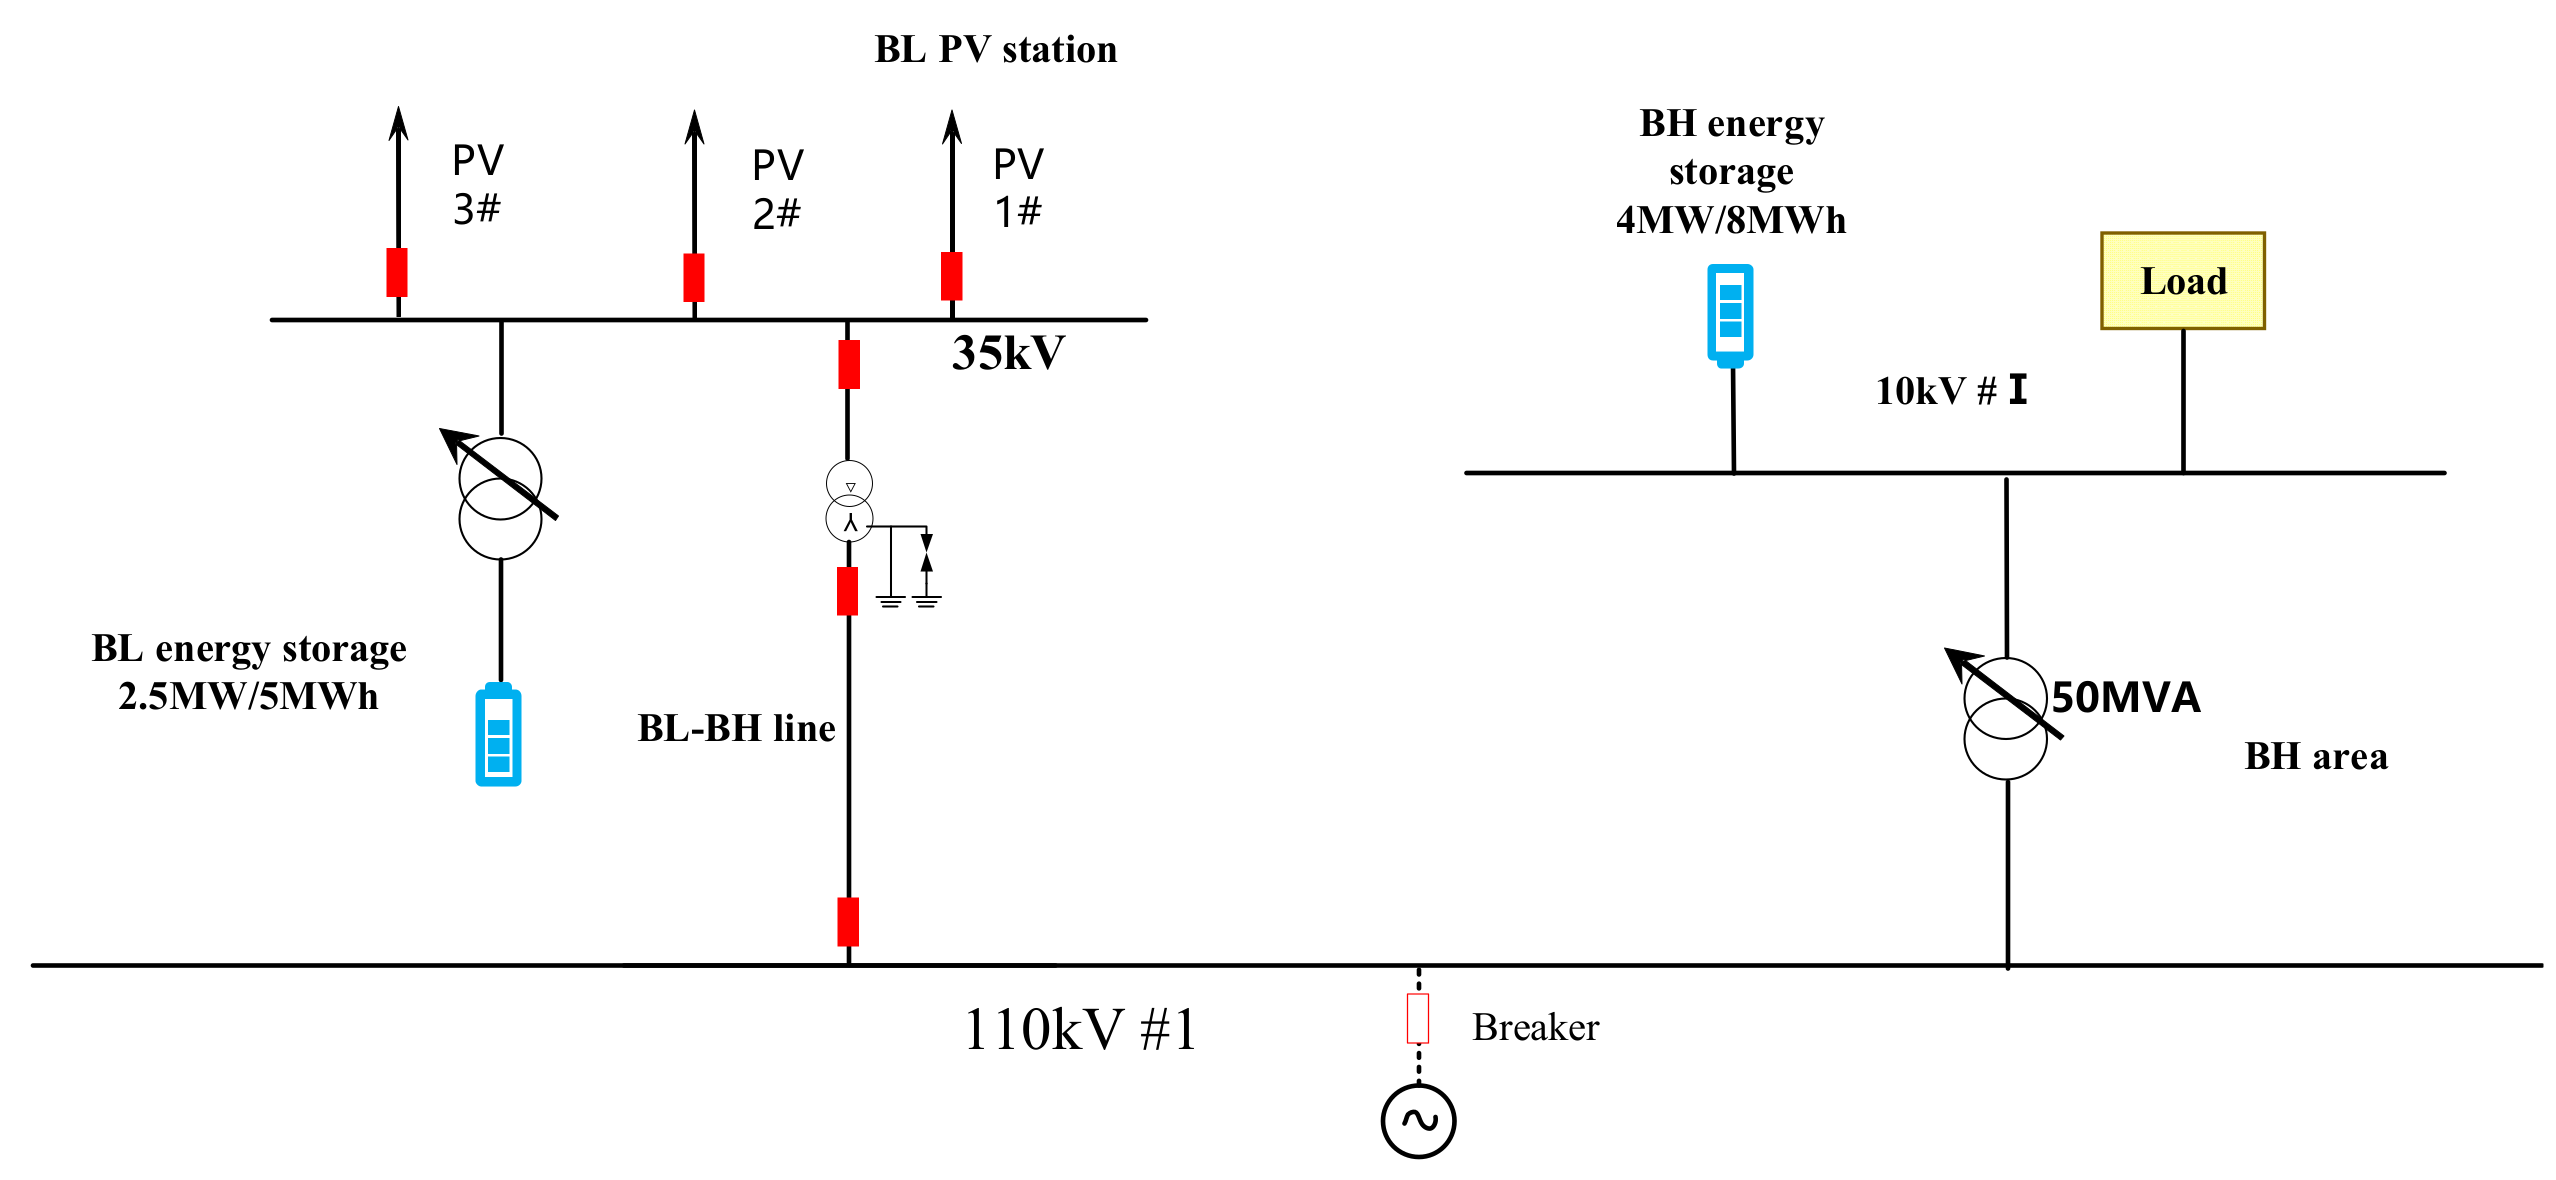
4.4. Engineering Case Study

Guangshui City, Hubei Province, is very rich in renewable energy resources. According to the sunshine and radiation data provided by Hubei Meteorological Service Center, the average sunshine hours in Guangshui area in recent 30 years are 1931 h, and the average total radiation amount in 30 years is between 4220 and 4880 MJ/m2, which belongs to the first-level utilizable area of solar energy resources in Hubei Province. With a high proportion of renewable energy large-scale access to the power grid, there has been a situation that new energy transmission is close to or exceeds the limit of transmitted power, and there are problems such as limited the consumption of new energy, in order to solve the reality of new energy development and consumption, Guangshui City, Hubei Province, was selected to build a county-level 100% REI grid, and this section selects part of the county-level 100% REI grid, to verify the engineering feasibility of independent operation of the energy storage with GFM control and the PV station with GFL control, and it is of great significance for the engineering application and popularization of GFM converter as well as the independent operation of regional grids under the large-scale development of new energy in the future. The selected area is shown in Figure 14, it mainly includes the energy storage with GFM control, the PV station with GFL control and load. The installed capacity of two energy storage with GFM control is 4 MW/8 MWh and 2.5 MW/5 MWh, and the installed capacity of PV station with GFL control is 14 MW.
Figure 15 gives the recorded waveforms response process of the system composed of energy storage with GFM control and PV station with GFL control, the unit of the vertical axis on the left is MW, and the unit of the vertical axis on the right is HZ, in which the circuit breaker between the 110 kV #1 and the grid is cut off at 11:45, so that the selected area is disconnected from the grid and enters into the independent operation condition smoothly, and the energy storages with GFM control establish the voltage and frequency of the independently grid. After entering into independent operation, the load upward disturbance and load downward disturbance tests were carried out, and it can be seen from Figure 15 that the system is constantly undergoing dynamic adjustment and tends to stabilization. In summary, the energy storage with GFM control in 100% REI grid can be very good to establish the voltage and frequency, which shows that the hybrid system composed of GFM converter and GFL converter is an effective way to solve the problem of stable operation of 100% new energy power system.

5. Conclusions

The configuration of the GFM converter in 100% REI system is studied in this paper, and juxtaposes the fundamental principles and control strategies of GFM and GFL converters. It establishes small-signal model and the detailed time-domain model based on the control strategies proposed in this article. Furthermore, it introduces a proportional configuration method of GFM converter for 100% REI system based on SCR. The influence of different proportions of GFM converters and control mode on the stability of 100% renewable electricity system is discussed, the analysis results show that the smaller the proportion of GFM converter, the worse the stability of the system, and the bandwidth of the voltage control loop will affect the stability of the system, the larger the bandwidth, the worse the stability of the system. Therefore, it is necessary to select appropriate parameters in the independent power supply system. The correctness of the proportional configuration of GFM converters proposed in this paper and the engineering feasibility of independent operation of 100% REI system is verified through analysis results and field test results, which shows that the hybrid system composed of GFM converter and GFL converter is an effective way to solve the problem of stable operation of 100% new energy power system.

Author Contributions

Conceptualization, K.J. and D.L.; methodology, K.J. and K.C.; software, P.X.; validation, K.J., D.L. and P.X.; formal analysis, K.C.; investigation, K.J.; resources, X.J.; data curation, X.J.; writing—original draft preparation, K.J.; writing—review and editing, K.J. and D.L.; visualization, P.X.; supervision, K.J. and D.L.; project administration, D.L.; funding acquisition, K.J. All authors have read and agreed to the published version of the manuscript.

Funding

This research was funded by science and technology project of state grid corporation of China, grant number 52153223001T.

Data Availability Statement

Not applicable.

Acknowledgments

Support by colleagues and the science and technology project of state grid corporation of China is acknowledged.

Conflicts of Interest

The authors declare that they have no conflict of interest.

References

  1. Xie, X.; He, J.; Mao, H.; Li, H. New issues and classification of power system stability with high shares of renewables and power electronics. Proc. CSEE 2021, 41, 461–475. [Google Scholar]
  2. Xie, X.; Ma, N.; Liu, W.; Zhao, W.; Xu, P.; Li, H. Functions of energy storage in renewable energy dominated power systems: Review and prospect. Proc. CSEE 2023, 43, 158–169. [Google Scholar]
  3. Zhou, X.; Chen, S.; Lu, Z.; Huang, Y.; Ma, S.; Zhao, Q. Technology features of the new generation power system in China. Proc. CSEE 2018, 38, 1893–1904. [Google Scholar]
  4. Yuan, X.; Zhang, M.; Chi, Y.; Ju, P. Basic challenges of and technical roadmap to power-electronized power System Dynamics issues. Proc. CSEE 2022, 42, 1904–1917. [Google Scholar]
  5. Zhang, M.; Yuan, X.; Hu, J. Path series expansion method based on self-/en-stabilizing properties and its application in the stability analysis of power systems with diversified power electronic devices. Proc. CSEE 2021, 41, 1637–1654. [Google Scholar]
  6. Lu, Z.; Jiang, J.; Qiao, Y.; Min, Y.; Li, H. A review on generalized inertia analysis and optimization of new power systems. Proc. CSEE 2023, 43, 1754–1776. [Google Scholar]
  7. Wang, X.; Blaabjerg, F. Harmonic stability in power electronic-based power systems: Concept, modeling, and analysis. IEEE Trans. Smart Grid 2019, 10, 2858–2870. [Google Scholar] [CrossRef]
  8. Qin, X.; Su, L.; Chi, Y.; Guo, Q.; Xu, X. Functional orientation discrimination of inertia support and primary frequency regulation of virtual synchronous generator in large power grid. Autom. Electr. Power Syst. 2018, 42, 36–43. [Google Scholar]
  9. Shi, Z.; Wang, W.; Huang, Y.; Li, P.; Dong, L. Simultaneous optimization of renewable energy and energy storage capacity with the hierarchical control. CSEE J. Power Energy Syst. 2022, 8, 95–104. [Google Scholar]
  10. Li, X.; Yan, N.; Ma, R. Cooperative dispatch of distributed energy storage in distribution network with PV generation systems. IEEE Trans. Appl. Supercond. 2021, 31, 1–4. [Google Scholar] [CrossRef]
  11. Fang, J.; Li, H.; Tang, Y.; Blaabjerg, F. On the Inertia of Future More-Electronics Power Systems. IEEE J. Emerg. Sel. Top. Power Electron. 2019, 7, 2130–2146. [Google Scholar] [CrossRef]
  12. Kundur, P.; Paserba, J.; Ajjarapu, V.; Andersson, G.; Bose, A.; Canizares, C.; Hatziargyriou, N.; Hill, D.; Stankovic, A.; Taylor, C.; et al. Definition and classification of power system stability. IEEE Trans. Power Syst. 2004, 19, 1387–1401. [Google Scholar]
  13. Guo, J.; Ma, S.; Wang, T.; Jing, Y.; Hou, W.; Xu, H. Challenges of developing a power system with a high renewable energy proportion under China’s carbon targets. iEnergy 2022, 1, 12–18. [Google Scholar] [CrossRef]
  14. Cheng, Y.; Fan, L.; Rose, J.; Huang, S.H.; Schmall, J.; Wang, X.; Xie, X.; Shair, J.; Ramamurthy, J.R.; Modi, N.; et al. Real-world subsynchronous oscillation events in power grids with high penetrations of inverter-based resources. IEEE Trans. Power Syst. 2022, 38, 316–330. [Google Scholar] [CrossRef]
  15. Yuan, X.; Chen, S.; Hu, J. Multi-time scale voltage and power angle dynamics in power electronics dominated large power systems. Proc. CSEE 2016, 36, 5145–5154+5395. [Google Scholar]
  16. Hu, J.; Yuan, X.; Cheng, S. Multi-time scale transients in power-electronized power systems considering multi-time scale switching control schemes of power electronics apparatus. Proc. CSEE 2019, 39, 5457–5467. [Google Scholar]
  17. Vodapally, S.N.; Ali, M.H. Overview of Intelligent Inverters and Associated Cybersecurity Issues for a Grid-Connected Solar Photovoltaic System. Energies 2023, 16, 5904. [Google Scholar] [CrossRef]
  18. Du, W.; Tuffner, F.K.; Schneider, K.P.; Lasseter, R.H.; Xie, J.; Chen, Z.; Bhattarai, B. Modeling of Grid-Forming and Grid-Following Inverters for Dynamic Simulation of Large-Scale Distribution Systems. IEEE Trans. Power Deliv. 2021, 36, 2035–2045. [Google Scholar] [CrossRef]
  19. Li, Y.; Gu, Y.; Green, T.C. Revisiting Grid-Forming and Grid-Following Inverters: A Duality Theory. IEEE Trans. Power Syst. 2022, 37, 4541–4554. [Google Scholar] [CrossRef]
  20. Beck, H.; Hesse, R. Virtual synchronous machine. In Proceedings of the 9th International Conference on Electrical Power Quality and Utilisation, Barcelona, Spain, 9–11 October 2007; pp. 1–6. [Google Scholar]
  21. Zhong, Q.; WEISS, Q. Synchronverters: Inverters that mimic synchronous generators. IEEE Trans. Ind. Electron. 2011, 58, 1259–1267. [Google Scholar] [CrossRef]
  22. Johnson, B.B.; Sinha, M.; Ainsworth, N.G.; Dörfler, F.; Dhople, S.V. Synthesizing virtual oscillators to control islanded inverters. IEEE Trans. Power Electron. 2016, 31, 6002–6015. [Google Scholar] [CrossRef]
  23. Unruh, P.; Nuschke, M.; Strauß, P.; Welck, F. Overview on Grid-Forming Inverter Control Methods. Energies 2020, 13, 2589. [Google Scholar] [CrossRef]
  24. Hu, P.; Jiang, K.; Ji, X.; Cai, Y.; Wang, B.; Liu, D.; Cao, K.; Wang, W. A Novel Grid-Forming Strategy for Self-Synchronous PMSG under Nearly 100% Renewable Electricity. Energies 2023, 16, 6648. [Google Scholar] [CrossRef]
  25. Sun, Z.; Zhu, F.; Cao, X. Study on a Frequency Fluctuation Attenuation Method for the Parallel Multi-VSG System. Front. Energy Res. 2021, 9, 693878. [Google Scholar] [CrossRef]
  26. Shang, L.; Hu, J.B.; Yuan, X.M.; Chi, Y.; Tang, H. Modeling and improved control of virtual synchronous generators under symmet-rical faults of grid. Proc. CSEE 2017, 37, 403–411. [Google Scholar]
  27. Zheng, T.; Wang, Z.; Zhou, F.; Wang, H. Fault current calculation and influencing factors analysis of virtual synchronous generator under symmetrical short circuit fault. Power Syst. Technol. 2023, 47, 1460–1475. [Google Scholar]
  28. Hu, P.; Jiang, K.; Ji, X.; Tan, D.; Liu, D.; Cao, K.; Wang, W. A Novel Grid-Forming Strategy for Voltage-Source Controlled PV under Nearly 100% Renewable Electricity. Front. Energy Res. 2022, 10, 915763. [Google Scholar] [CrossRef]
  29. Holttinen, H.; Kiviluoma, J.; Helisto, N.; Levy, T.; Menemenlis, N.; Jun, L.; Cutululis, N.; Koivisto, M.; Das, K.; Orths, A.; et al. Design and Operation of Energy Systems with Large Amounts of Variable Generation: Final Summary Report. IEA Wind TCP Task 25; VTT Technical Research Centre of Finland: Espoo, Finland, 2021. [Google Scholar] [CrossRef]
  30. Zhang, C.; Wu, H.; Wang, X. An Overview of Stability Studies of Grid-forming Voltage-source Converters. Proc. CSEE 2023, 43, 2339–2359. [Google Scholar]
  31. Zhang, Y.; Huang, J.; Schmall, J.; Conto, J.; Billo, J.; Rehman, E. Evaluating system strength for large-scale wind plant integration. In Proceedings of the 2014 IEEE PES General Meeting, National Harbor, MD, USA, 27–31 July 2014; pp. 1–5. [Google Scholar]
  32. Schramm Dall’Asta, M.; Brunelli Lazzarin, T. Small-Signal Modeling and Stability Analysis of a Grid-Following Inverter with Inertia Emulation. Energies 2023, 16, 5894. [Google Scholar] [CrossRef]
  33. Ilyushin, Y.V.; Kapostey, E.I. Developing a Comprehensive Mathematical Model for Aluminium Production in a Soderberg Electrolyser. Energies 2023, 16, 6313. [Google Scholar] [CrossRef]
  34. Pershin, I.M.; Papush, E.G.; Kukharova, T.V.; Utkin, V.A. Modeling of Distributed Control System for Network of Mineral Water Wells. Water 2023, 15, 2289. [Google Scholar] [CrossRef]
  35. Xu, H.; Zhang, X.; Liu, F.; Shi, R.; Yu, C.; Cao, R. A Reactive Power Sharing Strategy of VSG Based on Virtual Capacitor Algorithm. IEEE Trans. Ind. Electron. 2017, 64, 7520–7531. [Google Scholar] [CrossRef]
  36. Huang, Y.; Yuan, X.; Hu, J.; Zhou, P. Modeling of VSC Connected to Weak Grid for Stability Analysis of DC-Link Voltage Control. IEEE J. Emerg. Sel. Top. Power Electron. 2015, 3, 1193–1204. [Google Scholar] [CrossRef]
  37. Rosso, R.; Wang, X.; Liserre, M.; Lu, X.; Engelken, S. Grid-forming converters: Control approaches, grid-synchronization, and future trends-a review. IEEE Open J. Ind. Appl. 2021, 2, 93–109. [Google Scholar] [CrossRef]
  38. Xu, J.; Liu, W.; Liu, S.; Chang, F.; Xie, X. Current state and development trends of power system converter grid-forming control technology. Power Syst. Technol. 2021, 46, 3586–3594. [Google Scholar]
  39. Zhang, H.; Wang, X.; Lin, W.; Wen, J. Grid forming converters in renewable energy sources dominated power grid: Control strategy, stability, application, and challenges. J. Mod. Power Syst. Clean Energy 2021, 9, 1239–1256. [Google Scholar] [CrossRef]
  40. ENTSO-E. High Penetration of Power Electronic Interfaced Power Sources and the Potential Contribution of Grid Forming Converters; ENTSO-E: Brussels, Belgium, 2020. [Google Scholar]
  41. National Grid ESO. Minimum Specification Required for Provision of GB Grid Forming (GBGF) Capability (Formerly Virtual Synchronous Machine/VSM Capability); National Grid ESO: Warwick, UK, 2021. [Google Scholar]
  42. Huang, L.; Xin, H.; Wang, Z. Damping low-frequency oscillations through VSC-HVdc stations operated as virtual synchronous machines. IEEE Trans. Power Electron. 2019, 34, 5803–5818. [Google Scholar] [CrossRef]
  43. Liu, N.; Zhang, C.; Liao, L.; Chen, X.; Chen, S. Analysis on virtual torque and oscillation instability mechanism of virtual synchronous generator with reactive power-voltage controller. Autom. Electr. Power Syst. 2019, 43, 107–115. [Google Scholar]
  44. Ma, Y.; Yang, H.; Qu, Z.; Xin, H.; Han, J. Design method for improving damping characteristics of virtual synchronous generator. Power Syst. Technol. 2021, 45, 269–275. [Google Scholar]
  45. Zhang, X.; Zhang, C. PWM Rectifier and Its Control; China Machine Press: Beijing, China, 2012. [Google Scholar]
Figure 1. Typical topology of GFM/GFL converter.
Electronics 12 04078 g001
Figure 2. Typical control strategy of GFM converter.
Electronics 12 04078 g002
Figure 3. Typical control strategy of GFL converter.
Electronics 12 04078 g003
Figure 4. Relative position relationship between different reference frames.
Electronics 12 04078 g004
Figure 5. Structure of 100% REI system.
Electronics 12 04078 g005
Figure 6. Time-domain comparative results of the DC voltage of PV station with the GFL control strategy.
Electronics 12 04078 g006
Figure 7. Time-domain comparative results of the active power of PV station with the GFL control strategy.
Electronics 12 04078 g007
Figure 8. Time-domain comparative results of the active power of PV station with the GFM control strategy.
Electronics 12 04078 g008
Figure 9. Nyquist diagram under different SCRs. (a) PV station with GFL control strategy under different SCRs; (b) PV station with GFM control strategy under different SCRs.
Electronics 12 04078 g009
Figure 10. Nyquist diagram under different current control parameters. (a) PV station with GFL control strategy under different current control parameters; (b) PV station with GFM control strategy under different current control parameters.
Electronics 12 04078 g010aElectronics 12 04078 g010b
Figure 11. Eigenvalue locus of the 100% REI system with different proportions of the PV station with the GFM control strategy.
Electronics 12 04078 g011
Figure 12. Eigenvalue locus of the 100% REI system with different bandwidth of voltage control loop of GFM converter.
Electronics 12 04078 g012
Figure 13. Eigenvalue locus of the 100% REI system with different bandwidth of voltage control loop of GFL converter.
Electronics 12 04078 g013
Figure 14. Part area diagram of the county-level 100% REI grid.
Electronics 12 04078 g014
Figure 15. Recorded waveforms of the 100% REI grid.
Electronics 12 04078 g015
Table 1. Main parameters of the system.
ParameterValue
PI1 (kvdp/kvdi)3.5/5
PI2 (kvqp/kvqi)3.5/5
PI3 (kvidp/kvidi)1/10
PI4 (kviqp/kviqi)1/10
PI5 (klvdp/klvdi)5/50
PI6 (klvqp/klvqi))1/10
PI7 (kidp/kidi)2/200
PI8 (kiqp/kiqi)6/100
PIPLL (kPLLp/kPLLi)10/200
J4
D100
Dq100
Table 2. Participation factor of eigenvalue (0.0059±1.2i) analysis.
EigenvaluefParticipation Factor (>0.1)
0.0059 ± 1.2i0.19 Hz Δ θ r e f _ G F M _ ( 0.407 ) ; Δ i d r e f _ G F M ( 0.273 ) ;
Δ i q r e f _ G F M ( 0.298 )
Table 3. Participation factor of eigenvalue (0.0145 ± 19.17i) analysis.
EigenvaluefParticipation Factor (>0.1)
0.0145 ± 19.17i3.05 Hz Δ i d r e f _ G F L ( 0.156 ) ;   Δ u d c _ G F L ( 0.238 ) ;
Δ v d r e f _ G F L ( 0.308 ) ;   Δ v q r e f _ G F L ( 0.175 )
Table 4. Participation factor of eigenvalue (2.12 ± 190i) analysis.
EigenvaluefParticipation Factor (>0.1)
2.12 ± 190i30.24 Hz Δ i d _ G F L ( 0.319 ) ;   Δ u d c _ G F L ( 0.17 ) ;   Δ v d r e f _ G F L ( 0.151 )
Δ i 2 d _ G F L ( 0.129 ) ;   Δ i 2 d _ G F M ( 0.212 )
Disclaimer/Publisher’s Note: The statements, opinions and data contained in all publications are solely those of the individual author(s) and contributor(s) and not of MDPI and/or the editor(s). MDPI and/or the editor(s) disclaim responsibility for any injury to people or property resulting from any ideas, methods, instructions or products referred to in the content.

