1. Introduction
Electromyogram (EMG) signals, which have mainly been used in hospitals to determine the health status of patients, have become widely available with the widespread use of personal smart devices, owing to the recent miniaturization of semiconductors. Their range of use is expanding because EMG signals can be easily measured. EMG signals measure and amplify minute electrical phenomena that occur when a person’s muscles move, and they correspond to biosignals such as the electrocardiogram, iris, and face. EMG signals have mainly been used for health examinations, and, currently, with the development of pattern recognition technology, complex and irregular EMG signals can be analyzed, and studies related to the control of assistive robots for amputees are being conducted. In addition, similar to the research on other biosignals, research is being conducted on personal identification for the authorization of access to smart systems. Because EMG signals can be measured only when a person contracts his/her muscles, they are more reliable for user identification than passively measurable variables, such as the face [
1] or fingerprints [
2,
3], in authentication problems. Faces or fingerprints can be captured by others using noncontact capture devices, whereas EMG signals can only be generated while individuals are alive and are guided by their intentions. Moreover, unlike the face, EMG signals are not visually apparent from the outside, and, thus, replicating them with a camera or a similar device is difficult [
4,
5,
6,
7,
8,
9,
10]. Consequently, they provide a useful authentication method.
Personal identification verifies the identity of a person by entering their personal information. With the development of information technology, personal identification has become automated and, based on it, banking services can be used quickly and easily without visiting a bank. Therefore, the security, accuracy, and stability of personal identification methods have become important. Using a biosignal for personal identification can reduce additional laborious work because the input signal for authentication comes from one’s body. Wearable devices have recently undergone significant advancements in terms of sensor size, functionality, and performance. These developments have enabled the effective collection of large amounts of environmental data, including biosignals. EMG signals hold a strong position in terms of security compared with other biosignals, particularly with regard to their physical characteristics. EMG signals can be generated while a person is alive and their arms are mentally controlled. Other biosignals, such as the face, iris, and fingerprints, can be captured by cameras without physical contact, which can compromise personal information. However, the EMG signal changes in various ways depending on the degree of force applied by the user, the location of the sensor, and motion during measurement. To stably perform personal identification using EMG signals, the user must acquire learning data by adjusting the force to be as similar as possible to the acquisition situation. It follows that the EMG signals are susceptible to noise contamination. Therefore, a personal identification model should be designed to exhibit robustness against noise [
11,
12,
13,
14,
15,
16].
Several studies have been conducted on personal identification methods that use EMG signals. Kim et al. [
17] extracted features of the modified mean absolute value and mean absolute value slope in the time domain and features using a filter in the frequency domain and performed personal identification with EMG signals by training a K-nearest neighbor model with these features. In [
18], individual identification using the optimum-patch forest method was performed after extracting features from electrocardiograms (ECGs) and EMGs, respectively. Kim et al. [
19] attached an EMG sensor to a subject’s legs and achieved personal identification using data acquired while walking. Various features were learned using a multilayer perceptron. These features included integrated EMG, Willison amplitude, mean absolute value, variance, zero crossing, modified mean absolute value, modified mean absolute value, slope sign change, mean absolute value slope, root mean square, waveform length, and simple square integral. Subsequently, a comparative analysis of several features was conducted. In [
20], the authors acquired EMG signals during several activities. After extracting the frequency-domain features [
21] from EMG signals, the individuals were identified using the Mahalanobis distance. Yamaba et al. [
22,
23] performed personal identification by continuously analyzing EMG signals from personal devices. A Fourier transform was performed on the input EMG signals, and a support vector machine (SVM) was trained using the minimum and maximum times and corresponding amplitude values as features. Raurale et al. [
24] divided EMG signals into several segments, extracted band power (BP) and root absolute sum square (RSS) features, and performed personal identification on the extracted features using a decision tree, multilayer perceptron, SVM, and radial basis function neural networks. Furthermore, personal identification was performed by combining the majority voting decisions and multilayer perceptrons and by combining decision-making and radial basis function neural networks for RSS features with a lowered dimension via kernel LDA. In [
25], the researchers analyzed a personal identification model combining a discrete wavelet transform and an extra tree classifier, and another personal identification model combining a continuous wavelet transform and a convolutional neural network, and finally suggested a personal identification model using a continuous wavelet transform, Siamese networks, and convolutional neural networks.
Several studies have been conducted on motion classification methods using EMG signals. Yoo et al. [
26] conducted research on a system that allows humans to interact with unmanned aerial vehicles (UAVs) using hand motions in real time. The study found that image-based gesture systems can be challenging to use because they struggle to track multidimensional hand motions, making the algorithms for detection and tracking complex. To overcome this, a hybrid hand motion system that combines an inertial measurement unit (IMU)-based motion capture and a vision-based gesture system has been proposed. This system uses information from the thumb to determine the movement direction command, detects the hand, and recognizes the shape to determine basic commands. In [
27], to address privacy concerns associated with vision-based systems, the authors conducted research on a hand gesture recognition system that utilizes a 60 GHz frequency-modulated continuous-wave (FMCW) radar. The system receives radar signals from hand gestures and converts them into range, velocity, and angular data. These data are then used to train and classify the gestures using long-short term memory (LSTM). Shioji et al. [
28] conducted research on hand motion recognition using EMG signals obtained from the wrist. They used a bandpass filter to remove noise and implemented a convolutional neural network (CNN) to classify different hand motions. Similarly, Li et al. [
29] studied the use of EMG signals for motion classification, with a focus on increasing the robustness of the system against variations in force. The proposed solution uses a common spatial pattern (CSP), a feature extraction technique that aims to maximize the variance between different classes of signals.
Because EMG signals are sensitive to noise, noise-robust features should be observed, and the neural network should be optimized according to these features to stably perform noise-robust personal identification. Hence, we comparatively analyzed the EMG-based biometrics using LSTM with various efficient feature sets. First, the EMG signals were divided into segments of a certain size and features were extracted for each segment. The following 13 features of the EMG signals were considered: mean absolute value (MAV), wave length (WL), zero crossing (ZC), slope sign change (SSC), average amplitude change (AAC), log detector (LD), root mean square (RMS), difference absolute standard deviation value (DASDV), variance (VAR), modified mean absolute value (MMAV), modified mean absolute value 2 (MMAV2), enhanced mean absolute value (EMAV), and enhanced wave length (EWL) [
30]. The extracted features were connected in sequence and used as inputs to the LSTM to proceed with learning. A performance comparison of the LSTMs for various feature sets was conducted through multiple experiments to optimize the LSTM along with the features. A public EMG dataset was used for the experiments. The experimental results revealed that the proposed method showed good performance compared to previous methods.
Our motivations can be summarized as follows:
EMG signals are sensitive to noise. Therefore, robust features are important for EMG-based classification problems.
Conventional EMG features for motion classification were applied to EMG-based personal classification to identify robust features.
We compared the performance of EMG-based personal identification using LSTM with selected feature sets among 13 features and found the best feature list in the design of the LSTM.
Our contributions can be summarized as follows:
We demonstrate that conventional EMG features for motion classification can effectively achieve competitive performance in EMG-based personal classification.
We demonstrate good performance in less time and fewer trials using our feature selection approach for person identification based on EMG signals.
The remainder of this paper is organized as follows.
Section 2 describes the 13 EMG features, their definitions, and related equations and provides details on the structure of the LSTM.
Section 3 illustrates personal identification using EMG signals and explains the details of the proposed personal identification method, including the diagrams.
Section 4 describes the EMG database used in the experiments and presents the experimental results from various aspects, including the performance based on features and ANOVA analysis. Finally,
Section 5 concludes the paper.
3. Biometrics Using Electromyogram Signals
This section describes the EMG-based biometric method using deep learning with various feature sets. Because EMG signals react sensitively according to the body condition of the measured person, robust features must be used. Conventional EMG feature extraction methods for EMG-based motion classification are used to find robust features in EMG-based person identification. Features that can be extracted from EMG signals include MAV, WL, ZC, SSC, AAC, LD, RMS, DASDV, VAR, MMAV, MMAV2, EMAV, and EWL. Some feature extraction methods use a threshold to ignore small noise in the signal. This value should be determined based on the signal scale. A performance comparison of personal identification based on various combinations of features and parameters of the neural network was conducted. The LSTM was learned by extracting 13 features for each channel of the EMG signal and combining them to create one sequence of data. LSTM has been effectively employed to analyze sequential data featuring memory cells, forget gates, input gates, and output gates. It also effectively addresses long-term dependency issues. EMG signals are sequential signals obtained from the human body. When learning was repeated for various LSTM parameters, a change in performance was observed. Each feature was individually converted into sequence data for LSTM learning. The validity of the features was determined by observing the changes in performance according to individual features. The optimal feature combination was determined by configuring various feature sets for valid features in an effectively limited feature list [
33]. Subsequently, the variation in performance with the parameters of various LSTMs was observed for the determination of optimal feature combinations.
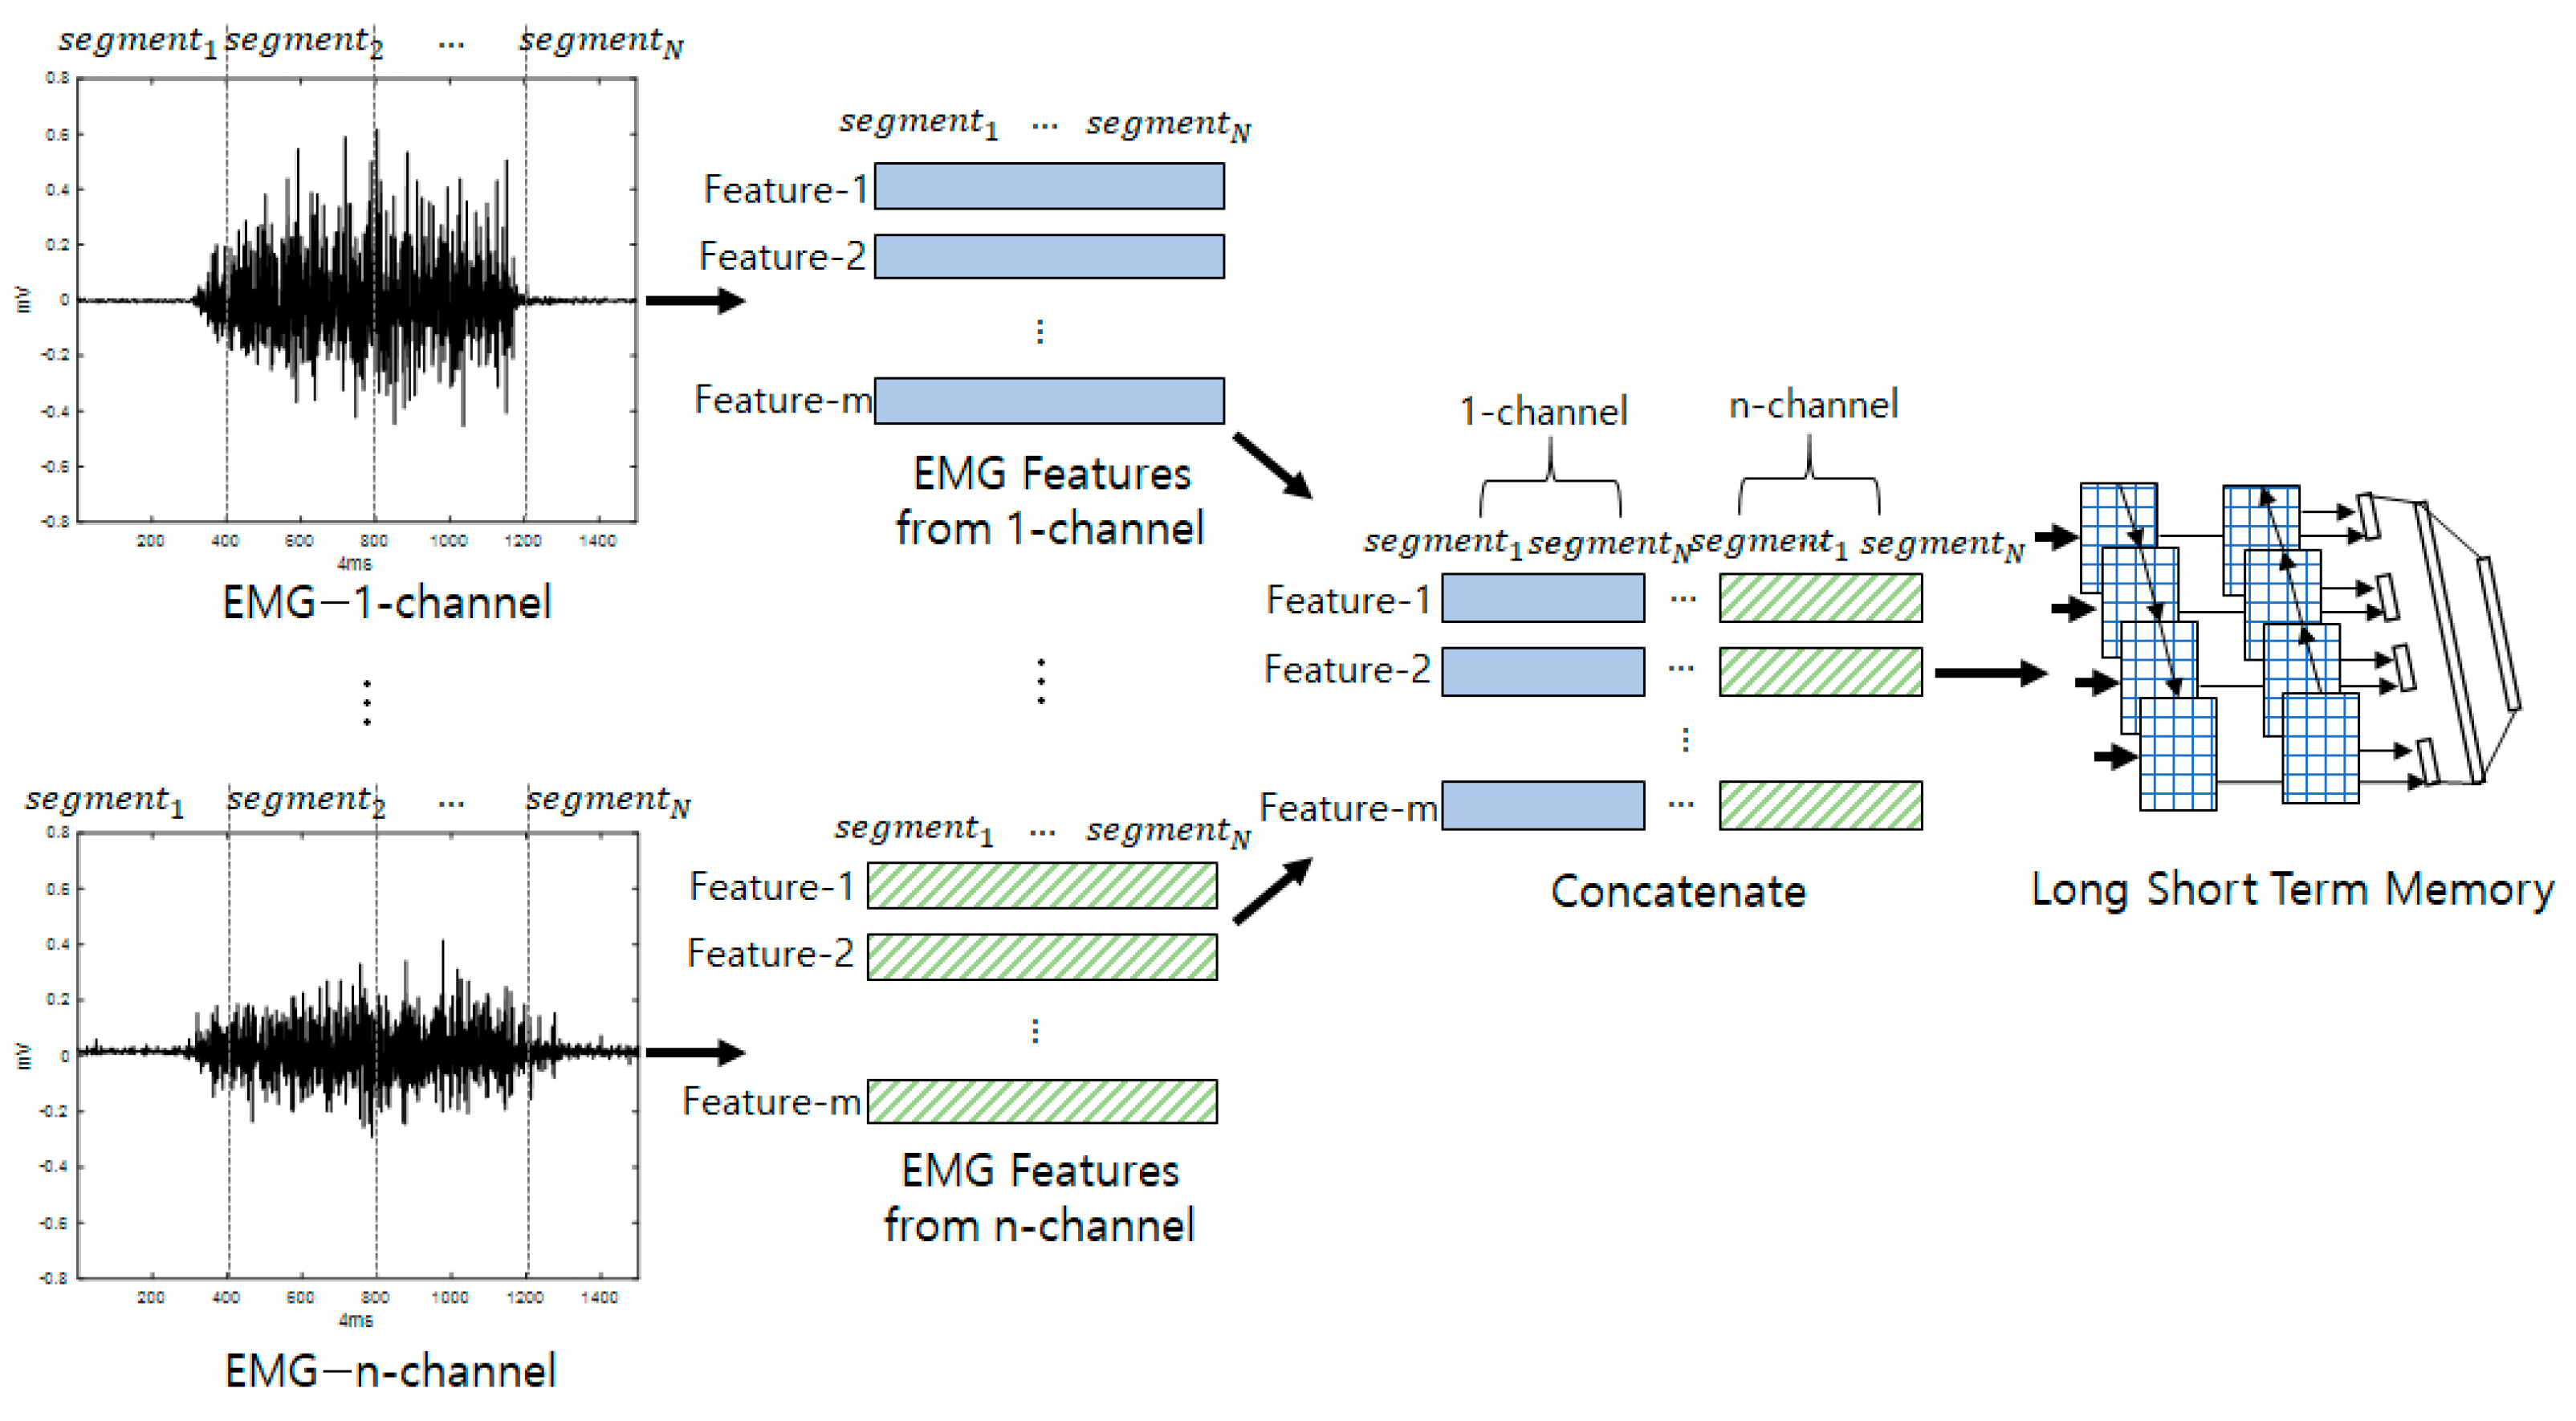
Figure 2 shows a diagram of the biometric model using LSTM from the raw signal through feature extraction and classification. The input signal was segmented across all channels, and features were extracted for each segment. These features were then concatenated within each segment and channel. The concatenated features were input into the LSTM network for training.
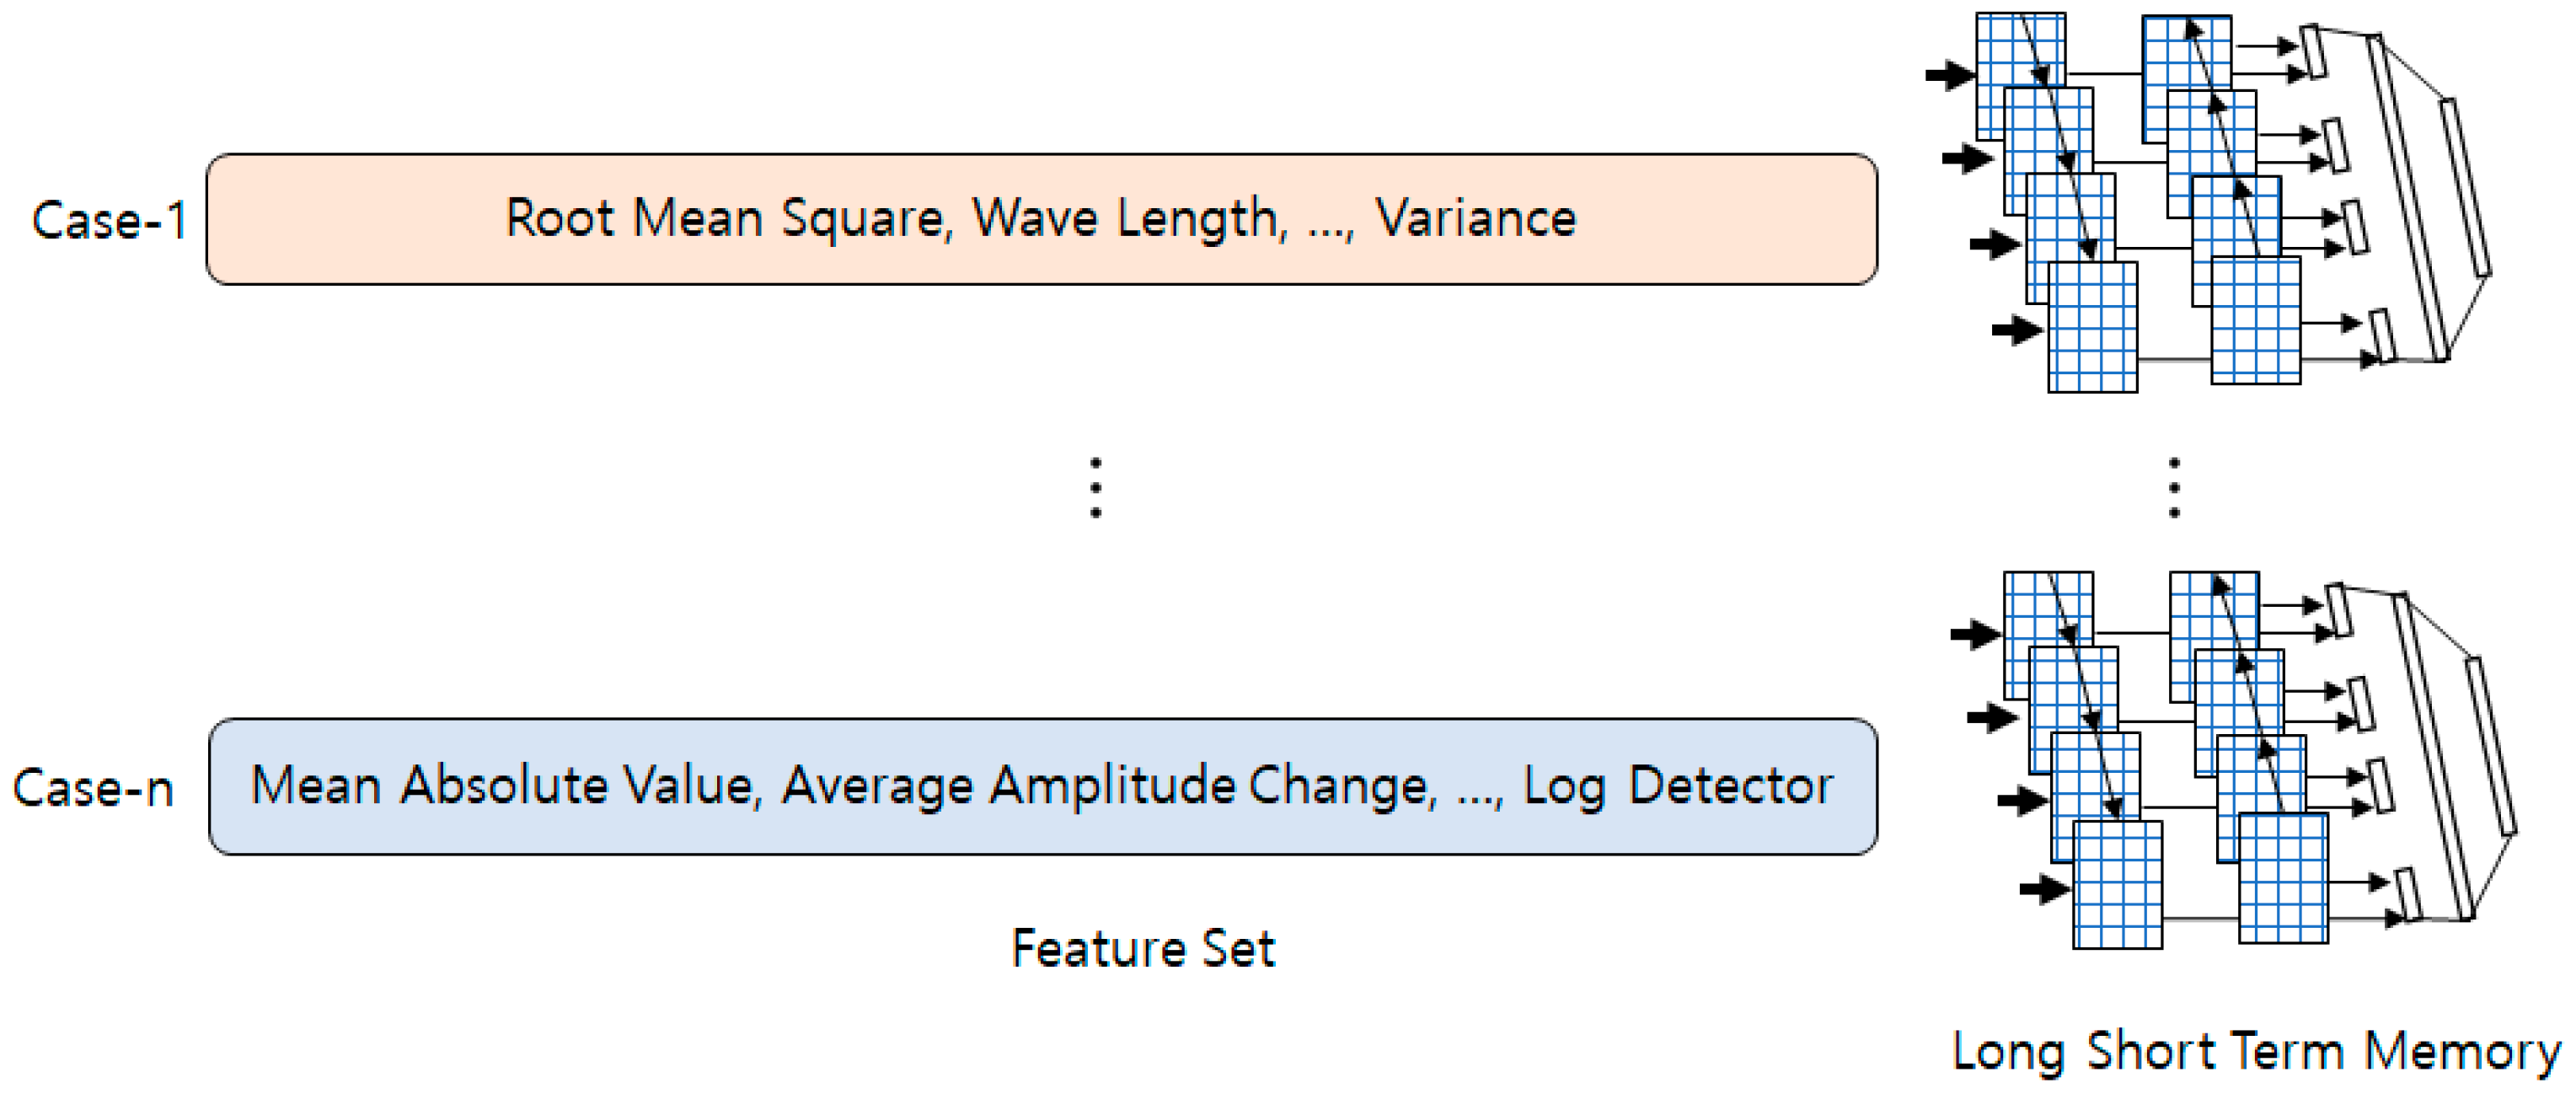
Figure 3 depicts multiple instances of LSTM with diverse feature sets to discover an improved feature combination. Thirteen features were considered for the feature set of individual identification, and these features were grouped into various combinations to determine the most effective method to improve the feature set. The accuracy of individual identification is defined as follows [
34]:
where
indicates the number of correct classifications, and
is the number of wrong classifications.
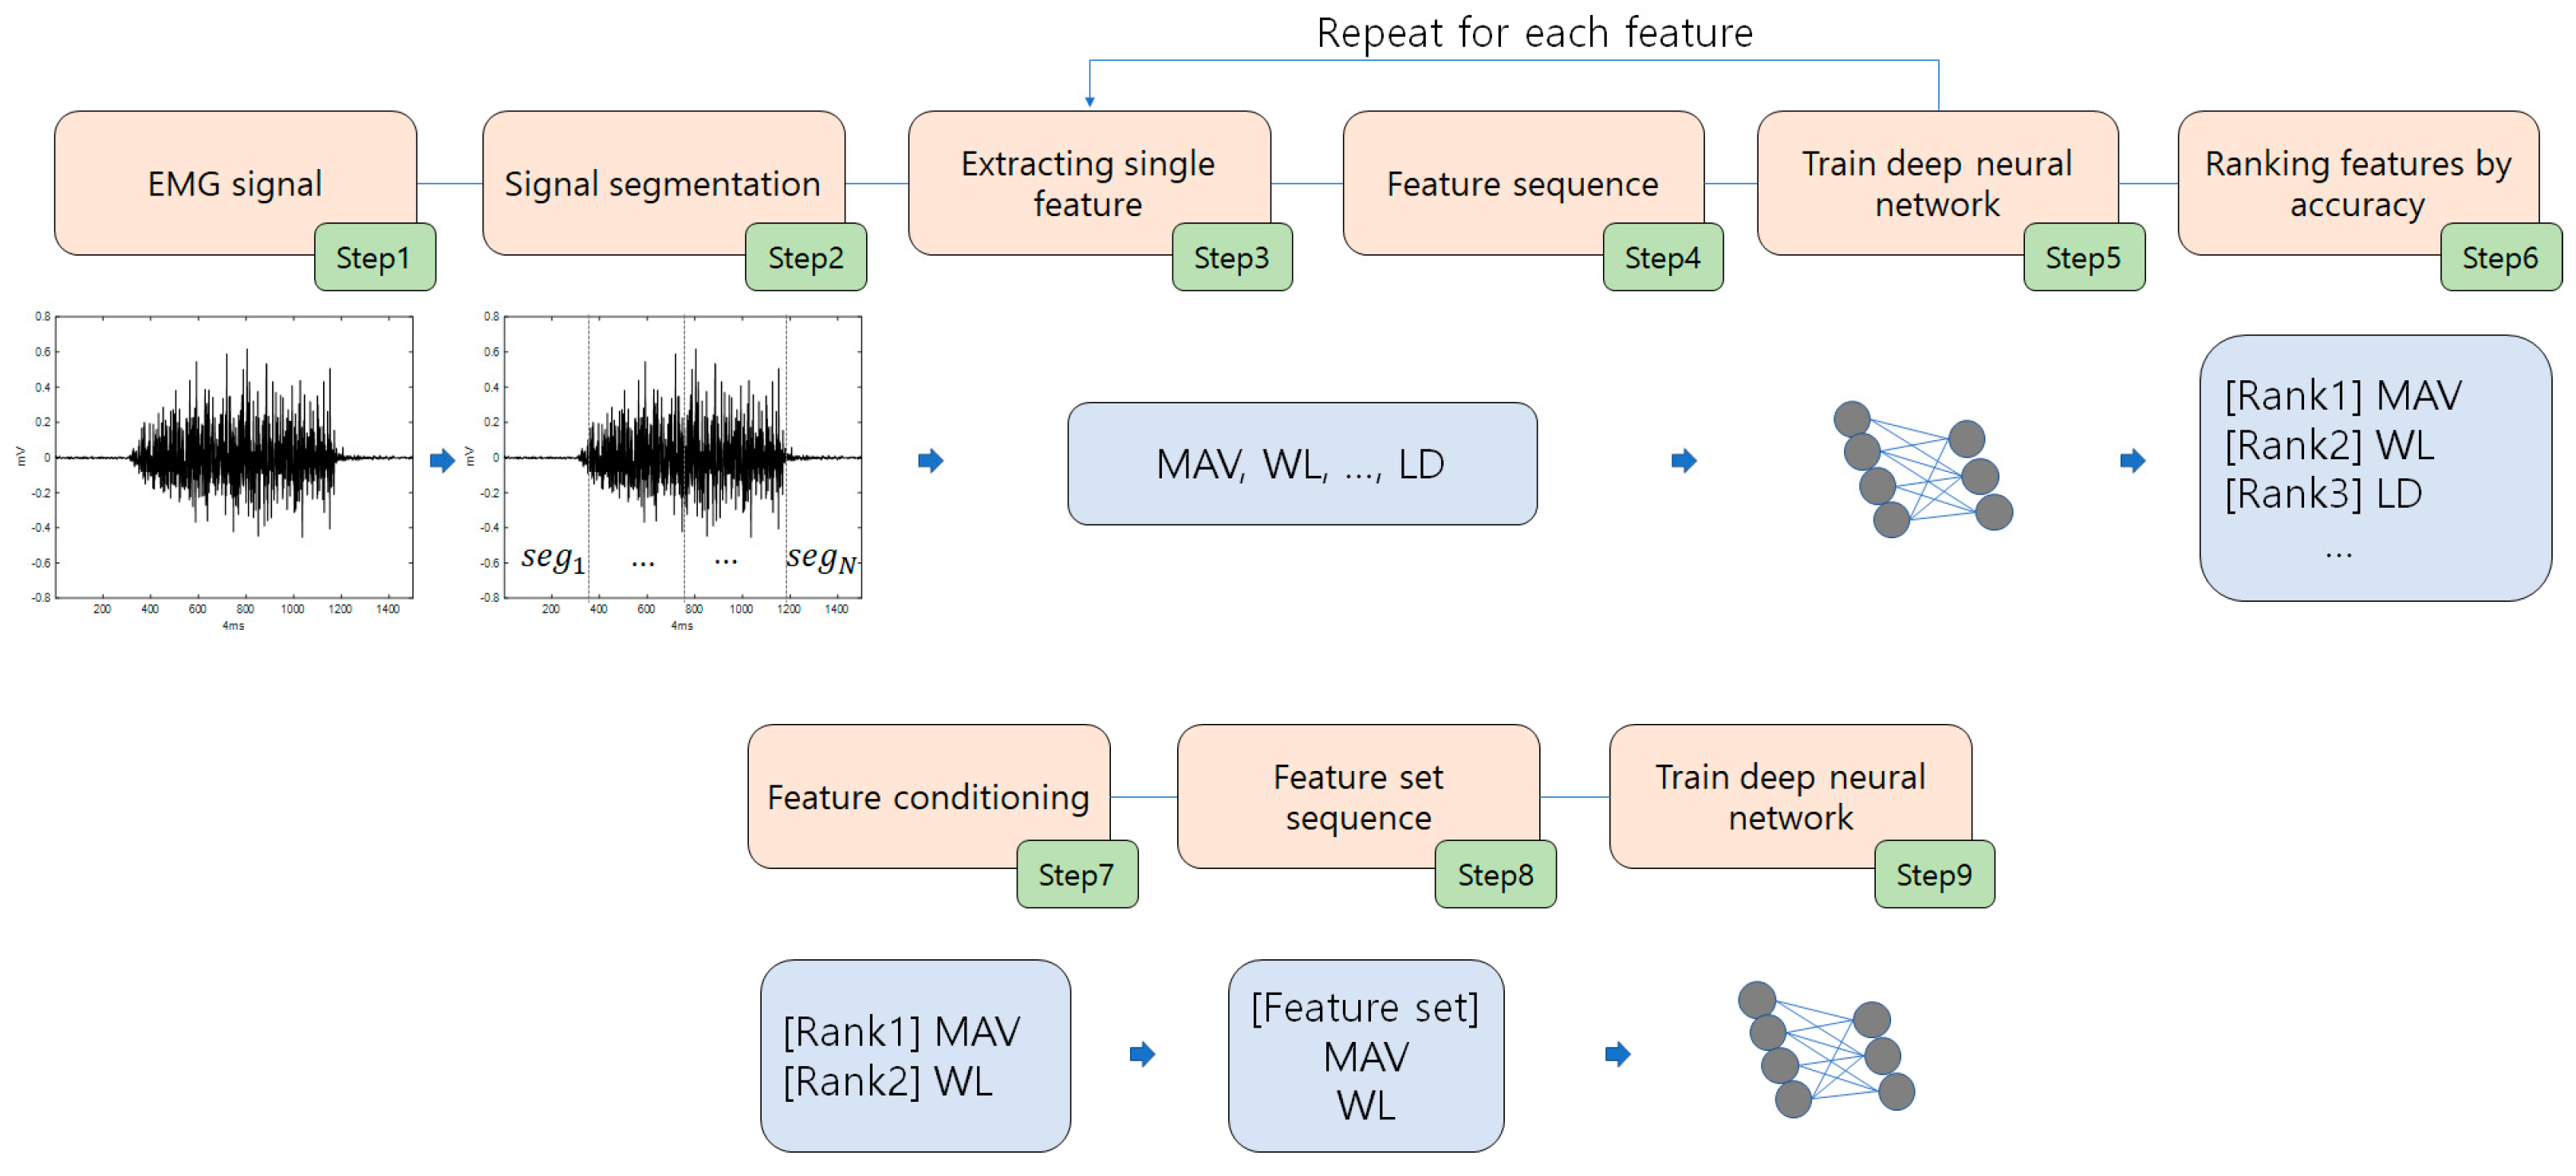
Figure 4 shows the proposed model and the process of feature extraction from EMG signals for personal classification. As shown in
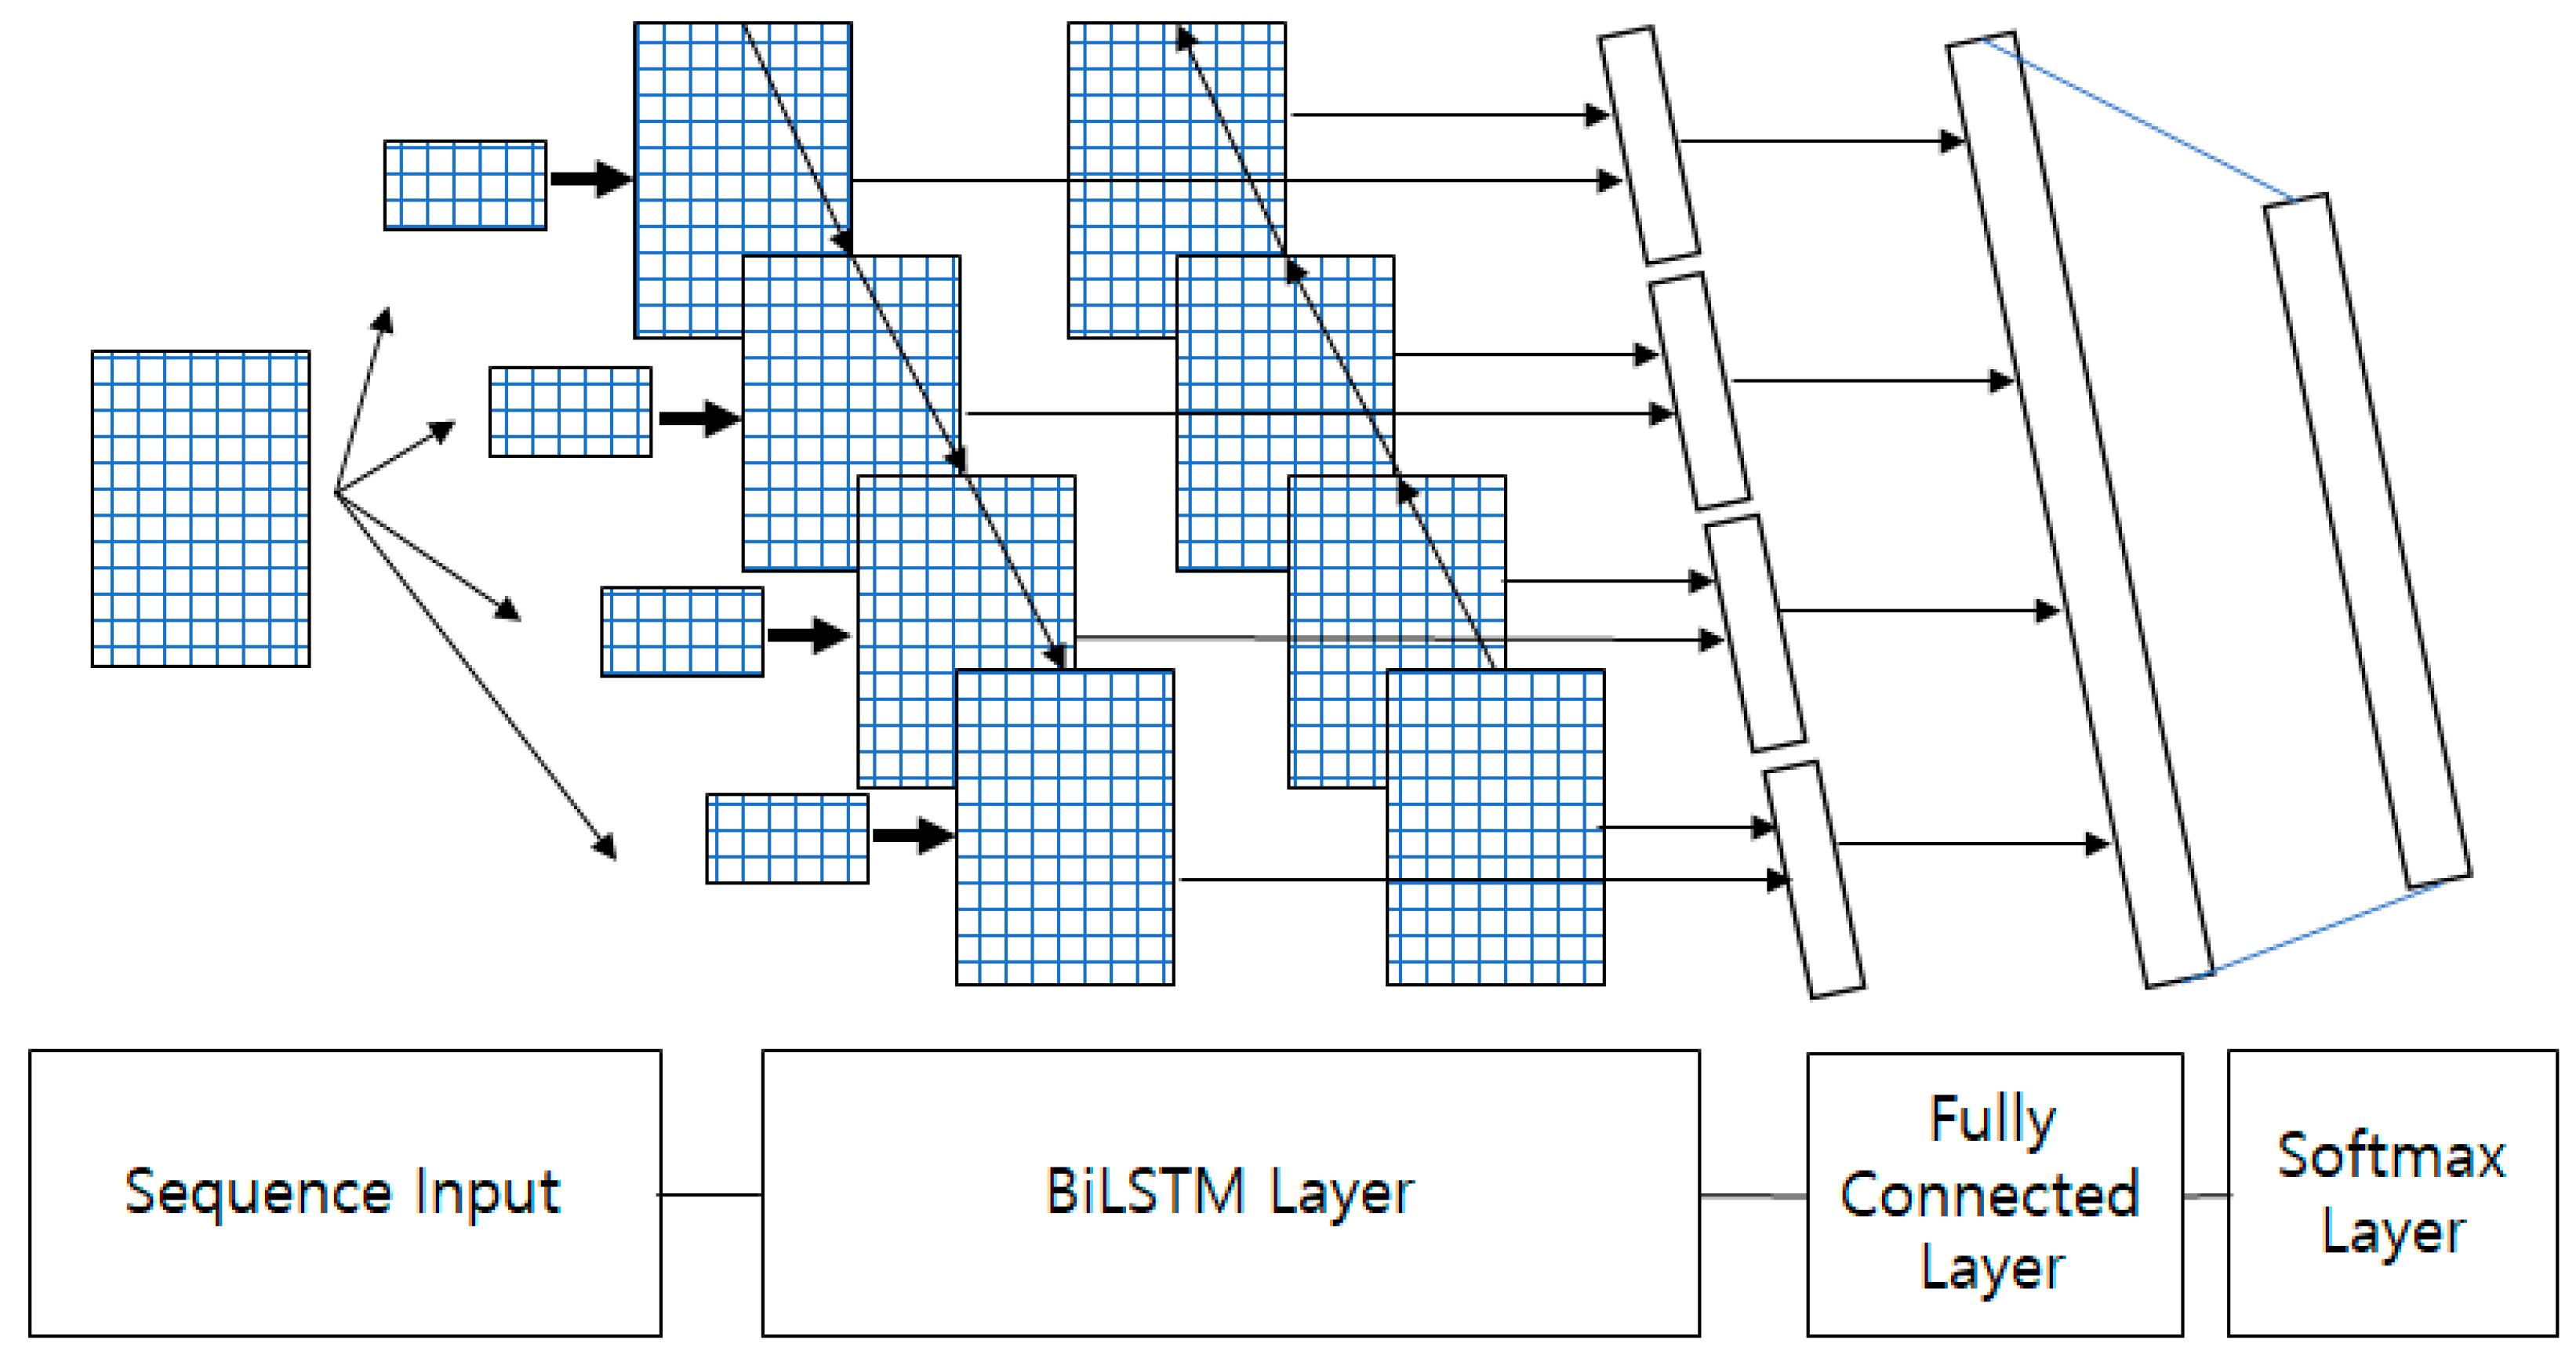
Figure 4, in Step 1, the input consists of EMG signals with multiple channels. In Step 2, the input EMG signals are divided into several segments with the same period. In Step 3, feature extraction is performed for each segment. In Step 4, the features are rearranged into sequential data. In Step 5, the training process is performed using the Bi-LSTM from the sequenced feature sets. This process is repeated for each feature. In Step 6, the individual features are ranked according to their classification accuracy. In Step 7, individual features are selected as the optimal feature sets based on their classification accuracy. In Step 8, the optimal individual features are combined into sequence data. In Step 9, the Bi-LSTM is trained with a set of the best optimal features, ultimately resulting in the highest classification accuracy. This Bi-LSTM is the deep neural network shown in
Figure 1.
Certain features are combined and ranked based on their classification accuracy when used individually, with priority given to those with higher rankings. When selecting features, a classification rank based on individual features is primarily used. This can be considered as a failure to consider a wider variety of feature combinations. Combining features could potentially lead to valuable feature interactions, although further attempts could be required to discover optimal combinations. However, when a feature typically exhibits poor accuracy, it tends to negatively affect the overall performance. Therefore, this approach can potentially yield improved performance more efficiently, especially in challenging situations where numerous experiments are required. In scenarios where training a deep neural network is time-consuming, both sequential feature selection (SFS) and sequential floating feature selection methods often require a substantial number of repetitive experiments.
4. Experimental Results
This section describes the experimental results of feature extraction from EMG signals, feature learning using LSTM, personal identification, and performance comparison analysis according to the parameters of the classification model based on the feature sets. To perform the experiments, this study used a computer equipped with an Intel® Xeon(R) CPU E5-1650 v3 3.5 GHz, Windows 10 × 64-bit, 32 GB random access memory (RAM), an NVIDIA GeForce GTX Titan X, and Matlab 2022b.
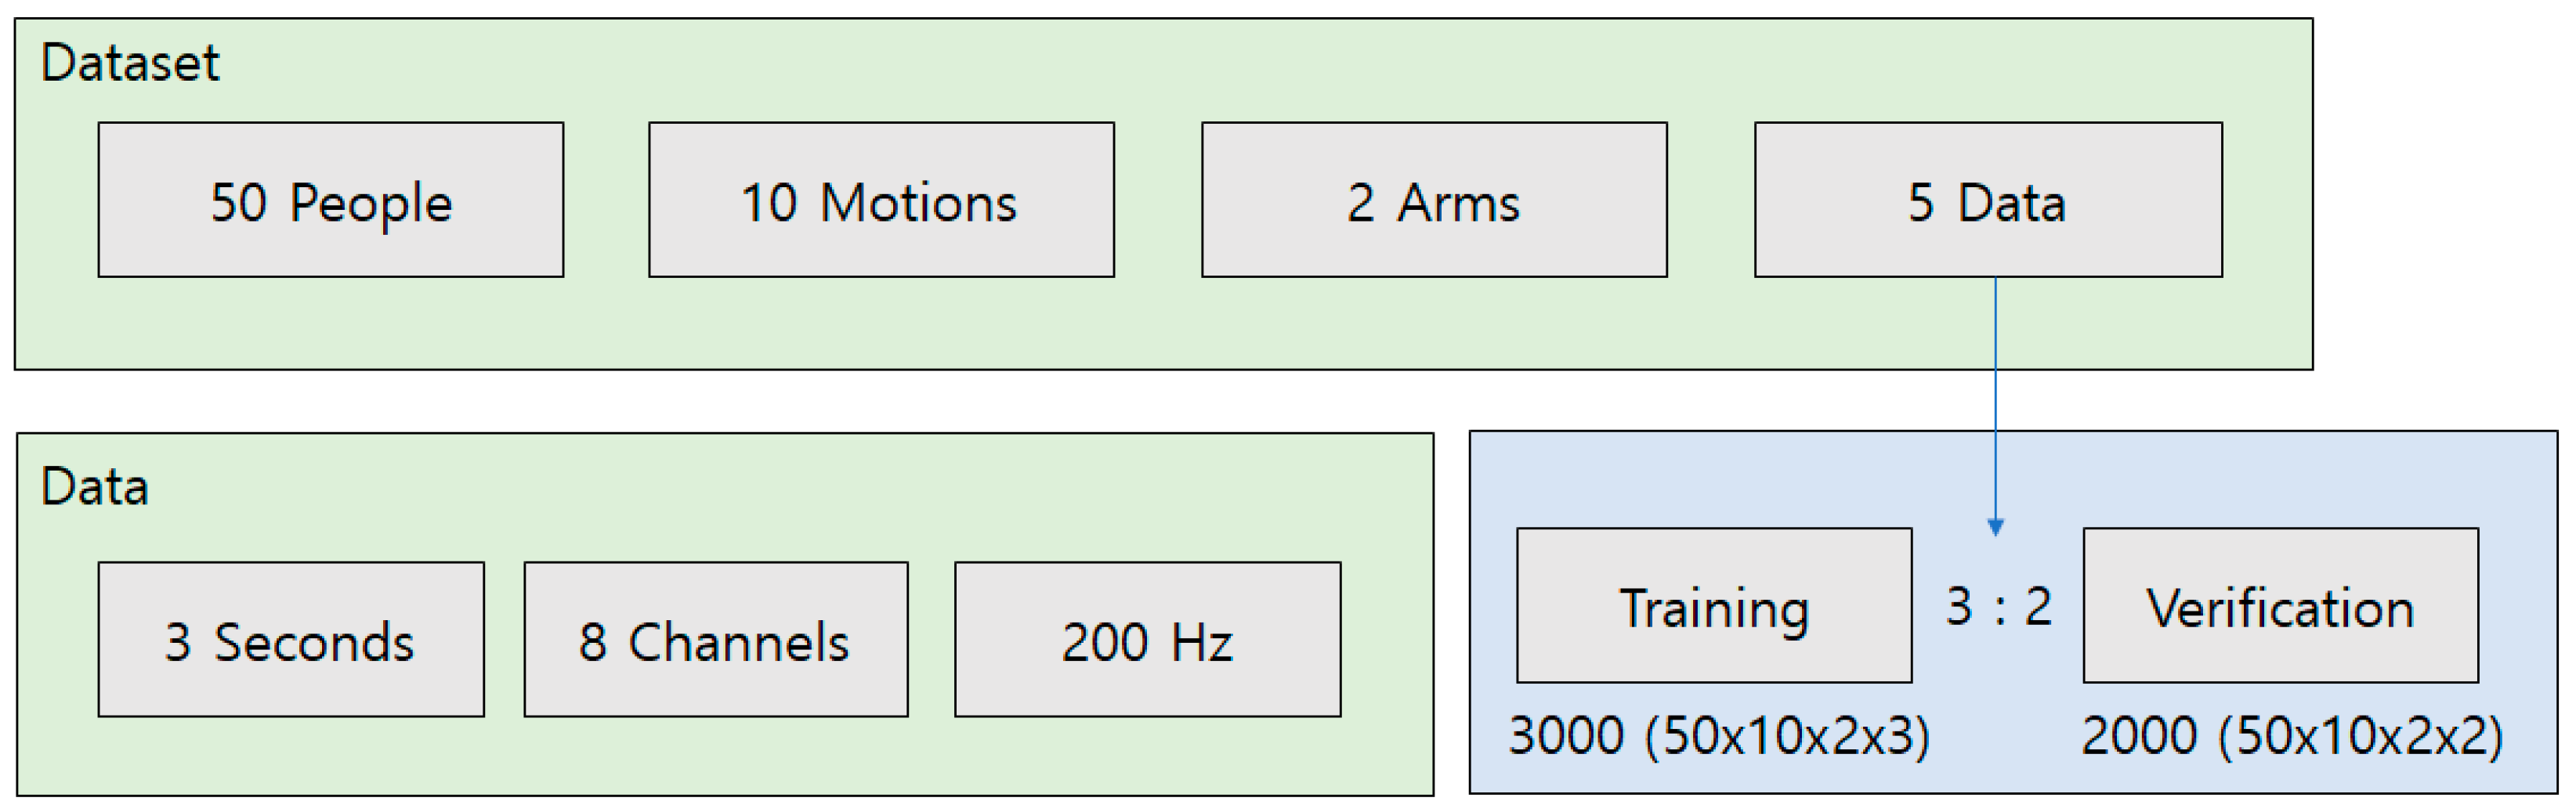
Figure 5 presents a summary of the dataset. A public EMG dataset was used [
35]. These data were acquired using an eight-channel Myo band, and EMG data for 10 motions of both arms were acquired from 50 individuals. Each motion was acquired five times for 3 s at a sampling rate of 200 Hz. The 10 motions were as follows: (1) neutral wrist, (2) pronation, (3) supination, (4) wrist extension, (5) wrist flexion, (6) ulnar deviation, (7) radial deviation, (8) fine pinch, (9) power grip, and (10) hand opening. For each motion, three of the five data points were used for learning and the remaining data were used for verification.
The EMG data were divided into 85 lengths with 12 overlaps allowed, and no further preprocessing was performed. Features were extracted for each divided segment, and the extracted features were connected to sequence data and inputted to the LSTM. The LSTM was trained by extracting the MAV, WL, ZC, SSC, AAC, LD, RMS, DASDV, VAR, MMAV, MMAV2, EMAV, and EWL features for each segment. A Bi-LSTM trained using Adam was applied. Cross-entropy was applied to the loss function, and the initial weight values were set randomly. The initial learning rate was 0.01, and a learning rate decay of 0.2 for every momentum of 0.9 and five epochs was applied. Separate data augmentation was not used, but the learning results were confirmed by varying the minibatch and node sizes.
Table 2 presents the accuracy of the LSTM on the test data with 13 features. The LSTM used every feature considered in this study. As can be observed in
Table 2, having an excessive number of randomly selected features is not beneficial. This table lists the requirements for efficient feature selection. The LSTM was trained using sufficient features; however, overall good performance could not be confirmed.
Similarly, the LSTM was trained while applying one feature at a time instead of extracting all 13 features from the EMG data simultaneously. The learning options were the same, the minibatch size was fixed at 500, the node size was 500, and the number of epochs was 600.
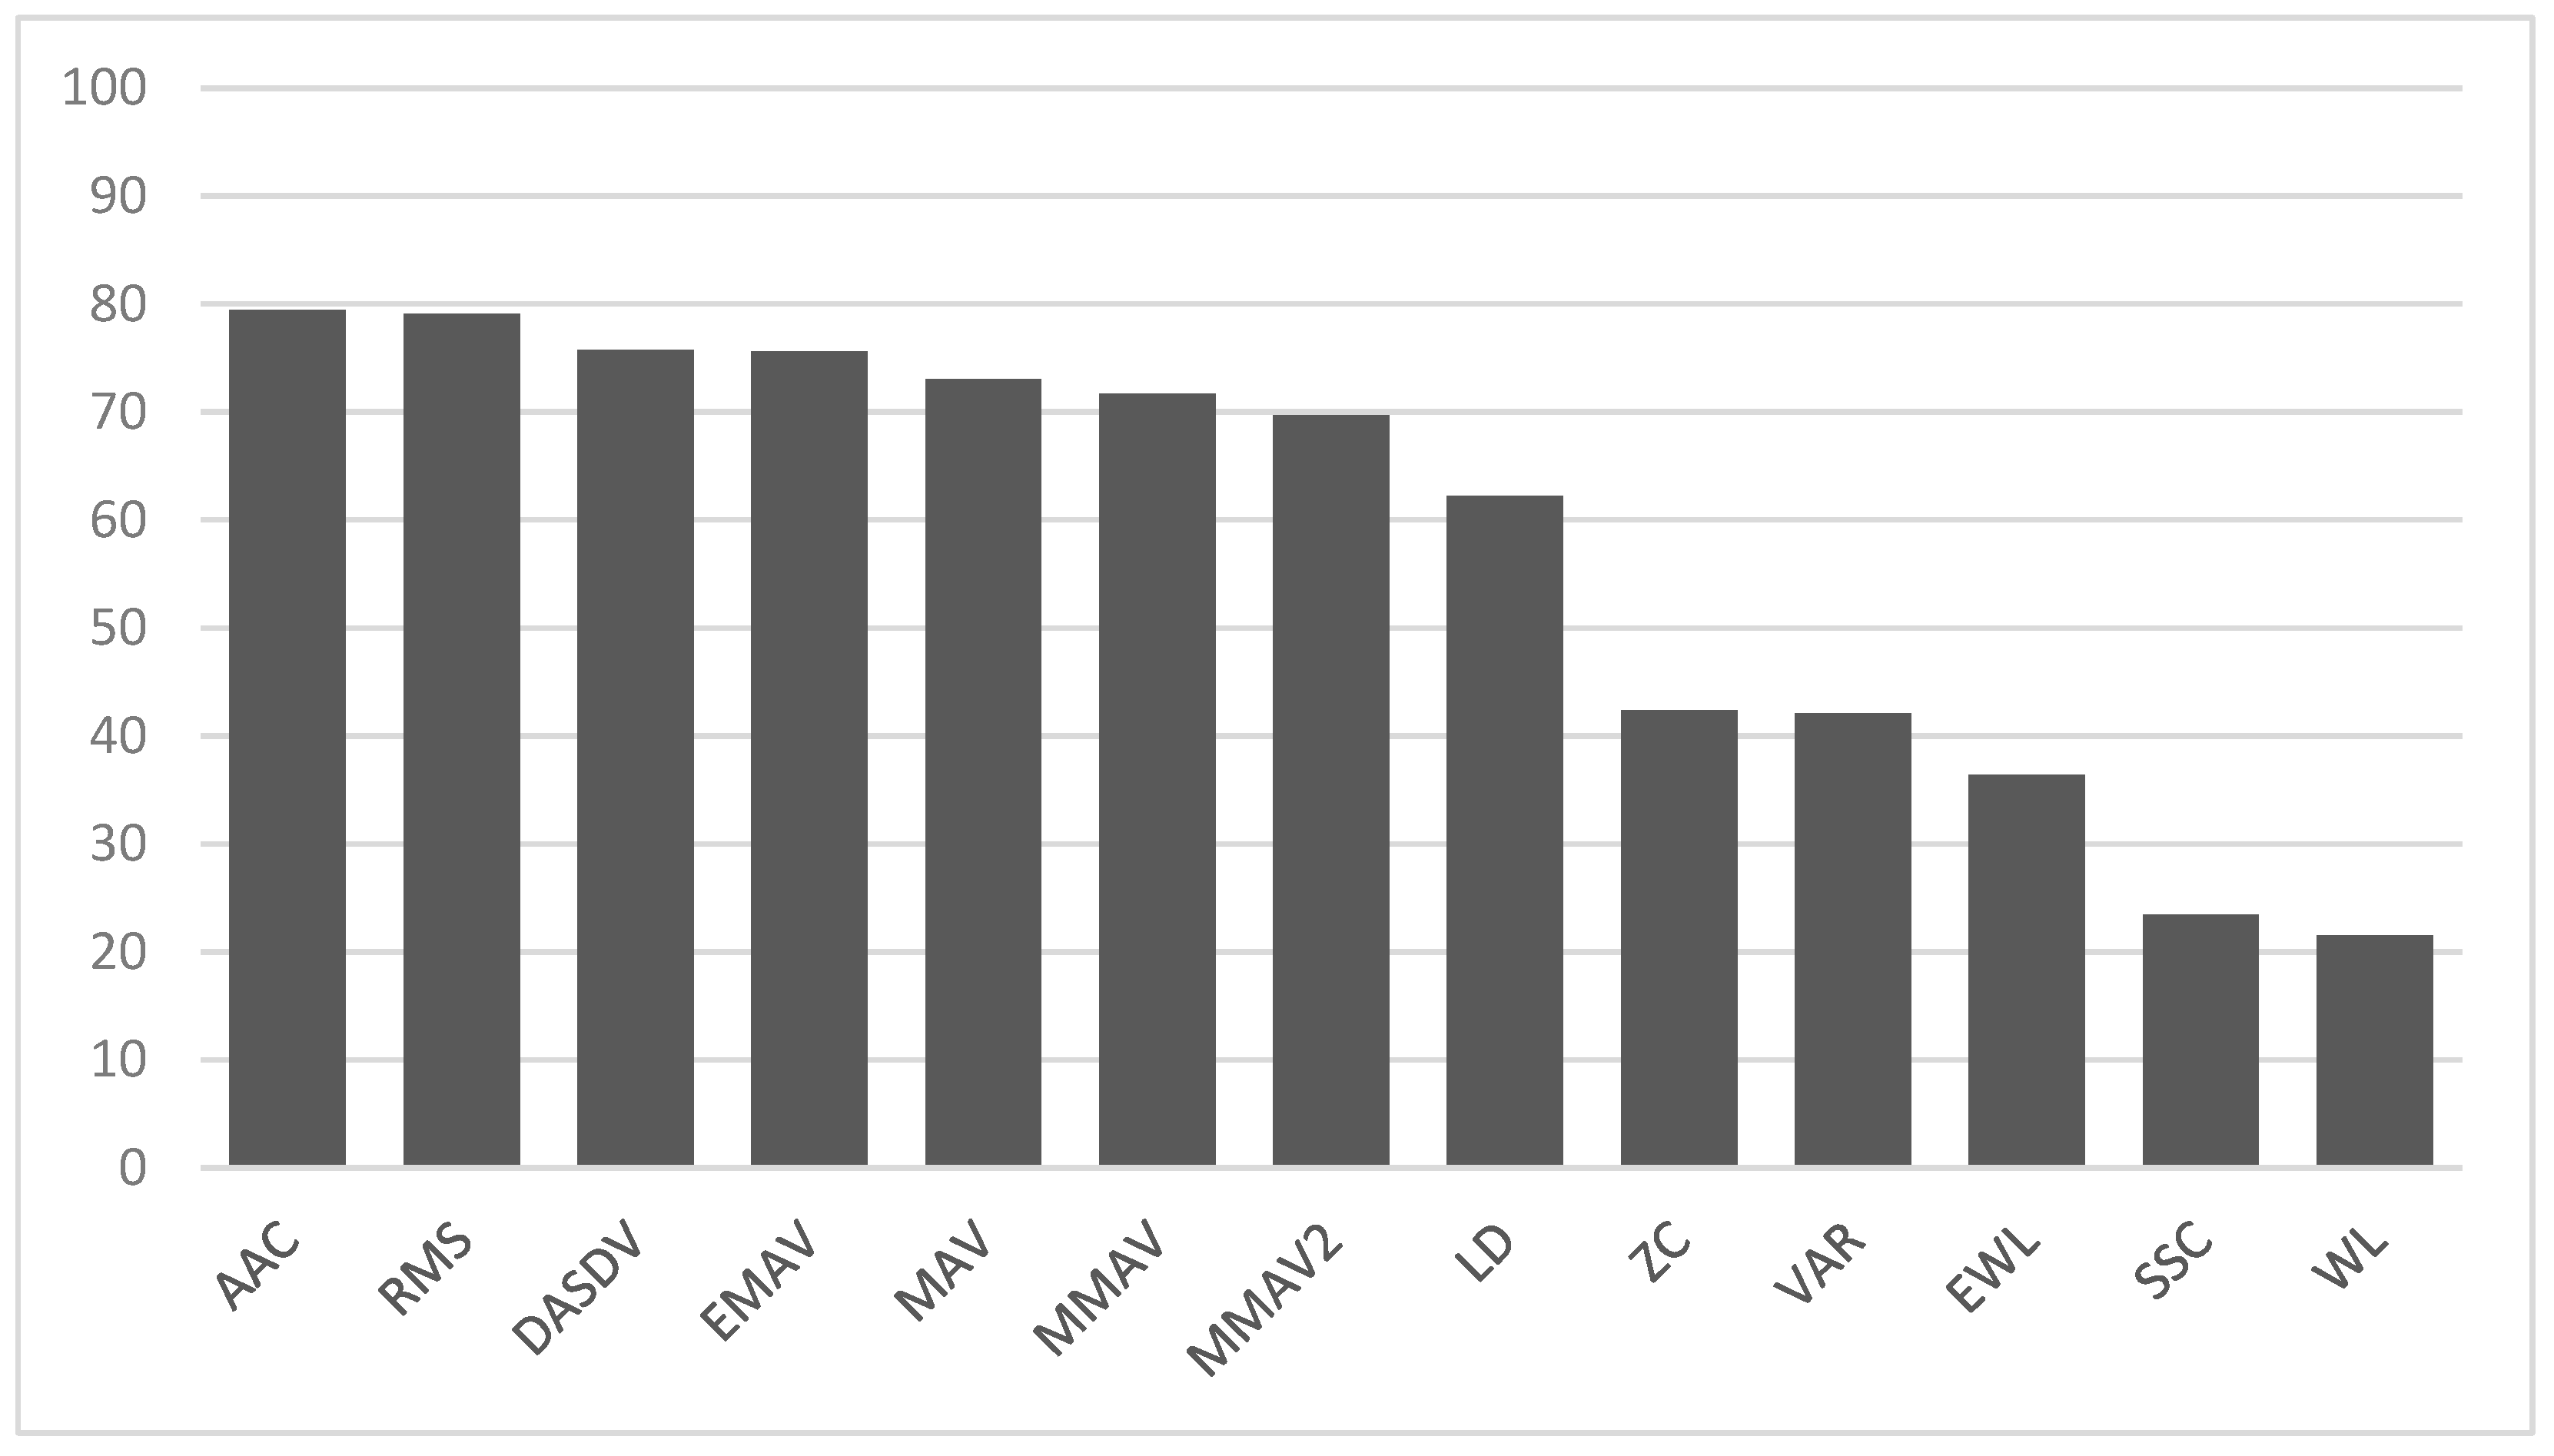
Table 3 presents the accuracy of the LSTM on the test data according to a single feature. The performance of a single feature is critical for the proposed method when selecting a feature set.
Figure 6 shows a bar chart of the accuracy of the LSTM on the test data according to a single feature. The x-axis of the chart indicates the features, and the y-axis indicates the classification accuracy for each feature.
Table 4 presents the top eight performance features ordered by LSTM accuracy. Among the 13 features, only those with a recognition rate of 60% or more in the experiment of a single feature were considered valid, and the features were presented according to the recognition rate.
Table 5 presents a comparison of the computation times for each feature. The times were measured while calculating the features of an 85-length segmental signal. The feature values were computed using a CPU, and computational time was allocated only to the feature calculation process. The time required for the training process was not included in this calculation, as it was considered a constant value given that only the features varied in the comparison. The resulting times were averaged over several experiments. The training time for the Bi-LSTM with a single feature was 245 s, which was computed using the GPU. The training parameters were a minibatch size of 300, 900 hidden units, and 300 epochs.
The performance was observed by training the LSTM by constructing various feature sets among the eight valid features. The training options were the same, the minibatch size was fixed at 500, the node size was 500, and the number of epochs was 600. For the feature set, the number of features was reduced one by one in the order of the low recognition rate, starting with the use of eight features.
Table 6 presents the accuracy of the LSTM on the test data according to the feature set based on the feature order, showing good accuracy. The experimental results clearly indicate that the performance when using all eight valid features and using two valid features was similar, or that the latter was slightly higher.
In the experiment using valid features, the performance when using all eight features and the two features that showed the best performance for single features was similar, or the latter was slightly higher. Because minimizing the number of features in terms of computational load and memory is advantageous, the LSTM was trained using only the AAC and RMS features. The LSTM model was optimized while learning the minibatch size, node size, and epoch in various ways using the same learning options.
Table 7 presents the accuracy of the LSTM on the test data according to the LSTM parameters. In the LSTM using the AAC and RMS features, when the minibatch size was 300 and the node size was 900, the accuracy reached 85.25%, confirming that it was at least 5.75% higher than that of the existing methods, as described in
Table 8.
Table 8 presents a comparison of the accuracy of the LSTM on the test data with that of existing methods. SFS is a well-established method. We also examined its performance in detail and compared it with our method, as presented in
Table 9 and
Table 10.
Table 9 and
Table 10 display a comparison of the accuracy of sequential forward feature selection with feature lengths of 2 and 3, respectively.
Assuming that the training time for a neural network with one feature is A, that with two features is B, that with three features is C, and n is the total number of features, the comparison of the processing times of the methods is described in
Table 11. Assuming that the training time for a neural network, regardless of the number of features, is D, and when n is 13 with a targeted feature length of 3, in the case of SFS, it takes 36D (13D + 12D + 11D) time, whereas, in the case of our approach, it takes 15D (13D + D + D) time, resulting in a reduction of 21 (36–15) training trials. We recommend using the SFS in time-free situations because it is effective in achieving a more accurate system.
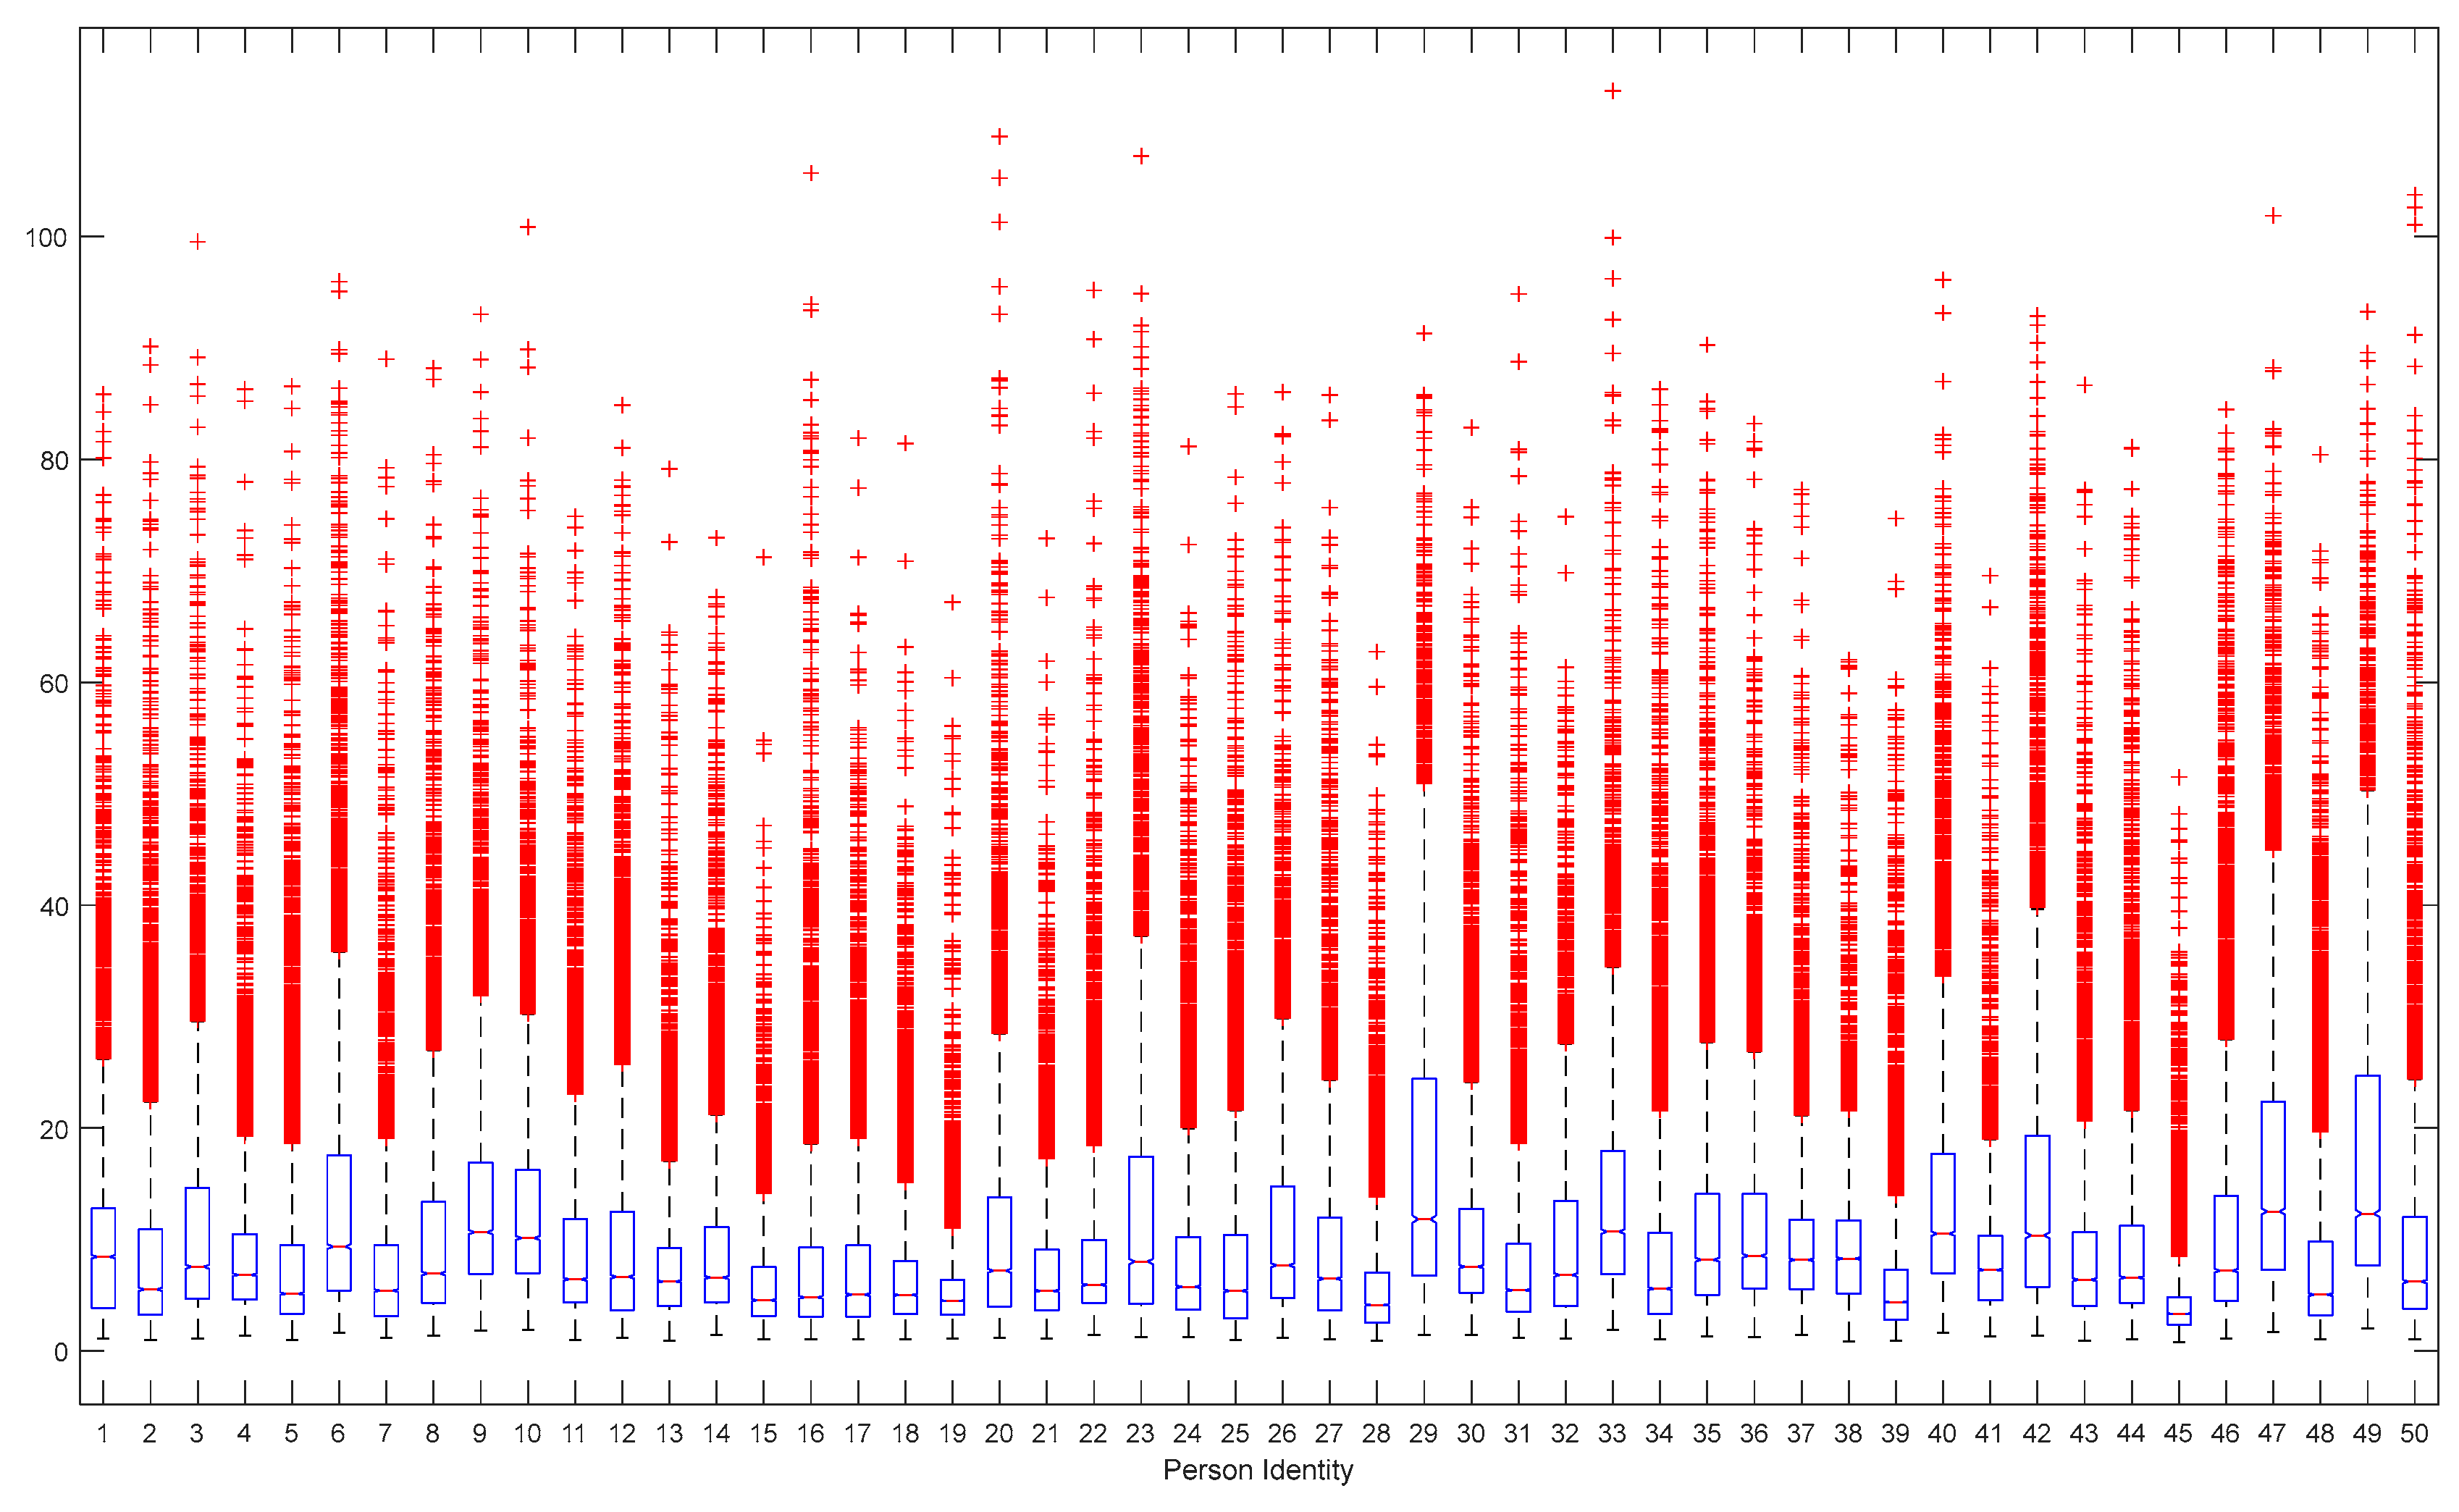
Table 12 and
Figure 7 present the ANOVA of AAC and RMS for the 50 identities. An ANOVA was employed to assess whether there were differences in the means of a set of response data based on the values (levels) of one or more factors. Small
p-values indicated that intergroup variation had a statistically significant effect on individual identification. At the 95% confidence level, intergroup variation had a
p-value < 0.05, indicating that intergroup variation had a statistically significant effect on individual identification. The ANOVA figure shows the data by group. The central mark represents the median and the lower and upper edges of the box represent the 25th and 75th percentiles, respectively. Outliers are displayed individually using the “+” marker symbol.
In the comparison of the accuracy of the LSTM on the test data with existing methods, the accuracy of the existing methods was poorer than that described in the original articles. We used a dataset different from that described in the original paper, which reportedly yielded higher performance. We used the same dataset and method to calculate the accuracy to evaluate the performance of both our method and the existing methods described in this paper. We input the data under the same conditions without preprocessing, except for signal segmentation. We implemented existing methods as closely as possible to the original approach. Feature extraction was performed by referencing the mathematical formulations in the original paper, whereas other common components such as the multilayer perceptron were implemented using open-source libraries.
Table 13 presents a comparison of the biometric accuracy of the LSTM based on different motions. The LSTM was trained with minibatch sizes of 300, 300 epochs, and a node size of 900. The RMS and AAC features were utilized. The motion that exhibited the second highest accuracy was Motion3, which corresponded to pronation. However, the first motion that exhibited the highest accuracy was Motion1, despite representing “wrist in neutral,” which is similar to a line signal. It is assumed that when a single motion is used for person identification, the available data are significantly limited. Consequently, the reliability of the results was relatively low.
Table 14 presents a comparison of the biometric accuracy of the LSTM when the training and verification motions differed. The LSTM was trained with minibatch sizes of 300, 300 epochs, and a node size of 900. The RMS and AAC features were utilized.
To calculate additional metrics, such as precision, recall, F1-scores, false rejection rate (FRR), and false acceptance rate (FAR), the LSTM model with AAC and RMS features was retrained with a minibatch size of 300, 900 hidden units, and 600 epochs. Its accuracy was measured to be 87.00%, and the metrics are listed in
Table 15,
Table 16,
Table 17,
Table 18 and
Table 19.
Another dataset (sEMG) was utilized to evaluate the performance of the proposed method [
36]. These data were acquired using a four-channel Biopac MP36 device, and the EMG data of 10 motions were acquired from 40 individuals. Each motion was acquired five times for 6 s each at a sampling rate of 2000 Hz. The 10 motions were as follows: (1) rest, (2) wrist extension, (3) wrist flexion, (4) wrist ulnar deviation, (5) wrist radial deviation, (6) grip, (7) finger abduction, (8) finger adduction, (9) supination, and (10) pronation. We used the filtered signals from the raw data. The training process from the sEMG dataset was performed in the same manner as in the previous experiment. The Bi-LSTM was trained while applying one feature at a time instead of extracting all 13 features from the EMG data simultaneously. The learning options were the same as those used in the first experiment. The minibatch, node, and epoch sizes were 300, 900, and 300, respectively. The best classification performance was achieved by combining two features, WL and EWL. The accuracy of this combination was 65.25%. We determined that the reason for the lower accuracy compared with that in the previous experiment was the reduced amount of channel data in the signal.


