1. Introduction
Since 21 March 1994, when the “United Nations Framework Convention on Climate Change” was first signed, human society has worked together to maintain atmospheric greenhouse gas concentrations at a stable level at which point danger by human interference with the climate system does not occur [
1]. By June 2016, the number of state parties to the “United Nations Framework Convention on Climate Change” had increased to 197. However, with the further development of human society, carbon emissions soar, climate change intensifies, and the contradiction between emissions and development becomes more acute [
2].
Nowadays, the “Race to Zero” initiative, supported by the United Nations, has brought together more than 4500 nongovernmental actors from 92 economies around the world, working to halve carbon emissions by 2030 and build a healthier, safer, cleaner, and more resilient world for future generations. The maturity and widespread deployment of renewable energy technologies, such as dispersed wind power and distributed photovoltaic power, offer a window of opportunity to mitigate or even resolve the emissions–development paradox [
3]. In general, replacing fossil energy with renewable energy can significantly reduce carbon emissions, thus promoting environmentally friendly sustainable development. As for the electricity system, replacing polluting coal, natural gas, and oil-fired power plants with renewable energy will greatly reduce carbon emissions. However, the large-scale introduction of renewable energy will bring great challenges to the traditional electric power system, including but not limited to relay protection, power flow change, electricity market, etc.
China will increase its intended nationally determined contributions, adopt stronger policies and measures, and strive to achieve “carbon neutrality” by 2060 (with peak emissions before 2030) [
4]. In this context, with the development and maturity of renewable energy technologies, virtual power plants (VPPs) have once again triggered intense discussions in academia and industry. However, the limited capacity of a single renewable energy unit and the significant volatility of its output are obviously troubles in regulation and trading. On the one hand, units with too small a capacity will not be included in the dispatching field of view for control, because the adjustable range and capacity are insignificant for regulation. On the other hand, the new energy unit can indeed aggregate a large capacity and adjustable margin through the polymerization unit, but the safe access of a large number of new energy units will also bring a non-negligible impact to the regulation system.
In general, the objective of a VPP is to network distributed energy resources (DERs), such as wind farms, solar parks, and combined heat and power units, in order to monitor, forecast, optimize, and trade their power. In this way, the fluctuation of renewable energy can be balanced to a certain extent. By aggregating the power of several units, a VPP can deliver the same service and redundancy and subsequently trade on the same electricity markets as large central power plants or industrial consumers. Therefore, a reliable communication network architecture and a robust control system are the basic premise and an important guarantee for realizing VPPs.
The contributions of this paper are summarized below.
The authors put forward an energy digitalization landing paradigm that combines practical application requirements with a best-effort network transmission model. In this paradigm, it is crucial to determine the energy control strategy through the monitoring and prediction of network latency.
Academic studies and industrial practices on the network architecture and control system of the VPP have been reviewed. The authors summarize the communication requirements of the auxiliary services in the VPP.
Considering the actual electric power system, we present a universal VPP network architecture, which combined a local network and backhaul network, including many possible link and backhaul technologies. In addition, aiming at the network architecture, a network latency processing method is proposed based on time series analysis.
We set up a real VPP system to verify the effectiveness of the proposed network latency processing method, and give exciting results.
The remainder of this paper is organized as follows:
Section 2 introduces the VPP practices and studies in industry and academia and summarize four typical service communication requirements. The studies on network state prediction are reviewed in this section too. The universal VPP network architecture that combined a local network and backhaul network is proposed in
Section 3. In
Section 4, a network latency processing method and an application matching method are proposed. Subsequently, some representative results are given to illustrate the effectiveness of the proposed network latency processing method in
Section 5. Finally, the authors give discussions and conclusions in
Section 6.
2. Related Work
For different auxiliary services, the communication network should provide flexible and unified access capabilities, panoramic network resources monitoring capabilities, flexible scheduling capabilities, and real-time adaptation capabilities between VPP businesses and communication links.
2.1. The Practice of VPP
Looking around the world, various countries and regions have actively explored the research and practice of VPPs. Denmark is building a DER interactive VPP system based on biogas and biomass power generation and wind power in Bornholm Island [
5]. AutoGrid is committed to the development of a VPP platform supporting energy storage systems [
6]. The German VPP demonstration project RegModHarz, in which unified standards are used for photovoltaic, wind power, biogas, biomass, and energy storage, has a variety of DER interconnections, through interaction with the regional household users of the energy management system to regulate electricity time and electricity consumption according to price [
7]. At the same time, with the improvement of Chinese policies, various provinces also responded to carry out VPP practice demonstrations [
8,
9,
10]. State Grid Zhejiang Electric Power Company has brought together residential loads, energy storage facilities, and commercial buildings to implement a demand response, which includes 4 million customers’ participation [
11]. State Grid Shanghai Electric Power Company has built a VPP dispatching operation management system, which mainly regulates the air-conditioning system in large commercial buildings [
12].
In addition to renting the wireless public network transmission of telecom operators, the Chinese VPP network also adopts a variety of hybrid networking methods, such as power fiber private network and power wireless private network, while western VPP projects mainly rely on the link of telecom operators [
13]. However, due to the actual situation of VPP implementation, there are many challenges, such as the VPP communication network is difficult to integrate and connect with heterogeneous networks, service requirements are vaguely defined and poorly matched with network performance indicators, and the lack of flexibility of a multimode business computing network integrated a cloud edge collaboration framework.
2.2. The Communication Requirements of VPP
VPP services are characterized by a large number of short-term services, a high concurrency rate, wide cross-regional services, and large load fluctuations [
14]. The academic circles mainly summarize the following four typical operations of VPPs for analysis.
Frequency Regulation Service
A VPP can control the flexible DERs of the access system, so that its overall external characteristics track the automatic generation control signals sent by the grid to provide frequency regulation services [
15]. The traditional frequency regulation service can be subdivided into primary frequency regulation service and secondary frequency regulation service according to the participating objects and methods. Due to the differences in the types of flexible DERs aggregated, the overall external characteristics of a VPP can be manifested as power supply or load. Therefore, a VPP’s participation in frequency regulation services can bring more possibilities. In addition, the energy storage resources in a VPP, which have remarkable response characteristics, are an important unit involved in the frequency regulation of the power grid. Due to the increasing penetration rate of distributed renewable energy in the power system, the combination of photovoltaic, wind power, and energy storage forms a joint system to participate in the frequency regulation of the power system, which can effectively improve the response speed and adjustment accuracy.
Peak Regulation Service
The mature power market generally realizes peak regulation through a real-time balance or market mechanism. As the proportion of new energy generation continues to rise in China, the compensation mode and intensity of an auxiliary service plan can no longer meet the operational needs of the power grid. In 2006, China proposed a peaking regulation service as a new auxiliary service product. By coordinating the accessing flexible DERs in an electric power system, a VPP can make its external characteristics follow the changes of the power supply of the power system. A VPP can even be used as a supplement to the external power supply to balance the power system to ensure safety and stability.
Demand Response Service
Demand response refers to the fact that demand-side users in the power market participate in the power market or the power system regulation by changing the power consumption pattern with normal load according to the price or incentive. Demand-side users mainly cover users in the fields of industry, construction, transportation, etc. The representative load types include industrial assembly line workshops, building air conditioning loads, transportation shore power, public transportation, and electric vehicles. The VPP can participate in the demand response as an independent individual, and settle to the end user and load according to a certain standard.
Electricity Market Service
Electricity market trading is the general term of electricity trading activities between power generation enterprises and power selling companies or large power users through market-oriented ways. A VPP can participate in the electricity trading in the electricity market as an independent individual. The information sources of electricity market service transmission include energy resources, environmental meteorology, energy production, energy transmission, energy distribution, load demand, real-time electricity price, and other information [
16]. The power service systems involved include an electricity consumption information collection system, distribution automation system, and so on.
The interaction and operation between a VPP and a power system is based on a reliable and secure communication network. Different VPP services have different requirements on network service quality. The specific service quality can be expressed in the form of quality of service (QoS) collection. When the network quality is poor, it may lead to problems such as the decrease in DER online rate and the failure of VPP control commands. Large-scale network congestion will cause the interaction between the VPP and the power system to fail, which may lead to serious power system security risks.
Kolenc et al. evaluated the performance of a communication system in which a VPP participates in auxiliary services based on traffic data captured during real-time VPP operation [
17]. Cao et al. analyzed the effects of communication latency, link noise, and topology changes on VPP system operation and economic benefits [
18]. Kolenc et al. proposed a method to minimize the probability of communication failures by monitoring the communication QoS parameters (latency, packet loss, bandwidth, etc.) during VPP operation [
19].
However, the communication requirements of different VPP services vary greatly, and the types of VPP service terminals (smart sensors, actuators, meters, power line communication devices, etc.) and access methods (230 MHz wireless, power line communication, Bluetooth, B5G/6G, etc.) also differ greatly. It is necessary to accurately monitor the network status to ensure the effective development of various auxiliary services.
2.3. Network Status Prediction
There are many studies on network state prediction, such as traffic classification and latency prediction. Network traffic classification techniques include a port-based approach, deep packet inspection, and machine learning. A quality of a service-aware traffic classification system is proposed by leveraging semisupervised learning [
20]. A cost-sensitive learning method is proposed to detect elephant flows [
21]. Atlas, a mobile application classification, is proposed to identify mobile applications [
22]. As for network latency, estimating a subset of network node pairs latencies by probing the round-trip times of an other subset of network node pairs is a widely used method. Matrix completion [
23] and tensor completion [
24] are two popular mechanisms to predict the latencies between a subset of network node pairs.
However, the above research works on network state prediction are based on the prior knowledge of network topology, or directly on the architecture of a soft-define network. In practice application, we can usually only obtain the information of the source node and the destination node. Round-trip times between source and destination nodes may also be included for a period of time. We know nothing about the routing information, routing policy, and traffic state between the source and destination nodes. All these bring great challenges to the estimation and prediction of network latency.
Fortunately, time series analysis is often used to solve such problems. A time series analysis method is proposed to predict network throughput, which is important in improving the network protocols in terms of latency, energy, etc. [
25]. Elsherbiny et al. compares the network throughput prediction performance between machine learning models and time series forecasting [
26]. Time series analysis is much simpler and easier with a certain performance. For the data with a single source and simple structure, this method is very suitable for processing and analysis. At the same time, due to the consideration of real-time application requirements, time series analysis has become the first choice.
3. System Architecture
3.1. The Network Architecture of VPP
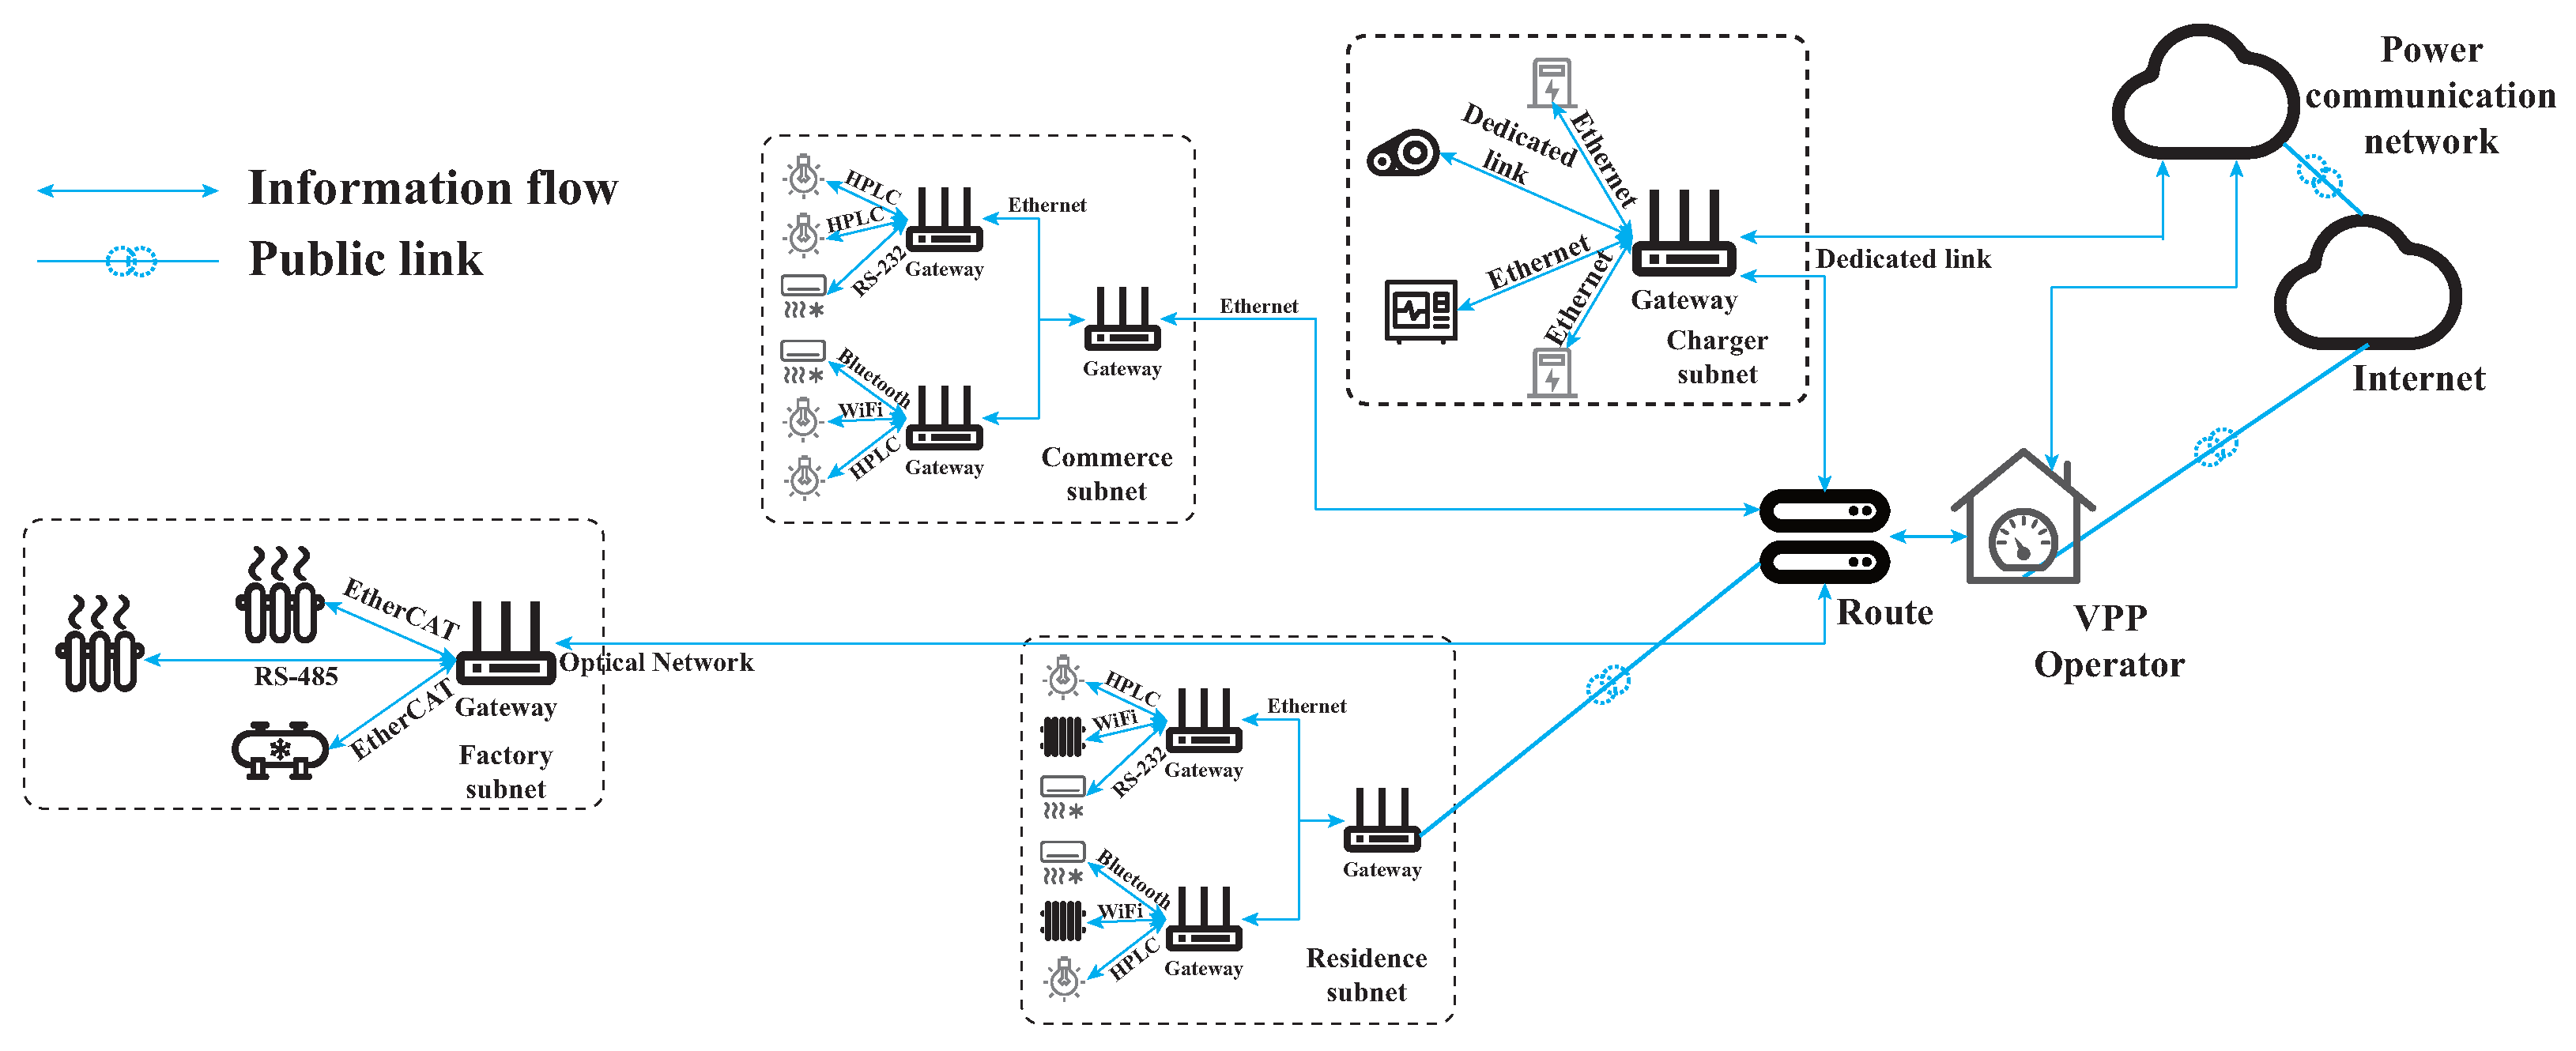
Based on VPP deployment experience, we propose a VPP network architecture as shown in
Figure 1. It includes a flexible resource aggregation local network with a secure access gateway as the core and a backhaul network between the gateway and VPP monitoring and dispatching platform.
The local network is responsible for the efficient, flexible, and inexpensive access to various flexible DERs to participate in VPP monitoring and scheduling. The gateway can not only provide RS-232/485, Wi-Fi, power line communication, Bluetooth, and other access interfaces to downward flexible DER, but also be aggregated into a larger DER via Ethernet or optical fiber upward. At the same time, the cascade of multilevel gateways can also aggregate more flexible DERs on a larger scale. The gateway can also support security functions, such as flexible resource secure access and data privacy protection. The backhaul network is mainly responsible for the link between the gateway and the VPP monitoring and scheduling platform. At present, a VPP mainly uses carrier-specific lines or 5G to provide communication services between the gateway and the platform.
In the actual VPP construction, the local network is usually constructed by the network infrastructure transformation of all units of flexible DERs, so the network topology, link bandwidth, reliability, and timely extension are relatively easy to determine. For the backhaul network, it may pass through the carrier network, and the carrier policy and network topology are unknown. Therefore, as a VPP operator, the difficulty of monitoring and scheduling is usually focused on this.
3.2. The Network Latency Acquisition Mechanism
In this paper, the backhaul network is regarded as a one-hop virtual link. The network latency is monitored through the cooperation between the VPP monitoring and scheduling platform and the gateway by a delay probe. Based on the analysis and processing of the historical network latency data, the VPP services supported by the active DERs can be evaluated to improve the monitoring and scheduling availability.
To obtain network latency, we need to synchronize the time between the gateway and the VPP monitoring and scheduling platform. In our research, we regard the carrier network as a virtual link and use the VPP monitoring and scheduling platform as the clock source to synchronize the time of each accessing gateway. When constructing the VPP, an NTP time server is configured on the platform to run the ntpd service, which is a network time protocol service in a Linux system. The VPP monitoring and scheduling platform will actively calibrate the time with the public network. When the gateway is connected, configure the ntp client to periodically send time-matching requests to the platform.
In order to obtain real network latency, we design a channel-associated delay probe based on the MQTT protocol, which also encapsulates the practice VPP service. The VPP platform initiates network latency measurement tasks and collects the measurement results of each link of the gateway. A detailed flowchart of the measurement task is shown in
Figure 2. The VPP platform is responsible for assembling messages with time stamps
and pushing them to the broker-agreed topic
. Each gateway consumes messages from the agreed topic
, records the message arrival time
, and calculates the downlink communication latency
. Then, each gateway sends a response message to the topic
with
and sends time
. The VPP platform consumes upstream packets from the topic
, and records the arrival time
. At the same time, the VPP platform parses packets to obtain
and
, and calculates the uplink latency
. Finally, the master program writes the measured values of the uplink and downlink latency
and
to the database, and the network latency measurement task is completed. The measurement tasks will be performed according to a predetermined configuration, which may be event-triggered or periodic depending on the needs of the VPP services.
4. Data-Driven Network Latency Processing
Based on the proposed network architecture, we deployed a real VPP system in Shanghai, China, as shown in
Figure 3. The VPP system manages the air-conditioning load of ten office buildings distributed in the central city of Shanghai and aggregates them into a whole to participate in the power system interaction. Each building uses a gateway cascade to access the air-conditioning load inside the building, and the boundary gateway uses a public network broadband for backhaul. The local network in this project has been carefully designed, and the network traffic and network resources have been calculated in detail. Therefore, the local network has very high reliability and can meet the needs of various VPP services. The backhaul network is the bottleneck for DERs to participate in a VPP service in this project.
Fortunately, we use the above network latency acquisition mechanism to obtain the latency data of the network. In order to facilitate the evaluation and prediction of network latency, we set the second cycle to obtain the network latency data denoted as
Figure 4 shows a typical backhaul network latency. It shows the backhaul network latency at a continuous 24 h with a sample interval of 1 s, and we will zoom in to show 3 min of it. By observing the data, it can be found that there will be a period of discontinuity after a period of time interval in the sampling time dimension, and the network latency measurement may also be negative in the latency dimension. This is because of the synchronization error and the implementation of the delay probe; the data obtained in the actual acquisition process are not ideal. At the same time, we also find that the network latency may have short-term fluctuations, and from a larger time scale, we can find that when the network environment becomes bad, the network latency also has a certain trend. Our goal is to anticipate this trend and make the DERs in the VPP system able to participate in the interaction with a power system at a high response rate.
4.1. Statistical Data Analysis
In order to eliminate the nonideal factors of the network latency data collected by the real system, we first cleaned the data. We removed the negative points in the data and sliced out the continuous collection interval.
Due to the fact that the range of the collected network latency was very large, we adopted three times the median absolute deviation to screen the normal network latency data until the outlier was less than 1% of the number of statistical samples. We define median absolute deviation as
where
means to take the median.
is the inverse error function. Therefore, the normal latency satisfied that
It shows the distribution of the network delay under normal conditions in
Figure 5. It is easy to find that the median uplink and downlink latencies of the network are about 17 and 41 ms, respectively. The uplink and downlink latency ranges are 14–21 ms and 35–55 ms, respectively. This value refers to the intrinsic latency of the network, which is a key indicator to indicate DERs to participate in a certain auxiliary service. For simplicity, we represent the continuous network experiment data after processing as
At the same time, due to the fluctuation of the network latency, the network delay needs to be closely monitored and accurately predicted in order to better allow the VPP to interact with the electric power system.
4.2. Data Smoothing Preprocessing
As shown in
Figure 4, we found that the latency of the network fluctuated dramatically, even under normal traffic loads for the vast majority of the time. It brings great difficulties to the estimation and prediction of network latency. Therefore, we try to use some methods to smooth the data so that we can proceed to the next step. Traditional windowing smoothing technology cannot handle network latency well, so we combined with the application requirements, the upper limit of the latency that determines the type of auxiliary service that the VPP can participate in, and use the upper envelope of the network latency to smooth the data. As shown in
Figure 6, we intercepted the continuously effective part of the acquired network latency and filtered the upper network latency envelope of the uplink and downlink, respectively. In this figure, the results of envelope filtering for uplink and downlink latency data are obtained by using the Hilbert transform [
27]. From the partial displays, the envelope can capture the abnormal location of the network latency well, while ignoring the fluctuation of the network under normal conditions in order to predict the network latency. After taking the upper envelope, the delay of the network can be expressed as
4.3. Network Latency Processing
We treat the collected network latency as a time series to estimate and predict network latency. To facilitate prediction, we first need to guarantee the wide-sense stationary property of the time series by autocorrelation coefficient (ACC) and partial autocorrelation coefficient (PACC). The ACC expresses the linear correlation of data among adjacent observations of a random process, which can be estimated from the observed time series by the sample as
The PACC is the correlation between
and
conditioned on
. Given the sample ACC, it can be calculated iteratively by
with
, and
The standard error of the sample PACC is approximated by
Hence,
can be used as critical limits on the sample PACC to test the hypothesis of a white noise process.
For a process with the time-varying mean, a stochastic trend model can be applied. The stochastic trend model is constructed by differencing the random process for
times, i.e.,
where
B is the backshift operator such that
.
For a process with the time-varying variance, the Box–Cox power transformation is applied to stabilize the variance by
where
is the geometric mean of
, i.e.,
and
is a parameter determining the transformation. The criterion for selecting
for variance-stabilizing transformation is to minimize the residual sum of squares
An
model of the nonstationary random process
D is expressed as
where
are the autoregressive coefficients,
are the moving average coefficients, and
is a white Gaussian process with variance
.
is referred to as the deterministic trend term when
. The deterministic trend term can be omitted unless the sample mean of the transformed time series
as in Equation (
11) is significantly larger than its standard error
. The standard error can be approximated by
where
is the sample variance of
Z and
are the first
k significant sample ACC of
Z.
We treat the smoothed network latency data as time series for processing and forecasting. First, we set the range of the training time series as
and the following range
is time series that needs to be predicted. In order to adapt an autoregressive integrated moving average (ARIMA) model, we need to carry out differential processing on training time series so that the processed sequences meet the requirements of stationary and nonwhite noise. Generally, first-order difference can ensure the stationarity of training data. Otherwise, high-order differential processing may be required. Record the order of the difference, denoted as
. The parameters
p and
q of the ARIMA model are determined by the Akaike information criterion and the Bayesian information criterion, respectively. Finally, we construct the
model for the training time series
. We use this
model to predict the subsequent
M network latency
. As shown in
Figure 7, we used the
model with
and
to make predictions on the network latency time series. The results show that the prediction accuracy of the model is very high, and the length of a 95% confidence interval is kept within 5 ms.
6. Discussions and Conclusions
In this paper, we propose a new industrial digitalization landing paradigm that combines the best effort transmission model of a network with practical industrial application. The control strategy of industrial applications is updated in real time by estimating and predicting the network state to meet the needs of industrial applications. First, we have summarized the communication requirements of a VPP participating in auxiliary services, and proposed a general VPP network architecture, which divides the network into local networks for a flexible and cheap access to massive DERs and backhaul networks to ensure the effectiveness and security of DERs’ monitoring and scheduling. Then, aiming at the contradiction between the inability of a backhaul network to guarantee transmission effectiveness across the public network and the strict requirements of a VPP to participate in auxiliary service, we have proposed a method to obtain a link delay by using a delay probe. Based on the analysis and processing of the realistic data, the network latency is divided into a normal and warning range, which can effectively guide the DERs of the VPP to participate in the interaction of auxiliary services. The proposed network latency processing method for predicting network latency has a low overall negative report rate, which is 1.4% for network latency warning, which can strongly support the VPP to participate in auxiliary service operation. Obviously, the network latency obtained by our prediction method can improve the robustness of industrial control strategies in a targeted manner.
In the future, we will carry out further research on the accuracy of latency data acquisition, the accuracy of network latency prediction in a large-scale time interval. For the accuracy of link delay acquisition, network node cross-domain time synchronization and cross-domain network latency measurement are important directions, and introducing a satellite into a network node time synchronization system should be an effective solution. For the accuracy and long-term performance of network latency prediction, it will become one of our key directions to consider the introduction of an artificial intelligence processing method to capture cyclical fluctuations of network latency and network operator policies. In addition, a solution for the network latency tensor prediction of multinode networks will be considered in our future research. This method can reveal the intrinsic properties of network latency when crossing the public network to a certain extent.


